

Submitted:
11 November 2026
Posted:
12 November 2026
You are already at the latest version
Abstract
Based on the P-T-X-Y diagram of ternary B-O-H system fulfilled by a graphical thermodynamic method the conditions of preparing the boron oxide (III) with controlled water content have been determined. Using the method of the direct determination of intercalated water in high-purity boron oxide a comparative study of the residual intercalated water and OH-groups content in a commercial product and fabricated high-purity boron oxide have been conducted. It has been shown that under traditional high-purity boron oxide synthesis conditions, a clear correlation between the residual intercalated water content and the OH groups content is impossible because of the need to control more than three intensive thermodynamic parameters at synthesis.
Keywords:
boron oxide
; high-purity substances
; determination of trace amounts of water
; OH-groups deter-mination
1. Introduction
The rapid development of photonics materials such as GaAs, GaP, and InP places new demands on the quality of single-crystal materials, including their chemical purity. While 7N materials were considered acceptable for crystal growth just 10 years ago, chemical purity requirements have now increased to 8N-9N. This, in turn, has led to higher requirements for the chemical purity of auxiliary materials.
Besides the chemical purity, additional requirements are imposed on the amorphous ingots of high-purity B2O3 which is used as a flux in melt growth technologies of GaAs [1], GaP [2], and InP [3] semiconductor crystals. Numerous studies of GaAs single crystal growth process by both the LEC (Liquid Encapsulated Czochralski) and VGF (Vertical Gradient Freezing) methods have established that for effective mass transfer between the vapor-gas environment, into which the active gas can be introduced for doping GaAs crystals, it is necessary to use water vapor [4,5,6,7,8]. This has led to the requirement for high-purity B2O3 with a controlled residual water content. Additional requirements are imposed on the preparation for a controlled residual water content of 100-500 ppm ((1-5)×10-2 wt%).
Considering that the mass of the B2O3 flux is 100 times less than the mass of the growing GaAs crystal, the chemical purity of 5N for B2O3 was sufficient for the fabrication of GaAs crystals with a purity of 7N.
The leading international manufacturer the CMK, s.r.o. company [9], offers amorphous B2O3 ingots with chemical purity of 5N, 5N5 (6 impurities are determined according to the CMK certificate) as a flux material with water content of three grades: 100 ppm, 300 ppm, and 500 ppm with a relative deviation from the nominal concentration of 50 ppm.
The new reality of 8-9N crystals needs B2O3 with purity no less than 6N.
A separate issue is the number of impurities that need to be controlled.
The purity of the starting batch of AIIIBV compounds for crystal growth is typically controlled by 32 impurity elements. It is logical to assume that the chemical purity of the B2O3 flux should be controlled by the same number of impurity elements.
This means that modern GaAs, GaP, and InP single-crystal technologies require B2O3 as a flux material with a content of 32 impurity elements no higher than 6N and a controlled residual water content below 500 ppm (5×10⁻² wt%).
In addition to using high-purity boron (III) oxide as a flux in III–V group crystal growth technologies, this material is widely used as a starting material in the synthesis and growth of promising nonlinear optical crystals such as lithium triborate (LBO) [10], strontium triborate (SBO) [11], and beta-barium borate (BBO) [12], as well as for the production of borate glasses [13,14,15]. All these applications require the preparation of at least 6N B2O3 preparation. Since residual OH groups reduce the transparency of crystals and their laser damage threshold, controlling the water content in these crystals is also a pressing issue.
Developing the fundamental principles for producing high-purity B2O3 with controlled residual water content was the primary goal of this study.
The easiest way to produce B2O3 is the dehydration of H3BO3 [16] through the inermediat metaboric acid by the reaction (1)
Despite the apparent simplicity of the process, a great deal of research has been devoted to finding conditions for producing B2O3 with a controlled residual water content.
In this research, we have sought to uncover the fundamental issues related to the thermodynamic aspects of the process of synthesizing B2O3 with a controlled residual water content.
2. Thermodynamic Basis
Phase equilibrium diagrams are a powerful tool for identifying process conditions for the synthesis of chemical compounds with controlled nonstoichiometric compositions within the homogeneity region [17,18]. The graphical thermodynamic method allows for the construction of a semi-quantitative P-T-X-Y diagram and corresponding isothermal cross sections (T-X-Y projections), which helps solve complex problems of determining the synthesis conditions for single-phase compounds [19]. Unfortunately, the attempts to plot a full T-x diagrams in one scale for the X-axis misses the opportunity of precise analysis of phase equilibria for chemical compounds with homogeneity ranges less then1 mol.%.
2.1. Phase Diagrams in Ternary B-O-H System
To analyze phase equilibria in the ternary H-O-B system, we used a graphical thermodynamics method for constructing P-T-X-Y diagrams [20]. A distinctive feature of the developed approach is that the isothermal sections of the T-X-Y projections show the homogeneity regions of the chemical compounds’ phases on a non-uniform scale (Figure 2). Particular attention was paid to the solubility limits of the solid phases, which were plotted on an enlarged scale, to issues of phase formation, including polymorphic transformations of the phases of binary and ternary chemical compounds.
The analysis begins at the maximum temperature 2400 K, when the system is completely molten. This is followed by a sequential analysis of the isothermal sections as the temperature decreases and new non-, mono-, bi-, and trivariant equilibria emerge, taking into account the Gibbs phase rule and the conditions for thermodynamic phase stability down to 210 K.
2.1.1. Binary H-O System
The binary H–O system is one of the most widespread and, at the same time, controversial systems. A large amount of literature is devoted to P–T diagrams of equilibrium and metastable phases of ice (Figure 1) [21,22], but T–X cross section of H-O systems have received insufficient attention.
Moreover, the basic part of the P-T diagram of water at the triple point (Figure 2), presented in many textbooks, actually contradicts the thermodynamics laws, since the system is binary.
Figure 2.
Scheme of a fragment of the P–T diagram of the binary H–O system for the H2O phase: (a) presented in literature [23,24,25]; (b) thermodynamically correct scheme.
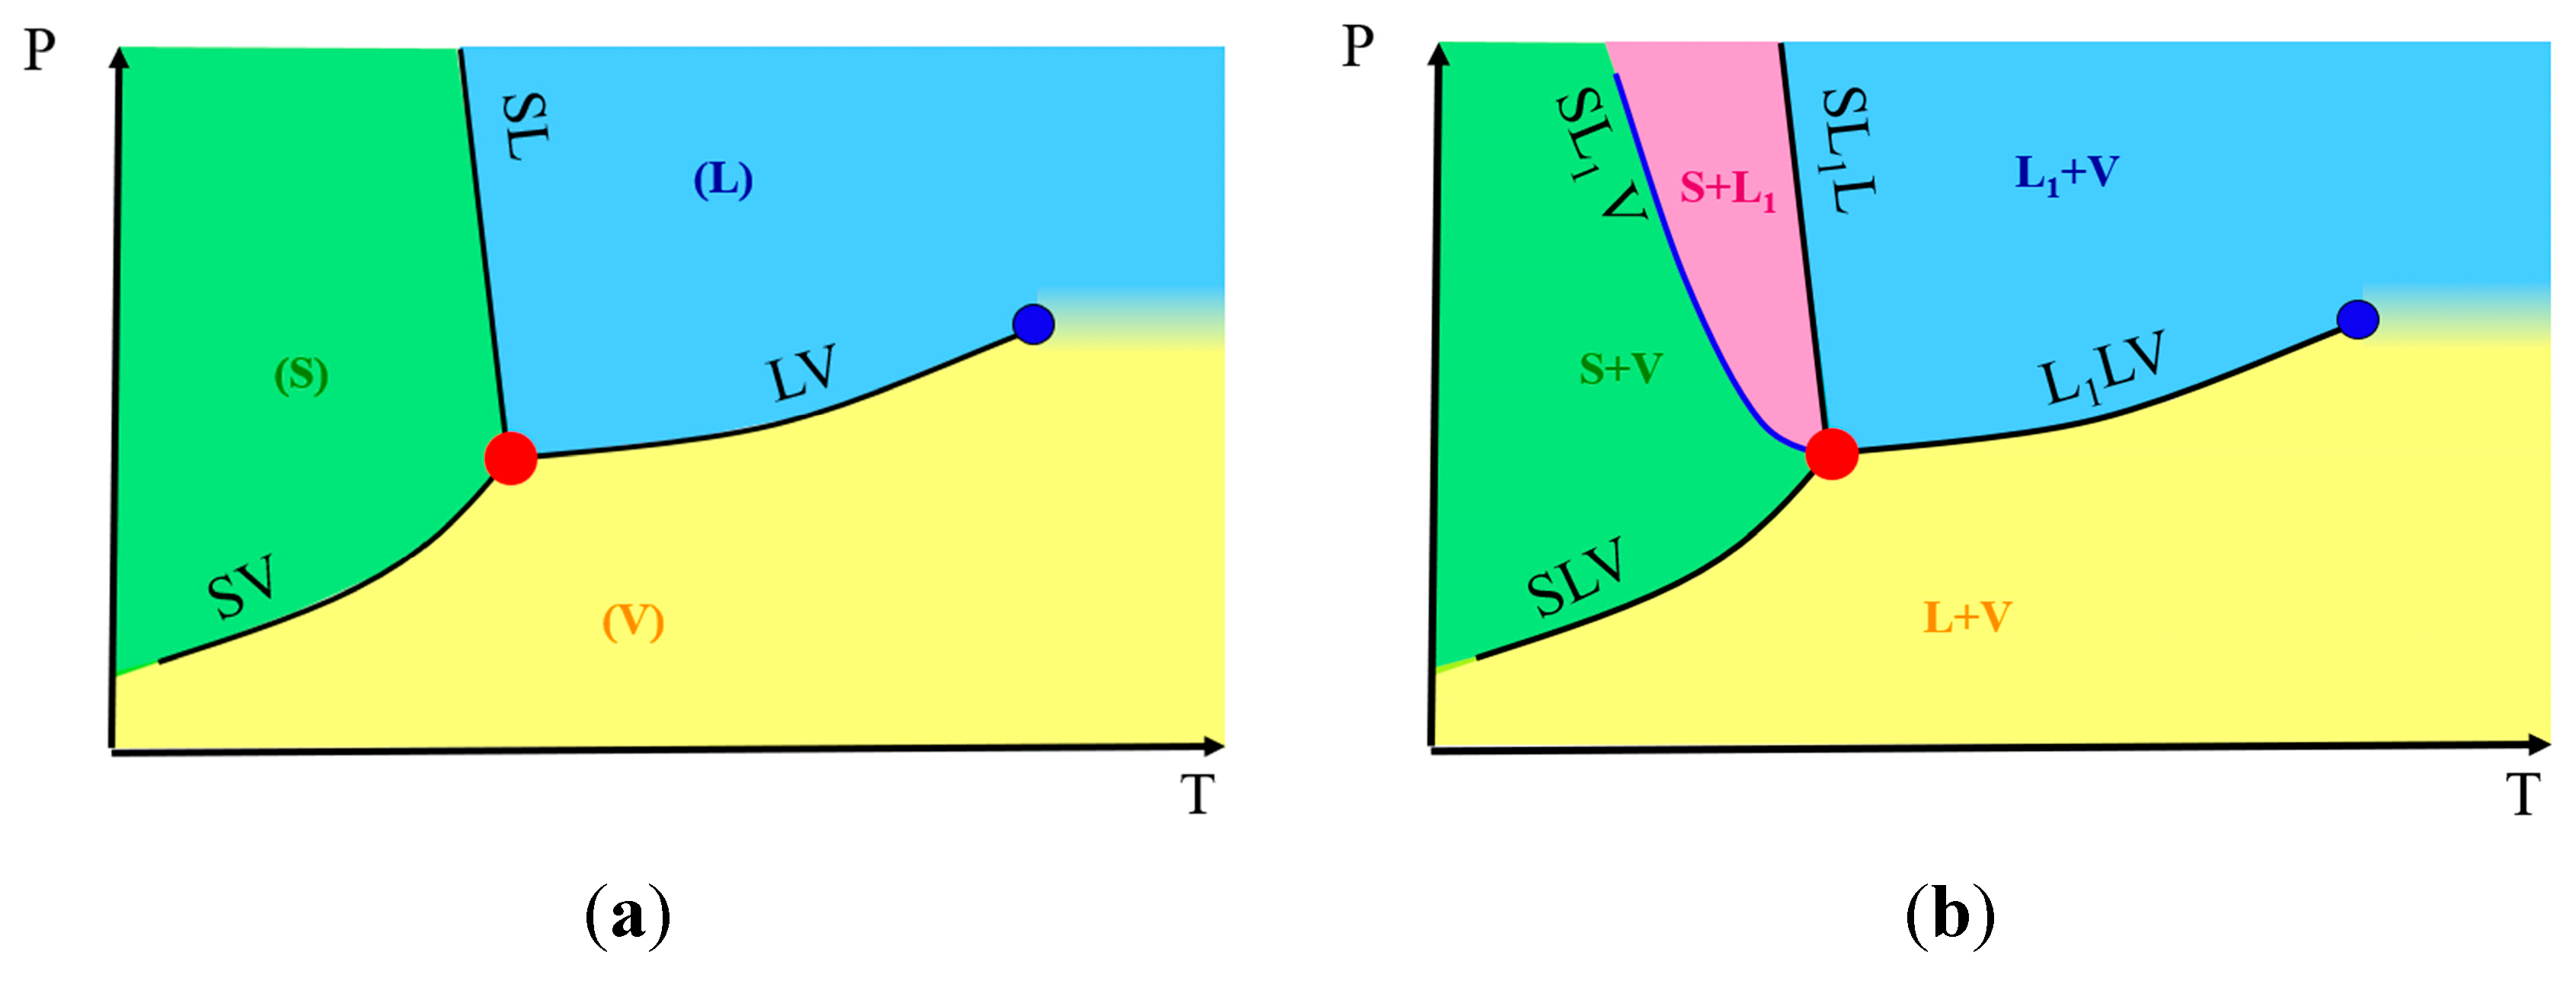
When constructing the P–T–X diagram of the binary H–O system, the following solid phases must be taken into account: H2O, H2O2, and H2O2·2H2O. It is also necessary to consider the various polymorphic phases of solid water, which is commonly called an ice (Figure 1). For H-O binary system at a non-variant equilibrium according to the Gibbs phase rule 4 phases must coexist. Thus, the common presented triple point of water (Figure 1, a) is not correct because H2O is a chemical compound in the binary H-O system and in accordance with the Gibbs phase rule besides vapor (V), liquid water (L), and solid water (S - the ice) there must coexist one more phase at nonvariant equilibrium. And the triple point must be presented as a quadruple point. Let’s assume the fourth phase to be another liquid water (L1). Figure 2, b shows the thermodynamically correct P-T projection of the binary H-O system close to the nonvariant point of H2O chemical compound.
At room temperature and above, water is a homogeneous liquid, but at the microscopic level, two types of local structures (ordered tetrahedral and disordered, more closely packed) dynamically coexist. The authors [27] do not discuss two phases in the usual sense, but observed a continuous structural change associated with a thermodynamic anomaly. They point out that the data (constant coordination up to 3.3 Å and the behavior of the second peak) do not contradict either the two-state scenario or the continuous distribution of local structures.
At T>273 K, water behaves like a “normal” liquid, but its local structure is continuously rearranged. The anomaly at 319 K is a remnant of the hypothetical liquid–liquid critical point (LLCP), which is located around 220 K and whose influence extends to room temperatures, causing nonmonotonic behavior of properties but not phase separation.
A direct experiment was conducted to observe the liquid–liquid phase transition (LLPT) in supercooled water [28]. During the time window from about 8 ns to about 3 μs after heating, signals from LDL (low-density liquid phase) and HDL (high-density liquid phase) were simultaneously present in the sample (peaks at 1.7 Å-1 and 2.15 Å-1, respectively). This is direct evidence of phase separation into macroscopic domains. Phase separation of LDL and HDL was only observed in the deeply supercooled state (~200 K) and in a very short time window before crystallization. At T>273 K, such separation does not occur because the system is above the LLCP critical temperature (presumably 220 K), where the two liquids become indistinguishable, and water is a homogeneous liquid.
A more recent study [29] the authors did not observe spatial phase separation, but rather studied the dynamics of orientational relaxation of water molecules over a wide temperature range (from -5 °C to 95 °C) using terahertz spectroscopy. At T>273 K, water does not consist of two macroscopic phases, but at the molecular level, two types of local structures are constantly present and interconvert. The authors tend to call this phenomenon dynamic mixing rather than thermodynamic equilibrium of two phases. This research provides evidence for the existence of two liquid forms of water with different transition temperatures. Taking into account the numerous polymorphic modifications of water in the solid phase, which have received the general name “ice”, the correct P-T projection of the H–O system will have the following form (Figure 2, b).
Since transitions between high- and low-density amorphous ices, as well as between high- and low-density supercooled liquids, occur under conditions where crystalline ice is the stable phase, they are difficult to directly study. As for the liquid phases of water, it is still unclear whether their interconversion at low temperatures is continuous or discontinuous, culminating at the proposed second critical point of water, which is metastable with respect to crystallization.
When cooled at normal pressure, water initially contracts, reaching its maximum density at 4 °C [30]. Then, with further cooling, it expands–this is one manifestation of the transformation of water’s structure from a high-density HDL-like state to a low-density LDL-like state. Supercooled water is a mixture of HDL and LDL. At normal pressure, water in the HDL/LDL form is an unstable state that can only be created briefly at very low temperatures.
Using the recommended coordinates for the liquidus diagram of the hydrogen peroxide – water system (Table S1) [31], a fragment of the T-X cross-section of the oxygen – hydrogen system at normal pressure was constructed (Figure 3).
For a more detailed analysis, the homogeneity regions are shown on an enlarged scale. The melting points of the pure components, H₂ and O₂, are significantly lower than the melting points of the chemical compound phases (H₂O, H₂O₂, H₂O₂·2H₂O) in the H–O system; therefore, the regions near pure H₂ and O₂ are schematically represented on the T–X projection as degenerate eutectic regions. The melting point of hydrogen is 13.85 K [32]. The melting point of oxygen is 54.75 K [32].
Focusing on the practical relevance of the analyzed phase diagram for B2O3 technology, we did not consider high-pressure ice phases, limiting ourselves instead to three polymorphic modifications: hexagonal ice, cubic ice, and ice XI.
The proposed T–X cross-section is semi-quantitative in nature, as experimental data for the complete H–O system over a wide range of concentrations are unavailable.
2.1.2. Binary B-O System
2.1.3. Binary B-H System
There are 9 binary compounds [34,35] in В-Н system (Table S2). Some of them are thermally unstable with incongruent melting. Thermally stable phases under atmospheric pressure are presented in Figure 5. We assumed the peritectic melting or congruent melting for some phases similar to those observed in Ba-H [36] and B-Hf systems [37]. (B10H13)2 phase exists in the several polymorphs [38]. At the diagram, we present only one modification with the highest melting point.
2.1.4. Ternary B-O-H System
According to the literature, at normal pressure, the ternary system, in addition to the binary phases described above, contains compounds such as orthoboric and metaboric acids and using the method of graphical thermodynamics and data on the T-X projections of three binary systems and one quasi-binary system, 85 isothermal sections of the P-T-X-Y diagram for the ternary B-O-H system were constructed (Figure S1–S85). The upper temperature limit of 2400 K is determined by the congruent melting of boron, while the lower limit is due to the lack of data on phase transformations at temperatures below 210 K.
2.1.5. Quasibinary H2O-B2O3 System
At the literature on boron oxide (III) technology, significant attention is devoted to the analysis of the quasibinary B2O3–H2O system. At atmospheric pressure, this system comprises solid phases of H2O (ices), orthoboric acid (H3BO3), crystalline boron oxide (III) B2O3, and three polymorphic modifications of metaboric acid (α-HBO2, β-HBO2, and γ-HBO2). A detail study of tetraboric acid H2B4O7 was performed in [39]. However, this acid is metastable, and it has not yet been possible to obtain it in a form suitable for structural X-ray phase analysis. So, we did not analyze H2B4O7 as a stable phase in the quasibinary B2O3–H2O system (Figure 7).
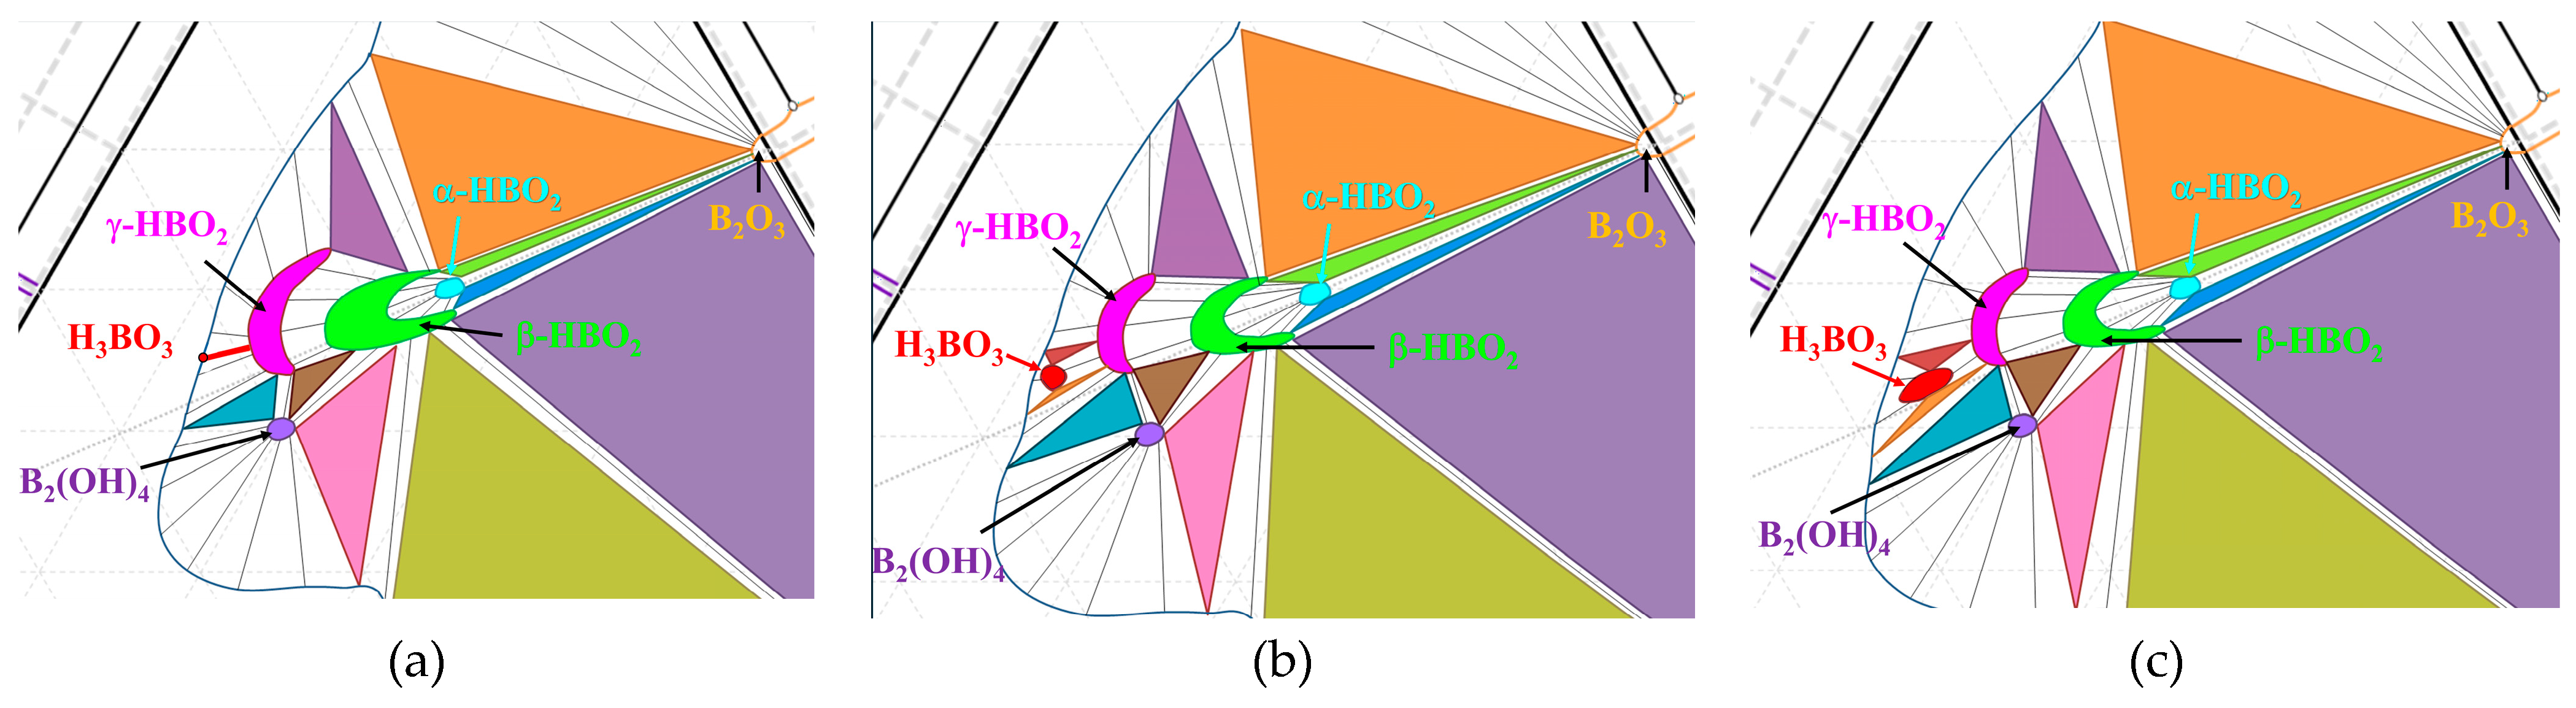
In this approach, all phases are treated as point-like, their ranges of homogeneity are not taken into account. It is assumed that any of these phases can be derived from the initial B2O3–H2O system. However, an analysis of the ternary B–O–H system (Section 2.1.4) has shown that, at a temperature of 444 K (Figure 7), monovariant equilibria occur involving the solid phase B2(OH)4, which is not represented on the quasi-binary B2O3–H2O cross-section. On the diagram (Figure 6), this corresponds to the apex of a liquidus branch at 25 mol% B2O3, while the incongruent melting point has coordinates of 442±1 K and 21 mol% B2O3.
Analysis within the framework of a ternary system has made it possible to resolve a number of contradictions found in the literature. For instance, according to [33], the H3BO3 acid phase melts congruently at 444.1±0.2 К and melts incongruently at 442±1 К. A systematic analysis of the system as the temperature decreases – taking into account the positions of the phase homogeneity regions on the B–O–H triangle – explains this discrepancy. Specifically, because H3BO3 homogeneity region is shifted toward an oxygen excess relative to the hypothetical B2O3–H2O line, a nonvariant equilibrium occurs at 444.1 K, involving an extremum in both the solidus and liquidus curves; in other words, congruent melting takes place at this temperature. As the temperature drops further, monovariant equilibria and ) are established. In this process, the H3BO3 phase is linked via bivariant equilibria to the melt on one side and to the solid γ-HBO2 phase on the other, which corresponds to a peritectic reaction, a characteristic feature of incongruent melting.
Figure 7.
Fragments of T-X cross-sections of the B-O-H ternary system at different temperatures: (a) congruent melting at 444.1 K; (b) intermediate state at 443.7 K; (c) incongruent melting at 443 K.
Figure 7.
Fragments of T-X cross-sections of the B-O-H ternary system at different temperatures: (a) congruent melting at 444.1 K; (b) intermediate state at 443.7 K; (c) incongruent melting at 443 K.
2.1.5.1. -Т Diagram H2O-B2O3 System
Numerous studies and reference works contain conflicting data regarding the thermodynamic properties of the phases in this quasi-binary system. Furthermore, there are significant differences in the enthalpies and entropies of formation for crystalline and amorphous boron oxide. In contrast, the enthalpies of formation for the various polymorphic modifications of HBO2 differ slightly [40]. As for the entropies of the metaboric acids, reliable data are available only for the β-HBO2 modification. However, since polymorphic transitions occur within a narrow temperature range, we deemed it appropriate to estimate the regions of phase stability on the diagram by taking the γ-HBO2 polymorph, the most thermodynamically stable form, as the basis.
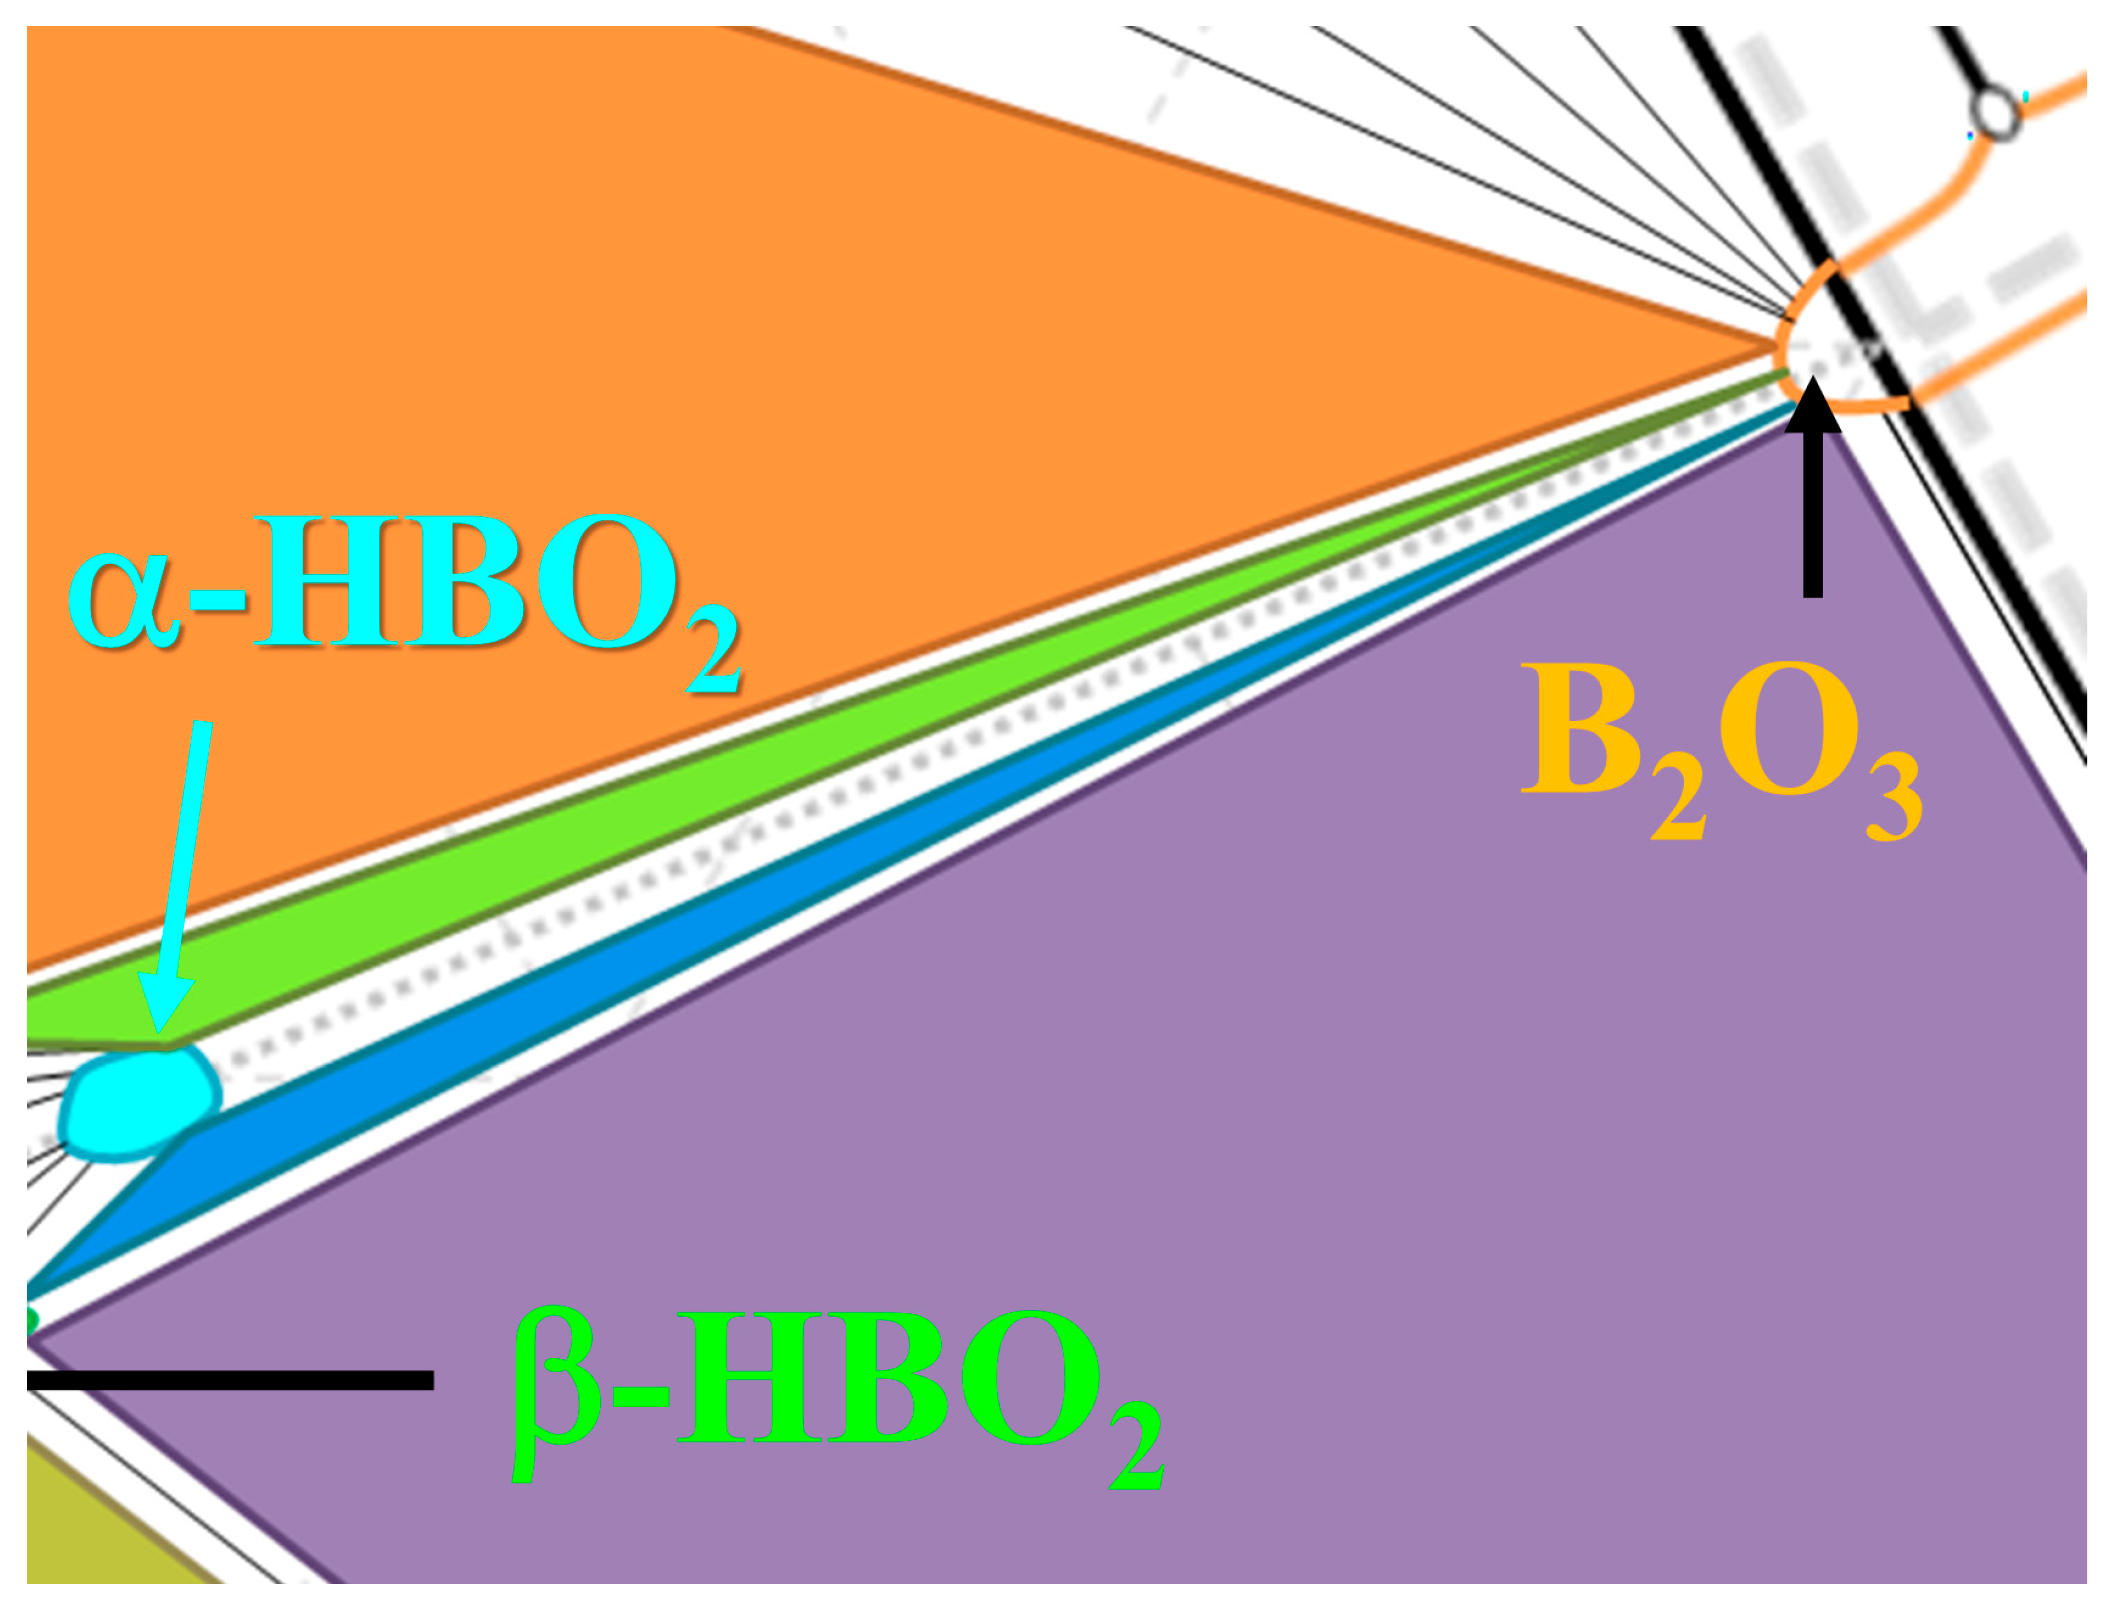
For heterophase reactions (2) and (4) we calculated the dependance of , and determined the regions of trivariant equilibria–, on the diagram (Figure 8).
In the case of crystalline B2O3 from Table 3 for the reaction (3) we obtained
In the case of amorphous B2O3 from Table 3 for the reaction (3) we obtained

Table 3.
Thermodynamic data for different phases in B-O-H ternary system.
| Phase |
kJ/mol |
J/mol K |
Cp kJ/mol K |
Reference |
|---|---|---|---|---|
| Solid H3BO3 | -1094.33 | 88.83 | 81.34 | [35] |
| Solid γ-HBO2 | -804.7 [40] | 49 [42] | ||
| Solid β-HBO2 | -794.25 | 37.66 | 42.2 | [40] |
| Solid α-HBO2 | 790.8 | 32 | [40] | |
| Vapor H2O | -241.8 | 188.8 | 33.6 | [41] |
| Crystalline B2O3 |
-1273.5 | 54.0 | 62.76 | [41] |
| Amorphous B2O3 |
-1254 | 80.8 | 62.76 | [42] |
Based on information regarding the saturated water vapor pressure over solid and liquid phases, as well as thermodynamic data on the enthalpies and entropies of formation for ortho- and metaboric acids, boron oxide, and water, a -Т diagram of the quasi-binary H2O–B2O3 system was constructed (without accounting for ice and metaboric acid polymorphism). Three regions of bivariant equilibria , , ) should be noted on this projection. In these bivariant equilibrium regions, the solid phase exists in equilibrium with unsaturated vapor. In the case of the S equilibrium, a decrease in the partial pressure of water vapor leads to a reduction in the water content within the boron (III) oxide. To the left of the red dashed line, the system exists in a liquid state. The diagram demonstrates that the water vapor pressure can be lowered by freezing out the water to temperatures at which the partial pressure of water vapor becomes extremely low.
Figure 8.
Fragment of diagram. Blue dash line divides the area of trivariant equilibrium for the B2O3 crystalline (large area) and amorphous (greenish area) solid.
Figure 8.
Fragment of diagram. Blue dash line divides the area of trivariant equilibrium for the B2O3 crystalline (large area) and amorphous (greenish area) solid.
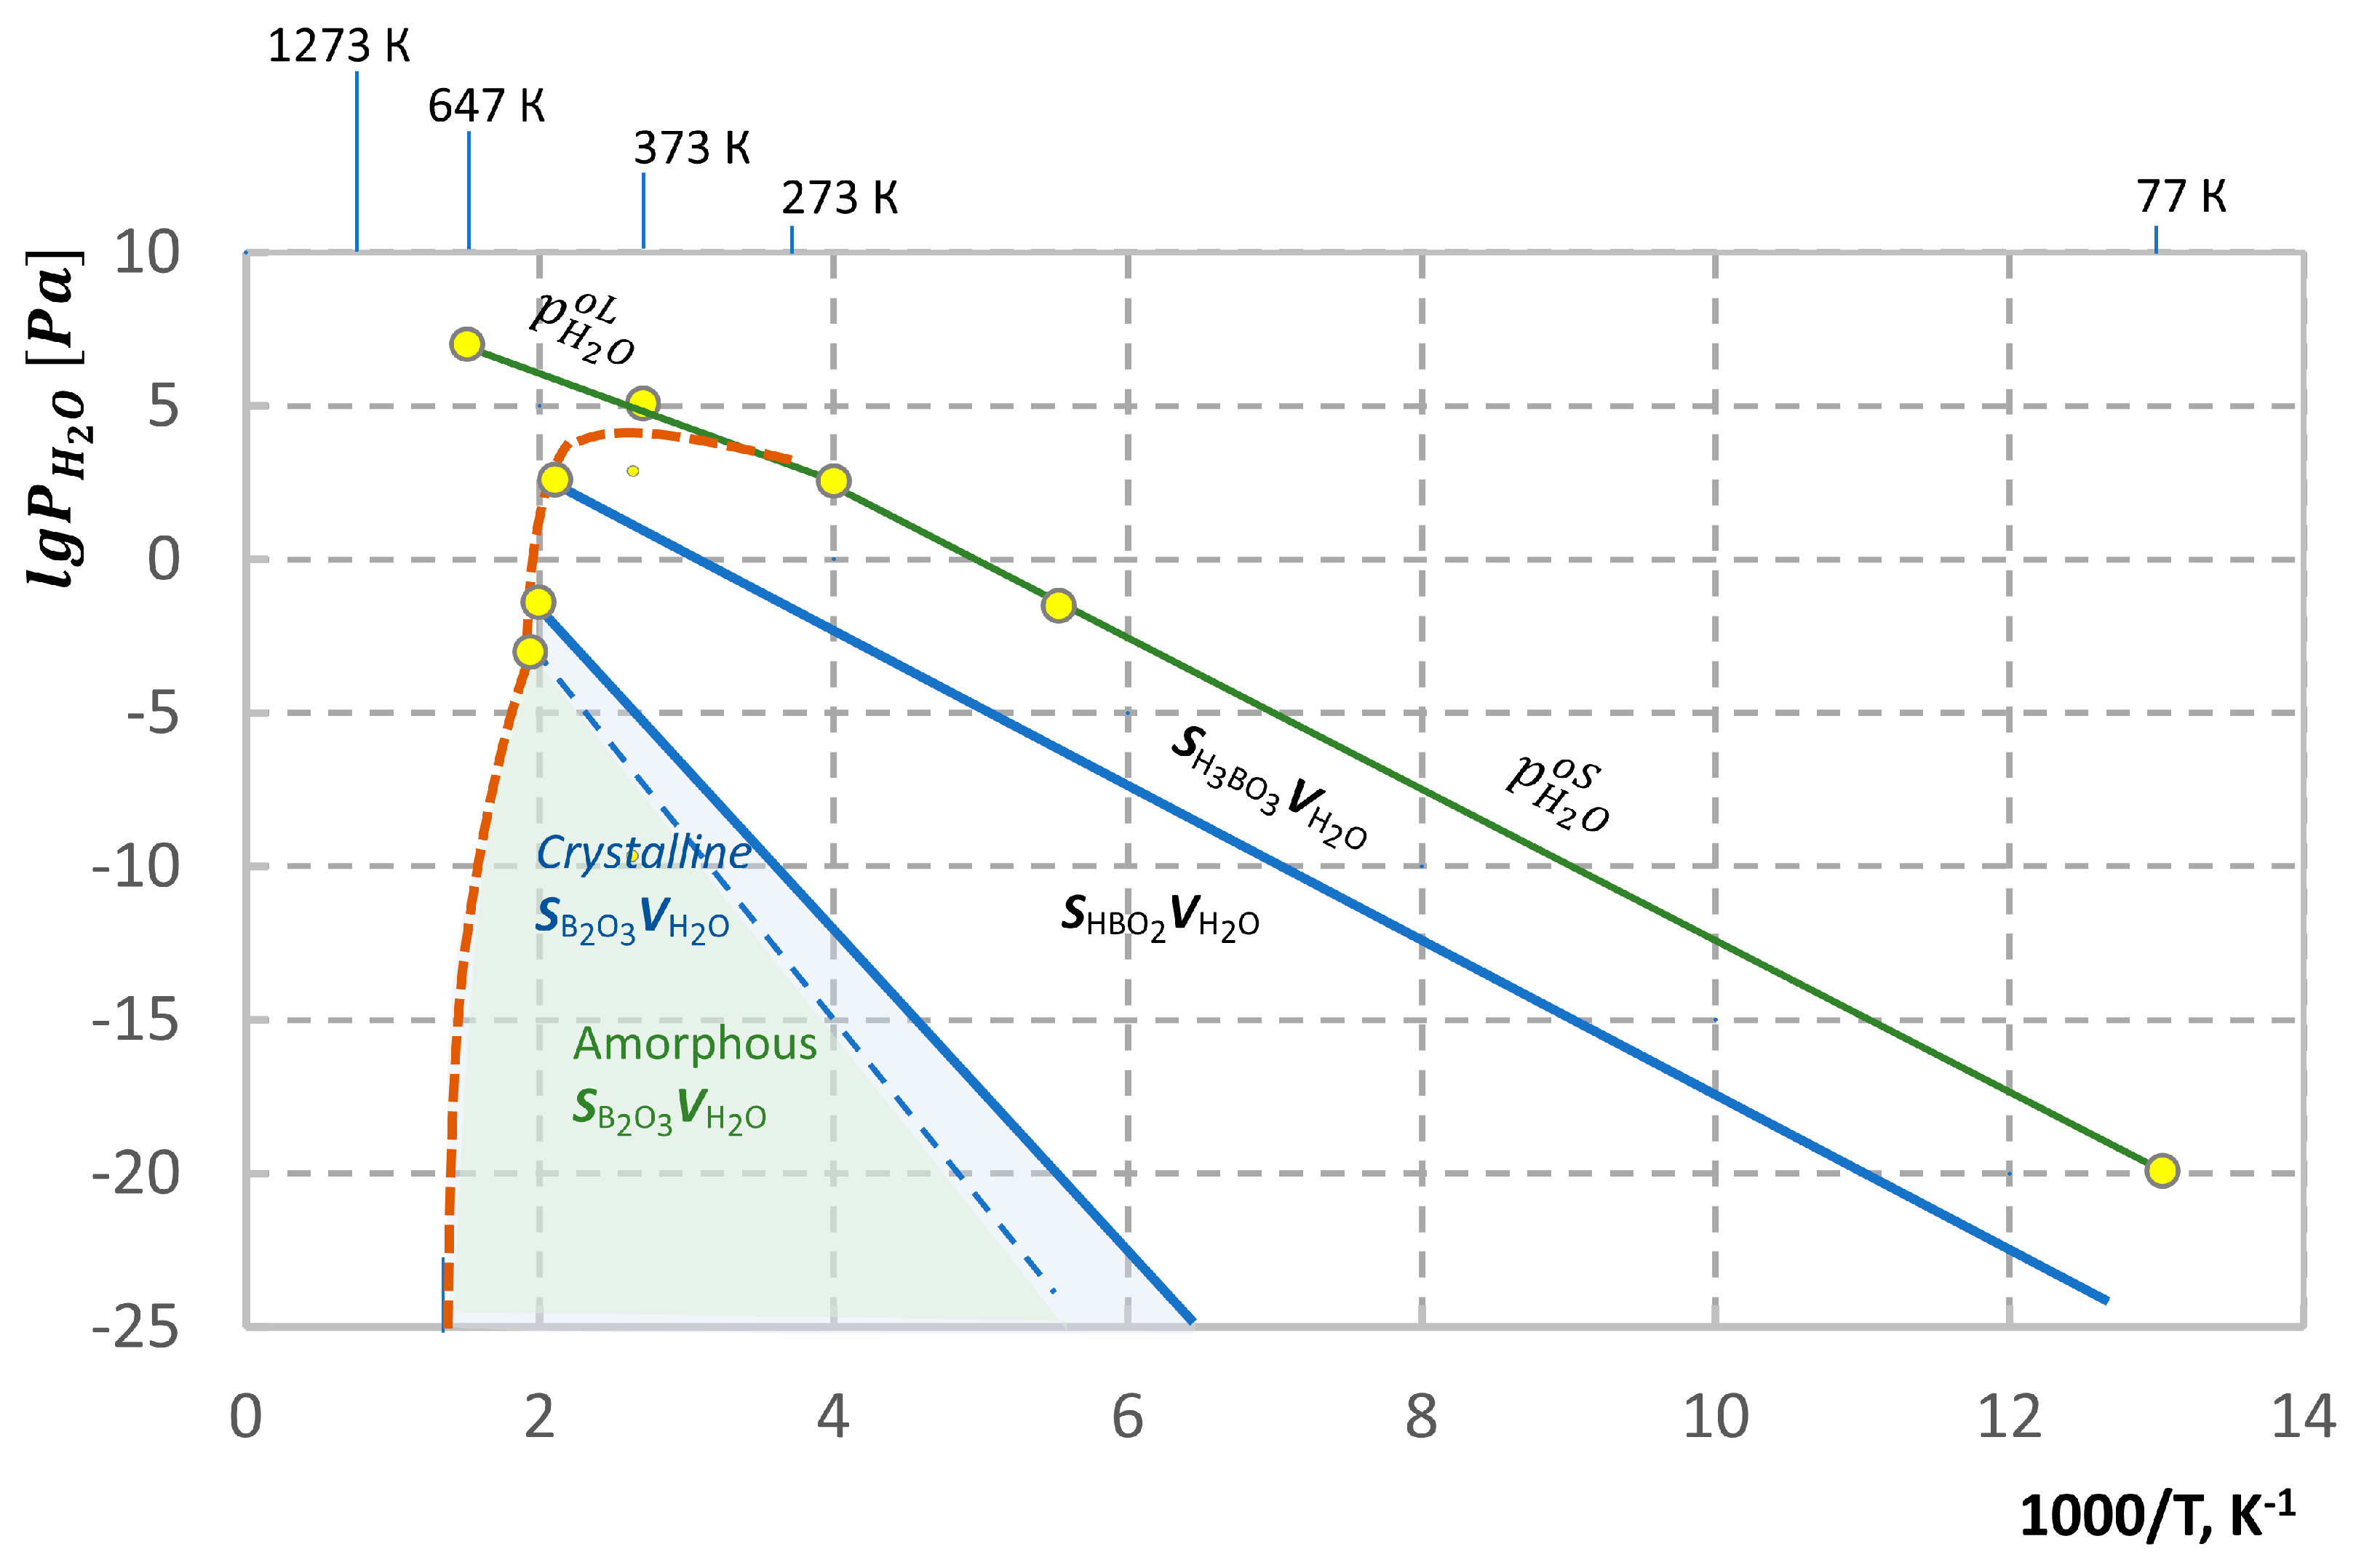
So, we can resume that controlled reduction of the residual water content in boron oxide during synthesis (or heat treatment) requires reducing the partial pressure of water vapor to below 10-3 Pa. This assumption served as the basis for developing a method for determining residual water in boron (III) oxide.
3. Materials and Methods
3.1. Materials and Methods for Impurity Determination by ICP-MS and ICP-OES
Boron (III) oxide obtained by thermal decomposition of H3BO3 acid was used as the object of study. H3BO3 acid (Komponent Reaktiv LLC, Moscow, Russia) 99.9995 wt% was additionally purified by recrystallization to a chemical purity of 99.99995 wt.% (Figure 9, Table S1). Concentrations of impurity elements in the initial boric acid and boron (III) oxide were analyzed by ICP-MS and ICP-OES with preliminary transfer of the powder sample into solution. Deionized water with an electrical resistance of at least 18 MΩ∙cm at 25 ºC was used as a solvent. The dissolved product was transferred to 50 ml polypropylene (PP) SARSTED tubes, an aliquot was taken, then dilution and analysis were carried out. Analytical measurements were performed on a NexION 300D inductively coupled plasma mass spectrometer (Perkin Elmer Inc., Shelton, Connecticut, U.S.A) in collision mode (kinetic energy discrimination (KED)) and standard mode. Inductively coupled optical emission spectrometry (Plasma 3500, NCS Testing Technology Co., LTD., Beijing, China) was used to determine the concentration of Al, P. Evaluation of the purity of impurities for 32 chemical elements was determined.
3.2. Method for Residual Water Content Determination in B2O3
According to an analysis of the diagram (Figure 8), the partial pressure of water vapor above boron oxide must be kept below 10-5 Pa to remove water from the material. Under these conditions, the removal process is diffusion-limited. If water is removed from a sample before the boron oxide begins to melt, the time required to reach equilibrium in the “solid boron oxide–water vapor” system will depend on the temperature, the partial pressure of the water vapor, and the size of the powder crystallites (or the size of an amorphous ingot; in the latter case, the removal time would be infinitely long). While melting the sample can increase the diffusion coefficient, the challenge of maintaining a sufficiently low partial pressure of water vapor remains.
This problem can be addressed either by conducting the removal process under dynamic vacuum conditions or by using a closed system in which the removed water is cooled to a temperature at which its partial pressure drops below 10-5 Pa. The lower the temperature to which the removed water is cooled, the lower its partial pressure at the “solid–vapor” equilibrium, and, consequently, the lower the residual water concentration in the boron oxide.
The dynamic mode allows for the preparation of a substance with a controlled residual water content; however, it does not provide a way to determine the exact amount of water removed. In contrast, the static mode allows the extracted water to be condensed in a cooled section of a closed system, where its quantity can be determined by mass.
Experimental data show that maintaining the temperature of the cold section of the system at 77 K results in a partial pressure of water of 10-20 Pa. The formation of defects associated with intercalated water in boron oxide can be described by the quasichemical reaction [44] in nonstoichiometric B2O3 (7):
here – concentration of intercalated water (H2Ointer) in B2O3 solid, water partial pressure, K – equilibrium constant of the reaction (7).
In other words, the concentration of intercalated water in boron oxide is proportional to the water vapor pressure raised to the power of 1. This means that a reduction in water vapor pressure from 10-3 Pa to 10-20 Pa will result in a decrease in the concentration of intercalated water by 17 orders of magnitude [45], comparing with the equilibrium value of at normal atmosphere ( = 20 Torr at 298 K), which could be reach 50 mol% at full conversion of B2O3 into H3BO3.
The practical implementation of the method is shown in Figure 10. The process of water extracting from boron oxide was carried out under static conditions in a hermetically sealed quartz ampoule. The extracted water was condensed in a capillary at a temperature of 77 K. Upon completion of the process, the capillary containing the ice was detached from the ampoule, brought to room temperature, and weighed using a Mettler-Toledo microbalance (Mettler-Toledo, Columbus, OH, U.S.A). Subsequently, the water was evaporated from the capillary, and the capillary was again brought to room temperature and weighed. The difference between the measured masses of the capillary with and without the water corresponds to the mass of water extracted from the sample of high-purity boron (III) oxide.
3.3. Method for OH-Groups Content Determination in B2O3
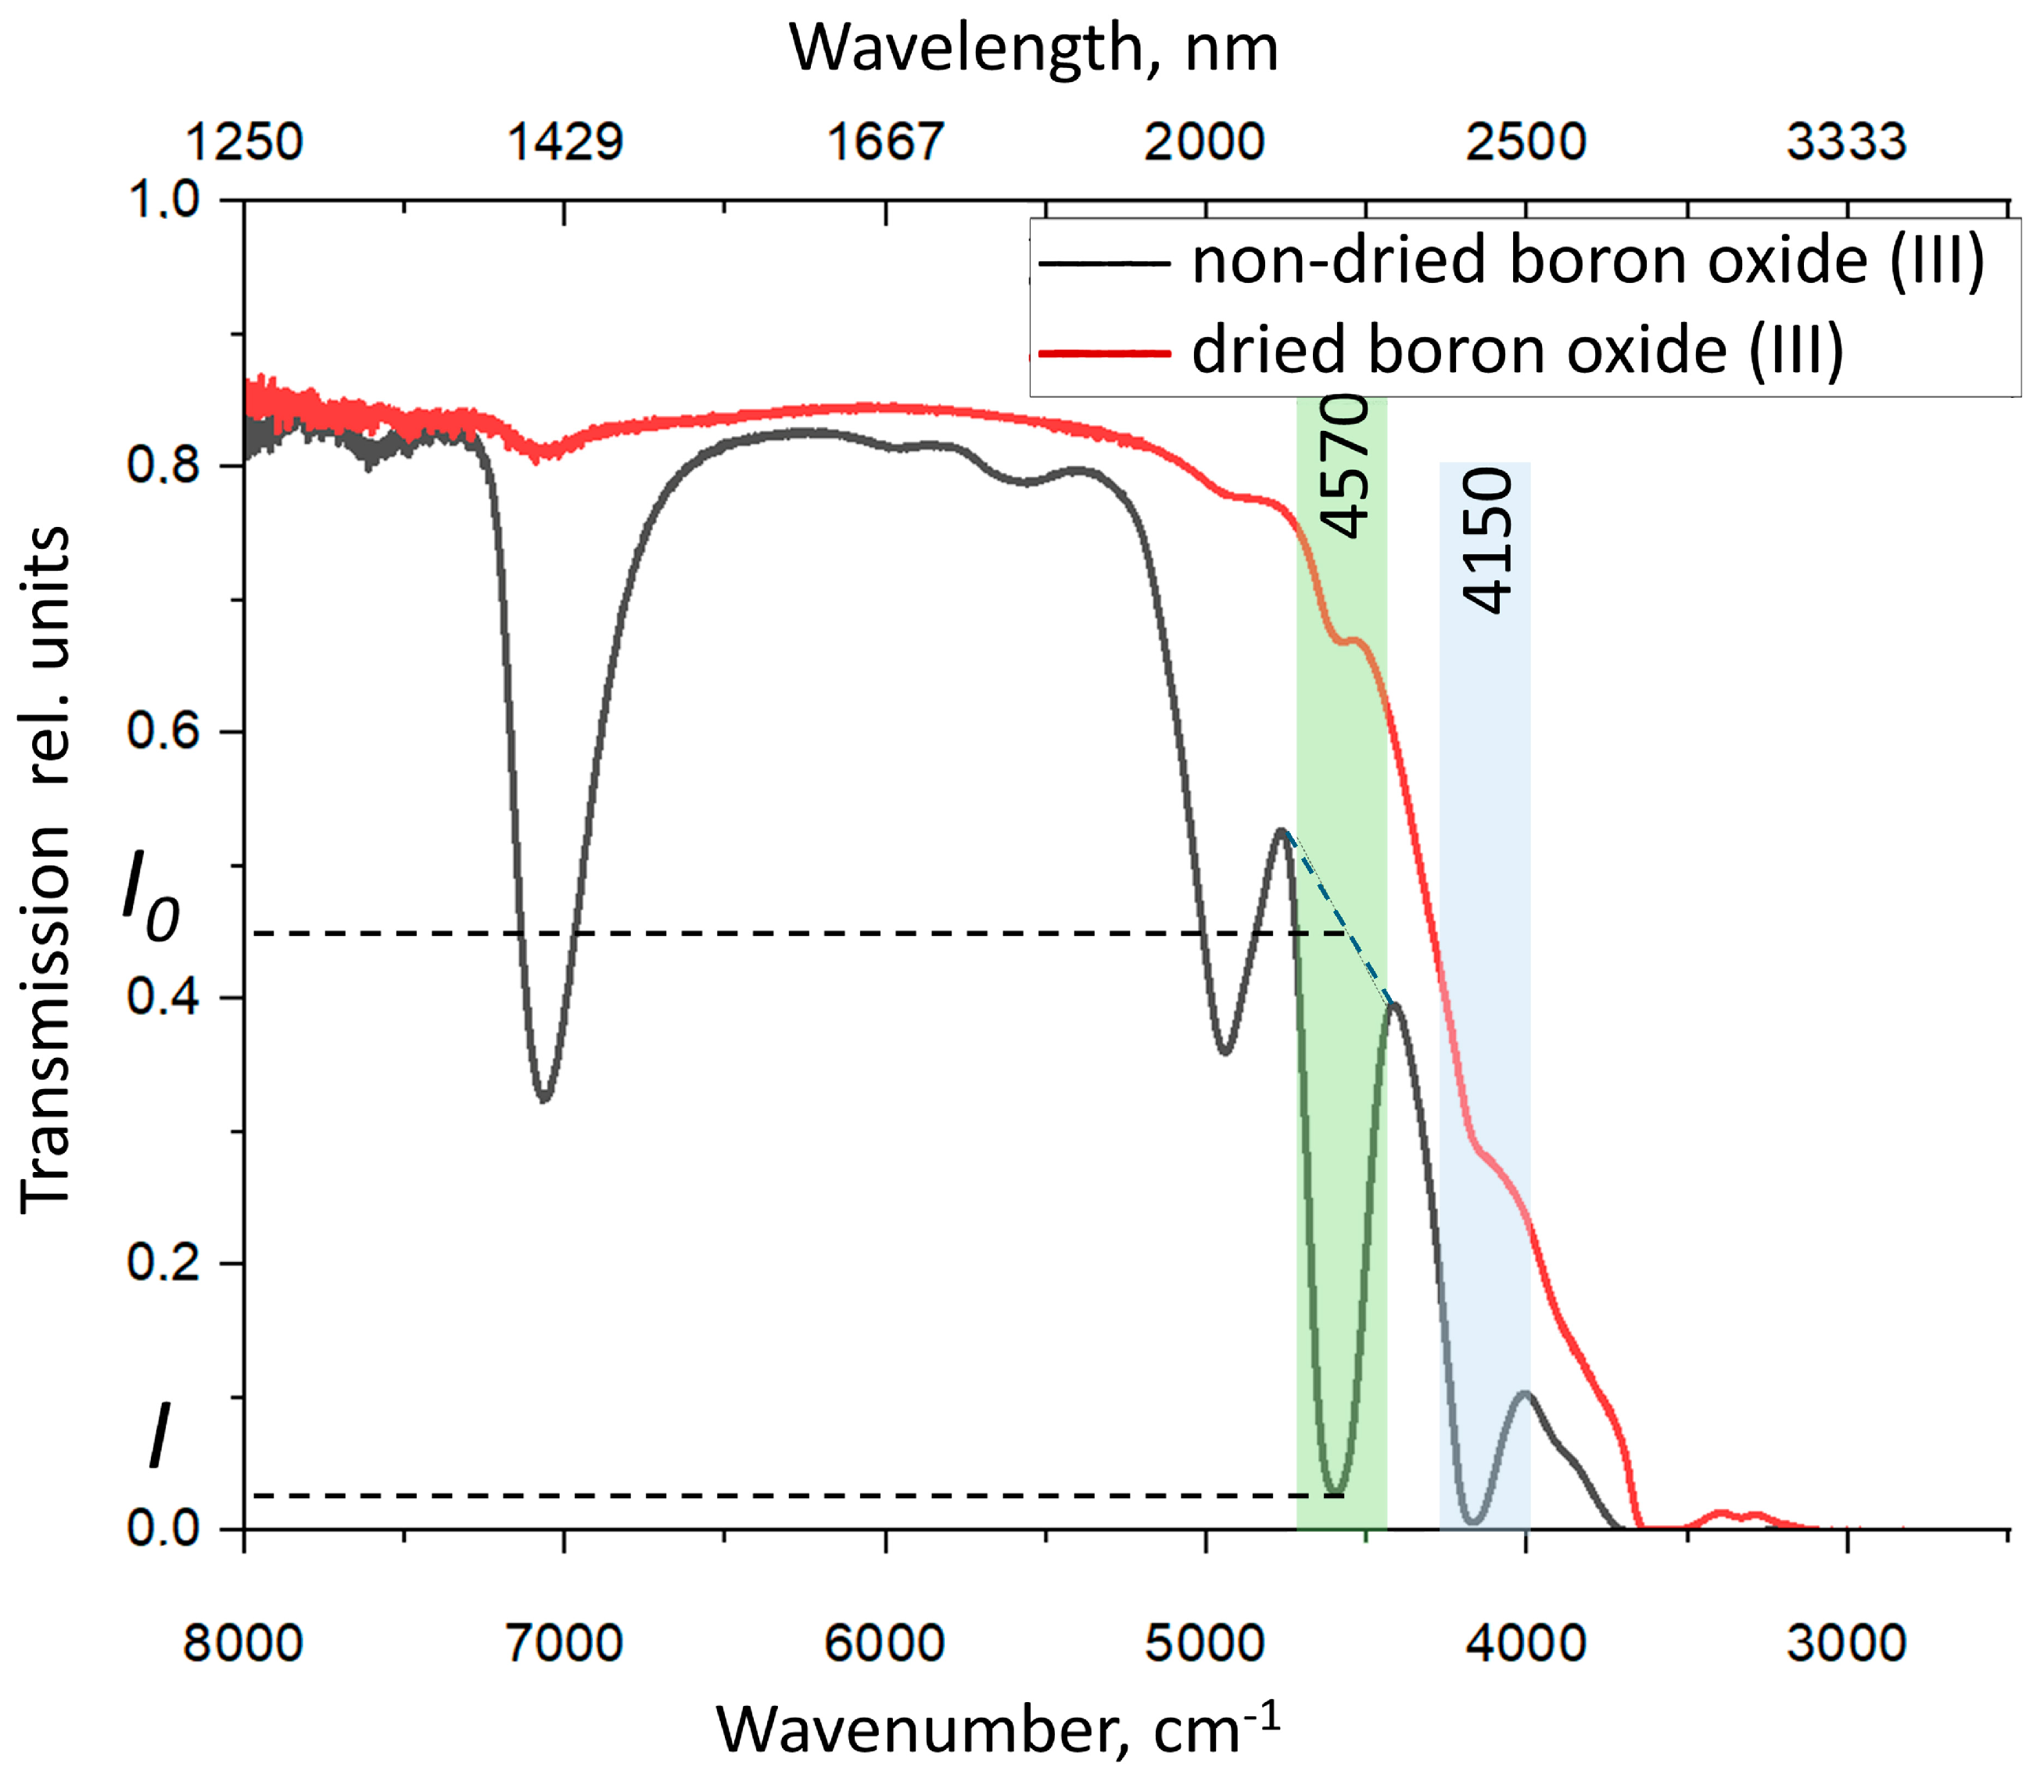
The IR spectrum were measured by a Tensor 27 FTIR spectrometer (Bruker Optics Inc., Billerica, MA, USA). The IR spectrum of hydrated boron oxide exhibits characteristic absorption bands associated with OH groups (4570, 4150 cm-1) and water (4444 cm-1) [46]. Unfortunately, IR spectra are not sensitive to the water content less than 50 ppm [47].
The concentration of OH groups was estimated using the band with a maximum at 4570 cm⁻¹.
Figure 11.
IR spectra of dried and non-dried B2O3 normalized for castings’ thickness.
Concentration of OH-groups was calculated using IR spectrum data by the following equation [46]
here, Е4150OH=3,3 l/(mole cm) extinction coefficient at 4150 cm-1; Е4570OH=2,3 l/(mole cm) extinction coefficient at 4570 cm-1; d - sample thickness, cm; I – intensity of the absorption peak (4150 or 4570 cm-1); I0 – intensity at the base of the absorption peak (4150 or 4570 cm-1).
3.4. B2O3 Ingots Fabrication
The technology for producing high-purity boron oxide (Figure 12) comprised the following stages: testing of raw materials, recrystallization of boric acid, production of a dried boron oxide powder, step-by-step drying at continuous heating and casting of amorphous boron oxide ingots, followed by packaging and analysis of impurity composition and water content.
4. Results
We fabricated several B2O3 ingots (MUCTR-X) varying synthesis conditions. According to the ICP-MS analysis of 32 impurities all fabricated B2O3 ingots (MUCTR-1) were as pure as 99,99992 wt% when 32 impurity elements were measured (including LODs) (Figure 13).
We examined as-synthesized B2O3 ingots and those form CMK s.r.o. company for residual water and OH-group contents and found out that OH-group content determined from IR measurements using Eq. (8) (Table 4) and noted in certificates coincided with the accuracy of the measurements. This proved our assumption that CMK s.r.o. company presented OH-group content in their certificates.
The values of residual water content and OH-groups content differ significantly. We did not find a direct correlation between OH-groups and water concentrations. For boron oxide as a flux non-chemically bound molecular water vaporized at melting acts as a transport agent in vapor. Whereas the bounded OH-groups remain in the boron oxide melt and do not use in the mass transfer processing in vapor.
5. Discussion
We were unable to establish a correlation between the concentrations of OH groups and intercalated water. From a thermodynamic perspective, the homogeneity range of the B2O3 phase in the B–O–H ternary system corresponds to a region of trivariant equilibrium (Figure 14). According to the Gibbs phase rule, the composition within this homogeneity range (Xnonstoich) is uniquely determined by three intensive parameters. In terms of defect chemistry, OH groups (XOH) can be considered one type of point defect, while intercalated water () represents another; the total deviation from stoichiometry (Xnonstoich) is then determined by the sum of these two concentrations.
Fundamental research of nonstoichiometry of solid phases in a ternary system is a highly painstaking and costly undertaking. There are few examples of such studies for inorganic phases [48,49,50]. In the case of binary semiconductor phases, research has been conducted on the internal structure of the homogeneity range, distinguishing between relatively slow-mobile, electrically neutral defects and high-mobile charged defects [51]. However, we are not aware of any such studies for ternary compounds.
Figure 14.
Fragment of T-X cross-sections of the B-O-H ternary system with enlarge scale of homogeneity ranges of solid phases.
Figure 14.
Fragment of T-X cross-sections of the B-O-H ternary system with enlarge scale of homogeneity ranges of solid phases.
From a technical standpoint, controlling three intensive parameters in a dynamic vacuum system presents immense challenges. In an actual setup, temperature and residual pressure (vacuum) are monitored, while the reproducibility of results, with regard to residual water content, is determined by a multitude of process parameters (such as the configuration of the apparatus, the amount of B2O3 loaded, the degree of boric acid decomposition, etc.).
The solubility of water in B2O3 likely represents precisely this type of scenario. In this case, intercalated, weakly bound water acts as a highly mobile defect, whereas an OH group, linked by a chemical bond, functions as a defect with low mobility. If this assumption holds true, then when using B2O3 as a flux in the VGF (Vertical Gradient Freeze) crystal growth technique, where the released water serves as a transport agent in the vapor phase, one needs the intercalated water, rather than the content of OH groups, that must be controlled.
6. Conclusions
An analysis of the phase diagram of the ternary H-B-O system showed that to control the solubility of OH groups and intercalated water, it is necessary to fix three intensive thermodynamic parameters under the conditions of the trivariant equilibrium , while in the production of high-purity boron oxide, a maximum of two are controlled - temperature and partial pressure of water vapor (or residual gas pressure in a vacuum system).
The developed method for the direct determination of intercalated water allows reliable determination of its content at a level above 10 ppm. It was found that the content of residual intercalated water and OH groups, measured using IR spectroscopy, in high-purity boron (III) oxide differ by more than an order of magnitude.
It has been theoretically shown and experimentally established that under traditional synthesis of high-purity boron (III) oxide, there is no direct correlation between the content of intercalated water and OH-groups. At low values the magnitudes differ approximately in one order and the difference rises while the water content increase. This circumstance indicates the need for separate control of these forms and optimization of their ratio for the best performance of the crystal growth process of AIIIBV compounds by the LEC and VGF methods when using high-purity boron (III) oxide as a flux.
7. Patents
The method of water content measurement was patented as METHOD FOR DETERMINING THE QUANTITY OF WATER IN HIGH-PURITY BORON(III) OXIDE AND BORATE CRYSTALS RU 2 843 811.
Supplementary Materials
The following supporting information can be downloaded at the website of this paper posted on Preprints.org, Table S1: Coordinates for the liquidus diagram of the hydrogen peroxide – water system; Table S2: Binary phases of chemical compounds in B-H system; Table S3: Impurity concentrations (wt. %) in boric acid purified by recrystallization and complexing; Table S4: Impurity concentrations (wt. %) in purified boric acid and as-synthesized and commercial boron oxide (III). Figure S1: Isothermal cross-sections of T-X-Y projection of ternary B-O-H at 2400 K; ;Figure S2: Isothermal cross-sections of T-X-Y projection of ternary B-O-H at 2349 K; ;Figure S3: Isothermal cross-sections of T-X-Y projection of ternary B-O-H at 2340 K; Figure S4: Isothermal cross-sections of T-X-Y projection of ternary B-O-H at 1600 K; Figure S5: Isothermal cross-sections of T-X-Y projection of ternary B-O-H at 800 K; Figure S6: Isothermal cross-sections of T-X-Y projection of ternary B-O-H at 723 K; Figure S7: Isothermal cross-sections of T-X-Y projection of ternary B-O-H at 720 K; Figure S8: Isothermal cross-sections of T-X-Y projection of ternary B-O-H at 710 K; Figure S9: Isothermal cross-sections of T-X-Y projection of ternary B-O-H at 700 K; Figure S10: Isothermal cross-sections of T-X-Y projection of ternary B-O-H at 660 K; Figure S11: Isothermal cross-sections of T-X-Y projection of ternary B-O-H at 658 K; Figure S12: Isothermal cross-sections of T-X-Y projection of ternary B-O-H at 650 K; Figure S13: Isothermal cross-sections of T-X-Y projection of ternary B-O-H at 600 K; Figure S14: Isothermal cross-sections of T-X-Y projection of ternary B-O-H at 520 K; Figure S15: Isothermal cross-sections of T-X-Y projection of ternary B-O-H at 509 K; FigureS16: Isothermal cross-sections of T-X-Y projection of ternary B-O-H at 508.5 K; Figure S17: Isothermal cross-sections of T-X-Y projection of ternary B-O-H at 508 K; Figure S18: Isothermal cross-sections of T-X-Y projection of ternary B-O-H at 500 K; Figure S19: Isothermal cross-sections of T-X-Y projection of ternary B-O-H at 490 K; Figure S20: Isothermal cross-sections of T-X-Y projection of ternary B-O-H at 485 K; Figure S21: Isothermal cross-sections of T-X-Y projection of ternary B-O-H at 480 K; Figure S22: Isothermal cross-sections of T-X-Y projection of ternary B-O-H at 474 K; Figure S23: Isothermal cross-sections of T-X-Y projection of ternary B-O-H at 473.8 K; Figure S24: Isothermal cross-sections of T-X-Y projection of ternary B-O-H at 473.5 K; Figure S25: Isothermal cross-sections of T-X-Y projection of ternary B-O-H at 472 K; Figure S26: Isothermal cross-sections of T-X-Y projection of ternary B-O-H at 470 K; Figure S27: Isothermal cross-sections of T-X-Y projection of ternary B-O-H at 465 K; Figure S28: Isothermal cross-sections of T-X-Y projection of ternary B-O-H at 460 K; Figure S29: Isothermal cross-sections of T-X-Y projection of ternary B-O-H at 449.2 K; Figure S30: Isothermal cross-sections of T-X-Y projection of ternary B-O-H at 449.1 K; Figure S31: Isothermal cross-sections of T-X-Y projection of ternary B-O-H at 448.8 K; Figure S32: Isothermal cross-sections of T-X-Y projection of ternary B-O-H at 445 K; Figure S33: Isothermal cross-sections of T-X-Y projection of ternary B-O-H at 444.5 K; Figure S34: Isothermal cross-sections of T-X-Y projection of ternary B-O-H at 444.1 K; Figure S35: Isothermal cross-sections of T-X-Y projection of ternary B-O-H at 443.7 K; Figure S36: Isothermal cross-sections of T-X-Y projection of ternary B-O-H at 443.64 K; Figure S37: Isothermal cross-sections of T-X-Y projection of ternary B-O-H at 443.1 K; Figure S38: Isothermal cross-sections of T-X-Y projection of ternary B-O-H at 443 K; Figure S39: Isothermal cross-sections of T-X-Y projection of ternary B-O-H at 442.9 K; Figure S40: Isothermal cross-sections of T-X-Y projection of ternary B-O-H at 442.8 K; Figure S41: Isothermal cross-sections of T-X-Y projection of ternary B-O-H at 442.7 K; Figure S42: Isothermal cross-sections of T-X-Y projection of ternary B-O-H at 442.6 K; Figure S43: Isothermal cross-sections of T-X-Y projection of ternary B-O-H at 442 K; Figure S44: Isothermal cross-sections of T-X-Y projection of ternary B-O-H at 437 K; Figure S45: Isothermal cross-sections of T-X-Y projection of ternary B-O-H at 436 K; Figure S46: Isothermal cross-sections of T-X-Y projection of ternary B-O-H at 435 K; Figure S47: Isothermal cross-sections of T-X-Y projection of ternary B-O-H at 434 K; Figure S48: Isothermal cross-sections of T-X-Y projection of ternary B-O-H at 433 K; Figure S49: Isothermal cross-sections of T-X-Y projection of ternary B-O-H at 432 K; Figure S50: Isothermal cross-sections of T-X-Y projection of ternary B-O-H at 431.6 K; Figure S51: Isothermal cross-sections of T-X-Y projection of ternary B-O-H at 420 K; Figure S52: Isothermal cross-sections of T-X-Y projection of ternary B-O-H at 411 K; Figure S53: Isothermal cross-sections of T-X-Y projection of ternary B-O-H at 410 K; Figure S54: Isothermal cross-sections of T-X-Y projection of ternary B-O-H at 400 K; Figure S55: Isothermal cross-sections of T-X-Y projection of ternary B-O-H at 390 K; Figure S56: Isothermal cross-sections of T-X-Y projection of ternary B-O-H at 373 K; ;Figure S57: Isothermal cross-sections of T-X-Y projection of ternary B-O-H at 371 K; Figure S58: Isothermal cross-sections of T-X-Y projection of ternary B-O-H at 365 K; Figure S59: Isothermal cross-sections of T-X-Y projection of ternary B-O-H at 360 K; Figure S60: Isothermal cross-sections of T-X-Y projection of ternary B-O-H at 354 K; Figure S61: Isothermal cross-sections of T-X-Y projection of ternary B-O-H at 350 K; Figure S62: Isothermal cross-sections of T-X-Y projection of ternary B-O-H at 330 K; Figure S63: Isothermal cross-sections of T-X-Y projection of ternary B-O-H at 300 K; Figure S64: Isothermal cross-sections of T-X-Y projection of ternary B-O-H at 290 K; Figure S65: Isothermal cross-sections of T-X-Y projection of ternary B-O-H at 280 K; Figure S66: Isothermal cross-sections of T-X-Y projection of ternary B-O-H at 273.15 K; Figure S67: Isothermal cross-sections of T-X-Y projection of ternary B-O-H at 272.7 K; Figure S68: Isothermal cross-sections of T-X-Y projection of ternary B-O-H at 272.5 K; Figure S69: Isothermal cross-sections of T-X-Y projection of ternary B-O-H at 272.2 K; Figure S70: Isothermal cross-sections of T-X-Y projection of ternary B-O-H at 270 K; Figure S71: Isothermal cross-sections of T-X-Y projection of ternary B-O-H at 260 K; Figure S72: Isothermal cross-sections of T-X-Y projection of ternary B-O-H at 230 K; Figure S73: Isothermal cross-sections of T-X-Y projection of ternary B-O-H at 226 K; Figure S74: Isothermal cross-sections of T-X-Y projection of ternary B-O-H at 223 K; Figure S75: Isothermal cross-sections of T-X-Y projection of ternary B-O-H at 221.15 K; Figure S76: Isothermal cross-sections of T-X-Y projection of ternary B-O-H at 221.1 K; Figure S77: Isothermal cross-sections of T-X-Y projection of ternary B-O-H at 221 K; Figure S78: Isothermal cross-sections of T-X-Y projection of ternary B-O-H at 220 K; Figure S79: Isothermal cross-sections of T-X-Y projection of ternary B-O-H at 217 K; Figure S80: Isothermal cross-sections of T-X-Y projection of ternary B-O-H at 216 K; Figure S81: Isothermal cross-sections of T-X-Y projection of ternary B-O-H at 214 K; Figure S82: Isothermal cross-sections of T-X-Y projection of ternary B-O-H at 213 K; Figure S83: Isothermal cross-sections of T-X-Y projection of ternary B-O-H at 212 K; Figure S84: Isothermal cross-sections of T-X-Y projection of ternary B-O-H at 211 K; Figure S85: Isothermal cross-sections of T-X-Y projection of ternary B-O-H at 210 K.
Author Contributions
Conceptualization, M.Z. and I.A.; methodology, A.B., A.P.; software, A.D., A.K.; validation, D.V., A.S., A.V. and M.Z.; formal analysis, E.M.; investigation, A.B., E.V., R.A.; resources, R.A., E.M.; data curation, E.M., E.V.; writing–original draft preparation, M.Z., R.A.; writing–review and editing, A.B., I.A.; visualization, A.B., R.A., M.Z., I.A.; supervision, M.Z.; project administration, I.A.; funding acquisition, R.A. All authors have read and agreed to the published version of the manuscript.
Funding
This research was funded by the Ministry of Science and Higher Education of the Russian Federation within the framework of project FSSM-2025-0006.
Data Availability Statement
The original contributions presented in this study are included in the article/Supplementary Material. Further inquiries can be directed to the corresponding authors.
Acknowledgments
The authors express their gratitude to the National Analytical Certification Laboratory (NAСL) of High-Purity Substances and Materials of Mendeleev University of Chemical Technology for assistance in conducting instrumental studies within the framework of the “Priority-2030” program.
Conflicts of Interest
The authors declare no conflicts of interest.
References
- Kulchitskiy, N. A.; Mayanov, E. P.; Naumov, A. V. Gallium Arsenide: The Basic Material of Microwave Electronics. Nano- i Mikrosist. Teh. 2017, 19 (4), 207–214. [CrossRef]
- Gillessen, K.; Marshall, A. J. Growth of GaP Single Crystals by the Synthesis, Solute Diffusion Method. J. Cryst. Growth 1976, 32 (2), 216–220. [CrossRef]
- Yamamoto, A.; Uemura, C. InP Single Crystal Growth by the Synthesis, Solute Diffusion Method. Jpn. J. Appl. Phys. 1978, 17 (10), 1869–1870. [CrossRef]
- Frank-Rotsch C, Dropka N, Rotsch P. III Arsenide. In: Fornari R, editor. Single crystals of electronic materials: growth and properties. Cambridge: Woodhead Publishing; 2018. p. 181–240 ISBN: 9780081020968.
- Dropka, N.; Holena, M.; Thieme, C.; Chou, T. Development of the VGF Crystal Growth Recipe: Intelligent Solutions of Ill-Posed Inverse Problems Using Images and Numerical Data. Cryst. Res. Technol. 2023, 58 (11). [CrossRef]
- Korb, J.; Flade, T.; Jurisch, M.; Köhler, A.; Reinhold, T.; Weinert, B. Carbon, Oxygen, Boron, Hydrogen and Nitrogen in the LEC Growth of SI GaAs: A Thermochemical Approach. J. Cryst. Growth 1999, 198–199, 343–348. [CrossRef]
- Nishio, J.; Fujita, H. Ambient Gas Constituents and Segregation of Carbon and Boron in LEC GaAs Single Crystals: The Role of Water in Boric Oxide Encapsulants. J. Cryst. Growth 1993, 134 (1–2), 97–104. [CrossRef]
- Emori, H.; Kikuta, T.; Inada, T.; Obokata, T.; Fukuda, T. Effect of Water Content of B2O3 Encapsulant on Semi-Insulating LEC GaAs Crystal. Jpn. J. Appl. Phys. 1985, 24 (5A), L291. [CrossRef]
- Boron Oxide | CMK Ltd. - The Gallium Arsenide Company. Available online: https://cmk.sk/products/diboron-trioxide/ (accessed on 07 July 2026).
- M. Kizilyalli, A. Pakdil, B. S. Synthesis and Characterization of Lithium Triborate. In Physicochemical Problems of Mineral Processing; Zygmunt Sadowski, Jan Drzymala, A. L., Ed.; Wroclaw, 2004 (38); pp 321–327.
- Nie, W.; Paz-Pujalt, G. R.; Lurin, C. Sol-Gel Method for Preparing an Alkaline Earth Metal Borate. Patent US5472678A, 1995. https://patents.google.com/patent/US5472678A/en?oq=US5472678.
- Fedorov, P. P.; Kokh, A. E.; Kononova, N. G. Barium Borate β-BaB 2 O 4 as a Material for Nonlinear Optics. Russ. Chem. Rev. 2002, 71 (8), 651–671. [CrossRef]
- Bengisu, M. Borate Glasses for Scientific and Industrial Applications: A Review. J. Mater. Sci. 2016, 51 (5), 2199–2242. [CrossRef]
- Butenkov, D.; Bakaeva, A.; Runina, K.; Krol, I.; Uslamina, M.; Pynenkov, A.; Petrova, O.; Avetissov, I. New Glasses in the PbCl2–PbO–B2O3 System: Structure and Optical Properties. Ceramics 2023, 6 (3), 1348–1364. [CrossRef]
- Zykova, S. S.; Serkina, K. S.; Runina, K. I.; Avetissov, I. C.; Petrova, O. B.; Boldyrev, K. A. Synthesis and Properties of Sm3+/Gd3+ Co-Doped B2O3–GeO2–Bi2O3 Glass Composition. Glas. Ceram. 2024, 81 (3–4), 106–110. [CrossRef]
- Zhang, W.; Sun, S.; Xu, J.; Chen, Z. Kinetic Study of Boron Oxide Prepared by Dehydration of Boric Acid. Asian J. Chem. 2015, 27 (3), 1001–1004. [CrossRef]
- Gavrishchuk, E.; Zykova, M.; Mozhevitina, E.; Avetisov, R.; Ikonnikov, V.; Savin, D.; Rodin, S.; Firsov, K.; Kazantsev, S.; Kononov, I.; Avetissov, I. Investigations of Nanoscale Defects in Crystalline and Powder ZnSe Doped With Fe for Laser Application. Phys. status solidi 2018, 215 (4). [CrossRef]
- Potapova, K. A.; Zykova, M. P.; Avetisov, R. I.; Avetissov, I. С. Fundamentals of Cr and Fe Atomic Defects Formation in Nonstoichiometric ZnS Crystals for Infrared Lasers. Cryst. Res. Technol. 2022, 57 (7). [CrossRef]
- Stepanova, I. V.; Petrova, O. B.; Korolev, G. M.; Guslistov, M. I.; Zykova, M. P.; Avetisov, R. I.; Avetissov, I. C. Synthesis of the Bi2GeO5 Ferroelectric Crystalline Phase from a Nonstoichiometric Batch. Phys. status solidi 2022, 219 (16). [CrossRef]
- Pelton, A. D. A General “Geometric” Thermodynamic Model for Multicomponent Solutions. Calphad Comput. Coupling Phase Diagrams Thermochem. 2001, 25 (2), 319–328. [CrossRef]
- Phases of ice - Wikipedia. Available online: https://en.wikipedia.org/wiki/Phases_of_ice (accessed on 06 July 2026).
- Water structure and science. Available online: http://www1.lsbu.ac.uk/water/water_structure_science.html (accessed on 06 July 2026).
- Phase diagram of water https://medienportal.siemens-stiftung.org/en/phase-diagram-of-water-104562; (accessed on 30 October 2026).
- Roder, H. M. The Thermodynamic Properties of Slush Hydrogen and Oxygen; Cryogenics Division Institute for 3asic Standards National Bureau of Standards Boulder: Colorado, 1977, 45p.
- Lobban, C.; Finney, J. L.; Kuhs, W. F. The Structure of a New Phase of Ice. Nature 1998, 391 (6664), 268–270. [CrossRef]
- Aragones, J. L.; Conde, M. M.; Noya, E. G.; Vega, C. The Phase Diagram of Water at High Pressures as Obtained by Computer Simulations of the TIP4P/2005 Model: The Appearance of a Plastic Crystal Phase. Phys. Chem. Chem. Phys. 2009, 11 (3), 543–555. [CrossRef]
- Skinner, L. B.; Benmore, C. J.; Neuefeind, J. C.; Parise, J. B. The Structure of Water around the Compressibility Minimum. J. Chem. Phys. 2014, 141 (21). [CrossRef]
- Amann-Winkel, K.; Kim, K. H.; Giovambattista, N.; Ladd-Parada, M.; Späh, A.; Perakis, F.; Pathak, H.; Yang, C.; Eklund, T.; Lane, T. J.; You, S.; Jeong, S.; Lee, J. H.; Eom, I.; Kim, M.; Park, J.; Chun, S. H.; Poole, P. H.; Nilsson, A. Liquid-Liquid Phase Separation in Supercooled Water from Ultrafast Heating of Low-Density Amorphous Ice. Nat. Commun. 2023, 14 (1), 442. [CrossRef]
- Vinh, N. Q.; Doan, L. C.; Hoang, N. L. H.; Cui, J. R.; Sindle, B. Correlation between Macroscopic and Microscopic Relaxation Dynamics of Water: Evidence for Two Liquid Forms. J. Chem. Phys. 2023, 158 (20). [CrossRef]
- Brovchenko, I.; Geiger, A.; Oleinikova, A. Liquid-Liquid Phase Transitions in Supercooled Water Studied by Computer Simulations of Various Water Models. J. Chem. Phys. 2005, 123 (4). [CrossRef]
- Schumb, W. C. Hydrogen Peroxide; ACS monograph; Reinhold Publishing Corporation, 1955, 759 p.
- Pradyot, P. Handbook of Inorganic Chemicals, 1st ed.; McGraw-Hill: New York, 2002. 1157 p.
- Kracek, F. C.; Morey, G. W.; Merwin, H. E. The System. Water-Boron Oxide. Am. J. Sci. 1938, s5-35A. [CrossRef]
- Zhigach, A. F, Stasinevich, D. S. Chemistry of Hydrides; Chemistry. Leningr. department: Leningrad, 1960, 676 p, 118–119. (in Russian).
- Patnaik, P. Handbook of Inorganic Chemicals; McGraw-Hill: New York, NY, USA, 2003, 125–126. ISBN 0-07-049439-8.
- Peterson, D.T.; Indig, M. The Barium-Barium Hydride Phase System. J. Am. Chem. Soc. 1960, 82, 5645–5646. [CrossRef]
- Rogl, P.; Potter, P. E. A Critical Review and Thermodynamic Calculation of the Binary System: Hafnium-Boron. Calphad 1988, 12 (3), 207–218. [CrossRef]
- Boocock, S. K.; Greenwood, N. N.; Kennedy, J. D.; McDonald, W. S.; Staves, J. The Chemistry of Isomeric Icosaboranes, B 20 H 26 . Molecular Structures and Physical Characterization of 2,2′- Bi(Nido-Decaboranyl) and 2,6′-Bi-(Nido-Decaboranyl). J. Chem. Soc., Dalt. Trans. 1980, No. 5, 790–796. [CrossRef]
- Kaur, G.; Kainth, S.; Kumar, R.; Sharma, P.; Pandey, O. P. Reaction Kinetics during Non-Isothermal Solid-State Synthesis of Boron Trioxide via Boric Acid Dehydration. React. Kinet. Mech. Catal. 2021, 134 (1), 347–359. [CrossRef]
- Kilday, M. V.; Prosen, E. J. Heats of Solution, Transition, and Formation of Three Crystalline Forms of Metaboric Acid. J. Res. Natl. Bur. Stand. Sect. A Phys. Chem. 1964, 68A (1), 127. [CrossRef]
- Section 5: Thermochemistry, Electrochemistry, and Kinetics Available online: https://www3.fi.mdp.edu.ar/quimicafisica/Tablas/Handbook%20ChemPhys.pdf (accessed on 30 October 2026).
- Rabinovich, V. A., Khavin, Z. Ya. Short chemical handbook; Leningrad, Khimia, Second Edition, 1978, 392 p (p. 59) (in Russian).
- Standard enthalpies of formation. Available online: https://dpva.ru/Guide/GuideChemistry/ThermicConstantsSubst/ThermicConstantsSubstEnorganic/ThermicConstantsSubstEnorganicPrint/ (accessed on 30 October 2026).
- F.A., Kroger. The Chemistry of Imperfect Crystals; North-Holland: Amsterdam, 1964. 1039 p.
- Pytchenko, K. Runina, A. Baranova, E. Mozhevitina, A. Khomyakov, R. Avetisov, I. A. Method of determining amount of water in high-purity boron oxide (III) and borate crystals. Patent RU 2 843 811, 2025.
- Grigorovich S.L., Phillipov E.A., B. M. A. Method for Determining Bound Water in Vitreous Boric Anhydrid. Patent SU 569917, 1977.
- Behrens, H.; Stuke, A. Quantification of H2O Contents in Silicate Glasses Using IR Spectroscopy—A Calibration Based On Hydrous Glasses Analyzed by Karl-Fischer Titration. Glas. Sci. Technol. 2003, 76, 176–189.
- Rogacheva, E. I. Non-Stoichiometry and Properties of Ternary Semiconductor Phases of Variable Composition Based on IV–VI Compounds. J. Phys. Chem. Solids 2005, 66 (11), 2104–2111. [CrossRef]
- OKUR KUTAY, H. E. Synthesis and Structural Analysis of Nonstoichiometric Ternary Fulleride K1.5Ba0.25CsC60. TURKISH J. Chem. 2020, 44 (6), 1463–1470. [CrossRef]
- Collongues, R. Nonstoichiometry in Ternary Oxides and Materials Science. Jpn. J. Appl. Phys. 1993, 32 (S3), 442. [CrossRef]
- Brejnev, V. Y. Nonstoichiometry of Crystalline CdSe, Ph.D. Thesis, Moscow Chemical Technological Institute by D.I. Mendeleev, 1985.
Figure 1.
Schematic diagram of a fragment of the P-T projection of the binary H–O system with the participation of numerous polymorphic modifications of ice [22].
Figure 1.
Schematic diagram of a fragment of the P-T projection of the binary H–O system with the participation of numerous polymorphic modifications of ice [22].
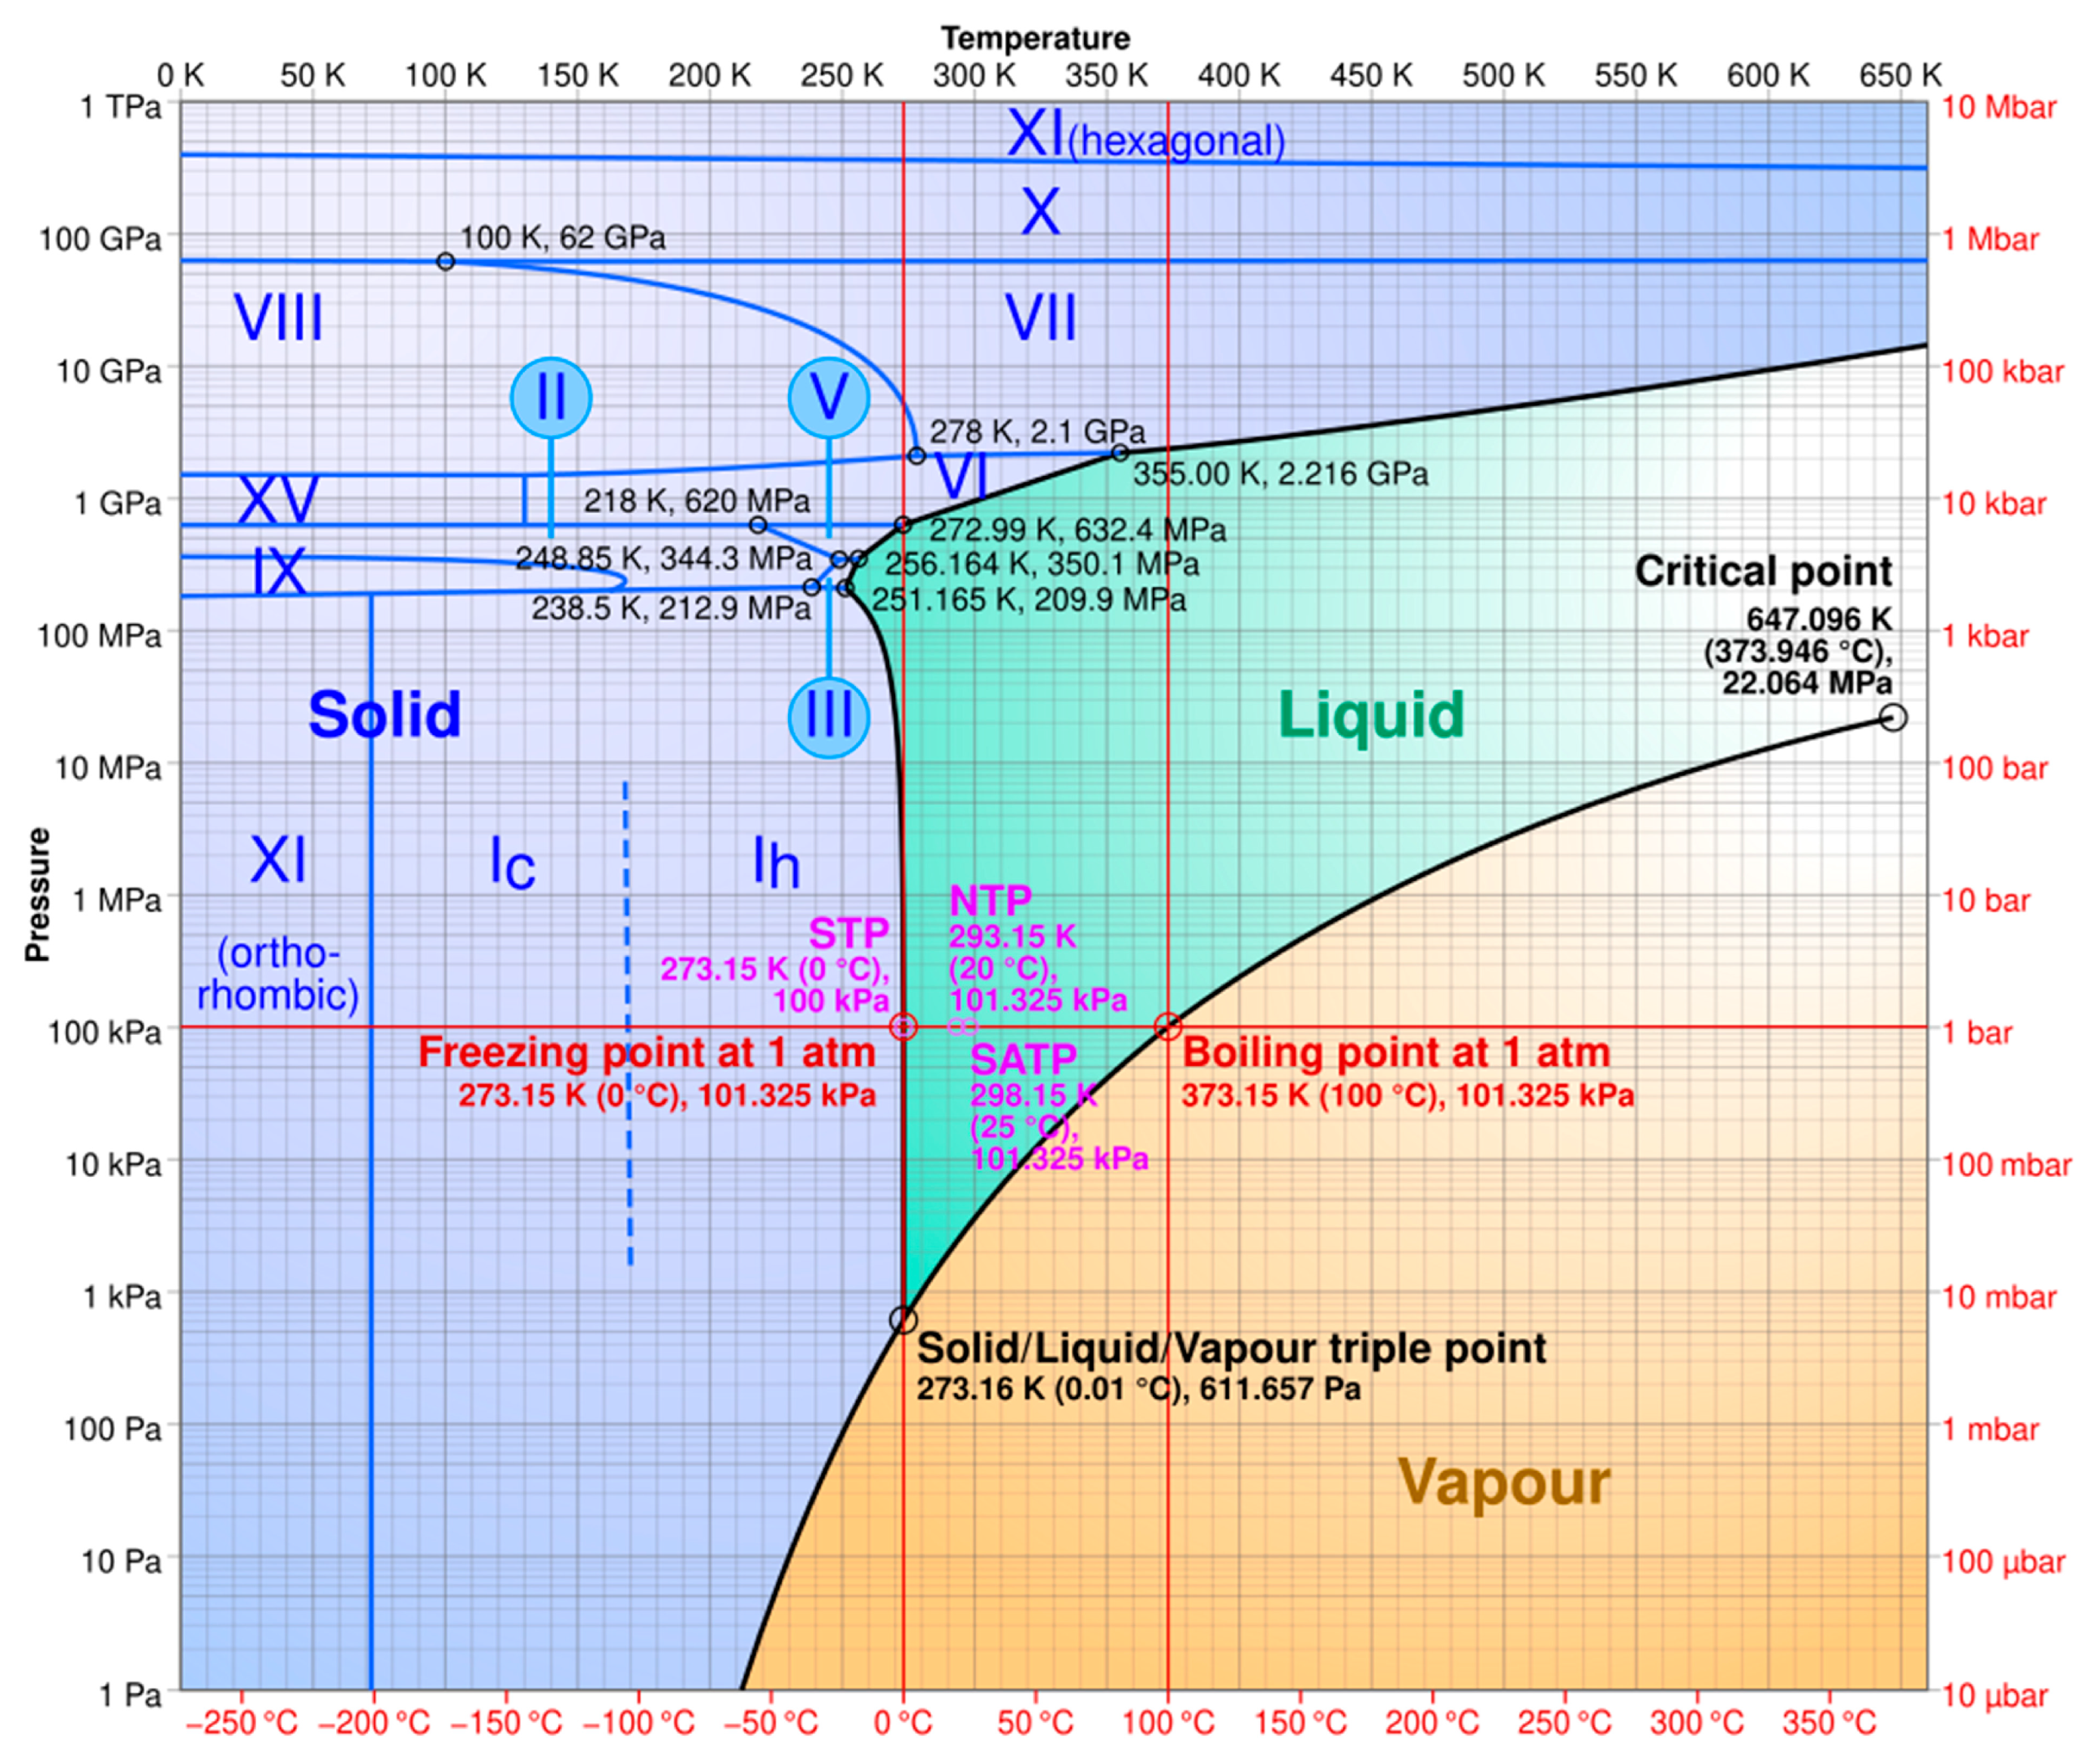
Figure 3.
T-X cross-section of the hydrogen-oxygen system at a pressure close to 105 Pa, black dots - literature experimental data, white dots - our forecast.
Figure 3.
T-X cross-section of the hydrogen-oxygen system at a pressure close to 105 Pa, black dots - literature experimental data, white dots - our forecast.
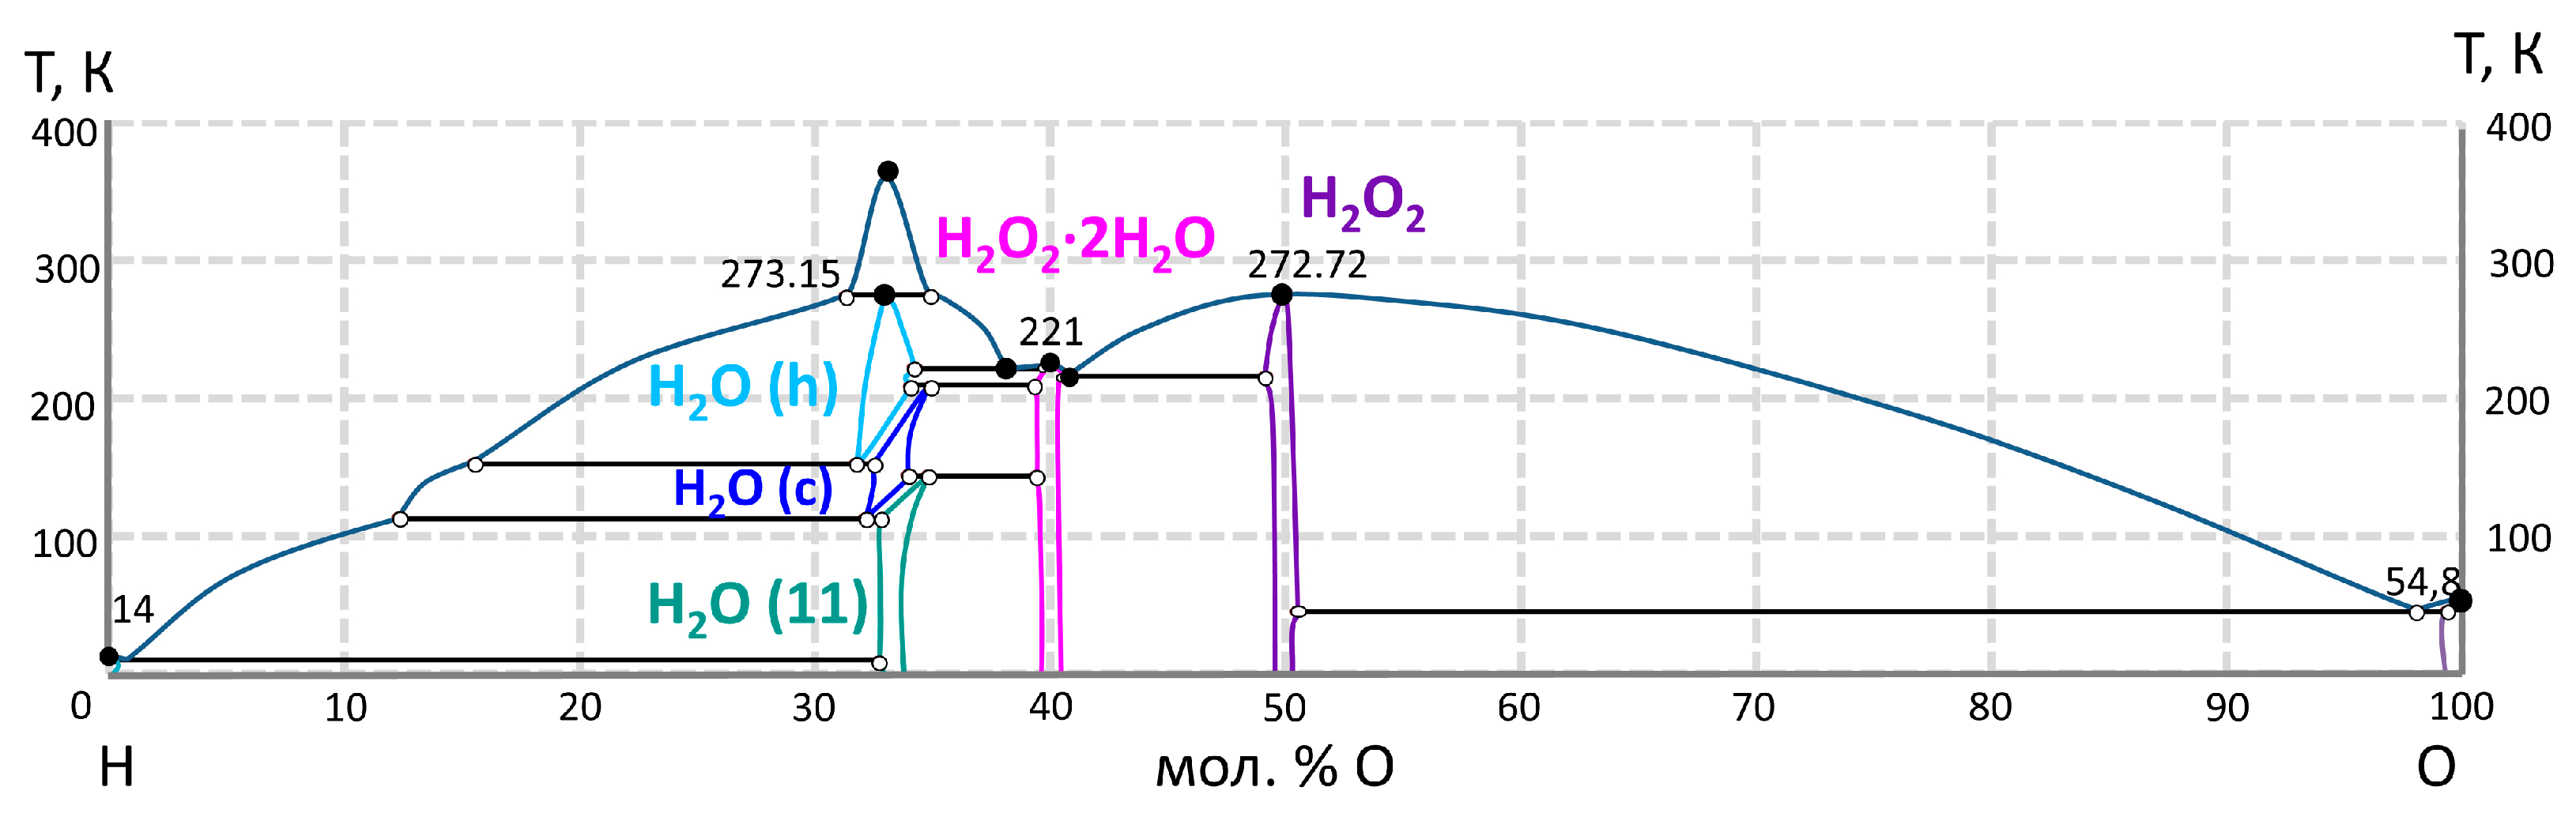
Figure 4.
T-X cross-section of the oxygen-boron system at a pressure close to 105 Pa, black dots - literature experimental data, white dots - our forecast.
Figure 4.
T-X cross-section of the oxygen-boron system at a pressure close to 105 Pa, black dots - literature experimental data, white dots - our forecast.
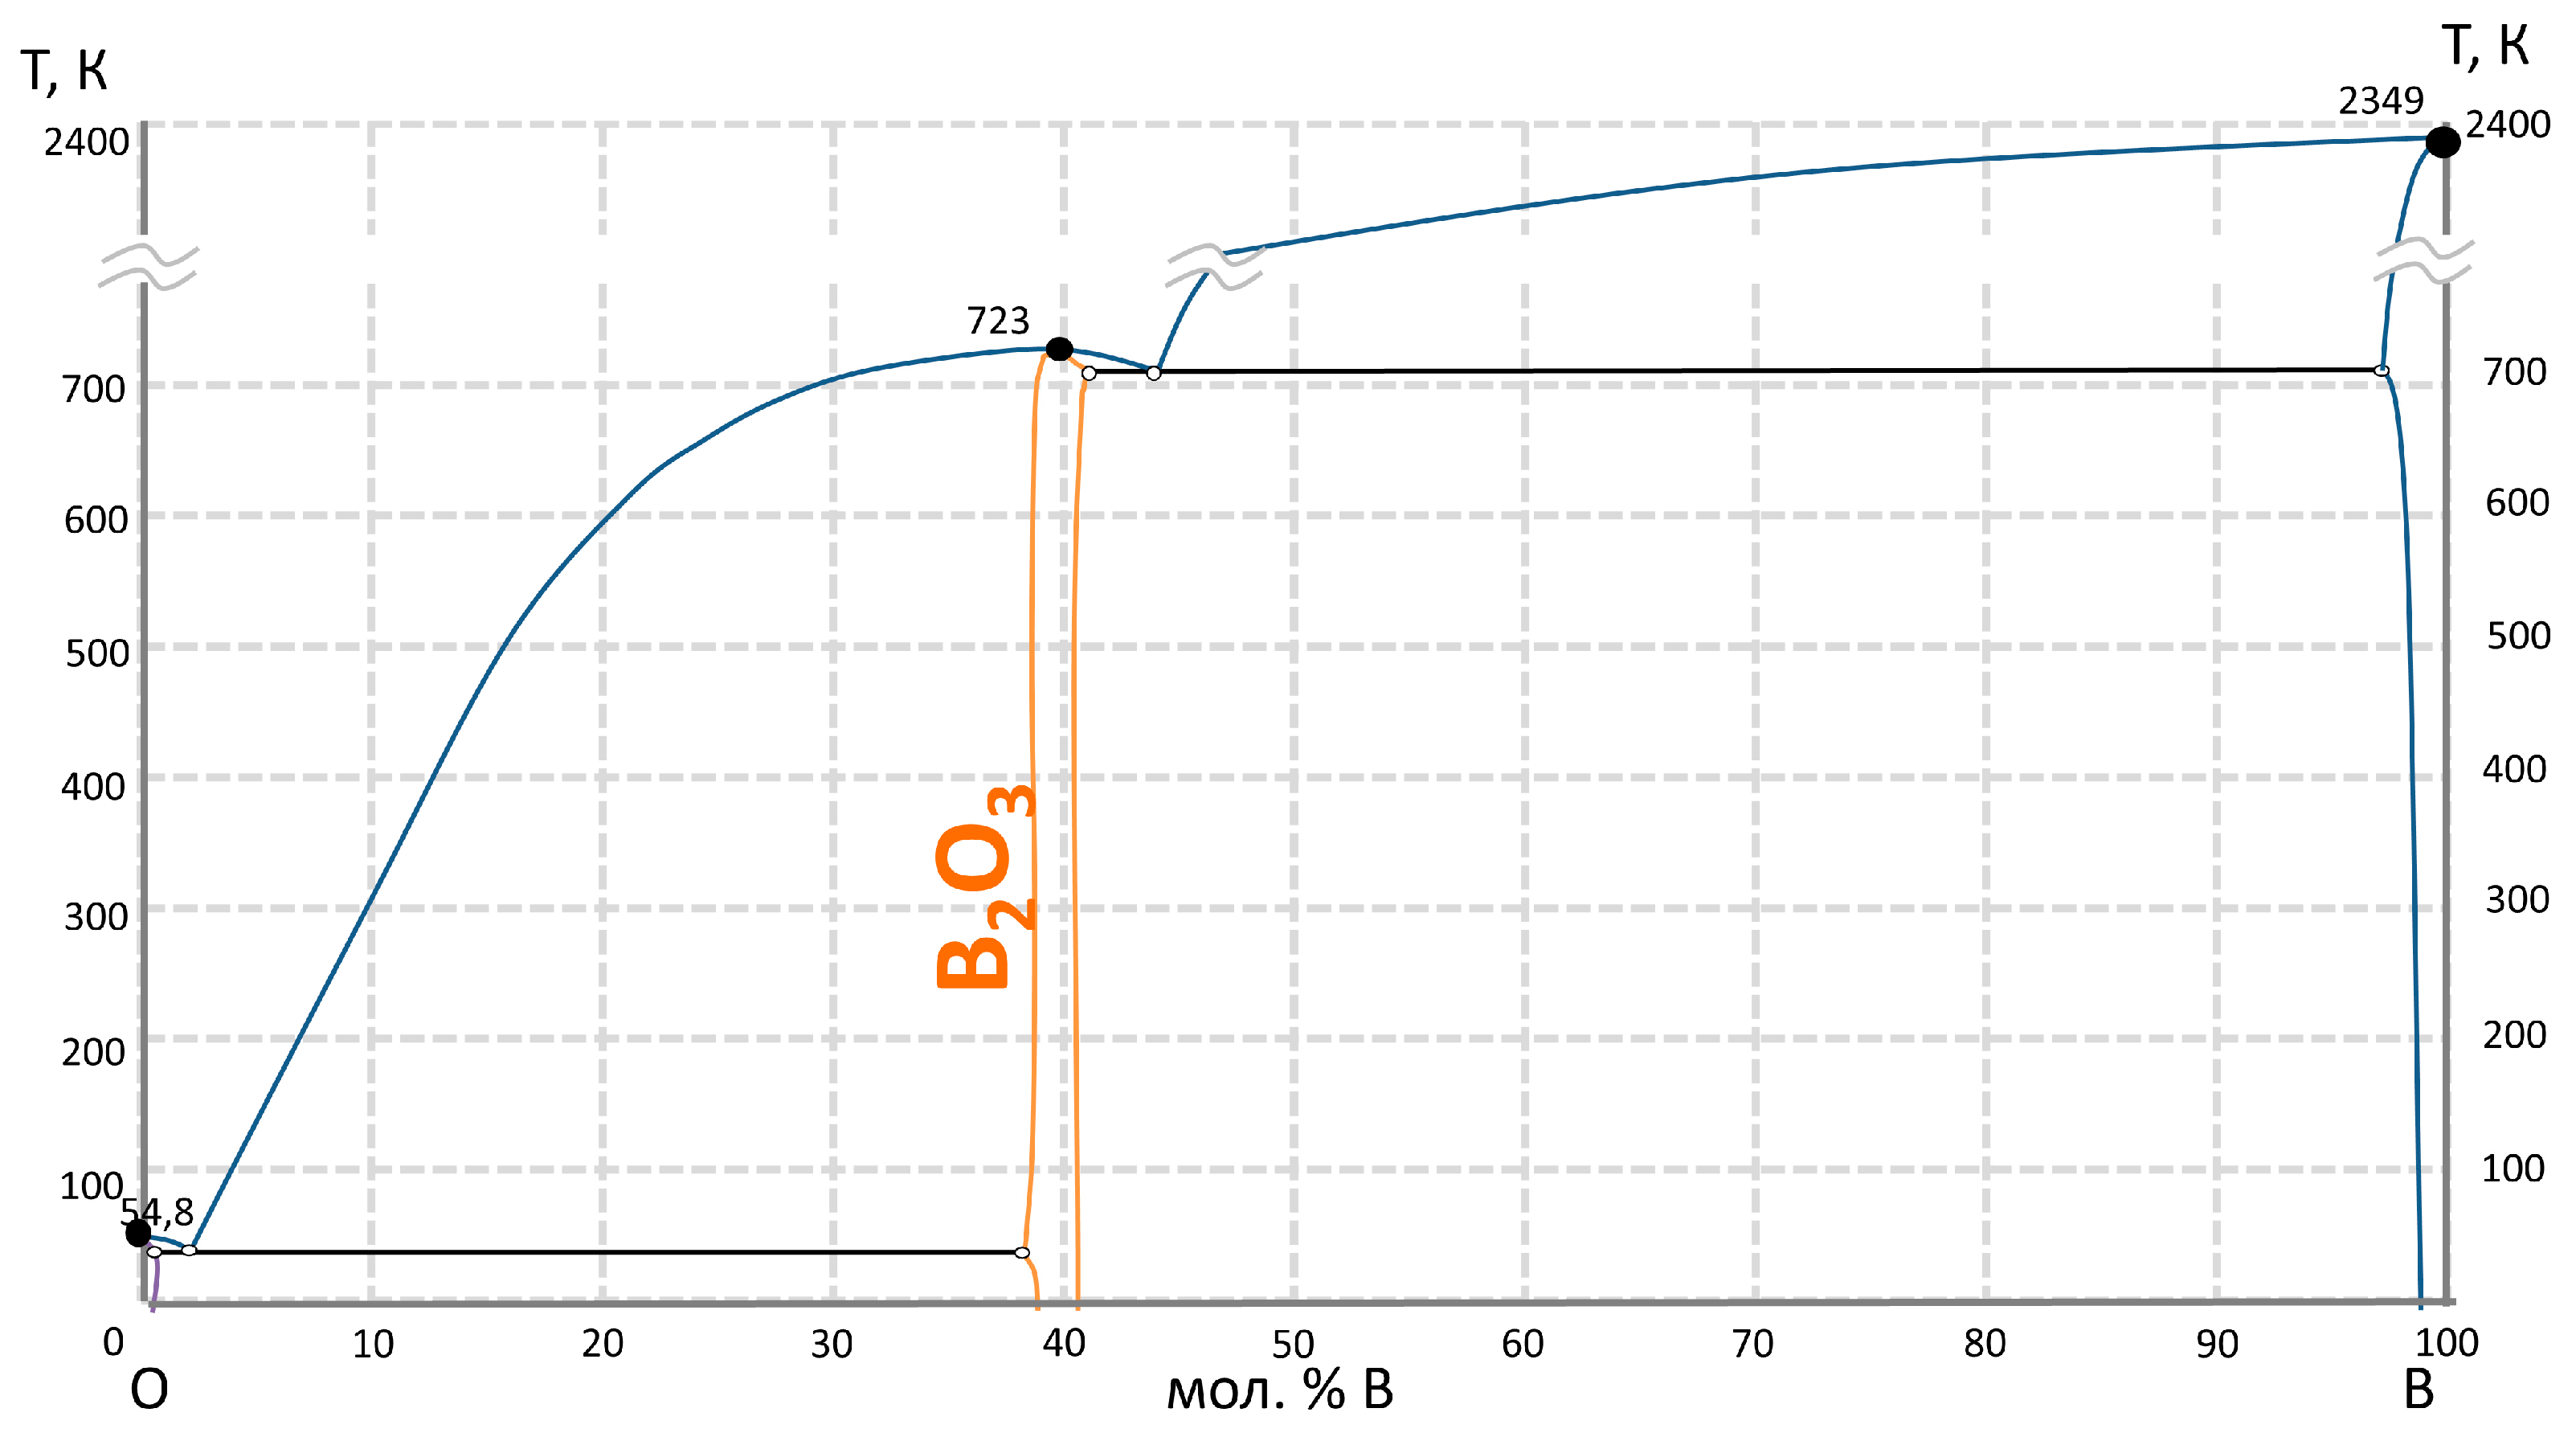
Figure 5.
T-X cross-section of the B-H system, black dots - literature experimental data, white dots - our forecast.
Figure 5.
T-X cross-section of the B-H system, black dots - literature experimental data, white dots - our forecast.
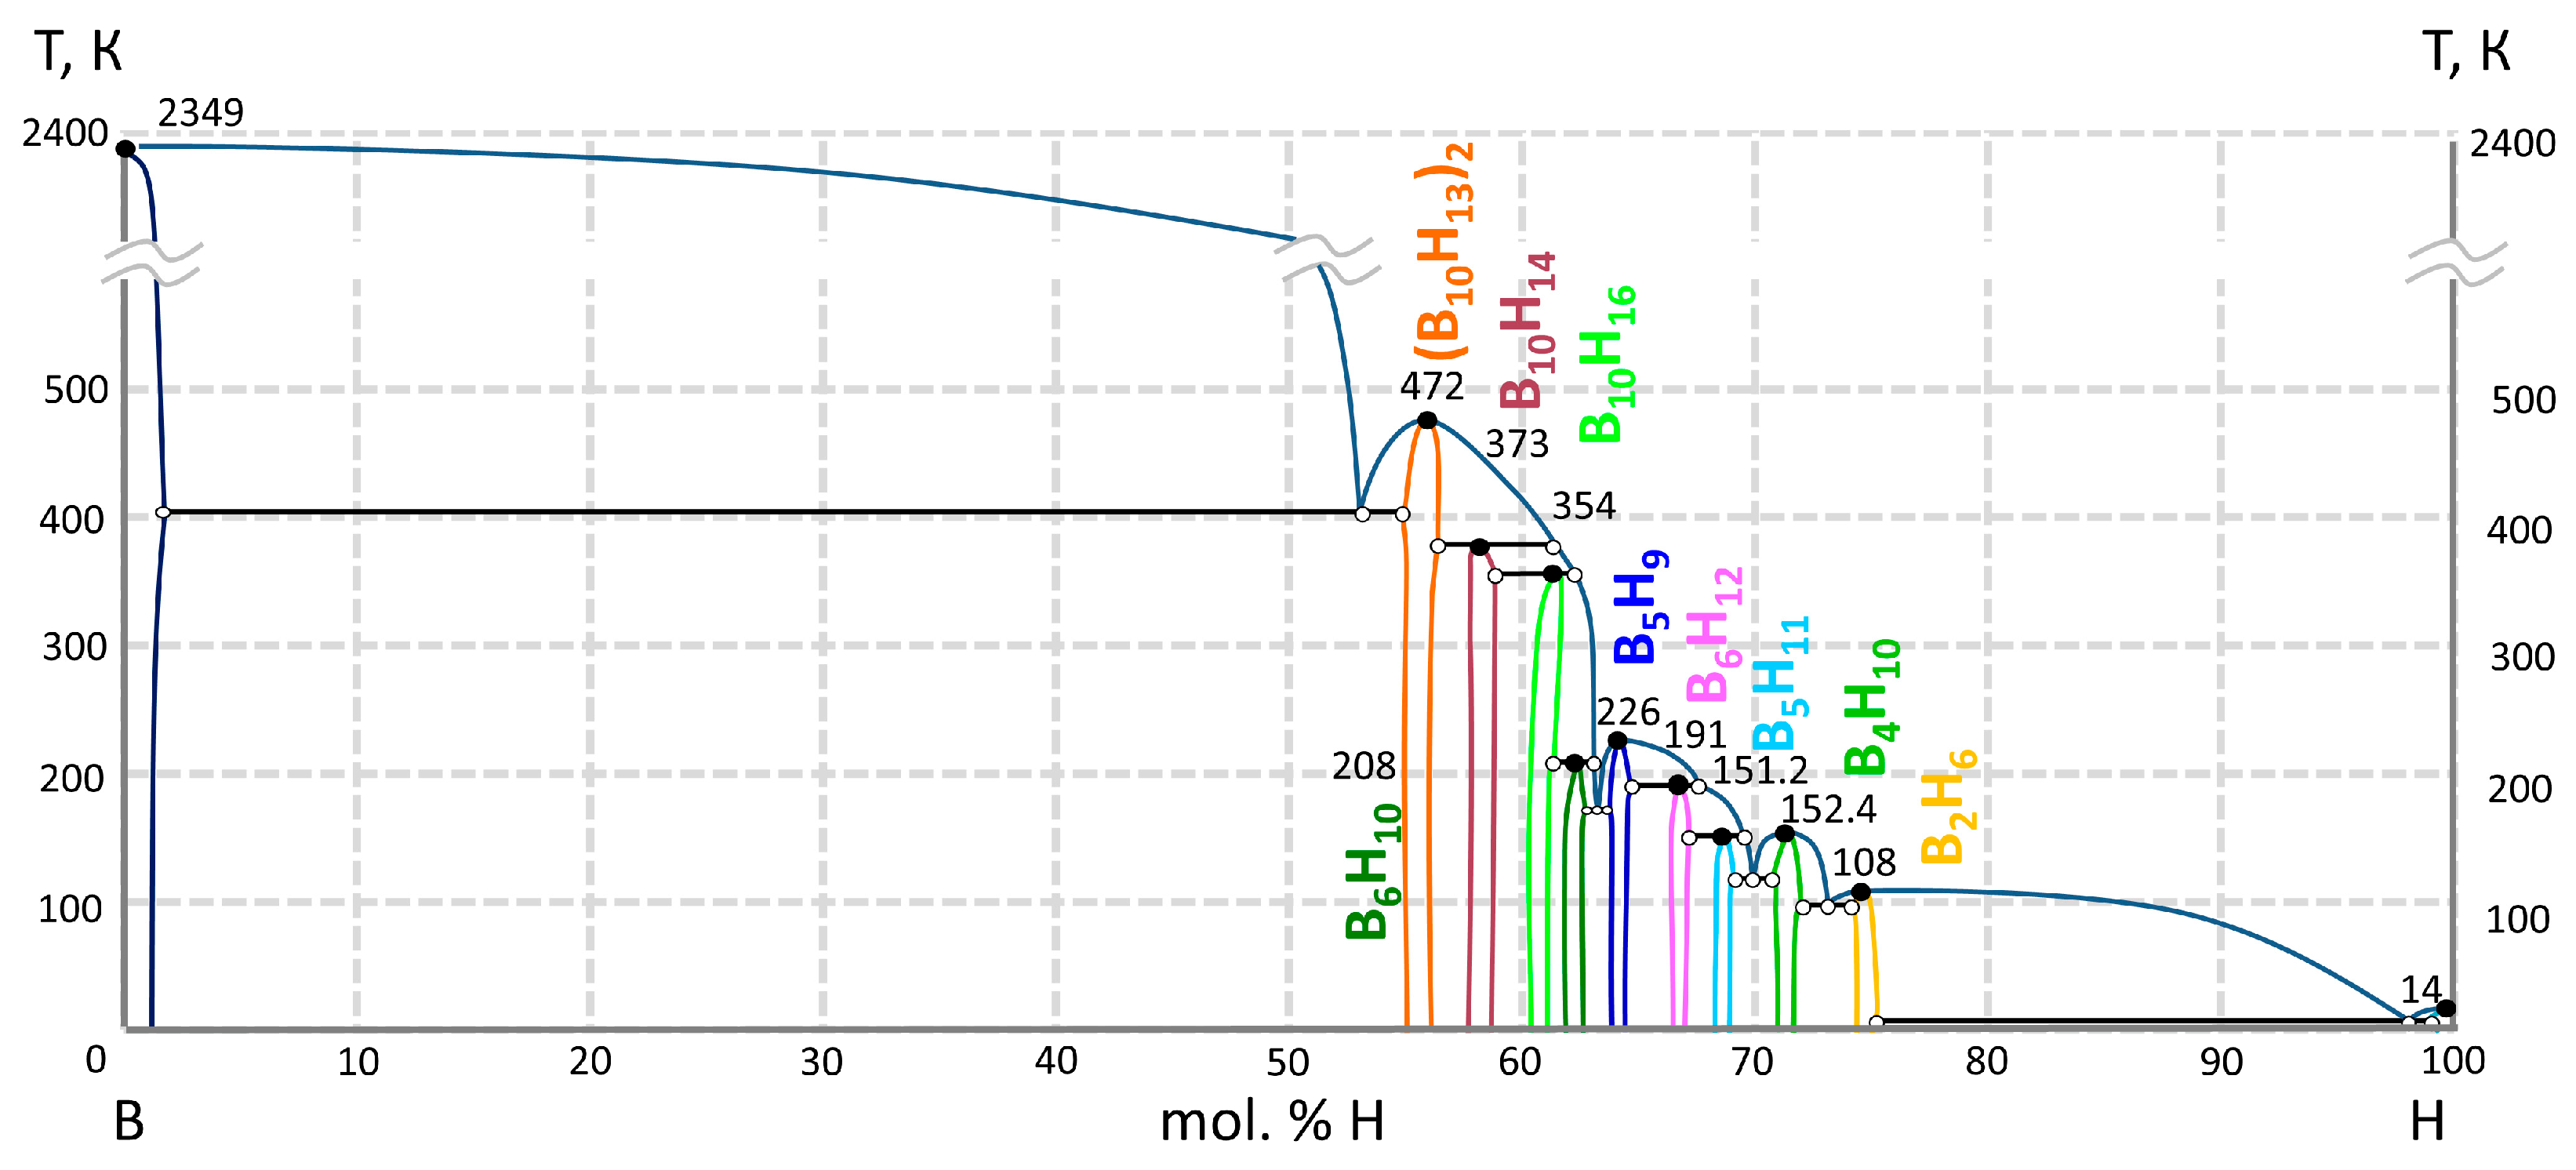
Figure 6.
T-X cross-section of the water-boron oxide system at a pressure close to 105 Pa, black dots - literature experimental data [33], white dots - our forecast.
Figure 6.
T-X cross-section of the water-boron oxide system at a pressure close to 105 Pa, black dots - literature experimental data [33], white dots - our forecast.
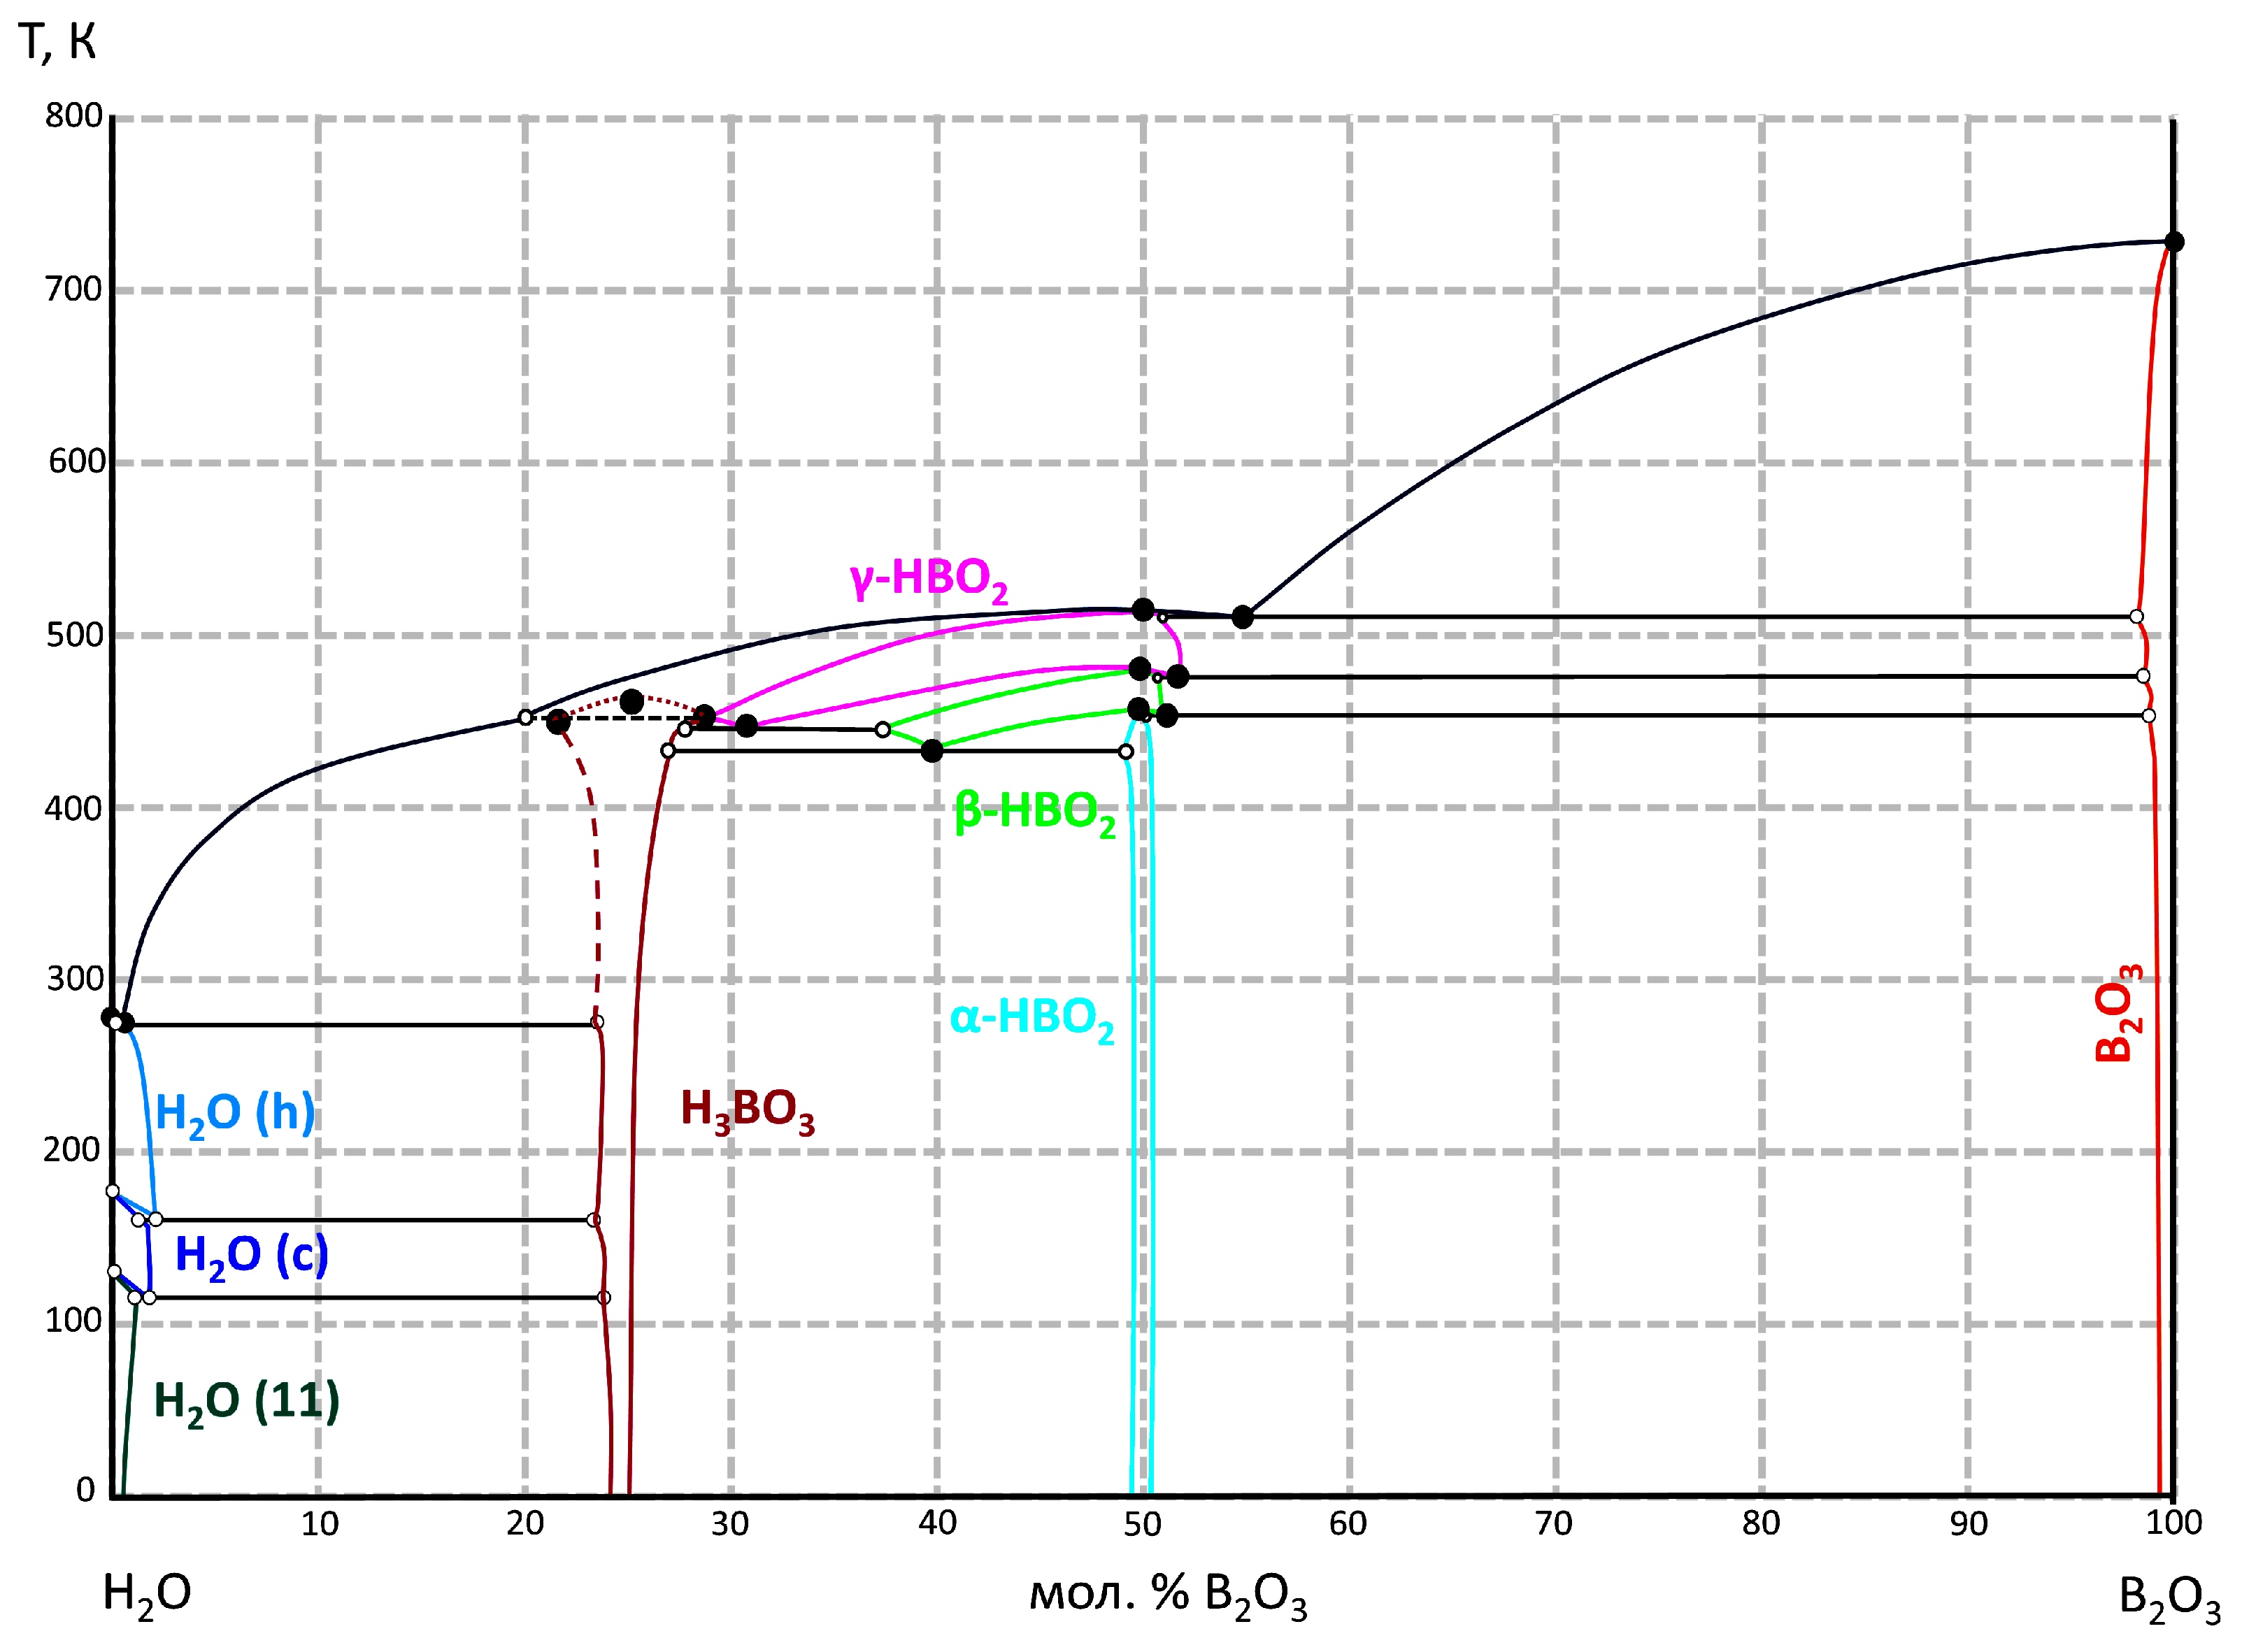
Figure 9.
The impurity composition of H3BO3 after recrystallization according to the results of ICP-MS analysis: here and below black bars – measured values, white bars – limits of determinations (LD).
Figure 9.
The impurity composition of H3BO3 after recrystallization according to the results of ICP-MS analysis: here and below black bars – measured values, white bars – limits of determinations (LD).
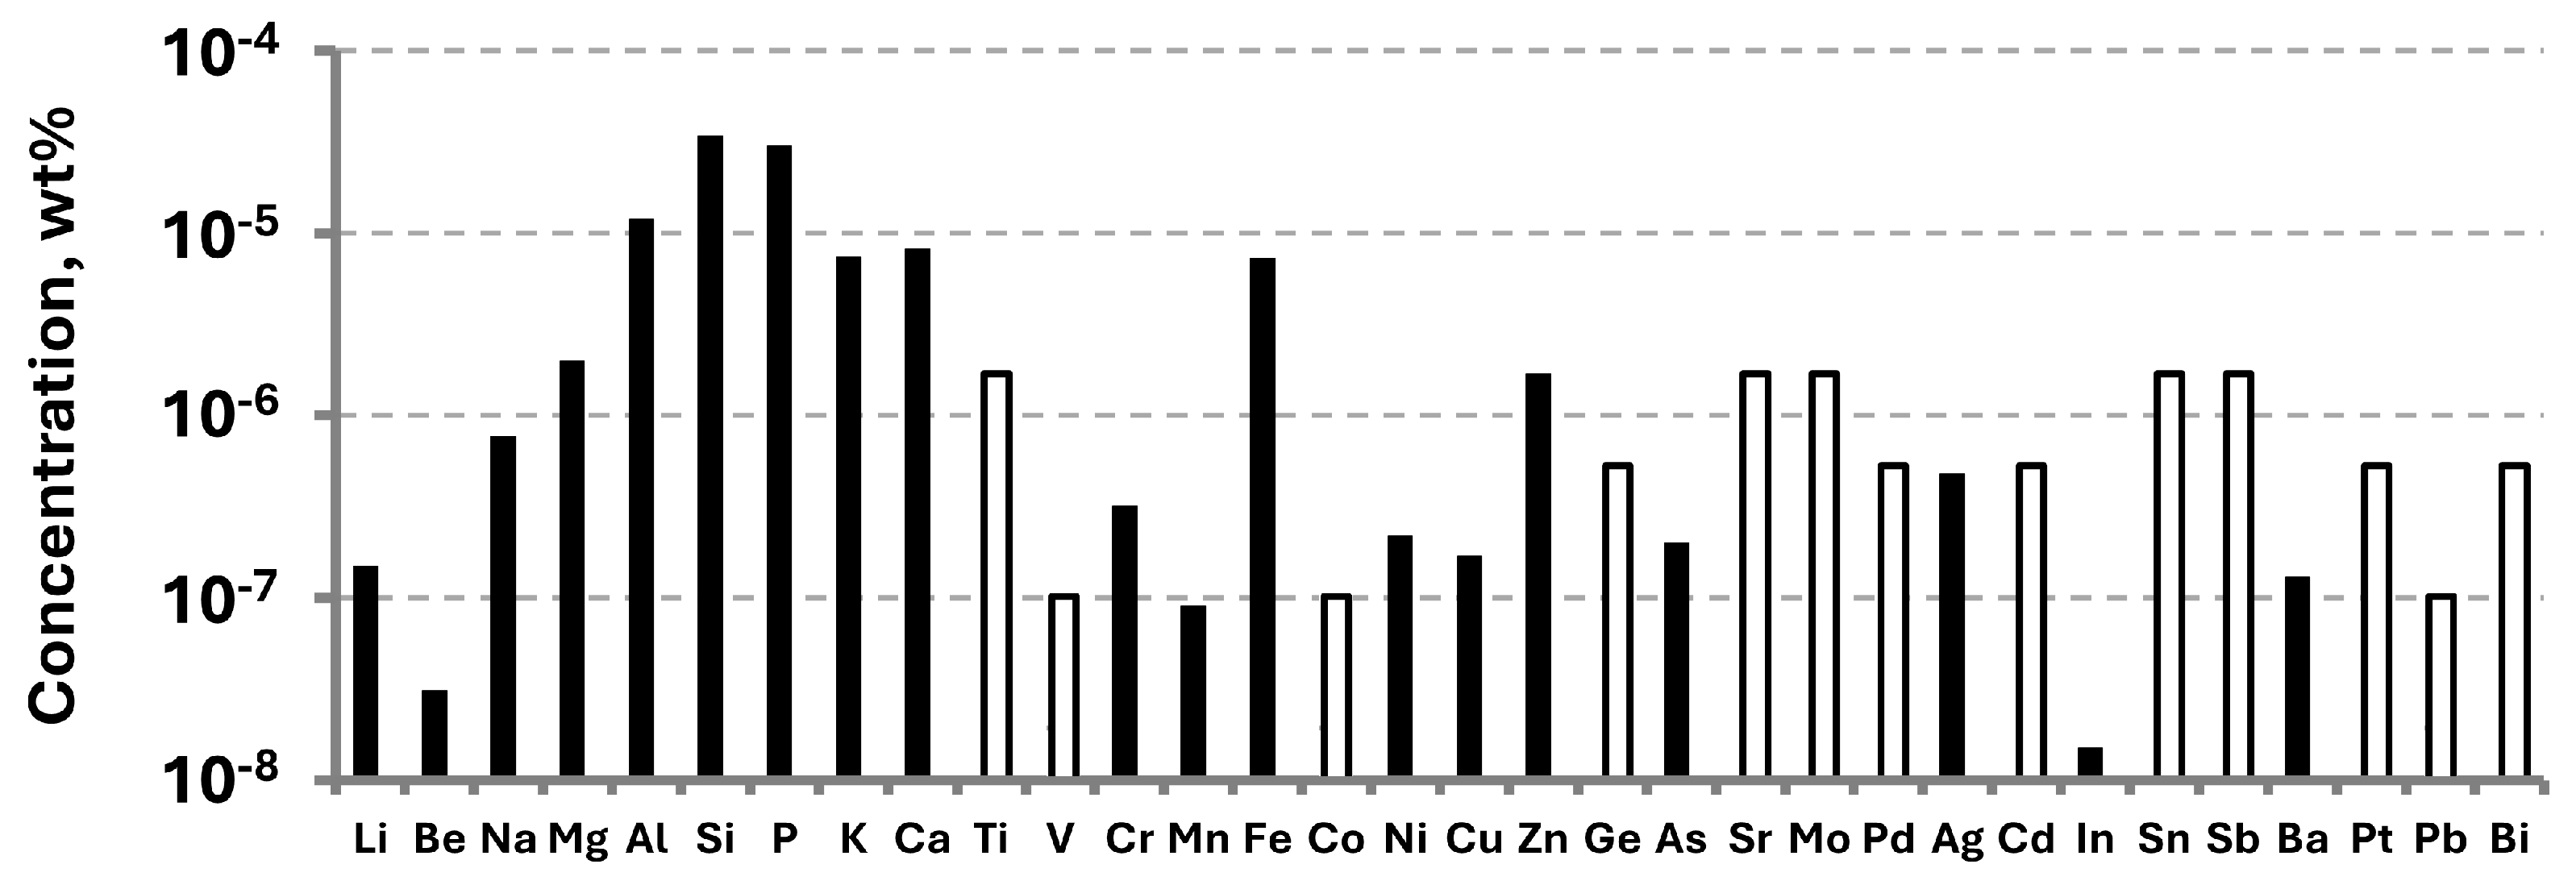
Figure 10.
Scheme of water content determination in B2O3.
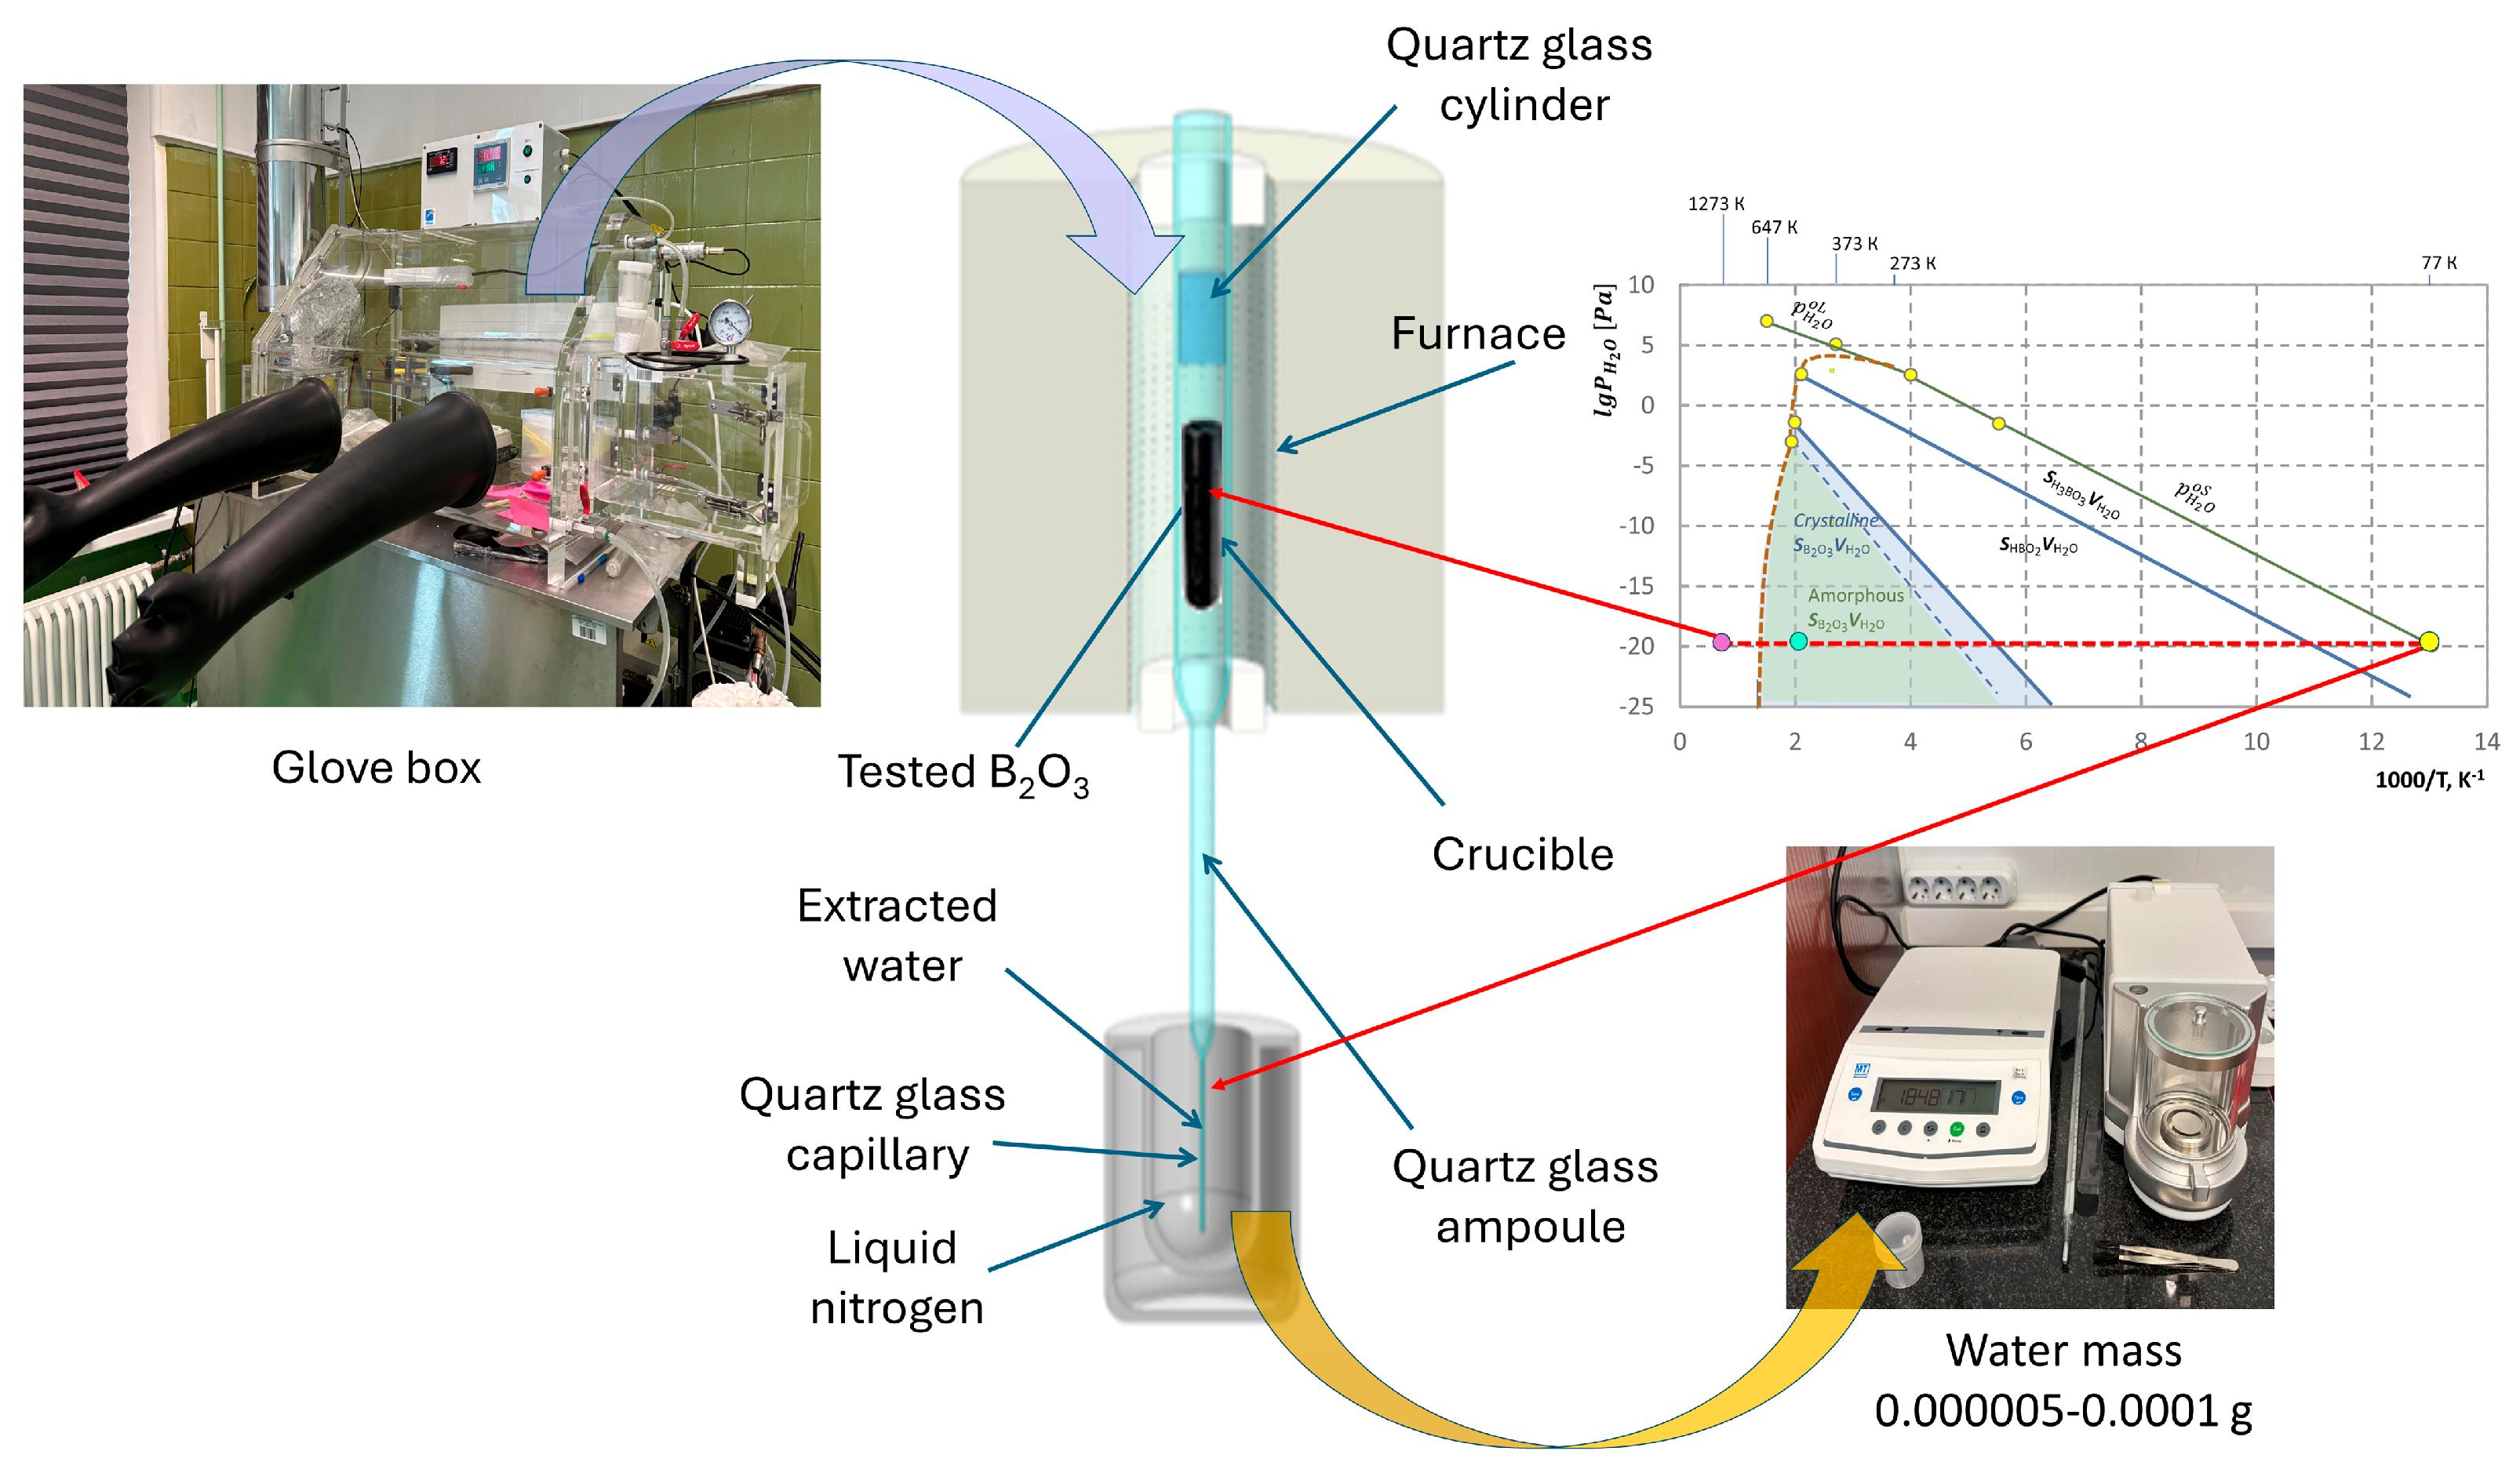
Figure 12.
Fabrication scheme of B2O3 ingots with controlled residual water content.
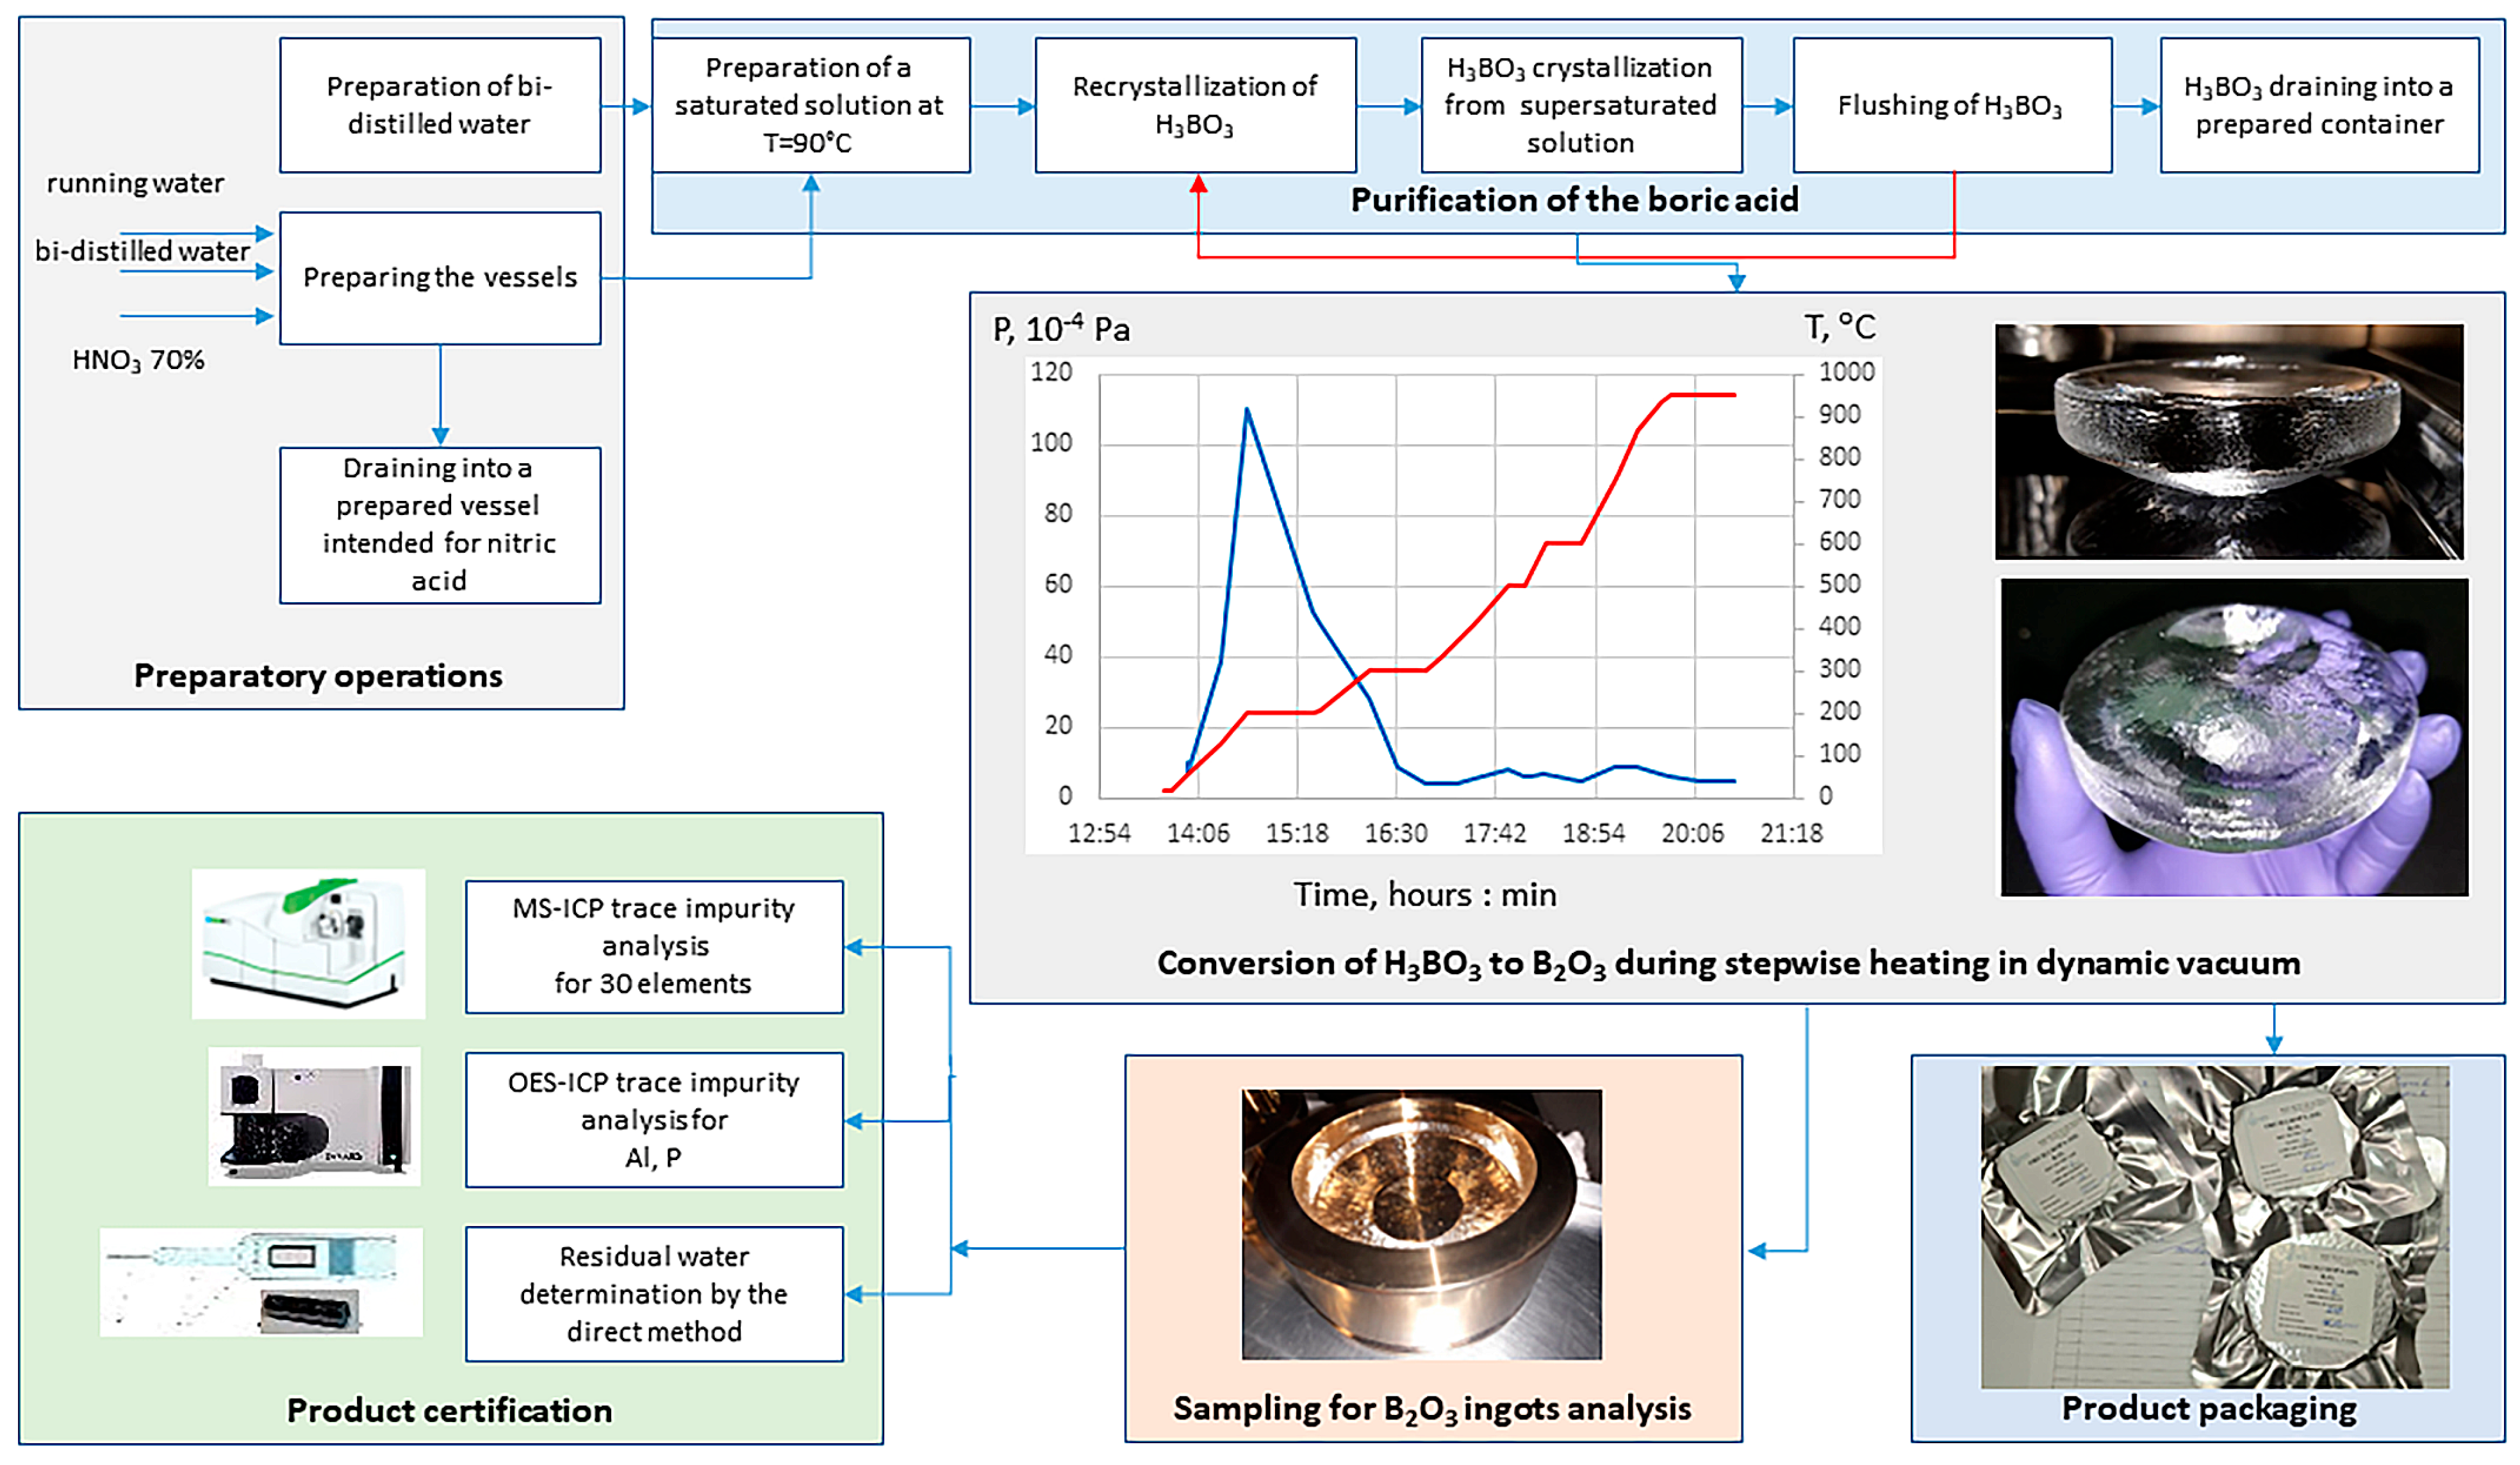
Figure 13.
Composition of impurities in B2O3 ingots, based on ICP-MS and ICP-OES analysis results.
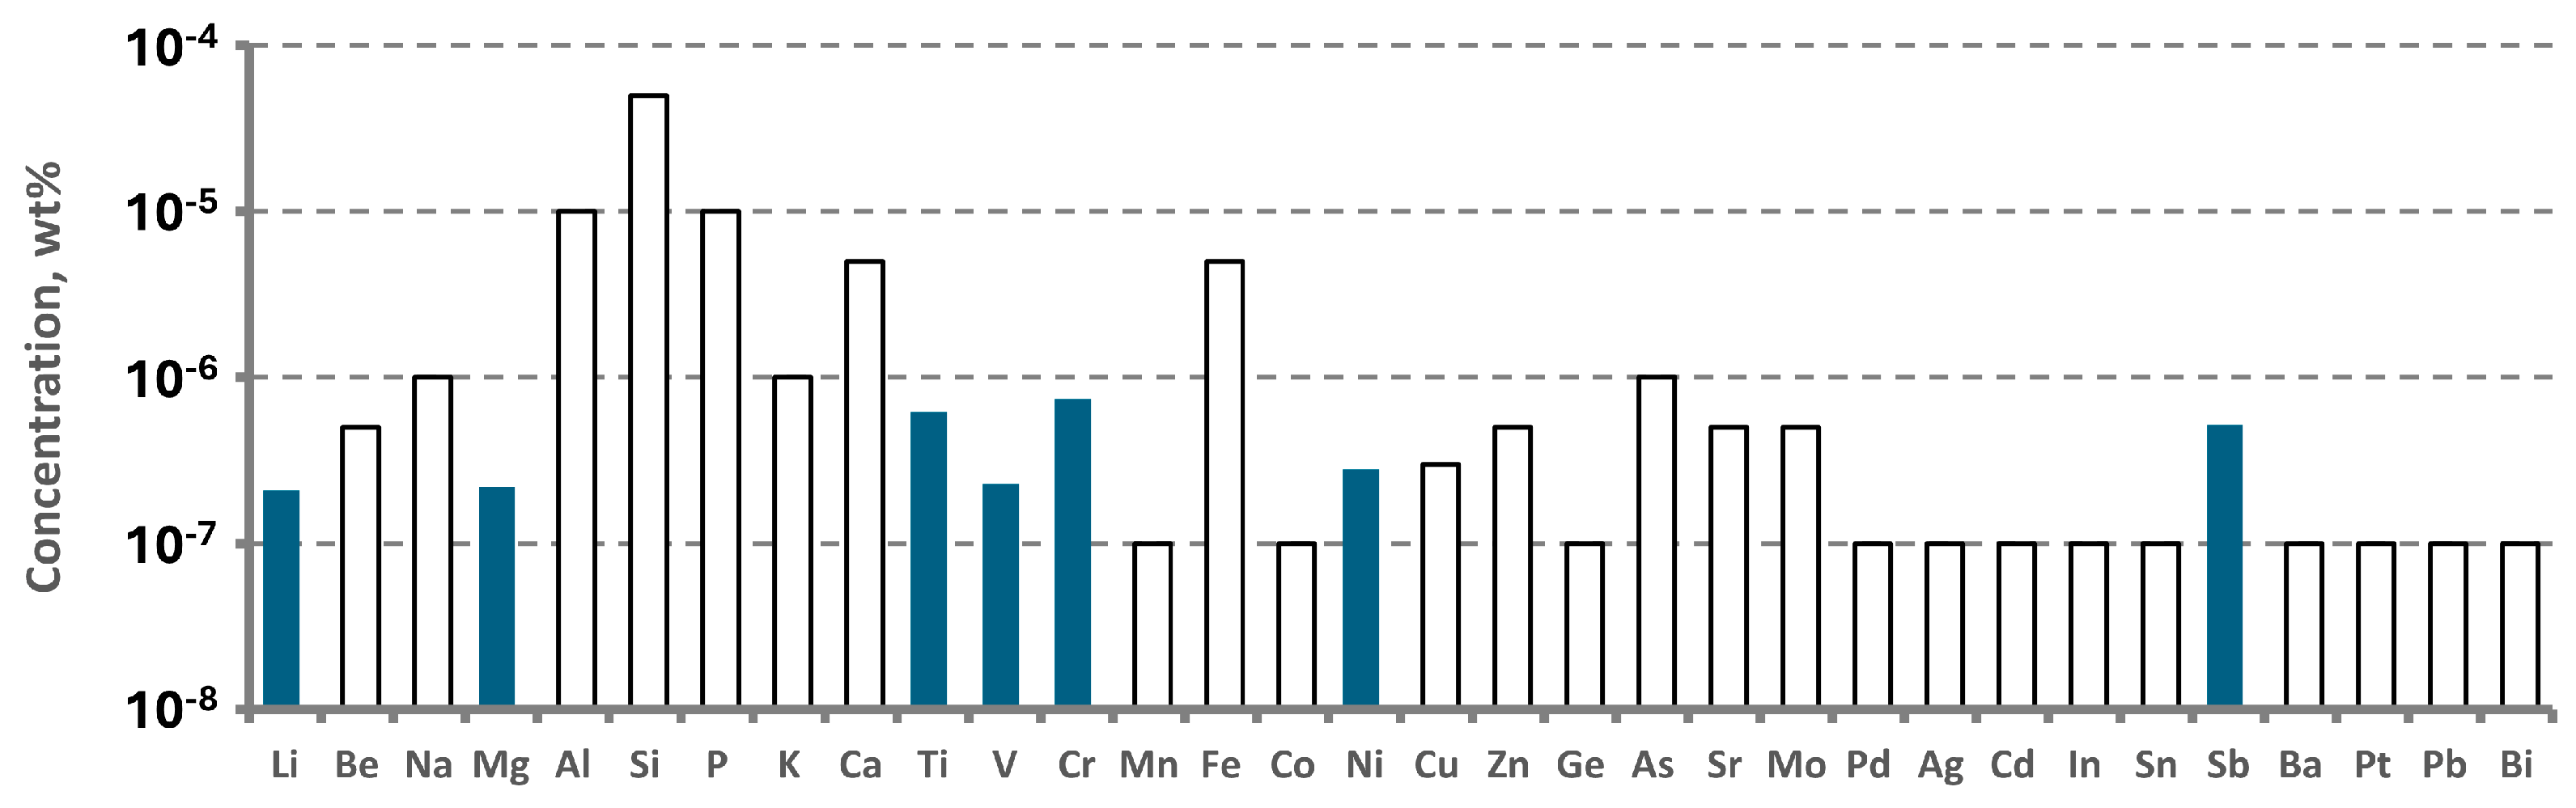
Table 1.
Monovariant equilibria in B-O-H ternary system.
| Equilibria type | T, K | Equilibria type | T, K |
| 710-485 | 437-431.6 | ||
| 508-460 | 436-435 | ||
| 508-485 | 436-365 | ||
| 490-443.1 | 435-434 | ||
| 490-444.5 | 435-365 | ||
| 485-465 | 434-431.6 | ||
| 485-445 | 434-200 | ||
| 473.5-460 | 411-360 | ||
| 473.5-465 | 411-371 | ||
| 465-442.7 | 400-360 | ||
| 465-445 | 373-371 | ||
| 460-437 | 371-210 | ||
| 460-442 | 371-210 | ||
| 448.8-437 | 365-210 | ||
| 448.8-442.7 | 365-210 | ||
| 445-436 | 360-210 | ||
| 445-444.5 | 360-210 | ||
| 444.5-435 | 354-210 | ||
| 444.5-442.9 | 273.15-260 | ||
| 444.1-442 | 272.2-214 | ||
| 444.1-443.1 | 272.2-210 | ||
| 443.1-442.9 | 230-210 | ||
| 443.1-210 | 230-211 | ||
| 442.9-442 | 221-214 | ||
| 442.9-434 | 217-211 | ||
| 442.7-210 | 214-211 | ||
| 442.7-436 | 214-210 | ||
| 437-210 |
Table 2.
Nonvariant equilibria in B-O-H ternary system.
| Equilibrium type | T, K | Equilibrium type | T, K |
|---|---|---|---|
| 485 | 437 | ||
| 465 | 436 | ||
| 460 | 435 | ||
| 445 | 434 | ||
| 444.5 | 431.6 | ||
| 443.1 | 371 | ||
| 442.9 | 365 | ||
| 442.7 | 360 | ||
| 442 | 214 | ||
| 211 |
Table 4.
Measured concentrations of residual water and OH-groups in B2O3 ingots.
| Sample ID | Water content (direct method), ppm | ОН-group content,1 ppm | Comments |
|---|---|---|---|
| CMK s.r.o. | 18 ± 2 | 168 ± 10 | Certificate of CMK, “water content 169 ppm” |
| CMK s.r.o. | 28 ± 4 | 320 ± 20 | Certificate of CMK, “water content 350 ppm” |
| MUCTR-1 | 17 ± 2 | 140 ± 15 | |
| MUCTR-2 | 32 ± 3 | 371 ± 25 | |
| MUCTR-3 | 48 ± 12 | 1360 ± 30 | |
| MUCTR-4 | 41 ± 10 | 1936 ± 38 | |
| MUCTR-5 | 65± 11 | 1772 ± 53 | |
| MUCTR-6 | 162± 17 | 1850 ± 75 | |
| MUCTR-7 | 250± 24 | 2644 ± 85 |
1 Calculated from IR spectroscopy data using Eq. (8).
Disclaimer/Publisher’s Note: The statements, opinions and data contained in all publications are solely those of the individual author(s) and contributor(s) and not of MDPI and/or the editor(s). MDPI and/or the editor(s) disclaim responsibility for any injury to people or property resulting from any ideas, methods, instructions or products referred to in the content. |
© 2026 by the authors. Licensee MDPI, Basel, Switzerland. This article is an open access article distributed under the terms and conditions of the Creative Commons Attribution (CC BY) license (http://creativecommons.org/licenses/by/4.0/).
Copyright: This open access article is published under a Creative Commons CC BY 4.0 license, which permit the free download, distribution, and reuse, provided that the author and preprint are cited in any reuse.