

Submitted:
11 November 2026
Posted:
12 November 2026
You are already at the latest version
Abstract
The debate over whether renewable energy can sustain AI growth relies on demand figures whose origin is rarely examined. We compare open, facility-level records with agency estimates for China, Japan, South Korea and the United States, using the Epoch AI GPU-cluster register (338 clusters), the International Energy Agency, Lawrence Berkeley National Laboratory, South Korea's 11th Basic Plan for Electricity Supply and Demand, and Ember generation data. In 2024, visible load covers 3.8–6.3% of agency-estimated data-centre demand in the United States, 1.4–2.3% in China, at least 0.8–1.3% in Japan and at most 2.6% in South Korea. Data-centre growth absorbs 4–34% of observed wind and solar additions under agency estimates but only 0.13–1.0% under visible load, a ratio of 31 to 53. Reference estimates for China diverge by a factor of 2.6 (100 versus 260 TWh in 2024). The verdict on whether clean power keeps pace with AI therefore depends on what can be observed: while 92–99% of the load remains invisible in open registers, no stable answer is possible. We propose a minimum reporting standard for data-centre electricity.
Keywords:
data centres
; artificial intelligence
; electricity demand
; renewable energy
; energy statistics
; East Asia
2 Universidad del Alba, Santiago, Chile
3 Instituto Profesional IACC, Santiago, Chile
1. Introduction
1.1. Context
The debate over whether renewables can sustain AI growth depends on demand figures whose origin is rarely examined. Data centres consumed roughly 415 TWh worldwide in 2024 (IEA, 2025). Yet global estimates for 2020 range from 196 to 1,200 TWh, a factor of six (Wang, Han and Wei, 2026). This divergence is not a technical detail. It decides whether AI is framed as a marginal or a structural challenge to clean energy (Henni and Mohammed, 2026). We therefore treat the demand figure itself as an object of study.
1.2. Why East Asia
China, Japan and South Korea combine rapid data-centre expansion, ambitious renewable targets and some of the least transparent reporting on data-centre electricity. The IEA acknowledges “substantial data gaps” for China (IEA, 2025, p. 57). South Korea’s 11th Basic Plan reports data-centre demand only in GW of peak demand (MOTIE, 2025). For Japan, the IEA gives only an upper bound (“less than 20 TWh”). These three countries offer a demanding test case. If visibility is low where information is scarcest, the global picture is unlikely to be better.
1.3. Gap
Existing studies compare global rates or model a single country. None measures how much of the load is observable, or whether the verdict changes with observability. Henni and Mohammed (2026) work at the global level. Yoo, Choi and Kim (2026) review the literature and call for transparency without measuring it. Single-country studies include Lin and Zhou (2026), Wang et al. (2026), Onodera, Shiraki and Matsuhashi (2026) and Heo, Kim and Choi (2026). The missing measurement is precisely the one we provide.
1.4. Question
We ask what fraction of data-centre electricity demand is visible in open, facility-level registers in China, Japan and South Korea, with the United States as a reference. We also ask whether the verdict on wind–solar headroom changes with the load that is observed.
1.5. Contribution
We make three contributions. First, to our knowledge, we provide the first country-by-country measurement of load visibility. Second, we show that the share of observed wind–solar growth absorbed by data centres differs by a factor of 31 to 53 depending on the source. Third, we document the divergence of Chinese references (a factor of 2.6) and the reporting gaps in Japan and South Korea. Together these contributions reframe the AI–renewables debate as a measurement problem.
1.6. Structure
Section 2 reviews how demand is estimated and what country studies find. Section 3 defines the visible load, the conversion to energy, the denominators and the headroom measure. Section 4 reports visibility, reference divergence and headroom. Section 5 discusses implications for planning and transparency. Section 6 states limitations, and Section 7 concludes.
2. Background and Related Work
2.1. How Data-Centre Demand Is Estimated
Different estimation approaches coexist and produce very different numbers. Bottom-up national studies combine the installed base and shipments of servers, storage and network equipment with assumptions on power draw and facility efficiency. With this approach, Shehabi et al. (2024) report 76 TWh for the United States in 2018, rising to 176 TWh in 2023, or 4.4% of national consumption. International agency estimates, such as IEA (2025), model consumption across countries and regions. National series for less transparent markets are often reconstructed from secondary sources: Wang et al. (2026) report 161 TWh for China in 2018, following a series first produced by Greenpeace East Asia and North China Electric Power University. The resulting uncertainty is large. Reviewing the literature, Wang, Han and Wei (2026) find global estimates for 2020 that range from 196 to 1,200 TWh and call for accurate energy-use statistics. These approaches are not interchangeable, and the choice among them shapes any comparison with renewable supply.
2.2. AI and Renewables
Recent literature raises the possibility of a structural mismatch between AI-driven demand growth and renewable deployment. It measures this mismatch with global aggregates. Henni and Mohammed (2026) argue that AI training compute has grown by several orders of magnitude while renewable capacity grows at 10–20% per year. Yoo, Choi and Kim (2026), reviewing 88 studies, conclude that renewables can meet AI-driven demand “only conditional on” accelerated deployment, hourly matching and transparent reporting. Neither study measures how much of the load is observable. That is the gap we address.
2.3. Country Evidence in East Asia
Studies of China, Japan and South Korea are scenarios, siting analyses or optimisation exercises. They are not measurements of observable load. For China, Li et al. (2023) review green data-centre policies, Lin and Zhou (2026) use LEAP scenarios, Zhang, Li and Wang (2025) assess the “Eastern Data, Western Computing” initiative, Zhou et al. (2026) trace carbon flows embodied in cross-regional computing transfers, Yang, Zhou and Niu (2026) map large data centres from satellite and point-of-interest data, and Lin and Wei (2026) examine how power-market reform affects AI investment. For Japan, Onodera, Shiraki and Matsuhashi (2026) analyse siting. For South Korea, Heo, Kim and Choi (2026) and Shin, Kim and Choi (2026) study electricity procurement, siting and demand response, while Byeon et al. (2026) decompose emissions from AI service companies. None of these studies quantifies the share of load that is visible in open registers.
2.4. Open Compute Registers
Open compute registers, particularly the GPU-cluster database of Epoch AI (2026), make AI infrastructure publicly traceable, but they have not been compared with agency estimates of electricity demand. Epoch AI (2026) documents roughly 500 GPU clusters, estimates power as chip TDP × number of chips × 1.82 × PUE, and publishes Chinese systems in anonymised form with rounded values. By its own assessment, the register covers 10–20% of GPU-cluster computing power as of early 2025, less than 4% of Google’s TPUs, and about 2% of NVIDIA chips designed for the Chinese market. This register fills a gap in AI tracking but not in energy statistics. Our contribution is to bring the two into the same frame.
3. Data and Methods
3.1. Visible Load
The numerator of our visibility measure is the electricity demand of data-centre clusters listed in an open, facility-level register. We downloaded the Epoch AI (2026) “Data on GPU clusters” dataset (CC BY) on 11 November 2026. We kept clusters with status “Existing” and certainty “Confirmed” or “Likely”, removed possible duplicates, required a first operational date, and restricted the sample to the four countries. This gives 338 clusters: China 184, United States 117, Japan 25, South Korea 12. Of these, 139 clusters in China, 115 in the United States, 25 in Japan and 10 in South Korea report a power figure. That power is our visible capacity, which we turn into energy in the next subsection. The register covers frontier AI clusters and part of the inference and cloud infrastructure. It is not a census of all data centres, and we return to this point in the limitations.
3.2. Energy Conversion and Sensitivity
We convert power to annual electricity with TWh = MW × 8,760 h × utilisation, using utilisation values of 0.6, 0.8 and 1.0 and reporting the resulting range. We add no separate PUE multiplier, because Epoch AI (2026) power figures already include system overhead and PUE. When power is missing, we impute the country median of MW per H100-equivalent (35 clusters in China, 1 in the United States). We use this imputation only as an upper bound on visibility, never as a central estimate. The conversion is simple on purpose: any reader can recompute every share from the reported MW and the agency denominators.
3.3. Agency Denominators
Table 1 gives the agency and national reference figures we use as denominators, with the direction of each bound. Japan is reported by the IEA as “less than 20 TWh”, so the calculated visibility is a lower bound. South Korea’s 11th Basic Plan reports only the increment of peak demand above the model trend (0.5 GW in 2025), so the calculated visibility is an upper bound and is computed in power terms. For China we use two references: the IEA’s ≈100 TWh and the 260 TWh series of Wang et al. (2026). This lets us test whether the verdict depends on the denominator. For the United States we use the LBNL estimate for 2023 (176 TWh; Shehabi et al., 2024) and the IEA estimate for 2024 (≈180 TWh). These choices are not neutral: they set the scale against which visibility is judged.
3.4. Wind–Solar Headroom
We define the wind–solar headroom absorbed by data centres as the change in data-centre demand divided by the change in wind and solar generation over the same period, using Ember (2026) generation data. Panel A uses observed changes: the United States 2018–2023 (Shehabi et al., 2024) and China 2019–2024 (Wang et al., 2026), plus an IEA-implied series for China that derives the 2019 level from the IEA’s ≈15% annual growth (100/1.15⁵ ≈ 49.7 TWh). Panel B uses official projections: Japan +15 TWh between 2024 and 2030 (IEA, 2025) against six years of wind and solar additions at the 2019–2025 average pace, and South Korea +1.8 GW of peak demand between 2025 and 2030 (MOTIE, 2025), converted with a load factor of 0.7 (sensitivity 0.5–0.9), against five years at the same pace. Visible changes use utilisation = 1. Panel B is labelled as projected, not observed.
3.5. Hypotheses and Reproducibility
We test four hypotheses, each with a rejection rule fixed before estimation. H1 states that visible load is below 10% of agency-estimated load in every country; it is rejected if any country exceeds 10% at the upper end of the utilisation range. H2 states that East Asia is less visible than the United States; it is rejected if any East Asian country reaches the lower bound of US visibility in the main specification (2024, without imputation). H3 states that the Chinese references diverge by more than a factor of two; it is rejected if their ratio is below two. H4 states that the share of wind–solar growth absorbed by visible load is below 1% and that the agency-based share is at least five times larger; it is rejected if the ratio is below five. Results that hold in the main specification but not in robustness checks are reported as fragile. Scripts 01–04, a manifest with SHA-256 checksums and a replication package in the supplementary material support reproducibility.
3.6. Use of AI Tools
Claude (Anthropic; model Opus 5.5) was the only AI tool used in this study. It was used to search and verify sources, to write the download and analysis code, to produce the tables and figures, to assist in drafting the manuscript text from the author’s design, data and analysis, and for critical review. It was used to improve efficiency and reproducibility. The author revised the text, checked all figures against the script outputs, verified every reference against its primary source, and takes full responsibility for the content.
4. Results
4.1. How Much of the Load Is Visible
In no country do open registers see more than a small fraction of the load estimated by agencies. Table 2 and Figure 1 present the shares for 2024 with utilisation 0.6–1.0. The United States shows 3.80–6.33%, China 1.40–2.34% (0.54–0.90% with the 260 TWh denominator, up to 7.57% with imputation), Japan 0.79–1.32% (a lower bound), and South Korea at most 2.55% (2025 clusters against the 2025 increment, an upper bound). H1 is supported even under imputation. The result does not hinge on a single denominator: across all references, the visible share remains in the single digits.
East Asia Versus the United States (H2): A Fragile Result
H2 holds in the main specification but is not robust. In the same-year 2024 comparison without imputation, the highest East Asian share (2.55%) lies below the lower bound for the United States (3.80%). The comparison fails with imputation (China 7.57%) and with the 2023 US reference (LBNL: 1.15–1.92%). US visible power rises from 387 MW in 2023 to 1,300 MW in 2024, so a few very large clusters dominate the register and can reverse the ranking. We therefore treat H2 as suggestive rather than confirmed.
4.2. Divergent References (H3)
Uncertainty is not confined to open registers. The agency references themselves diverge. For China in 2024, the IEA reports ≈100 TWh while Wang et al. (2026), following the Greenpeace/NCEPU series, report 260 TWh, a factor of 2.6, which supports H3. For South Korea, the official annex of the 11th Basic Plan does not publish a TWh level, and the TWh figures attributed to the plan in the press do not appear in the document. For Japan, the IEA provides only an upper bound. The denominators are therefore heterogeneous in kind, not merely in value. This heterogeneity carries into every visibility share we compute.
4.3. Wind–Solar Headroom
4.3.1. Observed Headroom (Panel A, H4)
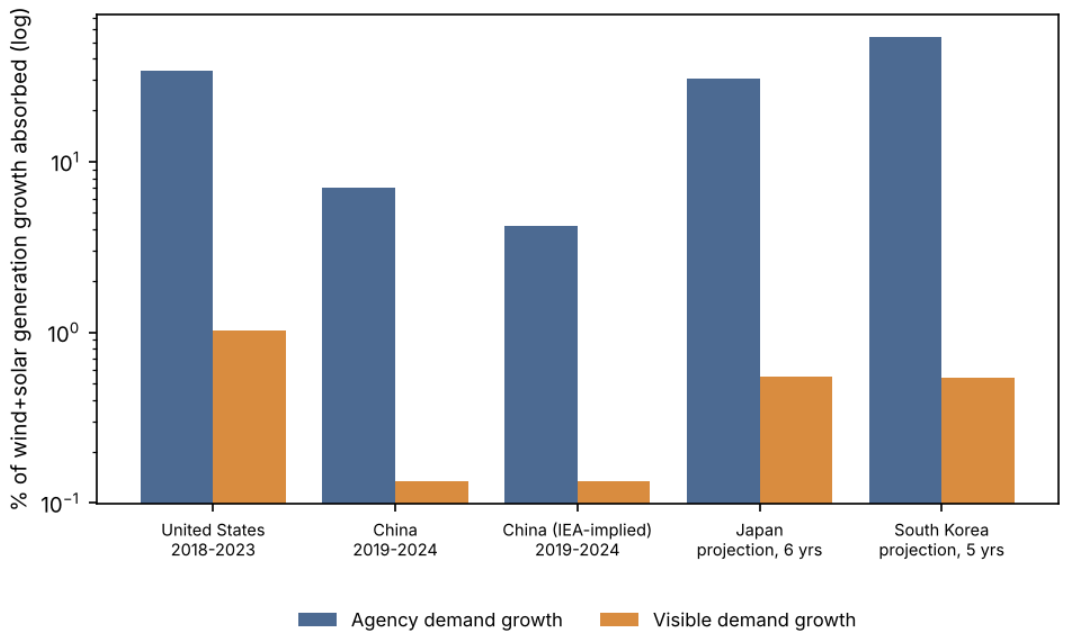
The verdict on headroom depends on which load one looks at. In the United States between 2018 and 2023, data-centre growth absorbs 34.0% of the increase in wind and solar generation under the agency load, against 1.02% under the visible load (a ratio of 33). In China between 2019 and 2024, the corresponding figures are 7.0% (4.2% with the IEA-implied series) against 0.13% (ratios of 31–53). H4 is supported by its rejection rule, since the ratio always exceeds five. The visible share stays below 1% in China but not in the United States, where it reaches 1.02%.
4.3.2. Projected Headroom (Panel B)
Official projections repeat the pattern. For Japan, the projected agency share is 30.7% against 0.55% for the visible load. For South Korea, it is 53.7% (38.4–69.1% with load factors of 0.5–0.9) against 0.54%. These figures are projections, not observations, and we do not use them to infer causal effects.
Figure 2.
Wind–solar headroom absorbed by data-centre demand growth: agency versus visible load (log scale). Source: author’s calculations; seeTable 3.
Figure 2.
Wind–solar headroom absorbed by data-centre demand growth: agency versus visible load (log scale). Source: author’s calculations; seeTable 3.
5. Discussion
5.1. What Open Registers See
Open registers capture mainly large, publicly announced AI clusters. Much of the inference and general cloud infrastructure, as well as custom accelerators such as TPUs, likely remains outside them. The conclusion that clean power has ample headroom for AI is therefore an artefact of limited visibility. Visible load is 1–6% of agency estimates, which means that 92–99% of the load is not visible in the register we use. This is not a claim that the missing load does not exist. It is a claim that it cannot be observed with the instruments currently available.
5.2. Implications for Renewable Planning and Grids
Planning with the visible load underestimates the pressure on clean additions by a factor of 31 to 53 in the observed panel, and by up to about 99 in the projected panel (Table 3). This matters for siting decisions (Onodera, Shiraki and Matsuhashi, 2026) and for China’s programmes to relocate computing to renewable-rich regions (Zhang, Li and Wang, 2025). Grid planners who rely on visible load may conclude that headroom is larger than it is. They may then under-procure renewable capacity or defer transmission upgrades.
5.3. Implications for Transparency
We propose a minimum reporting standard: annual data-centre electricity consumption in TWh per country, average PUE, and the origin of the electricity. Korea’s current format, which reports only GW of peak demand, illustrates the gap. The proposal is in line with the call by Yoo, Choi and Kim (2026) for jurisdiction-level reporting and with the call by Wang, Han and Wei (2026) for accurate statistics. A standard of this kind would make cross-country comparison possible without the reconciliation work our study had to perform.
5.4. Contrast with the Literature
The structural mismatch identified by Henni and Mohammed (2026) is consistent with our results under the agency load and disappears under the visible load. Our contribution is to show what that verdict depends on: the denominator, the coverage of the register, and the treatment of missing data. The scenario results of Lin and Zhou (2026) for China point in the same direction as our agency-based results, but scenario studies do not test how much of the load can be observed.
6. Limitations
This study has several limitations. The Epoch AI (2026) register is incomplete: by its own estimate it covers 10–20% of GPU-cluster computing power, and its coverage of Chinese companies is particularly poor. This incompleteness, rather than the rounding of anonymised Chinese values, is the main source of downward bias in visible load. The utilisation assumption (0.6–1.0) is a range, not a measurement, and imputation is used only as an upper bound. The denominators differ in kind (TWh levels versus GW of peak demand), and the Korea comparison is made in power terms for 2025. Panel B is projected, not observed, and the register includes existing clusters only, not retired ones. Finally, we make no causal inference: the ratios we report are accounting comparisons, not estimates of causal effects.
7. Conclusions
Whether renewables can meet AI demand has no stable answer while 92–99% of the load is unobservable in open registers. Visibility stands at 1–6% of agency estimates, and the share of observed wind and solar growth absorbed by data centres is 31–53 times larger under agency load than under visible load. We close with a call for a minimum reporting standard: annual TWh per country, PUE and electricity origin. Until such a standard exists, comparisons between AI demand and renewable supply will remain sensitive to choices that are rarely made explicit.
Funding
This research received no specific funding.
Data Availability Statement
All data sources are public: Epoch AI (2026), CC BY; Ember (2026), CC BY 4.0; IEA (2025), CC BY 4.0; Shehabi et al. (2024); and MOTIE (2025). Scripts 01–04, the download manifest with SHA-256 checksums, the output tables and the figures are provided as a replication package in the supplementary material.
Conflicts of Interest
The author declares no conflicts of interest.
References
- Byeon, S.; Yang, H.; Kim, Y.; Noh, D. Decomposition analysis of greenhouse gas emission factors of domestic AI service companies during data center expansion and carbon neutrality. J. Clim. Change Res. 2026, 17(4), 765–778. [Google Scholar] [CrossRef]
- Ember. Yearly electricity data [Data set]. 2026. Available online: https://ember-energy.org/data/yearly-electricity-data/ (accessed on 11 November 2026).
- Epoch, A.I. Data on GPU clusters [Data set]. 2026. Available online: https://epoch.ai/data/gpu-clusters-documentation (accessed on 11 November 2026).
- Heo, K.-H.; Kim, S.-W.; Choi, E.-J. A cost-optimal electricity procurement portfolio for AI data centers in South Korea. Trans. Korean Inst. Electr. Eng. 2026, 75(4), 765–774. [Google Scholar] [CrossRef]
- Henni, M. D.; Mohammed, K. S. Exponential AI growth and the physical limits of renewable energy systems. Energy Policy 2026, 215, 115314. [Google Scholar] [CrossRef]
- International Energy Agency. Energy and AI. IEA, 2025. Available online: https://www.iea.org/reports/energy-and-ai.
- Li, G.; Sun, Z.; Wang, Q.; Wang, S.; Huang, K.; Zhao, N.; Di, Y.; Zhao, X.; Zhu, Z. China’s green data center development: Policies and carbon reduction technology path. Environ. Res. 2023, 231, 116248. [Google Scholar] [CrossRef]
- Lin, B.; Wei, B. Power market reform incentivizes artificial intelligence investment: Evidence from China’s electricity spot trading market pilot. Energy Policy 2026, 214, 115235. [Google Scholar] [CrossRef]
- Lin, B.; Zhou, D. How does the explosive growth of AI affect China’s power supply and demand: A scenario simulation based on the LEAP model. Renew. Energy 2026, 256, 124485. [Google Scholar] [CrossRef]
- Ministry of Trade; Industry and Energy [MOTIE. The 11th Basic Plan for Electricity Supply and Demand: Main contents [제11차 전력수급기본계획 주요내용] (annex to press release). 21 February 2025. Available online: https://www.motir.go.kr/kor/article/ATCL3f49a5a8c/170183/view.
- Onodera, H.; Shiraki, H.; Matsuhashi, K. Strategic data center siting can mitigate trade-offs between decarbonization and digitalization in Japan. Cell Rep. Sustain. 2026, 3(9), 100823. [Google Scholar] [CrossRef]
- Shehabi, A.; Smith, S.; Hubbard, A.; Newkirk, A.; Lei, N.; Saddik, A. B.; Holecek, B.; Koomey, J.; Masanet, E.; Sartor, D. 2024 United States data center energy usage report (LBNL-2001637). Lawrence Berkeley National Laboratory, 2024. Available online: https://eta-publications.lbl.gov/publications/2024-lbnl-data-center-energy-usage-report.
- Shin, J.-H.; Kim, S.-W.; Choi, E.-J. Analysis on AI training data center siting and demand response in power system operation. Trans. Korean Inst. Electr. Eng. 2026, 75(4), 775–783. [Google Scholar] [CrossRef]
- Wang, Y.; Lei, H.; Zhang, W.; Jia, E.; Guo, F. Analysis of China’s power development and the impact of data center energy consumption. Front. Energy Res. 2026, 14, 1774740. [Google Scholar] [CrossRef]
- Wang, Y.-Z.; Han, T.; Wei, Y.-M. Building accurate energy-use statistics for data centers. Engineering 2026, 60, 336–342. [Google Scholar] [CrossRef]
- Yang, Z.; Zhou, K.; Niu, Y. Spatial distribution and environmental attributes dataset of China’s large-scale data centers in 2024. Sci. Data 2026, 13, 1249. [Google Scholar] [CrossRef]
- Yoo, S.; Choi, S.; Kim, D. Can renewable energy meet the surging power demand of artificial intelligence? A systematic review. Renew. Sustain. Energy Rev. 2026, 240, 117213. [Google Scholar] [CrossRef]
- Zhang, Y.; Li, H.; Wang, S. Decarbonizing data centers through regional bits migration: A comprehensive assessment of China’s ‘eastern data, western computing’ initiative and its global implications. Appl. Energy 2025, 392, 126020. [Google Scholar] [CrossRef]
- Zhou, K.; Yang, Z.; Lu, X.; Hu, R. Carbon emissions flow and inequality embodied in cross-regional computility transfer in China. Humanit. Soc. Sci. Commun. 2026, 13, 123. [Google Scholar] [CrossRef]
Figure 1.
Agency-estimated versus openly visible data-centre electricity, 2023–2024 (log scale). Source: author’s calculations from Epoch AI (2026), IEA (2025), Shehabi et al. (2024) and Wang et al. (2026).
Figure 1.
Agency-estimated versus openly visible data-centre electricity, 2023–2024 (log scale). Source: author’s calculations from Epoch AI (2026), IEA (2025), Shehabi et al. (2024) and Wang et al. (2026).
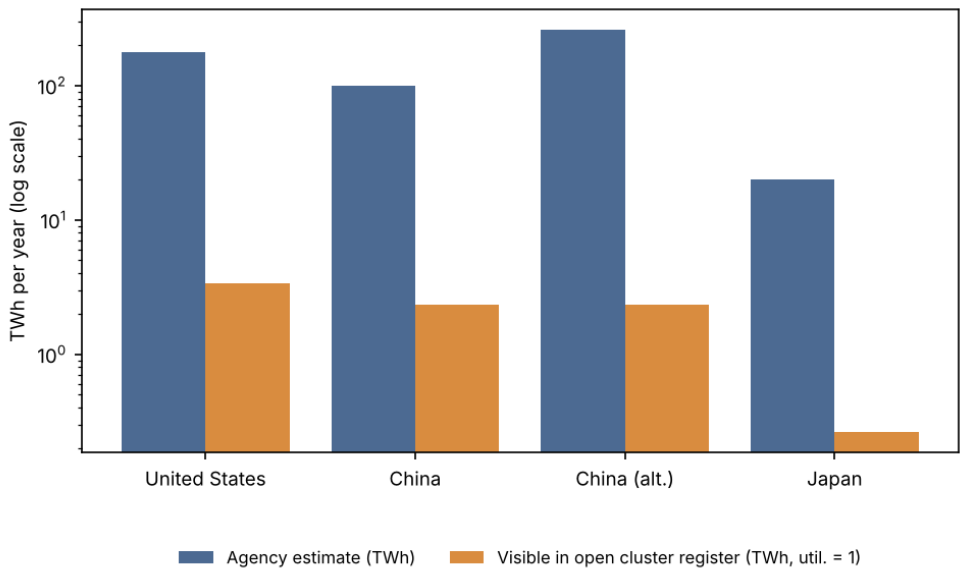

Table 1.
Agency and national reference figures for data-centre electricity demand.
| Country | Year | Value | Unit | Bound | Source |
|---|---|---|---|---|---|
| United States | 2018 | 76 | TWh | point | Shehabi et al. (2024) |
| United States | 2023 | 176 | TWh | point | Shehabi et al. (2024) |
| United States | 2024 | ≈180 | TWh | approx. | IEA (2025), p. 57 |
| China | 2024 | ≈100 | TWh | approx. | IEA (2025), p. 57 |
| China | 2019 / 2024 | 175 / 260 | TWh | point / estimate | Wang et al. (2026), Table 1 |
| Japan | 2024 | <20 | TWh | upper | IEA (2025), p. 57 |
| South Korea | 2025 / 2030 | 0.5 / 2.3 | GW peak (increment over trend) | lower | MOTIE (2025), annex |
Note: ‘Bound’ indicates whether the reference value is a point estimate or an upper/lower bound of total data-centre demand. Korea’s plan reports only the increment of peak demand above the model trend; the 2038 total is 6.2 GW (1.8 GW trend + 4.4 GW increment).
Table 2.
Share of agency-estimated data-centre electricity demand visible in the open cluster register.
Table 2.
Share of agency-estimated data-centre electricity demand visible in the open cluster register.
| Country | Year | Visible power (MW) | Reference | Visible share, utilisation 0.6–1.0 (%) | Upper bound with imputation (%) |
|---|---|---|---|---|---|
| United States | 2023 | 386.6 | 176.0 TWh | 1.15–1.92 | 1.93 |
| United States | 2024 | 1299.8 | 180.0 TWh | 3.80–6.33 | 6.33 |
| China | 2024 | 266.9 | 100.0 TWh | 1.40–2.34 | 7.57 |
| China (alt.) | 2024 | 266.9 | 260.0 TWh | 0.54–0.90 | 2.91 |
| Japan | 2024 | 30.1 | 20.0 TWh | 0.79–1.32 | 1.32 |
| South Korea | 2025 | 12.7 | 0.5 GW peak | 2.55–2.55 | 2.55 |
Note: Visible energy = reported power (MW) × 8,760 h × utilisation; Epoch power already includes system overhead and PUE. Japan’s reference is an upper bound (visibility is a lower bound); Korea’s is an increment of peak demand (visibility is an upper bound, compared in power terms). China (alt.) uses the 260 TWh series of Wang et al. (2026). Sources: Epoch AI (2026), IEA (2025), Shehabi et al. (2024), MOTIE (2025).
Table 3.
Share of wind and solar generation growth absorbed by data-centre demand growth.
| Panel | Country | Period | Δ wind+solar (TWh) | Δ agency DC (TWh) | Absorbed, agency (%) | Absorbed, visible (%) | Ratio |
|---|---|---|---|---|---|---|---|
| A (observed) | United States | 2018-2023 | 294.1 | 100.0 | 34.0 | 1.02 | 33.4 |
| A (observed) | China | 2019-2024 | 1206.8 | 85.0 | 7.0 | 0.13 | 52.7 |
| A (observed) | China (IEA-implied) | 2019-2024 | 1206.8 | 50.3 | 4.2 | 0.13 | 31.2 |
| B (projected) | Japan | projection, 6 yrs | 48.8 | 15.0 | 30.7 | 0.55 | 55.6 |
| B (projected) | South Korea | projection, 5 yrs | 20.5 | 11.0 | 53.7 | 0.54 | 98.9 |
Note: Panel A uses observed changes; China (IEA-implied) derives the 2019 level from the IEA’s ≈15% annual growth (2015–2024). Panel B compares official projections with wind+solar additions at the 2019–2025 average pace; Korea converts +1.8 GW of peak demand with a 0.7 load factor (0.5–0.9 gives 38.4–69.1%). Visible change uses utilisation = 1. Sources: Ember (2026), Epoch AI (2026), IEA (2025), Shehabi et al. (2024), Wang et al. (2026), MOTIE (2025).
Disclaimer/Publisher’s Note: The statements, opinions and data contained in all publications are solely those of the individual author(s) and contributor(s) and not of MDPI and/or the editor(s). MDPI and/or the editor(s) disclaim responsibility for any injury to people or property resulting from any ideas, methods, instructions or products referred to in the content. |
© 2026 by the authors. Licensee MDPI, Basel, Switzerland. This article is an open access article distributed under the terms and conditions of the Creative Commons Attribution (CC BY) license (http://creativecommons.org/licenses/by/4.0/).
Copyright: This open access article is published under a Creative Commons CC BY 4.0 license, which permit the free download, distribution, and reuse, provided that the author and preprint are cited in any reuse.