

Submitted:
10 November 2026
Posted:
12 November 2026
You are already at the latest version
Abstract
Brewery spent grain (BSG) is a strategic residual biomass for circular bioeconomy valorization. The typical chemical composition of large-scale industrial BSG and 2G-bioethanol theoretical yield estimations under operationally feasible conditions lie remarkably close to the minimum techno-economic feasibility requirements reported in the literature, making it a highly promising substrate to explore. Converting lignocellulosic biomass into bioethanol requires a multi-step process involving pretreatment, enzymatic saccharification, and fermentation. In this work, the thermochemical pretreatment of BSG using dilute H2SO4 was addressed as a structured tool to advance the understanding of biomass conditioning. A comprehensive analysis integrating thermal and chemical combined severity parameters with product release, biopolymer solubilization, cellulose digestibility, and process dynamics was performed using a central composite design and kinetic assays. Experimental factors and their interactions were thoroughly evaluated, revealing that a reduced quadratic model effectively described the variability of cellulose enzymatic hydrolysis at an initial time of 24 h. Notably, scarce literature reports full kinetic release data; here, hemicellulose solubilization reached 90-95% at intermediate severities, and conditioning at 15-16% w/v solid loading, 121 °C, 60 min, and 2.5% w/v H2SO4 yielded a cellulose recovery efficiency superior to 70%, with low generation of inhibitors (HMF, furfural, and acetate). To evaluate biological sugar utilization (glucose, xylose, and arabinose), non-detoxified BSG whole slurries were tested under various fermentation configurations (sequential and simultaneous) using non-conventional Spathaspora passalidarum NRRL Y-27907 and recombinant Saccharomyces cerevisiae TMB3400. Simultaneous saccharification and fermentation (SSF) at 30 °C with S. cerevisiae TMB3400 achieved an ethanol concentration of 15.3 g/L at 72 h with 36% pentose removal, corresponding to a global process yield of 0.10 gethanol /gBSG. Finally, various strategies are discussed to enhance 2G-bioethanol implementation, highlighting the co-utilization of BSG and soybean hulls within a compatible operating window.
Keywords:
lignocellulosic biomass
; brewery spent grain
; second-generation bioethanol
; thermochemical pretreatment
; combined severity factor
; non-conventional yeast
1. Introduction
Brewery spent grain (BSG) is the main solid residue generated during industrial beer production, representing approximately 85% of the total by-products of this process. It originates after wort filtration following grain mashing, generally malted barley, although other cereals such as wheat, rice, or corn can also be used. This residue is mainly constituted by grain husks and non-solubilized fibrous fractions, and presents a high carbon-to-nitrogen ratio. It is estimated that around 20 kg of wet BSG is generated per 100 L of brewed beer [1].
The chemical composition of BSG depends on various agronomic and technological factors along the brewing production chain, including barley variety and cultivation conditions (climatic and seasonal factors), malting process conditions (steeping, germination, and kilning), the variety of beer produced, and mashing variables (temperature, pH, time, and water-to-grain ratio), as well as bagasse filtration and washing operations during wort separation and subsequent stabilization stages [2,3].
In general terms, BSG presents a typical lignocellulosic composition of 15-25% cellulose, 17-30% hemicellulose, and 10-20% lignin (see Table S1).
In recent years, BSG has gained increasing relevance as a strategic substrate for waste valorization within circular bioeconomy schemes. In the food sector, it is incorporated into bakery products and plant-based formulations, contributing to improving their nutritional profile [4,5]. Likewise, it can be used to obtain functional fractions, such as hydrolysates rich in antioxidant compounds. Beyond these applications, it remains a relevant resource in animal feed [6], whose utilization has been optimized through drying, ensiling, and microbial conditioning strategies aimed at improving its stability and digestibility.
From a biotechnological perspective, BSG constitutes a promising feedstock for the production of value-added compounds, such as xylo-oligosaccharides, peptides, polyphenols, organic acids, and industrial enzymes, contributing to the development of value chains based on residual biomass [7,8]. Energy recovery routes, such as anaerobic digestion for biogas production or its use in liquid and solid biofuels, reinforce its potential as a renewable resource [9,10].
In this context, BSG as a feedstock for biofuel production has gained particular interest. Bioethanol can be obtained through the fermentative metabolism of yeasts from fermentable carbon sources. Traditionally, first-generation (1G) bioethanol is produced from feedstocks rich in starch or easily bioavailable sugars, and is characterized by its robustness, operational simplicity, and high degree of standardization at the industrial level [11]. However, competition with food production and the requirement for extensive cultivation areas have driven the development of more sustainable alternatives. In this sense, although 1G presents, from a strictly industrial perspective, greater techno-economic feasibility associated with its technological maturity, the production of second-generation (2G) bioethanol from lignocellulosic biomass-such as BSG-poses a significant challenge [12]. Its implementation requires not only a conceptual advance in the utilization of this type of substrate, but also the design and integration of new technological strategies throughout all process stages, from pretreatment to biological conversion and product recovery [13,14]. This complexity largely explains the current limitations for its scaling and industrial consolidation.
Despite the evident environmental, socioeconomic, and productive advantages of using BSG for bioethanol production, a series of challenges must be overcome to optimize its yield. The complex and recalcitrant structure of lignocellulosic materials constitutes one of the main technological challenges of the process. The close association among cellulose, hemicellulose, and lignin limits enzyme accessibility, reducing hydrolysis efficiency and total ethanol yield [14,15]. Consequently, the conversion of lignocellulosic materials into fermentable sugars requires a multi-step process that includes pretreatment, enzymatic saccharification, fermentation, and ethanol recovery.
Thermochemical conditioning with dilute acid constitutes one of the most widely studied methods for the destructuration of the lignocellulosic matrix, and has been considered as an alternative with potential for industrial-scale application, particularly in contexts where residual biomass availability is high [16]. Among the organic and inorganic acids proposed as catalytic agents, sulfuric acid (H₂SO₄) constitutes a relevant alternative due to its industrial availability and existing knowledge regarding its behavior under process conditions and its integration into scaled schemes [17].
Although there is background information on the thermochemical conditioning of BSG with H₂SO₄, most reported studies focus on specific operating conditions, without a comprehensive analysis that articulates severity parameters with product release, biopolymer solubilization and hydrolysis efficiencies, and process dynamics. In particular, there are few works that incorporate kinetic information and systematic approaches based on experimental design, limiting the development of predictive dynamic models applicable to process design and optimization. Furthermore, in studies where severity is used as an integrating parameter, the combined effect of all operational variables is not always explicitly considered (see Table 2).
The amount of bioethanol produced from BSG can directly depend on the solid loading used. The amounts evaluated in the literature indicate that, under operationally feasible conditions on an industrial scale, potential ethanol yields are close to the limits of techno-economic feasibility [18]. In this context, optimizing the utilization of released sugars—through the use of native, non-conventional, or recombinant strains—emerges as a key aspect to improve process efficiency and advance towards its scale-up. In this sense, the experimental evaluation of the fermentative behavior of different yeast strains is necessary.
With the aim of contributing to a better understanding of the BSG thermochemical conditioning process, the present work proposes a comprehensive analysis based on thermal and chemical severity parameters, from experimental data obtained through a statistical design and kinetic assays. This approach explicitly considers the combined effect of residence time, H₂SO₄ concentration, and temperature as relevant operative variables. Likewise, in order to evaluate the biological utilization potential of the released sugars (glucose, xylose, and arabinose), fermentations of BSG hydrolysates were performed using non-conventional and recombinant yeast strains, including Spathaspora passalidarum NRRL Y-27907 and Saccharomyces cerevisiae TMB3400, which have been scarcely explored on this substrate.
2. Materials and methods
2.1. Starting material, stabilization, storage, and compositional determination
The BSG was provided by a large-scale industrial brewery located in Santa Fe city, Argentina (CCU Argentina, http://www.ccu.com.ar). The material was washed with water to remove visible residual starch granules and filtered through a No. 35 stainless steel sieve (500 µm) until the filtrate became colorless. The solid was oven-dried at a constant temperature of 50 °C [19,20] until reaching a moisture content of ≈10%. The stabilized material was subjected to a milling and sieving process using a laboratory-scale mill to obtain particles with a size between 1 and 2 mm, and was stored in airtight containers. Moisture and ash contents were quantified in triplicate following the LAP-NREL/TP-510-42622 protocol.
Structural carbohydrate (glucan and hemicellulose) content was determined in triplicate according to the LAP-NREL/TP-510-42618 protocol, with some modifications. A two-step acid hydrolysis with sulfuric acid was performed. First, 3.00 ± 0.01 mL of 72% w/w H₂SO₄ was added to 300.0 ± 10.0 mg of milled BSG and incubated at 30 °C for 1 h. Then, distilled water was added to reach a 4% w/w H₂SO₄ solution, and the mixture was autoclaved at 121 °C for 1 h. A sample of the liquid phase of the hydrolysate was stored at -20 °C for the subsequent determination of soluble hydrolysis products, including glucose, xylose, arabinose, furans, and acetate. To calculate the amount of the homopolymers xylan, arabinan, and glucan from the concentrations of their sugar monomers, a stoichiometric factor of 132/150 g xylan-arabinan/g xylose-arabinose, and 162/180 g glucan/g glucose was used, respectively [21]. Total hemicellulose content was considered as the sum of xylan and arabinan content.
To distinguish between starch and cellulose, a protocol based on starch-hydrolyzing enzymes (alpha-amylase and glucoamylase) was implemented. Briefly, a 7 mL volume of a 30 g/L BSG suspension at pH 5.80 was placed in a thermal bath at 90 °C for 20 min. Then, 15 µL of alpha-amylase (Avantec®, Novozymes A/S, Bagsværd, Denmark) was added and incubated at 85 °C for 60 min. The temperature was lowered to 55 °C, 30 µL of glucoamylase (Spirizyme®, Novozymes A/S, Bagsværd, Denmark) was added, and the mixture was incubated for 2 h. A soluble starch suspension was used as a control. For the sake of understanding the subsequent sections, it is anticipated that the starch content in the BSG was negligible, as no glucose was detected after the implemented enzymatic protocol. This was supported by the experimental design and kinetic assays (see Section 3.4 and Section 3.5).
For the quantification of the acid-insoluble solid content, the resulting suspension from the NREL protocol was filtered using a G2 sintered glass filter, and the residue was oven-dried at 110 °C for 24 h.
2.2. Acid conditioning: experimental design and analysis
To analyze the impact of time (t), temperature (T), and sulfuric acid concentration ([H₂SO₄]), a central composite design (CCD) of 17 treatments including star points was carried out. The treatments were assayed in duplicate. The combination of factors corresponding to each treatment is detailed in Table 1. The experimental design was performed using Statgraphics Centurion XV v15.2.06 (StatPoint Inc., Warrenton, VA, USA). The analysis of the results was complemented using Design-Expert® 13 (Stat-Ease Inc., Minneapolis, MN, USA) and MATLAB R2019a (The MathWorks Inc., Natick, MA, USA).
The acid hydrolysis was carried out in borosilicate glass tubes with screw caps (HACH, Loveland, CO, USA) using a dry heating block system for temperature control. The reaction volume was 7 mL, with a dry BSG loading of 133 g/L. The reaction was stopped by immediately placing the tubes in a cold water bath. A sample of the liquid phase of the hydrolysate was stored at -20 °C for the determination of soluble hydrolysis products.
After the thermochemical pretreatment, the pH of the hydrolysates was adjusted to 5.50 ± 0.50 by adding 10N NaOH. The amount of neutralizing agent consumed for each pH level was recorded. Chloramphenicol was also added to a final concentration of 2.5 ppm to prevent bacterial proliferation. The enzymatic hydrolysis of the neutralized whole slurry was performed with the commercial enzyme mix Cellic CTec2® (Novozymes A/S, acquired from Sigma-Aldrich as SAE0020) at ≈13 FPU/g cellulose, at 50 °C, under orbital shaking for 24 h.
The performance criteria of the acid conditioning process, incorporated as response variables of the experimental design, were the hemicellulose solubilization efficiency (HS [%]) and the cellulose enzymatic hydrolysis efficiency (HE [%]) at 24 h, calculated from Eqs. 1 and 2.
where CXylose, CArabinose and CGlucose are the concentrations [g/L] of xylose, arabinose, and glucose in the liquid fraction of the hydrolysate, CSolid is the solid loading [g/L], XHemicelulose and XCelullose are the hemicellulose and cellulose fractions in the dry biomass, and fPol−Mon is the conversion factor to calculate the amount of structural carbohydrates from their constituent monomers (132/150 g xylan-arabinan/g xylose-arabinose, and 162/180 g cellulose/g glucose).
2.3. Acid conditioning: kinetic assays
Given that the experimental design did not fully reveal the effect of some of the studied operational variables, nor the temporal dynamics of hemicellulose solubilization—which can occur relatively quickly under certain operating conditions, achieving high recoveries in very short times—it was decided to carry out additional kinetic assays. The kinetic assays were performed in duplicate, using the equipment and methodology described in Section 2.2, with a duration of 80 min.
To evidence the effect of H₂SO₄ concentration on pentose solubilization and the release/formation of potentially inhibitory compounds (furfural and acetate), two treatments were carried out at the same temperature (T = 120 °C), but under two different H₂SO₄ concentrations of 1.5 and 3.5% w/v. Under these conditions, pentose solubilization occurs more rapidly.
Furthermore, an intermediate condition with T = 110 °C and [H₂SO₄] = 2.5% w/v, and one where hemicellulose solubilization would be slower, such as T = 100 °C and [H₂SO₄] = 1.5% w/v, were chosen. These latter two treatments were selected because they also allow for a more in-depth study of the interaction between T and [H₂SO₄].
2.4. Fermentations
The yeast Spathaspora passalidarum NRRL Y-27907 was provided by the USDA-ARS Culture Collection (NRRL) and the recombinant strain Saccharomyces cerevisiae TMB3400 was kindly provided by Dr. Marie F. Gorwa-Grauslund (Lund University, Sweden) [22,23].
The yeast strains were maintained on solid media formulated with yeast extract-peptone-xylose (YPX) and yeast extract-peptone-glucose (YPG), respectively. Liquid inocula for the fermentation assays were generated under orbital incubation at 30 °C from YPX and YPG media containing 15 g/L xylose for Sp. passalidarum NRRL Y-27907 and 30 g/L glucose for S. cerevisiae TMB3400, respectively. All fermentation assays were performed in biological duplicate in 100 mL glass reactors operated in batch mode, with a working volume of 30 mL, orbitally shaken at 100 rpm, and yeasts were inoculated to achieve an initial concentration of 1 g/L. Biomass concentration was estimated using a calibration curve established between OD600nm and volatile suspended solids (VSS), based on a gravimetric VSS quantification method [24].
BSG hydrolysates were thermochemically obtained with solid loadings of 15-16% w/v and an [H₂SO₄] of 2.5% w/v, in an autoclave at 121 °C for 60 min.
For individual sequential saccharification and fermentation assays with Sp. passalidarum NRRL Y-27907 and S. cerevisiae TMB3400, yeasts were initially inoculated into whole slurries obtained post-saccharification with Cellic CTec2® (13 FPU/g cellulose, at 50 °C, orbital shaking, 48 h). To analyze whether the BSG hydrolysate could nutritionally limit the fermentation of available simple sugars for Sp. passalidarum NRRL Y-27907, an assay was performed with the liquid fraction of the hydrolysate post-enzymatic saccharification. The supernatant was recovered using a 30 µm nylon mesh, neutralized with NaOH to pH 6, and supplemented with 10 g/L yeast extract. This strategy also allows estimating yeast growth by monitoring OD600nm and evidencing the temporal trend of biomass concentration.
For simultaneous saccharification and fermentation assays with S. cerevisiae TMB3400, the enzyme Cellic CTec2® (13 FPU/g cellulose) was added to the whole slurry simultaneously with the yeast. The suspension was incubated at 30 °C under orbital shaking at 100 rpm. The apparent ethanol yield relative to consumed sugars (glucose and pentoses), , was calculated using Eq. 3:
where ΔEthanol corresponds to the net concentration of produced ethanol [g/L], ΔP to the concentration of consumed pentoses (xylose + arabinose) [g/L], and ∆Ghypothetical to the estimated concentration of glucose released by saccharification and consumed during the fermentative process. For this latter term, a value of ≈25 g/L was adopted, corresponding to the average glucose concentration obtained during the saccharification of whole slurries with Cellic CTec2® at 50 °C. Therefore, the calculation assumes a degree of cellulose saccharification at 30 °C comparable to that achieved under the reference conditions at 50 °C. A compositional characterization of the residual solid using the NREL protocol was not performed to directly verify the final degree of cellulose conversion.
2.5. Analytical determinations
For the rapid estimation of pentose concentration in the liquid fraction of the hydrolysates, a colorimetric method based on hydrochloric acid, acetic acid, and phloroglucinol was employed [25]. Glucose quantification was performed using an enzymatic colorimetric kit (SB Lab., Santa Fe, Argentina).
The concentrations of glucose, xylose, arabinose, acetate, ethanol, 5-hydroxymethylfurfural (HMF), and furfural were determined from hydrolysate and fermentation supernatant samples previously centrifuged for 10 min at 10,000 rpm and filtered through 0.45 µm nylon membranes. Analysis was carried out using high-performance liquid chromatography equipped with a refractive index detector (HPLC-RID; Thermo UltiMate 3000, RefractoMax 520), utilizing a Shodex SUGAR SH1011 column (8.0 mm I.D. × 300 mm) and 5 mM H₂SO₄ as the mobile phase at a flow rate of 0.6 mL/min.
The ethanol concentration determined by HPLC-RID was additionally corroborated by gas chromatography equipped with a flame ionization detector (GC-FID, SHIMADZU GC Solution). A sample volume of 1 µL was injected, using butanol as an internal standard.
3. - Results
3.1. Biomass chemical composition
The BSG stabilized and stored as detailed in Section 2.1 presented a moisture content of 10.41 ± 1.56%. Table S1 shows the percentage composition on a dry basis. The BSG was composed of 16.28 ± 0.80% glucan, 14.79 ± 0.72% xylan, 7.19 ± 0.53% arabinan, 18.18 ± 0.58% acid-insoluble material (H₂SO₄), 0.97 ± 0.13% acetyl groups, 24.00 ± 4.45% protein, and 4.45 ± 0.13% ash.
No glucose was detected after the enzymatic procedure with starch-hydrolyzing enzymes, nor during the acid pretreatment assays (experimental design and kinetics), indicating that the entire glucan content corresponds to cellulose. Total hemicellulose content (xylan + arabinan) was 21.98 ± 0.89%, with a xylan-to-total hemicellulose ratio of 67.30 ± 0.04%.
3.2. Experimental design analysis
The 17 treatments were performed in duplicate, with combinations of the factors temperature (T), sulfuric acid concentration ([H₂SO₄]), and time (t), corresponding to the central composite design detailed in Section 2.2. The most relevant response variables analyzed using statistical mathematical fitting models were the cellulose enzymatic hydrolysis efficiency (HE [%]) and hemicellulose solubilization (HS [%]).
The evaluated experimental design was conceived not strictly for optimization purposes, but as a structured tool to contribute to the synthesis and understanding of the BSG conditioning process. In this sense, the experimental scheme was constructed with a simultaneously explanatory, interpretative, and phenomenological approach: (i) to identify global trends and the relative significance of operational factors; (ii) to interpret responses from a physicochemical perspective, analyzing curvatures and interactions in terms of thermal and chemical severity; and (iii) to link the observed results with the structural mechanism of hemicellulose depolymerization and the progressive exposure of the cellulosic fraction susceptible to enzymatic saccharification.
Under this premise, the results are presented emphasizing the coherence between the statistical behavior of the fitting model, the structural interpretation of the pretreated solid, and its subsequent impact on the efficiency of enzymatic hydrolysis and alcoholic fermentation.
3.3. Enzymatic hydrolysis
In order to evidence the effects of acid conditioning on BSG cellulose, the cellulose enzymatic hydrolysis efficiency (HE [%]) was quantified 24 h after the start of saccharification. Quantifying the effect of operational variables and, therefore, distinguishing between treatments is more suitable at initial times, where complete solubilization of hemicellulose and cellulose has not yet occurred [27].
Initially, experimental HE data were analyzed using a simple linear regression model without interactions or quadratic terms. The model proved to be highly significant (p < 0.0001), showing a significant positive (+) effect of T, [H₂SO₄], and t. The greatest effect was produced by T, followed by t and [H₂SO₄], respectively. That is, T > t > [H2SO4]. The model showed an ability to explain 84% of the experimental variability, good explanatory capacity considering the number of terms, low residual variation, good experimental repeatability, and an excellent signal-to-noise ratio. Statistical indicators are detailed in Table (S2). The simple linear model confirmed the suitability of the experimental data for a deeper phenomenological analysis of BSG conditioning with H₂SO₄. However, the model showed a lack of fit (p = 0.025 < 0.05), indicating a relevant non-linear component (curvature or interaction) that it does not capture.
The data were subsequently analyzed using a full quadratic model. The quadratic model improved the fit, better explaining experimental variability and eliminating the lack-of-fit issue (p = 0.143). Therefore, it is statistically more appropriate for describing the behavior of the acid conditioning process. Statistical indicators and the significance of the terms are detailed in Table (S3). T was the dominant factor among the effects, with t being strongly significant, and [H₂SO₄] being significant, although with lesser influence. These factors showed positive (+) effects. The interaction terms T–[H₂SO₄] and t–[H₂SO₄] were significant with a positive (+) effect, unlike T–t, whose effect can be neglected. Among the quadratic terms T2, t2, and [H2SO4]2, only T proved to be relevant with a positive (+) effect. Eq. (S1) shows the reduced quadratic model in coded terms that best represents the experimental dataset, and Eq. (4) shows the scaled model with the units of each factor. Fig. (S1) shows the correlation between experimental HE data versus the predictions obtained using the reduced quadratic model.
HE [%] {24 h} = 144,948 - 2,41967*T + 0,458986*t - 20,8967*[H₂SO₄] + 0,165497*T*[H₂SO₄] + 0,0744428*t*[H₂SO₄] + 0,0135495*T2 ; R2=0,9142
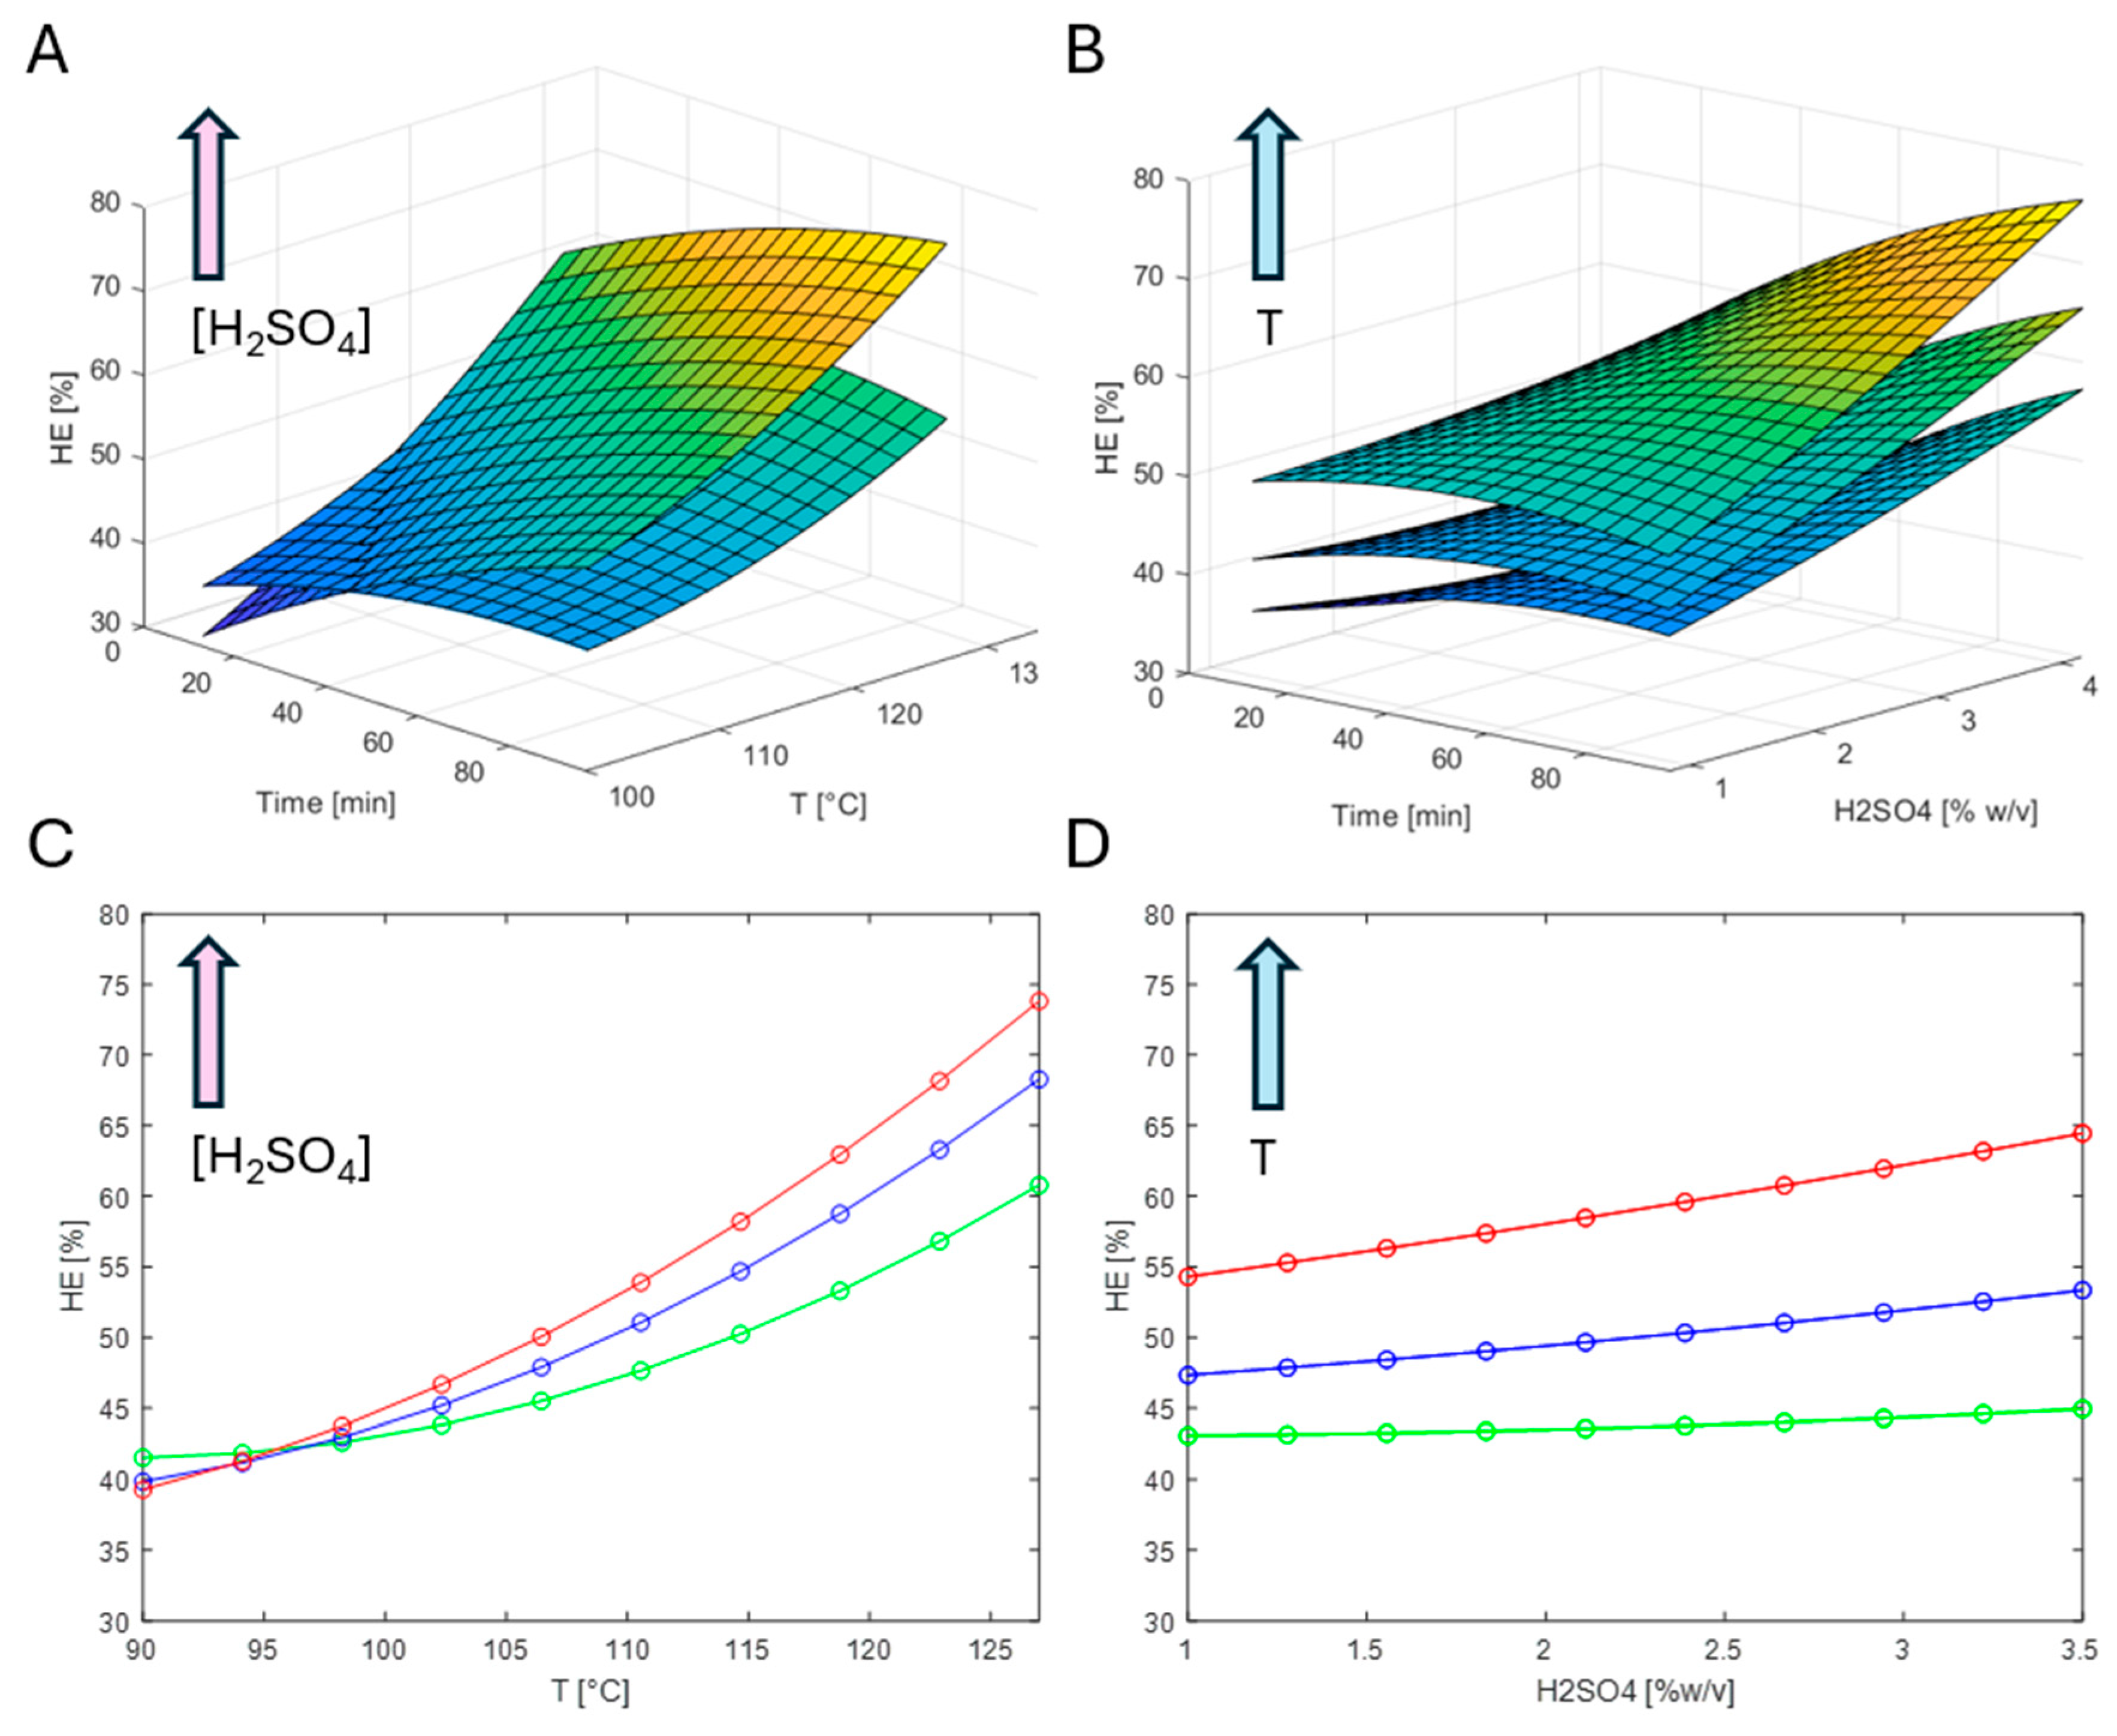
Figs. (1A) and (1B) show the response surfaces for HE–T–t and HE–[H₂SO₄]–t. In Fig. (1A), the surfaces correspond to [H₂SO₄] of 1.0 and 3.5% w/v. In Fig. (1B), to T of 100, 110, and 120 °C. For a better visualization of the effects of T and [H₂SO₄], Figs. (1C) and (1D) show HE as a function of T for [H₂SO₄] of 1.0, 2.5, and 3.5% w/v, and HE as a function of [H₂SO₄] for T of 100, 110, and 120 °C. The curves correspond to a hydrolysis time of 55 min.
At 24 h of enzymatic hydrolysis, HE values were found in the range of 38.11% to 69.78%. The conditions of [T = 120 °C, t = 80 min, [H2SO4] = 3.5%] and [T = 127 °C, t = 55 min, [H2SO4] = 2.5%] showed the highest cellulose recoveries, of approx. 69%.
The neutralization stage post-acid conditioning and pre-enzymatic saccharification acquires relevance in the overall process design, and was therefore considered. The amount of neutralizing agent (NaOH) consumed to reach the enzymatic hydrolysis pH of the different acid BSG suspensions was recorded. Figs. (S2A) and (S2B) show the amount of NaOH consumed for a given volume of acid suspension and the resulting NaOH/H2SO4 molar ratio (≈0.017), respectively.
Figure 1.
Response surfaces for (A) HE–T–t at [H₂SO₄] of 1.0 and 3.5% w/v, and (B) HE–[H₂SO₄]–t at T of 100, 110, and 120 °C. (C) HE curves corresponding to a hydrolysis time of 55 min as a function of T for [H₂SO₄] of 1.0, 2.5, and 3.5% w/v, and (D) as a function of [H₂SO₄] for T of 100, 110, and 120 °C.
Figure 1.
Response surfaces for (A) HE–T–t at [H₂SO₄] of 1.0 and 3.5% w/v, and (B) HE–[H₂SO₄]–t at T of 100, 110, and 120 °C. (C) HE curves corresponding to a hydrolysis time of 55 min as a function of T for [H₂SO₄] of 1.0, 2.5, and 3.5% w/v, and (D) as a function of [H₂SO₄] for T of 100, 110, and 120 °C.
3.4. Severity and relationships among biomass components
The analysis of correlations among the different products released during acid pretreatment and subsequent enzymatic hydrolysis constitutes a key tool for interpreting the overall behavior of the lignocellulosic system. Beyond the individual quantification of sugars or degradation products, the combined study of these variables allows advancing towards a phenomenological understanding of the process, linking the observed macroscopic response with structural changes induced by the pretreatment.
In particular, hemicellulose plays a central structural role in the plant cell wall, acting as an amorphous matrix that surrounds and connects cellulose microfibrils, as well as establishing multiple interactions with lignin. In this context, it is to be expected that hemicellulose solubilization during thermochemical pretreatment and the efficiency of cellulose enzymatic hydrolysis are not independent phenomena, but rather coupled responses to the degree of treatment severity.
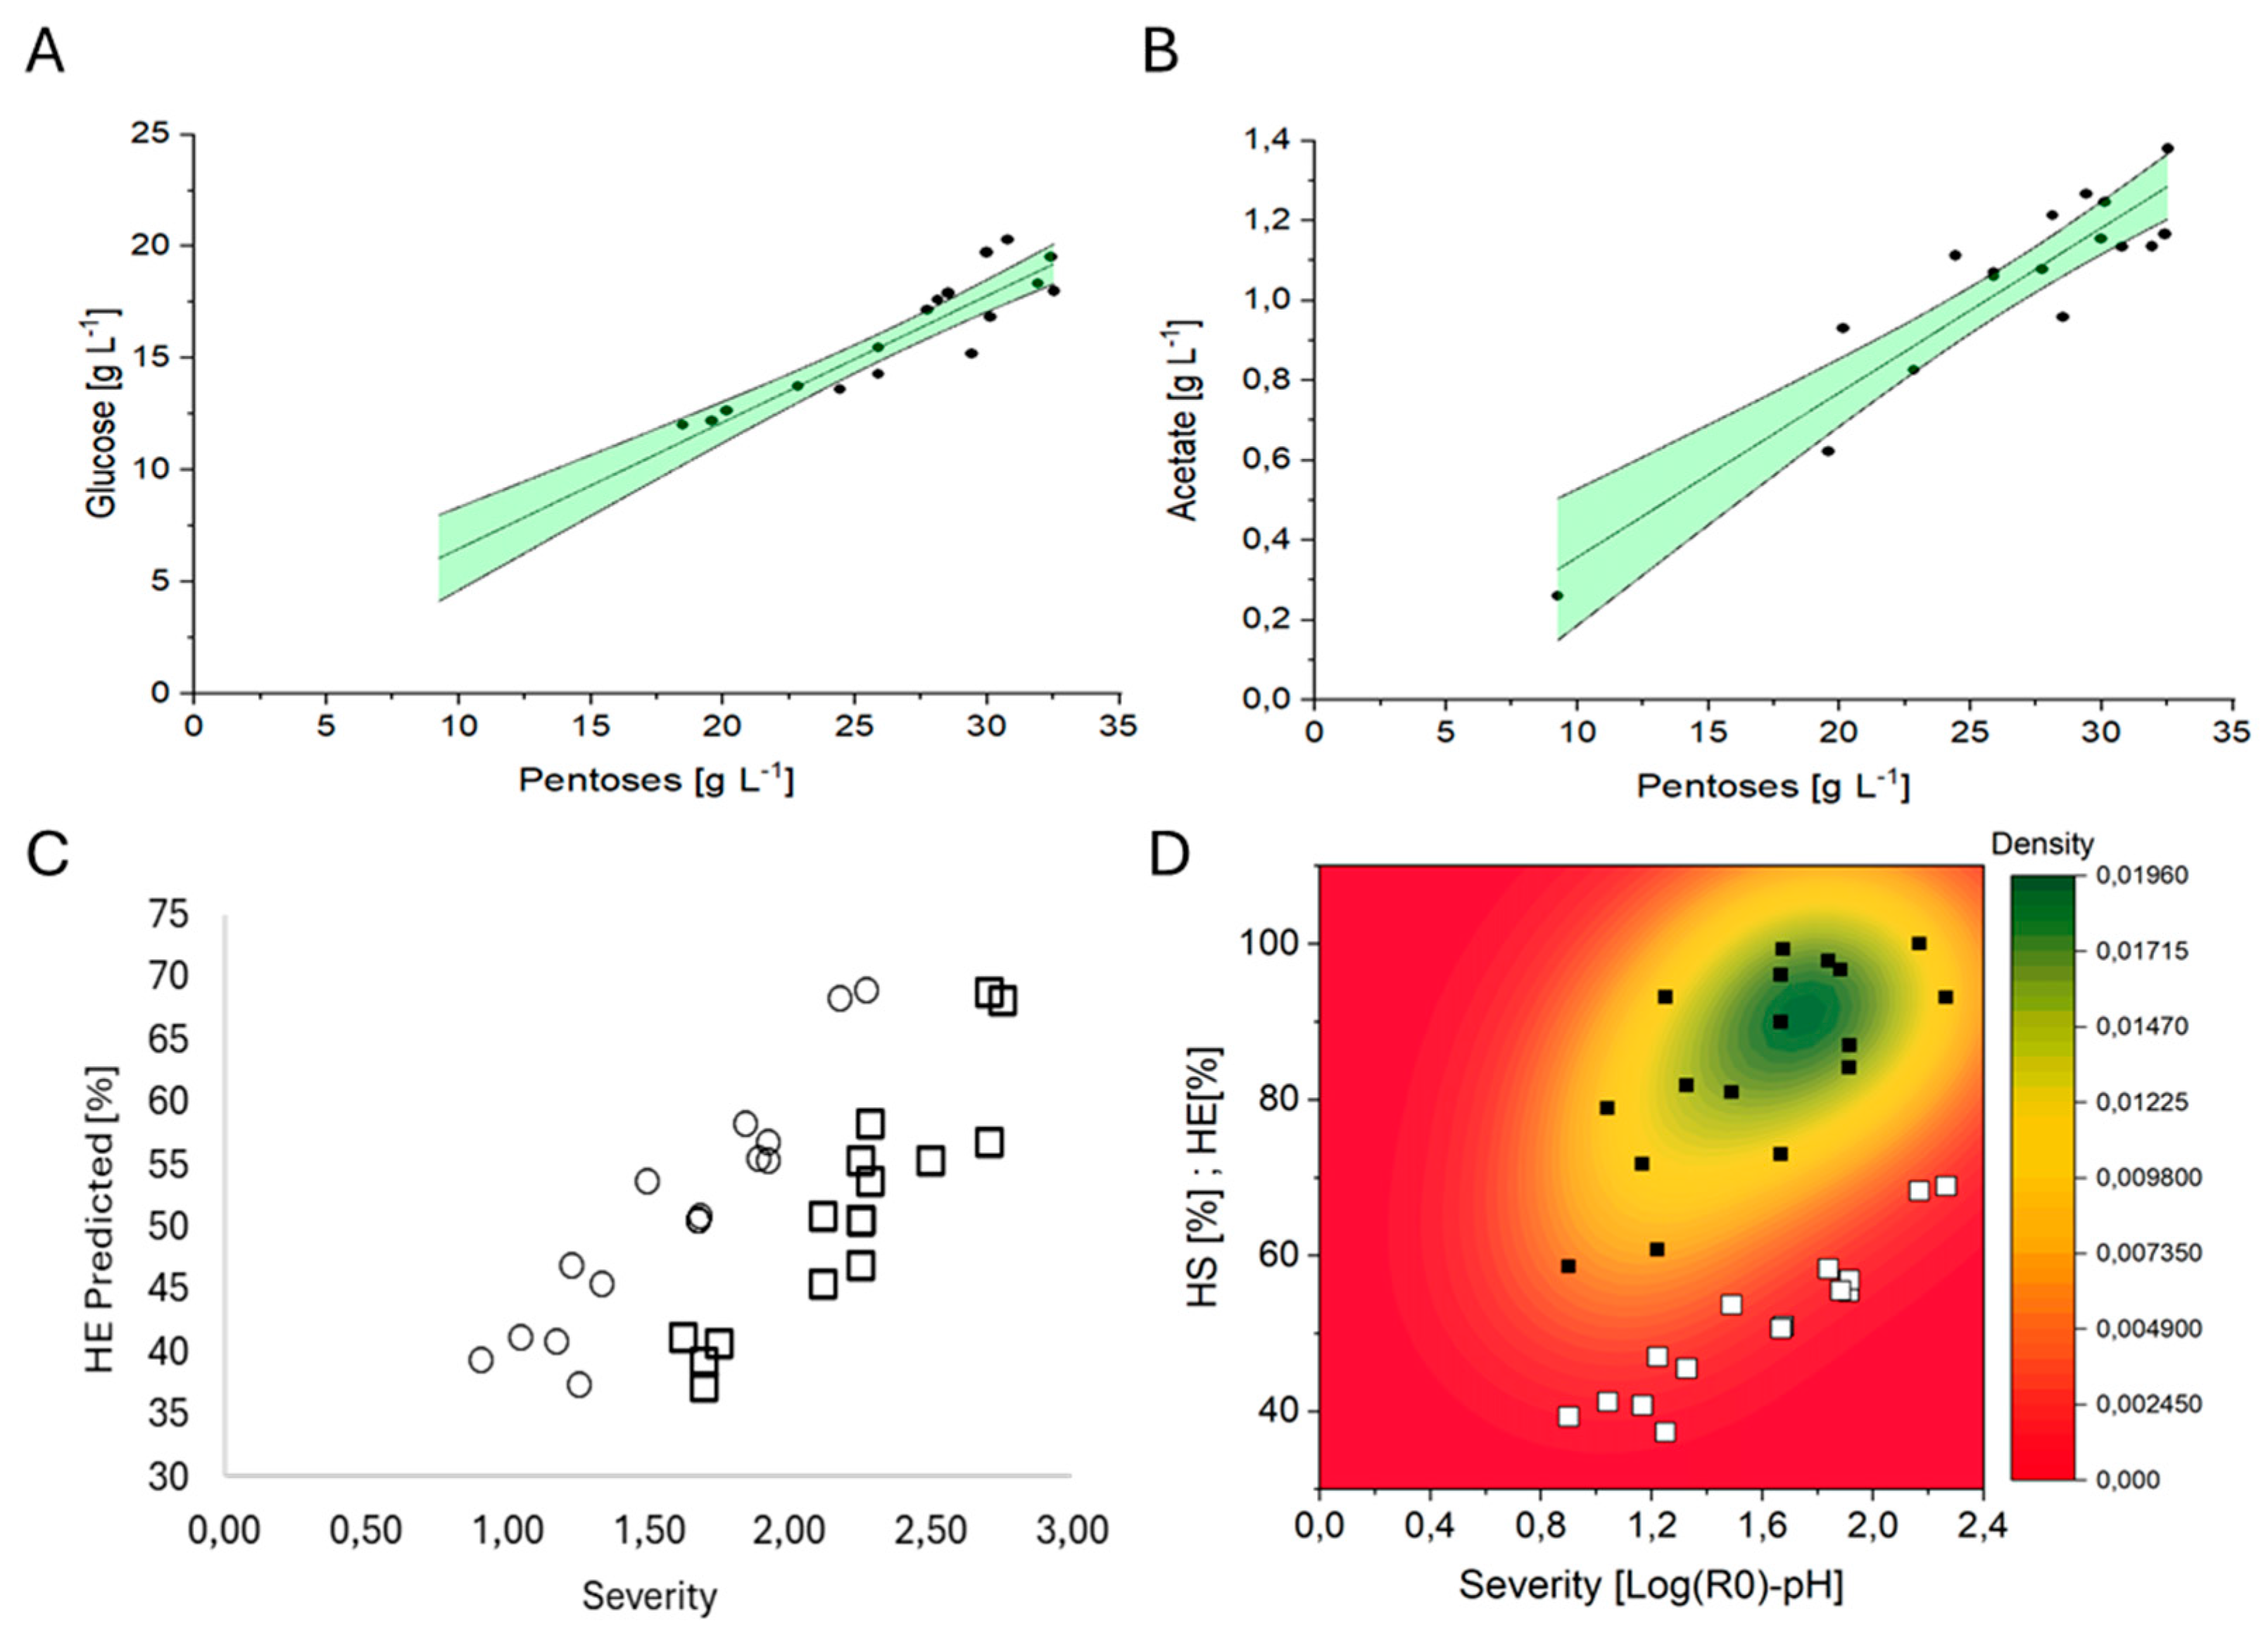
Figs. (2A), (2B), (S3), and (S4) show correlations among the products of successive hydrolyses. Linear correlations with high coefficients of determination (R2 > 0.99) were observed between the glucose released during enzymatic hydrolysis and the main hemicellulosic sugars (xylose and arabinose), as well as between total pentoses and acetate originating from acetyl groups. These high coefficients reflect the joint response of the variables to the pretreatment severity, rather than a direct causal relationship between individual chemical species.
In this study, pretreatment severity demonstrated the highest explanatory power for the obtained experimental variability, integrating the combined effects of temperature, time, and acid concentration. Consequently, the observed correlations among the different sugars reflect the covariation of these products with respect to the same dominant latent variable, associated with the progress of pretreatment on the lignocellulosic matrix.
Given that experimental results showed that temperature had the greatest effect on cellulose enzymatic hydrolysis efficiency (HE), followed by time and, to a lesser extent, H₂SO₄ concentration, two severity factors were proposed: a classical thermal factor (logR0), which integrates the effects of temperature and time, and a combined thermal-chemical severity factor (log(R0)–pH), incorporating the contribution of the medium acidity. Catalytic strength was quantified based on the theoretical estimation of the acid suspension pH, directly related to the H₂SO₄ concentration. The actual pH of dense solid mixtures is difficult to measure accurately. In the experimental system used, the heating ramp up to the operating T was fast, so the factor R0 can be simplified. Eqs. (5), (6), and (7) show the considered severity factors.
Fig. (2C) shows the correlation between enzymatic hydrolysis efficiency and the considered severity factors. When employing the combined thermal-chemical severity factor , a reduction in the dispersion of experimental data points and a relationship closer to linearity are observed compared to the exclusive use of the thermal factor logR0. This indicates that acidity explains part of the variability that is not captured by temperature and time alone.
Fig. (2D) corresponds to a mixed scatter and local density plot showing the relationship between the degree of pentose solubilization (HS) and cellulose enzymatic hydrolysis efficiency (HE). Hemicellulose solubilization reached high values at intermediate severities (≈90 − 95% for , between 1.2 and 1.8), whereas cellulose enzymatic hydrolysis efficiency continues to increase progressively across the entire studied severity range. Neither glucose nor HMF was detected in the liquid fraction of post-acid conditioning hydrolysates, suggesting that, within the evaluated severity range, the cellulosic fraction does not undergo significant solubilization or degradation.
Figure 2.
Correlations between (A) glucose and total pentoses, (B) acetate and total pentoses, (C) predicted HE and treatment severity parameters logR0 and , and (D) HS and HE with severity . Predicted HE was calculated using the model described by Eq. (4). Legend: (C) (□) logR0, (∘) ; (D) (□) HE, (■) HS.
Figure 2.
Correlations between (A) glucose and total pentoses, (B) acetate and total pentoses, (C) predicted HE and treatment severity parameters logR0 and , and (D) HS and HE with severity . Predicted HE was calculated using the model described by Eq. (4). Legend: (C) (□) logR0, (∘) ; (D) (□) HE, (■) HS.
3.5. Hemicellulose solubilization
The experimental design did not allow capturing through a mathematical model the effect of operational variables and the temporal dynamics of hemicellulose solubilization. For this reason, additional kinetic assays were performed. Hemicellulose solubilization can occur relatively quickly under some operating conditions, achieving high recoveries in short times. Under our experimental conditions, many of the evaluated treatments reached high hemicellulose solubilization (HS) rates within a time interval of 13 to 97 min (see Fig. (2D)). HS values between 58% and 100% were evidenced. This led to operationally very different treatments being statistically similar. To gain a deeper understanding of hemicellulose solubilization dynamics and the appearance of pentoses and potential degradation products in the liquid fraction of the treated suspension (≈133 g/L BSG), kinetic assays were carried out. The tested treatments were [T = 120 °C, [H2SO4] = 3.5% w/v], [T = 120 °C, [H2SO4] = 1.5% w/v], [T = 110 °C, [H2SO4] = 2.5% w/v], and [T = 100 °C, [H2SO4] = 1.5% w/v], with a duration of 80 min. Fig. (3) shows the release kinetics of total pentoses, individual pentoses such as xylose and arabinose, and acetate. The condition corresponding to [T = 110 °C, [H2SO4] = 2.5% w/v] is included in Fig. (S4) of the Supplementary Material, given that its behavior is intermediate relative to the other evaluated conditions, and its exclusion from Fig. (3) responds solely to visual clarity criteria.
Figure 3.
Time course of concentrations for (A) total pentoses, (B) arabinose, (C) xylose, and (D) acetate. Legend: (□) [T = 120 °C, [H2SO4] = 3.5% w/v], (∘) [T = 120 C, [H2SO4] = 1.5% w/v], (Δ) [T = 100 C, [H2SO4] = 1.5% w/v].
Figure 3.
Time course of concentrations for (A) total pentoses, (B) arabinose, (C) xylose, and (D) acetate. Legend: (□) [T = 120 °C, [H2SO4] = 3.5% w/v], (∘) [T = 120 C, [H2SO4] = 1.5% w/v], (Δ) [T = 100 C, [H2SO4] = 1.5% w/v].
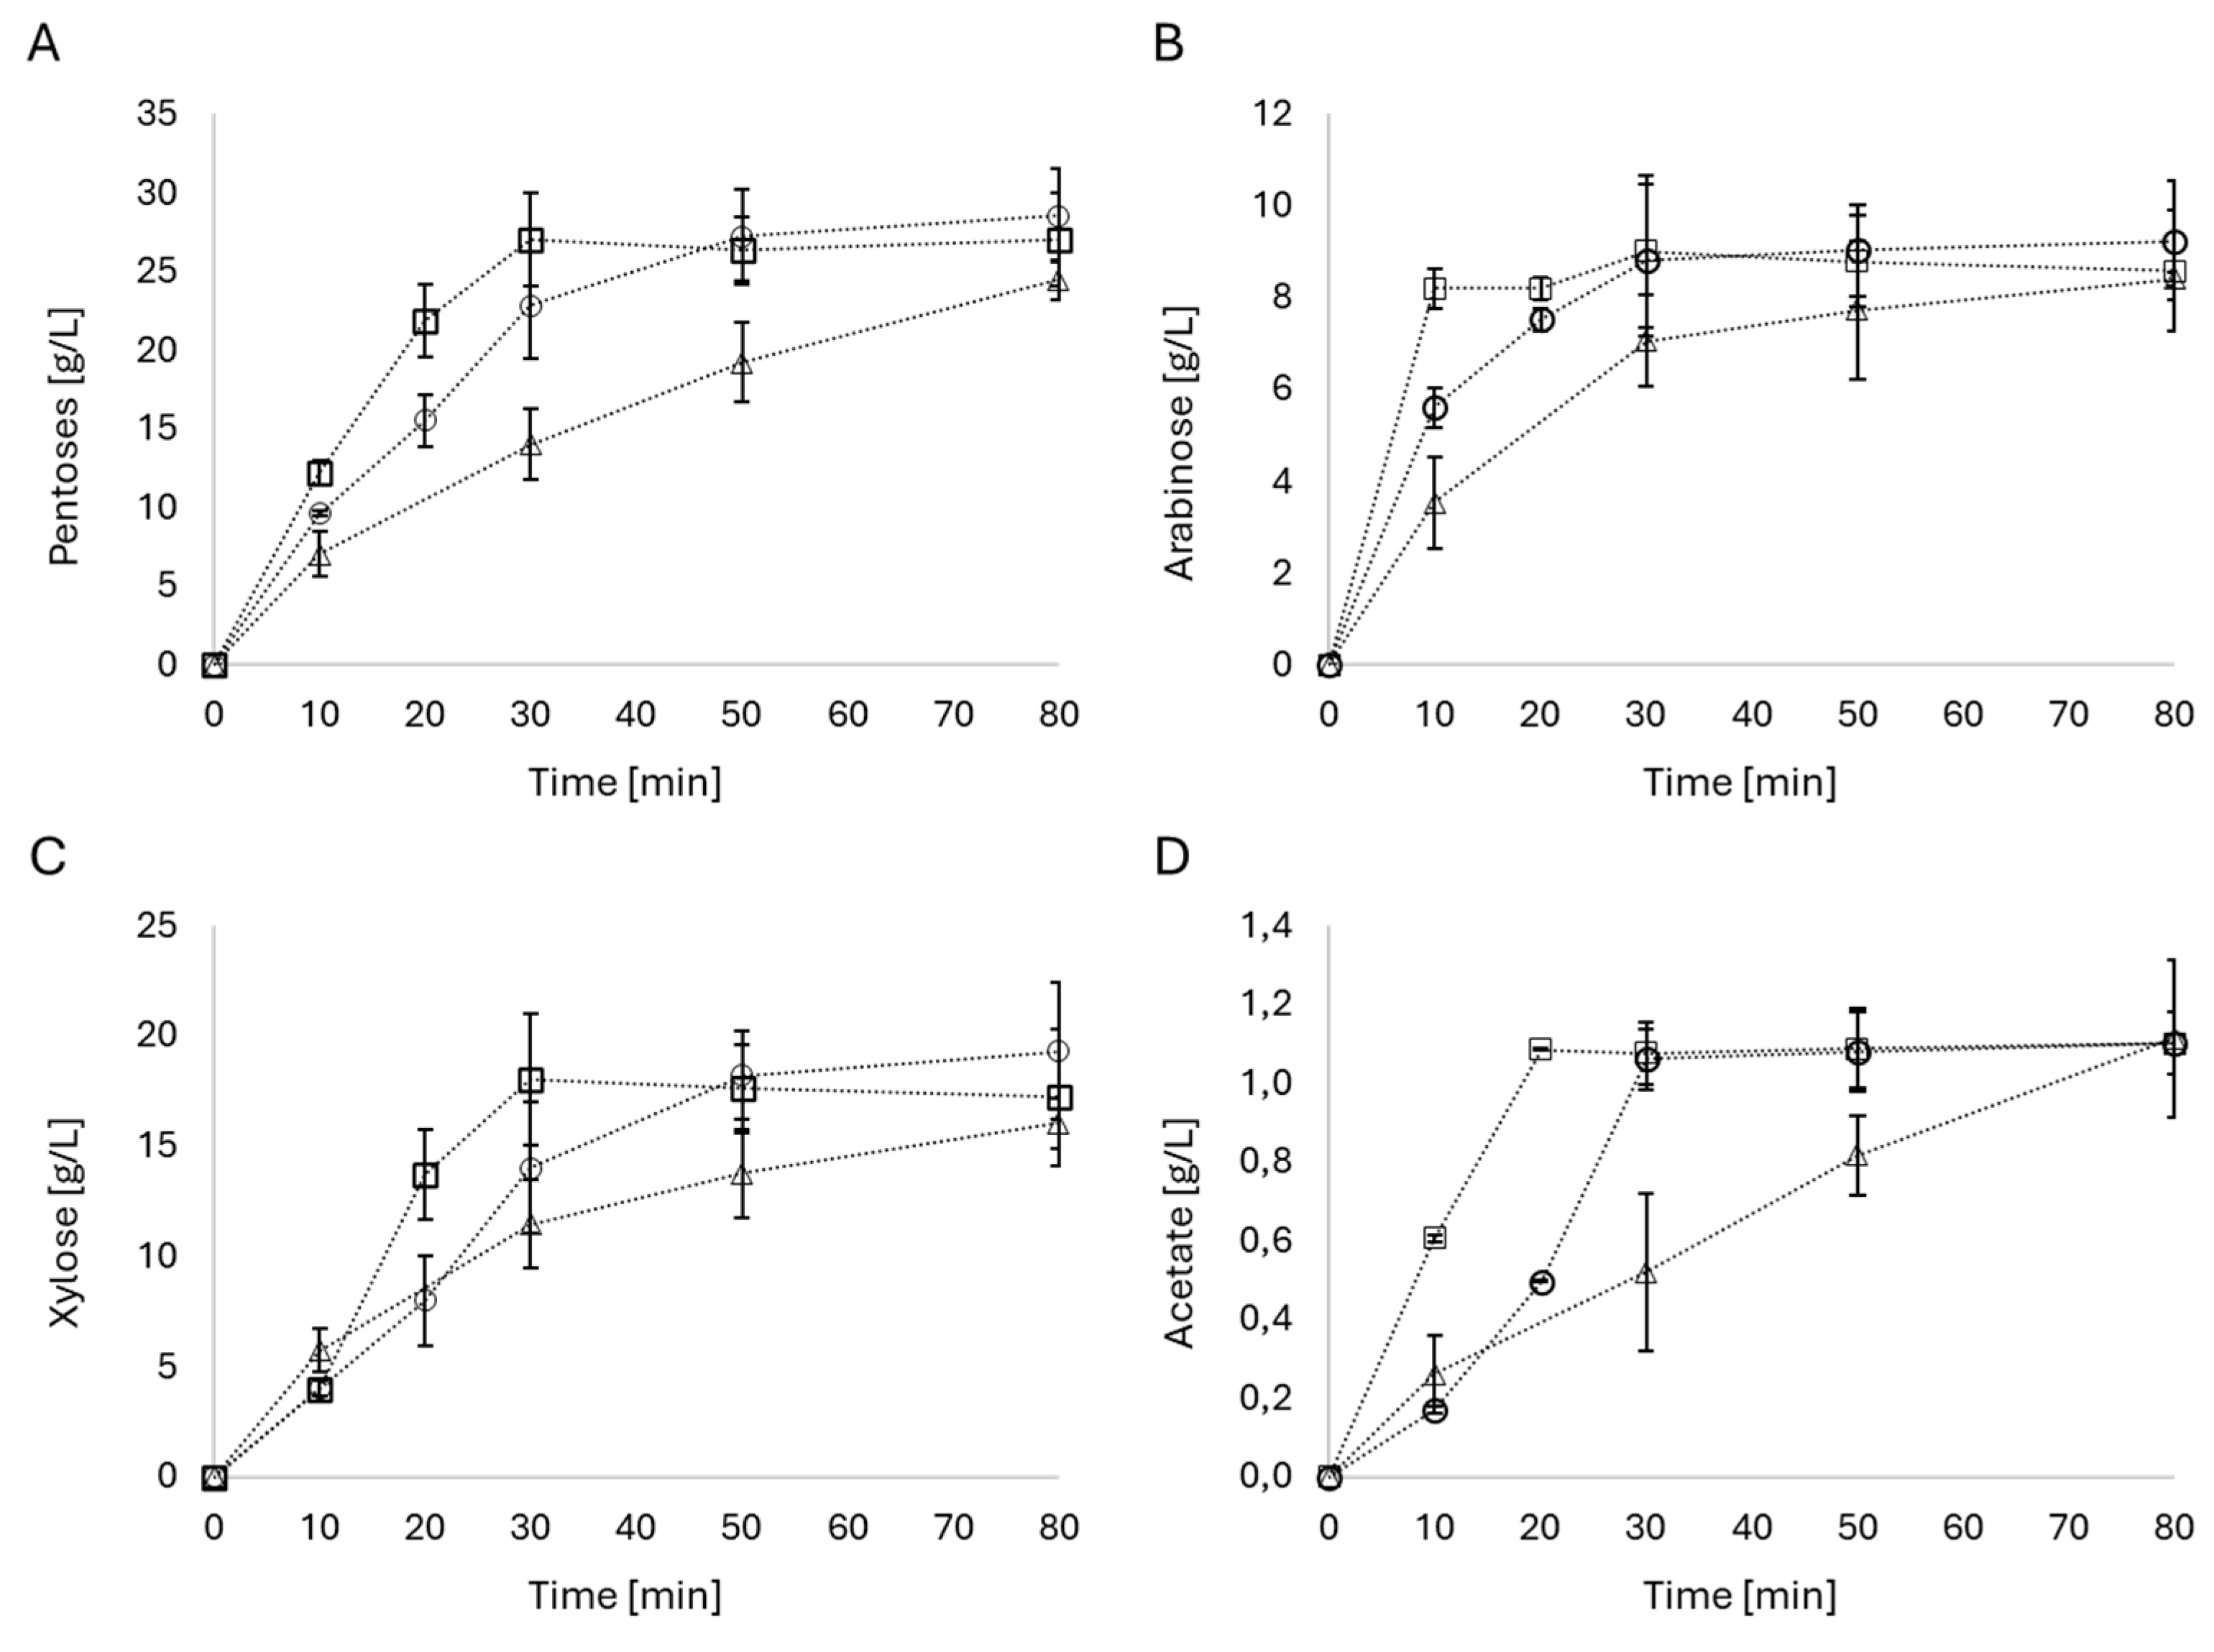
Component release dynamics over time show marked dependencies on T and [H₂SO₄]. The appearance of arabinose, xylose, and acetate in the liquid fraction was simultaneous. Arabinose release (≈9 g/L) for [T = 120 °C, [H2SO4] = 3.5% w/v] occurs very rapidly, in around 10 min, in contrast to [T = 120 °C, [H2SO4] = 1.5% w/v], where 20 min is required. Under the condition of [T = 100 °C, [H2SO4] = 1.5% w/v], achieving complete solubilization requires longer than 50 min. The maximum amount of xylose (≈18 g/L) is reached at 30 min for the condition [T = 120 °C, [H2SO4] = 3.5% w/v], 30-40 min for [T = 120 °C, [H2SO4] = 1.5% w/v], and longer than 80 min for [T = 100 °C, [H2SO4] = 1.5% w/v]. Regarding total pentoses (≈27 g/L), considering xylose and arabinose combined, under conditions of [T = 120 °C, [H2SO4] = 3.5% w/v], complete solubilization is achieved in around 30 min, whereas under conditions of [T = 120 °C, [H2SO4] = 1.5% w/v], between 30-40 min is required. Under the condition of [T = 100 °C, [H2SO4] = 1.5% w/v], achieving complete solubilization would imply a conditioning time longer than 80 min.
Acetate was released up to a maximum concentration of approx. 1.10 g/L across all tested conditions. The solubilization rate was highest for [T = 120 °C, [H2SO4] = 3.5% w/v], followed by [T = 120 °C, [H2SO4] = 1.5% w/v], and [T = 100 °C, [H2SO4] = 1.5% w/v].
Figs. (S4A, S4B, and S4C) show the release kinetics of arabinose, xylose, and acetate for the conditions [T = 110 °C, [H2SO4] = 2.5% w/v] and [T = 100 °C, [H2SO4] = 1.5% w/v]. As shown in Fig. (S4D), the condition [T = 110 °C, [H2SO4] = 2.5% w/v] displayed dynamics positioned between the conditions [T = 120 °C, [H2SO4] = 1.5% w/v] and [T = 100 °C, [H2SO4] = 1.5% w/v].
3.6. Furfural
Furfural concentration was quantified in treatments 4, 6, 8, 10, and 13, whose severities [] were the highest, ranging from 1.84 to 2.26. Assays 4, 6, 8, and 13 showed furfural concentrations <45 mg/L. In assay 10 [T = 120 °C, [H2SO4] = 3.5% w/v, t = 80 min], which possesses the highest tested severity (2.26), the furfural concentration was 164 ± 21 mg/L.
3.7. Fermentations
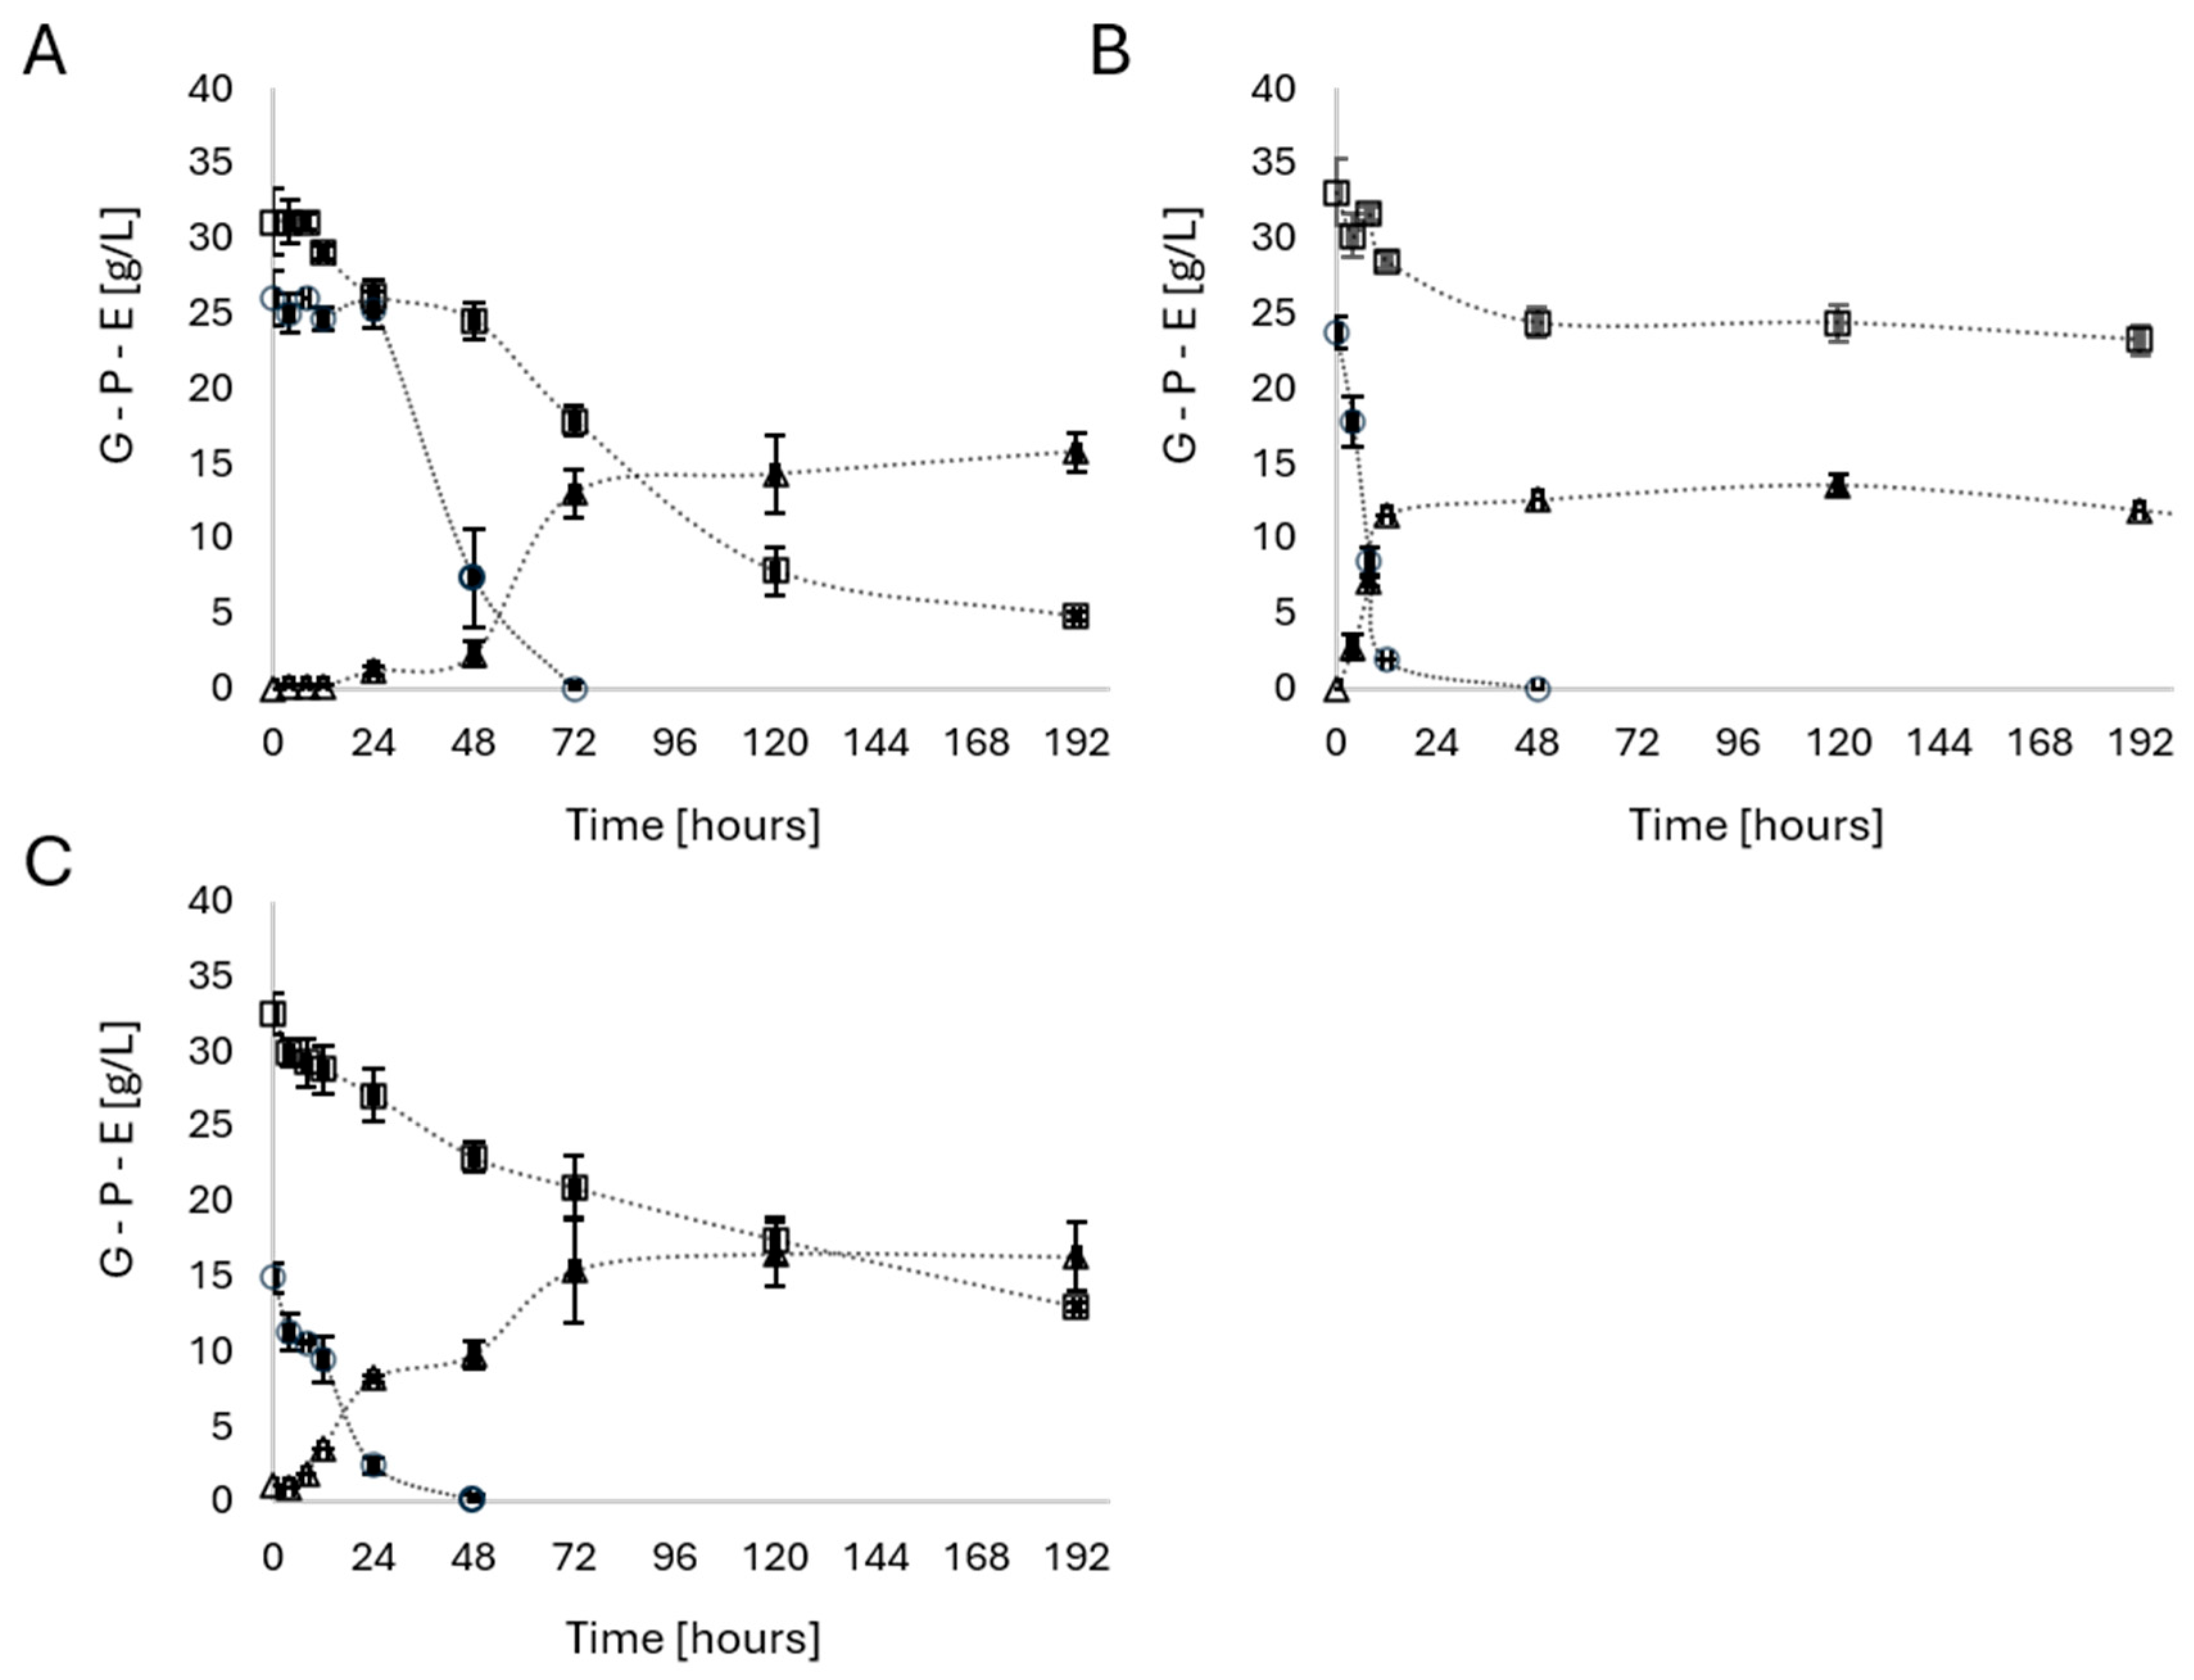
Figs. (4A, 4B, and 4C) show the time course of glucose, total pentoses, and ethanol concentrations during BSG hydrolysate fermentation assays using Sp. passalidarum NRRL Y-27907 and S. cerevisiae TMB3400.
Using a sequential saccharification and fermentation strategy, Sp. passalidarum NRRL Y-27907 reached an ethanol concentration of ≈13 g/L at 72 h (Fig. 4A), with an apparent ethanol yield relative to consumed sugars (glucose and pentoses), , of 0.33 g/g. Glucose was completely consumed between 24 and 72 h of fermentation, following an initial lag phase of approximately 24 h. Pentoses presented simultaneous consumption with glucose, reaching ≈43% removal at 72 h. Upon extending fermentation to 192 h, ethanol concentration increased to ≈15.7 g/L, with a of 0.30 g/g, while pentose removal reached ≈85%. Assays performed with Sp. passalidarum NRRL Y-27907 using the liquid fraction of saccharified BSG hydrolysate supplemented with yeast extract showed kinetic trends, ethanol yields, and sugar consumption rates similar to those observed during whole slurry fermentation (Fig. (S5A)).
Using a sequential saccharification and fermentation strategy, S. cerevisiae TMB3400 reached an ethanol concentration of ≈12.50 g/L at 48 h (Fig. (4B)), with an apparent ethanol yield relative to consumed sugars (glucose and pentoses), , of 0.39 g/g. Glucose was completely consumed within the first 12 h of fermentation, whereas xylose showed a removal of ≈18% and arabinose was not metabolized (Fig. (S5B)). After 48 h, no noticeable changes were observed in the remaining concentrations of xylose and arabinose or in ethanol production.
The implementation of a simultaneous saccharification and fermentation strategy at 30 °C (Fig. 4C) allowed achieving an ethanol concentration of ≈15.3 g/L at 72 h, with soluble glucose concentrations decreasing to undetectable values and a pentose removal of ≈36%, corresponding to a of 0.39 g/g. Xylose consumption initiated after 48 h of process. Extending the fermentation up to 192 h, the ethanol concentration reached ≈16.3 g/L and pentose removal increased to ≈60%, with a of 0.34 g/g.
Figure 4.
Time course of glucose, total pentoses, and ethanol concentrations during fermentations using (A) Sp. passalidarum NRRL Y-27907 (sequential saccharification and fermentation strategy), (B) S. cerevisiae TMB3400 (sequential saccharification and fermentation strategy), and (C) S. cerevisiae TMB3400 (simultaneous saccharification and fermentation strategy). Legend: (□) total pentoses, (∘) glucose, (Δ) ethanol.
Figure 4.
Time course of glucose, total pentoses, and ethanol concentrations during fermentations using (A) Sp. passalidarum NRRL Y-27907 (sequential saccharification and fermentation strategy), (B) S. cerevisiae TMB3400 (sequential saccharification and fermentation strategy), and (C) S. cerevisiae TMB3400 (simultaneous saccharification and fermentation strategy). Legend: (□) total pentoses, (∘) glucose, (Δ) ethanol.
4. Discussion
The determined chemical composition is consistent with those reported in the literature, as detailed in Table (S1). The cellulose content lies near the lower limit of the range [15-32%], whereas total hemicellulose falls within the mid-range [16-29%]. The relative hemicellulose composition in terms of xylan to total hemicellulose is highly conserved, in the range of 66-73%. The absence of starch in the biomass is attributed to a combination of the mashing policy of the brewing industry and the stabilization methodology carried out in this work. The acetate content accounted for 0.90-1.40%. The amount of acid-insoluble material is very difficult to differentiate from insoluble lignin, as it requires a detailed description of the experimental and calculation methods used by different authors. In our biomass, approximately 18% corresponds to acid-insoluble material, values similar to those found in the works of Wagner et al. (2021) [28] and Carvalheiro et al. (2004) [29], who used similar criteria and methodologies.
The joint response observed between hemicellulose solubilization (HS) and cellulose enzymatic hydrolysis efficiency (HE) suggests a structural hierarchy in the progress of acid pretreatment. The progressive removal of the hemicellulosic fraction reduces the physical and chemical barriers limiting enzyme access to cellulose, thereby favoring its subsequent conversion into glucose. Using a correlation strategy between HS and HE similar to that employed in the present work, Martín Gil Rolón et al. (2023) showed that the degree of saccharification of soybean hulls conditioned with H₂SO₄ strongly depended on the amount of hemicellulose removed [33].
The use of the combined severity factor (, in the range of 0.90 to 2.26) allowed for the integration of the thermal and chemical effects of pretreatment into a single variable [32-34]. The increase in this parameter is consistent with a simultaneous increase in available thermal energy and the catalytic strength of the acidic medium, promoting processes such as the hydrolysis of glycosidic bonds in hemicellulose, xylan debranching, the release of acetyl groups, and the progressive breakdown of hemicellulose–cellulose and hemicellulose–lignin interactions [34,35]. From this perspective, severity acts as an integrating parameter of the structural progress of pretreatment, linking operating conditions with the observed changes in the composition of the liquor and residual solid. The absence of a marked decrease in enzymatic hydrolysis efficiency at high severities, together with the presence of very low concentrations of inhibitors originating from glucose and pentose degradation (e.g., HMF, furfural), indicates that the system operates prior to the threshold of severe cellulose and hemicellulose degradation, enabling an isolated analysis of the enabling effect of hemicellulose solubilization on enzymatic accessibility.
A joint analysis of the kinetic assays and data from the experimental design suggests that, within the evaluated range of conditions, temperature exerts a more marked effect on pentose solubilization than H₂SO₄ concentration. The fitted model obtained for cellulose enzymatic hydrolysis efficiency (HE [%]) indicates that thermal severity dominates over chemical severity (T > t > [H2SO4]). Thermal energy controls structural accessibility more than [H⁺] concentration within the studied range; that is, T controls the activation energy for bond cleavage, while the acid acts as a catalyst but does not define the primary reaction pathway. The effect of T is enhanced when more acid is present, as the acid reduces the effective activation energy for hemicellulose hydrolysis and modulates its kinetics.
Severity↑⟶Hemicellulose Hydrolysis (HS)↑⟶Deacetylation↑⟶Cellulose Accessibility↑
⟶HE (%)↑
Table (2) summarizes the main contributions and relevant findings of selected studies focused on BSG conditioning with H₂SO₄, the methodological and analytical approaches implemented by the authors, and the composition of the resulting hydrolysates. To facilitate comparison and trend interpretation across studies, values of the combined severity parameter () were estimated from the reported operating conditions (T, [H₂SO₄], and t). Given that the considered studies employ different reference temperatures for calculating R0 (Tref = 90 or 100 °C), these values are used for qualitative comparative purposes rather than as strictly equivalent parameters across studies.

Table 2.
Literature background on thermochemical acid conditioning of brewery spent grain (BSG) using H2SO4.
Table 2.
Literature background on thermochemical acid conditioning of brewery spent grain (BSG) using H2SO4.
| Reference | Analysis Approach and Experimental Conditions | Findings / Key Observations | Final Hydrolysate Composition |
| [36] | • Used (Tref = 100 °C) in the range of 1.39-3.06.• Isothermal reaction time was the sole factor modifying . • L:S ratio of 8:1 w/w (≈115-128 g/L). T = 130 °C (autoclave) and [H2SO4]≈3.05% w/v. |
• At (≈15 min), pentose recovery ≈95%.• Arabinose recovery was practically constant across the range of 1.39-1.94.• Xylose recovery increased with . • Relatively earlier release of arabinose compared to xylose.• At , decrease in pentoses (degradation).At , complete solubilization of acetyl groups. |
At : xylose: 26.7 g/L; arabinose: 12.8 g/L; glucose: 4.0 g/L; acetate: 1.5 g/L; furfural: 0.29 g/L. |
| [19] | • Severity parameters were not used. • Analysis of the effect of L:S (83–125 g/L), [H2SO4] (0.8–1.8% w/v), and t (17, 27, and 37 min). • Fixed T of 120 °C.• () (Tref = 90 °C) estimated in the range of 1.1–1.7. |
High hemicellulose hydrolysis efficiency (89 − 96%) across all evaluated conditions. | Xylose: 14–23 g/L; arabinose: 7–11 g/L; glucose: <2 g/L; acetate: 0.76–1.39 g/L; furfural: 0.28–1.02 g/L; HMF: <0.1 g/L. |
| [27] | • Severity parameters were not used. • Box–Behnken design (17 treatments) with T (110 − 130 °C), [H2SO4] (1–3% w/v), and t (10 − 40 min). • Solid loading ≈125 g/L.• () (Tref = 90 °C) estimated in the range of 0.6–2.3. |
• High hemicellulose solubilization (73 − 98%), with low variation among treatments. • Second-order regression modeling with interactions. • T and [H2SO4] were significant; their interaction had a negative effect. Reaction time t was not significant. |
Representative treatment (No. 7): glucose: 9.44 g/L; xylose: 21.68 g/L; arabinose: 2.31 g/L; acetate: 1.08 g/L; furfural: 0.31 g/L. |
| [21] | • Severity parameters were not used. • Solid loading ≈150 g/L, [H2SO4]≈2% w/v. • T = 121 °C (autoclave) and t = 60 and 90 min.• () (Tref = 90 °C) estimated in the range of 2.0–2.2. |
• High hemicellulose solubilization (∼91% of xylan and ∼86.8% of arabinan). | Glucose: 9.44 g/L (residual starch); xylose: 21.5 g/L; arabinose: 11.1 g/L; acetate: 2.47 g/L; HMF: 0.08 g/L; furfural: 0.53 g/L. |
| References: ; L: Liquid ; S: Solid. () Combined severity values () were estimated from the reported operating conditions (T, [H2SO4], and t). | |||
Only Carvalheiro et al. (2004) [29] conducted a severity-based analysis to explain the effect of operational variables on the composition of the resulting liquid and solid fractions. Unlike our work, in which severity was varied through temperature, H₂SO₄ concentration, and reaction time, in their study, isothermal reaction time was the sole factor modifying severity (Tref = 100 °C) between 1.39 and 3.06. In Mussatto and Roberto (2005) [19], the effects of acid concentration and time were evaluated at a fixed temperature of 120 °C (autoclave), resulting in severities (Tref = 90 °C) ranging from 1.1 to 1.7. On the other hand, Rojas-Chamorro et al. (2020) [27] implemented a Box–Behnken experimental design with T [110-130 °C], H₂SO₄ concentration [1–3% w/v], and time [10–40 min] as independent factors, yielding treatment severities (Tref = 90 °C) of approximately 0.6 to 2.3.
In all studies, high pentose recovery was observed under low-to-medium severity conditions. Carvalheiro et al. (2004) [29] showed that arabinose recovery remained practically constant over the severity range of 1.39 to 1.94, whereas xylose recovery exhibited an increasing trend with rising severity. This behavior suggested a relatively earlier release of arabinose compared to xylose. This observation is consistent with our findings, both from the arabinose/glucose and xylose/glucose ratios obtained from the experimental design—used as indirect indicators of the degree of lignocellulosic matrix destructuration and the relative exposure of the cellulosic fraction—and from the xylose(t) and arabinose(t) profiles derived from kinetic assays. Together, these results are compatible with a preferential removal of arabinosyl substituents associated with arabinoxylans during early pretreatment stages, followed by progressive hydrolysis of the xylan backbone, which could promote subsequent cellulose accessibility.
Through the acetate/total pentoses ratio obtained from the experimental design and kinetic assays, we observed that hemicellulose deacetylation occurs simultaneously with the appearance of arabinose and xylose. Acetate serves as a direct chemical marker of severity, confirming that more intense treatments not only solubilize but also chemically modify the polymer chains. Carvalheiro et al. (2004) [29] reported that at a severity (Tref = 100 °C) of 2.04, all acetyl groups present in the starting material were already solubilized, and for higher severities the concentration remained constant. In the present work, at severities (Tref = 90 °C) greater than 1.25, solubilizations >80% were achieved (maximum recorded concentration of 1.38 g/L). In Mussatto and Roberto (2005) [19], hemicellulose hydrolysis efficiency was high across all evaluated conditions, ranging from 89 to 96%, with acetic acid concentrations between 0.76 and 1.39 g/L, indicating high solubilization. In Wagner et al. (2022) [21], at a severity (Tref = 90 °C) of 2.0–2.2, a liquid hydrolysate with an acetate concentration of 2.47 g/L was obtained, representing the highest value reported in the reviewed literature.
Furfural concentrations were relatively low (<1.0 g/L) across the wide range of severities tested in the literature (see Table (2), 'final hydrolysate composition'). Carvalheiro et al. (2004) [36] reported that severities (Tref = 100 °C) above 2.5 resulted in significant decreases in pentose recovery due to degradation reactions. These results are in agreement with our observations, where up to a severity of 2.26, pentose degradation was not significant, and the furfural concentration reached 164 mg/L. Regarding HMF, its occurrence is typically associated with the presence of glucose originating from residual starch in BSG. In our work, this inhibitor was not detected in the hydrolysates, and literature values report low or trace concentrations (<0.1 g/L).
Overall, the aforementioned literature demonstrates that while high hemicellulose solubilization is a consistent outcome across various studies, analytical approaches differ significantly. In this context, the use of severity parameters combined with statistical and kinetic analyses, as proposed in the present work, allows for a more integrated interpretation of the process.
The experimental results obtained in the present study and literature background indicate that BSG hydrolysates generated with H₂SO₄ at solid loadings between 80 and 150 g/L, under severities allowing high hemicellulose solubilization, yield very similar final compositions (see Table (2)), with xylose concentrations of 14 to 27 g/L, arabinose of 7 to 13 g/L, glucose (from residual starch) of 4 to 10 g/L, and a low content of fermentation inhibitors. In the present work, using a BSG loading of 133 g/L, we obtained a hydrolysate containing 18 g/L xylose and 8 g/L arabinose. Glucose concentration depends directly on the amount of residual starch present in the raw BSG.
The saccharification of whole slurries or the resulting cellulose-enriched solid fraction has been evaluated under various operational conditions. Wagner et al. (2022) [21] performed the saccharification of the whole neutralized hydrolysate (pH 4.8) in 50 mM citrate buffer using Accellerase 1000 at 20 FPU/g glucan, at 50 °C for 24 h, achieving a cellulose recovery efficiency of 72%. Rojas-Chamorro et al. (2020) [27] utilized Cellic CTec3® at 15 FPU/g solid (≈60 FPU/g cellulose) and a β-glucosidase (Novozym 188) for 24 h to hydrolyze post-conditioning solids at a 5% w/v loading. Cellulose hydrolysis yields ranged from 54 to 83%. In that study, enzymatic hydrolysis efficiency was modeled with a high degree of fit using a second-order equation with interactions. However, the authors did not report the fitted equation in coded terms, precluding an analysis of the relative impact of each factor. From the presented plots, it can be inferred that T exerts a positive effect, consistent with our results. In the present work, enzymatic hydrolysis was carried out on the neutralized whole slurry (pH 5.5) using Cellic CTec2® at ≈13 FPU/g cellulose, at 50 °C for 24 h. As previously noted, the conditions [T = 120 °C, t = 80 min, [H2SO4] = 3.5% w/v] and [T = 127 °C, t = 55 min, [H2SO4] = 2.5% w/v] showed the highest cellulose recoveries, at approx. 69%. This value compares favorably considering the saccharification time and enzyme mixture dosage tested.
Various strategies have been explored for 2G ethanol production from BSG, including: (i) thermochemical conditioning, solid-liquid separation, and stream reprocessing—via enzymatic hydrolysis of the cellulose-enriched solid fraction in buffers (e.g., citrate) at a higher polymer concentration relative to the raw pretreated material, and concentration of the pentose-rich liquid stream via evaporation—followed by fermentation using conventional Saccharomyces and non-conventional yeasts; and (ii) fermentation of the resulting whole slurry using a single conventional or non-conventional yeast strain, or co-inocula of conventional and non-conventional strains, to cover the entire spectrum of available sugars. These strategies also accommodate separate hydrolysis and fermentation (SHF) and simultaneous saccharification and fermentation (SSF) configurations. From techno-economic and operational perspectives, joint fermentation of hexoses and pentoses directly from the whole slurry appears most promising, as it avoids complex stream processing steps and mandatory detoxification.
BSG solid loadings reported in the literature within the context of 2G ethanol range from 80 to 250 g/L; however, operationally feasible loadings at an industrial production scale are ≤160 g/L [37,38]. At solid concentrations exceeding 15-16% w/v, the absence of free water transforms the lignocellulosic suspension into a high-viscosity paste, significantly increasing the energy required for mechanical agitation.
Based on typical BSG compositions and being conservative, a content of 20% cellulose, 15% xylan, and 7% arabinan can be established. With this loading and composition, considering an ethanol yield from glucose (YE/Glu) of 0.4 gethanol/gglucose and from xylose (YE/Xyl) of 0.3 gethanol/gxylose—excluding arabinose as an ethanol source for this estimation—the ethanol concentration potentially obtainable by alcoholic fermentation with conventional, non-conventional, and recombinant yeasts would be ≈18 g/L. This would represent a yield of 0.11 gethanol/gBSG, placing it near the minimum techno-economic feasibility constraints reported in the literature for ethanol production processes from lignocellulosic biomass (0.12 gethanol/gbiomass). The yield can be increased by using BSG endowed with residual starch from the brewing process; however, such batches usually originate from medium- or small-scale craft breweries [26], challenging the vision of massive 2G biofuel production.
Sp. passalidarum NRRL Y-27907 was selected due to its native capability to ferment xylose to ethanol, and because it demonstrated superior fermentative performance among several yeast strains and operational conditions tested by Bolzico et al. (2024) [39].
During the fermentation of the BSG whole slurry, Sp. passalidarum NRRL Y-27907 exhibited a 24 h lag phase before initiating sugar consumption, a behavior that could be attributed to physiological adaptation to the hydrolysate and/or the presence of inhibitors. Once the lag phase was overcome, the yeast simultaneously consumed glucose and pentoses, producing ethanol. These results are consistent with a joint contribution of glucose and xylose to ethanol production. Guzmán et al. (2024) [40] observed that in synthetic media with pure sugars, Sp. passalidarum NRRL Y-27907 displayed ethanol-from-glucose and ethanol-from-xylose yields of 0.34 g/g and 0.40 g/g, respectively. In synthetic media containing glucose and xylose mixtures, Sp. passalidarum NRRL Y-27907 presented a predominantly sequential consumption pattern, where xylose utilization intensified following glucose depletion [40]. In contrast, during the BSG hydrolysate fermentation in the present work, a temporal overlap between glucose consumption and pentose removal was observed, compatible with partial co-consumption. This difference suggests that the metabolic behavior of the strain may be altered in complex lignocellulosic matrices compared to defined synthetic media, although the specific factors responsible for this shift cannot be established from the present experiments. Martinez-Jimenez et al. (2021) [41] compiled data from various studies evaluating the fermentative performance of Spathaspora on lignocellulosic-derived media, with no data currently reported for BSG.
In the BSG fermentation over a 72-h period, an ethanol concentration of ≈13 g/L and an apparent yield () of 0.33 g/g were observed, with glucose completely consumed and pentoses removed by 43%. Despite the presence of remaining pentoses in the medium, only marginal additional amounts of ethanol were produced. Racca et al. (2025) experimentally confirmed that although arabinose is metabolized, it is not fermented to ethanol by Sp. passalidarum NRRL Y-27907 [42]. From a process perspective, extending fermentation beyond 72 h did not yield a substantial improvement in ethanol production under the evaluated conditions, reaching an overall yield of 0.10 gethanol/gBSG.
Nutrient supplementation of the BSG hydrolysate supernatant with yeast extract produced no kinetic or stoichiometric improvements, suggesting that nutrient availability was not a dominant limiting factor under these conditions. Under these culture conditions, after 72 h, pentose removal continued accompanied by only a marginal ethanol gain and without an appreciable increase in biomass—as quantified by OD600 nm—indicating that a fraction of the carbon source may have been directed toward cellular maintenance and/or unquantified metabolites. Glycerol formation was not observed.
Several studies have concluded from assays in solid and liquid media that Sp. passalidarum NRRL Y-27907 exhibits low ethanol tolerance [40,43], making its enhancement a key requirement for its successful adoption as a biotechnological platform for 2G bioethanol production. Improving ethanol tolerance could also favor its integration with Saccharomyces strains in co-culture strategies. Laboratory adaptive evolution represents an attractive approach to enhance both ethanol and inhibitor tolerance in Sp. passalidarum [44,45].
S. cerevisiae TMB3400 is a recombinant yeast strain resulting from the insertion of xylose metabolic genes from Scheffersomyces stipitis and selection/mutagenesis cycles to enhance growth on xylose [46]. Owing to its S. cerevisiae background, the strain retains inherent physiological advantages, such as fermentative robustness, relatively high ethanol tolerance, and greater overall resistance to adverse conditions (including fermentation inhibitors) compared to many non-conventional yeasts. Furthermore, it has demonstrated the capability to metabolize xylose and glucose simultaneously [47].
The limited overall xylose fermentation by S. cerevisiae TMB3400 in the sequential saccharification and fermentation assays of this work may be attributed to the rapid consumption of glucose relative to xylose. In fermentation assays using synthetic media containing xylose alone, the volumetric rate of xylose consumption is relatively low compared to glucose, whereas in glucose-xylose mixtures, xylose is consumed at an accelerated rate as long as significant amounts of glucose remain available. Once glucose is completely depleted, the rate of xylose consumption can decrease drastically. Souto-Maior et al. (2009) [47] established that xylose cannot trigger the expression of sugar transporters or glycolytic enzymes to the same extent as glucose. In the presence of glucose, metabolic flux through glycolysis increases, allowing xylose to be consumed more rapidly than when supplied as the sole carbon source.
The simultaneous saccharification and fermentation strategy at 30 °C aimed to maintain a sustained flux of glucose release during fermentation, governed by the balance between its generation via enzymatic hydrolysis and its cellular consumption. This process configuration enabled achieving an ethanol concentration of ≈15.3 g/L at 72 h, a pentose removal of 36%, a of 0.39 g/g, and an overall process yield of 0.10 gethanol/gBSG.
It is also essential to highlight the potential negative role of fermentation inhibitors present in the BSG hydrolysate, as they could differentially affect the fermentative metabolism of glucose and xylose, with xylose pathways potentially being more sensitive.
Liguori et al. (2015) applied a multi-stage sequential scheme (acid + alkali + enzymatic hydrolysis at 10% solids + filtration + dilution). Although they obtained a very clean, glucose-rich liquid hydrolysate (75 g/L), the dilution prior to fermentation (50 g/L) and a moderate metabolic yield (55% of theoretical) limited the final ethanol titer to 12.79 g/L [48].
By operating at a high solid loading (≈25% w/v) in a whole slurry format using BSG from a craft brewery and an S. cerevisiae strain, Pinheiro et al. (2019) [26] managed to break the techno-feasibility barrier, obtaining an ethanol concentration of 42 g/L, demonstrating that a liquor technically suitable for conventional industrial distillation can be achieved. However, the operational conditions and those related to the raw material could present difficulties for industrial scaling.
Regarding multi-stream fermentation approaches, Rojas-Chamorro et al. (2020) [27] evaluated different strategies on BSG pretreated with dilute H2SO4 (130 °C, 1.25% w/v, 20 min) at a solid loading of 15% w/v. When fermenting the liquid fraction alone (≈34.8 g/L total sugars, mainly pentoses), a modest ethanol concentration of 8.1 g/L was obtained using Sc. stipitis. Conversely, fermenting the enzymatic hydrolysate of the solid fraction (40.8 g/L glucose) with S. cerevisiae reached 19.3 g/L ethanol. To maximize total sugar conversion, an integrated strategy combining both streams (S+L, with 46.7 g/L mixed sugars) was implemented through sequential inoculation of S. cerevisiae followed by a recombinant Escherichia coli SL100 strain. This sequential approach achieved complete sugar consumption, reaching a maximum ethanol concentration of 18.9 g/L and an overall process yield of 0.14 gethanol/gBSG. E. coli SL100 has demonstrated the capability to ferment arabinose to ethanol, although this can be accompanied by the production of acetate and other organic acids [21].
A possible strategy to improve xylose utilization efficiency by S. cerevisiae TMB3400 during SSF at 30 °C consists of reducing the enzymatic loading of Cellic CTec2®, aiming to modulate the rate of glucose release and favor its joint utilization with xylose. This strategy would seek to establish a coupling between the rate of glucose generation by enzymatic hydrolysis and its rate of consumption by the yeast, maintaining a sustained availability of the sugar during fermentation. Furthermore, reducing the enzyme loading could contribute to lowering operational process costs. In this sense, it is of interest to explore a dosage range that allows reducing the hydrolysis rate without significantly compromising final cellulose conversion or overall process productivity.
On the other hand, Gil Rolón et al. (2023) [33] evaluated the thermochemical conditioning of soybean hulls (SH) using dilute H2SO4, identifying operating conditions of 121 °C, 2.5% w/v H2SO4, and 60 min, which allowed achieving high hemicellulose solubilization efficiencies and subsequent cellulose enzymatic hydrolysis, with low generation of fermentation inhibitors. The similarity between these conditions and those used in the present work suggests the existence of a compatible operating window for the co-conditioning of both biomasses.
The co-utilization of BSG and SH would allow modulating the ratio between C6 and C5 carbohydrates of the substrate, increasing the potential glucose reservoir without excessively reducing xylose availability. SH presents a content of approximately 45% cellulose and 15.1% hemicellulose [33], of which nearly 67% corresponds to xylan. In this sense, mixtures with BSG proportions between 40% and 60% would substantially increase the cellulosic fraction compared to BSG used individually, while maintaining a relevant xylan proportion. As an estimation, an equimass mixture of BSG and SH, with a total solid loading of 160 g/L, would allow reaching a potential ethanol concentration of approximately 28 g/L (0.17 gethanol/gBSG), considering complete recovery and consumption of glucose and xylose, and fermentative yields of 0.40 and 0.30 gethanol/gsugar, respectively. Under an SSF strategy, the larger cellulose reservoir could favor a sustained release of glucose over longer periods and, potentially, improve the joint utilization of glucose and xylose by recombinant strains such as S. cerevisiae TMB3400. The experimental evaluation of these mixtures would determine the effect of substrate composition on saccharification dynamics, sugar consumption, and ethanol production.
Regarding 2G ethanol production using yeasts as fermentative platforms, more targeted research is required, focusing on the individual and combined effects of fermentation inhibitors on sugar utilization and fermentative efficiency in glucose-xylose mixtures. Currently, such information is limited in the literature for Sp. passalidarum NRRL Y-27907 and S. cerevisiae TMB3400 strains. Furthermore, fermentation strategies employing co-cultures between conventional strains—native, adapted, or modified—and non-conventional yeasts could hold potential regarding the degree of BSG pentose utilization and the mitigation of fermentation inhibitor effects.
Further techno-operational and economic feasibility studies, along with scaled experimental platforms, are required for more accurate analyses regarding the real applicability of 2G ethanol production technology.
A scenario of comprehensive brewery waste valorization from a consolidated bioprocess perspective—where residual brewing yeast is utilized as a fermenting agent and for the production of nutrient-rich extracts, especially readily assimilable nitrogen [49,50], while spent grain serves as a substrate for producing enzymes used in its conditioning (e.g., cellulases and xylanases) [28] as well as a source of fermentable sugars—could prove to be potentially profitable.
5. Conclusion
Industrial brewery spent grain (BSG) with negligible starch content provided a realistic reference scenario to advance the understanding of thermochemical conditioning using dilute sulfuric acid for 2G bioethanol production processes. A combined experimental approach integrating a central composite design and kinetic assays successfully discriminated the individual and combined effects of temperature (T), H2SO4 concentration, and residence time (t) on hemicellulose solubilization and cellulose recovery efficiency. A reduced quadratic model accurately described cellulose enzymatic hydrolysis at an initial time of 24 h, establishing an operational factor hierarchy dominated by temperature (T > t > [H2SO4]). Furthermore, a combined thermochemical severity factor () proved statistically superior to a purely thermal severity factor (logR0) in capturing experimental variability.
At a solid loading of 150-160 g/L, operational conditions of 121 °C, 60 min, and 2.5% w/v H2SO4 achieved a cellulose recovery efficiency superior to 70% using a low enzyme dosage (), with >90% hemicellulose solubilization and low inhibitor generation (HMF, furfural, and acetate). Fermentation of the non-detoxified and unsupplemented whole slurry confirmed that the hydrolysate naturally supplies the macro- and micronutrients required for ethanol production.
The non-conventional yeast Spathaspora passalidarum NRRL Y-27907 partially co-utilized glucose and pentoses under a sequential saccharification and fermentation (SHF) scheme, converting both sugar fractions into ethanol. Meanwhile, the recombinant Saccharomyces cerevisiae TMB3400 exhibited superior pentose consumption rates under a simultaneous saccharification and fermentation (SSF) configuration. These findings provide valuable baseline data on two fermentative platforms scarcely explored on non-detoxified BSG hydrolysates, underscoring the critical need to align process operations with strain physiology.
Beyond these operational findings, publishing comprehensive kinetic conditioning datasets is of paramount importance. These data serve as a foundational database for building dynamic models to predict biomass behavior across varied solid loadings and unassayed operational conditions. Furthermore, they enable techno-economic scenario analyses to resolve trade-offs and determine whether to prioritize temperature, residence time, or acid concentration in process optimization.
Looking forward, co-processing BSG with soybean hulls presents significant theoretical and practical potential to modulate the C6/C5 sugar ratio at industrial solid loadings, enhancing the overall feasibility of 2G bioethanol production. Large breweries remain strategic biofactories for 2G bioethanol feedstocks within consolidated bioprocess schemes, where the future bioprospecting and engineering of arabinose-fermenting ethanol strains will be essential to fully maximize the value of BSG in sustainable biorefineries.
Supplementary Materials
The following supporting information can be downloaded at the website of this paper posted on Preprints.org.
Author Contributions
Conceptualisation: R.J.L., A.C. and R.N.C.; Methodology: R.J.L., M.G.R. and T.L.; Software: R.J.L., M.G.R. and T.L.; Data analysis: R.J.L., M.G.R. and T.L.; Writing-original draft preparation: R.J.L. and R.N.C.; Writing-review and editing: R.J.L. and R.N.C.; Visualization: A.C., T.L.; Supervision: R.N.C. All authors have read and agreed to the published version of the manuscript.
Funding
This work was supported by the Universidad Nacional del Litoral (UNL) via the CAI+D Program [grant 50620190100054LI, the CONICET, the ANPCyT [PICT-2020-01170] and by the CELISE (https://celise.unican.es/) project from the European Union’s Horizon 2020 research and innovation program [Marie Sklodowska Curie grant agreement No 101007733].
Data Availability Statement
The data presented in this study are available on request from the corresponding author.
Acknowledgments
The authors gratefully acknowledge the contributions of students, colleagues, and technical staff who provided assistance and support, either directly or indirectly, throughout the development and execution of this research. Their valuable collaboration, technical assistance, and contributions to the experimental activities are sincerely appreciated.
Conflicts of Interest
The authors declare no conflicts of interest and no competing financial interests.
References
- Mussatto, S.I.; Dragone, G.; Roberto, I.C. Brewers’ spent grain: generation, characteristics and potential applications. J. Cereal Sci. 2006, 43, 1–14. [Google Scholar] [CrossRef]
- Lynch, K.M.; Steffen, E.J.; Arendt, E.K. Brewers’ spent grain: a review with an emphasis on food and health. J. Inst. Brew. 2016, 122, 553–568. [Google Scholar] [CrossRef]
- Steiner, J.; Procopio, S.; Becker, T. Brewer’s spent grain: source of value-added polysaccharides for the food industry in reference to the health claims. Eur. Food Res. Technol. 2015, 241, 303–315. [Google Scholar] [CrossRef]
- Lamas, D.L.; Gende, L.B. Valorisation of brewers’ spent grain for the development of novel beverage and food products. Appl. Food Res. 2023, 3, 100314. [Google Scholar] [CrossRef]
- Pabbathi, N.P.P.; Velidandi, A.; Pogula, S.; Gandam, P.K.; Baadhe, R.R.; Sharma, M.; Sirohi, R.; Thakur, V.K.; Gupta, V.K. Brewer’s spent grains-based biorefineries: A critical review. Fuel 2022, 317, 123435. [Google Scholar] [CrossRef]
- Mitri, S.; Salameh, S.-J.; Khelfa, A.; Leonard, E.; Maroun, R.G.; Louka, N.; Koubaa, M. Valorization of Brewers’ Spent Grains: Pretreatments and Fermentation, a Review. Fermentation 2022, 8, 50. [Google Scholar] [CrossRef]
- Chattaraj, S.; Mitra, D.; Ganguly, A.; Thatoi, H.; Das Mohapatra, P.K. A critical review on the biotechnological potential of Brewers’ waste: Challenges and future alternatives. Curr. Res. Microb. Sci. 2024, 6, 100228. [Google Scholar] [CrossRef]
- Outeiriño, D.; Costa-Trigo, I.; Ochogavias, A.; Pinheiro de Souza Oliveira, R.; Pérez Guerra, N.; Salgado, J.M.; Domínguez, J.M. Biorefinery of brewery spent grain to obtain bioproducts with high value-added in the market. New Biotechnol. 2024, 79, 111–119. [Google Scholar] [CrossRef]
- Mainardis, M.; Hickey, M.; Dereli, R.K. Lifting craft breweries sustainability through spent grain valorisation and renewable energy integration: A critical review in the circular economy framework. J. Clean. Prod. 2024, 447, 141527. [Google Scholar] [CrossRef]
- Puligundla, P.; Mok, C. Recent advances in biotechnological valorization of brewers’ spent grain. Food Sci. Biotechnol. 2021, 30, 341–353. [Google Scholar] [CrossRef]
- Jain, S.; Kumar, S. A comprehensive review of bioethanol production from diverse feedstocks: Current advancements and economic perspectives. Energy 2024, 296, 131130. [Google Scholar] [CrossRef]
- Guimarães, C.E.C.; Neto, F.S.; de Castro Bizerra, V.; do Nascimento, J.G.A.; Valério, R.B.R.; de Sousa Junior, P.G.; de Sousa Braz, A.K.; Melo, R.L.F.; de França Serpa, J.; de Lima, R.K.C.; Guimarães, A.P.; de Souza, M.C.M.; Lopes, A.A.S.; de Sousa Rios, M.A.; Desai, A.S.; Bilal, M.; Smułek, W.; Jesionowski, T.; dos Santos, J.C.S. Sustainable bioethanol production from first- and second-generation sugar-based feedstocks: Advanced bibliometric analysis. Bioresour. Technol. Rep. 2023, 23, 101543. [Google Scholar] [CrossRef]
- Pinheiro, L.P.; Longati, A.A.; Elias, A.M.; Perez, C.L.; Pereira, L.P.R. da C.; Zangirolami, T.C.; Furlan, F.F.; Giordano, R. de C.; Milessi, T.S. Improving the Feasibility of 2G Ethanol Production from Lignocellulosic Hydrolysate Using Immobilized Recombinant Yeast: A Technical–Economic Analysis and Life Cycle Assessment. Fermentation 2025, 11, 116. [Google Scholar] [CrossRef]
- Woźniak; Kuligowski, K.; Świerczek, L.; Cenian, A. Review of Lignocellulosic Biomass Pretreatment Using Physical, Thermal and Chemical Methods for Higher Yields in Bioethanol Production. Sustainability 2025, 17, 287. [Google Scholar] [CrossRef]
- Farheen, V. Humera; Abdullah, M. Aslam; Moorthy, I. Ganesh. Lignocellulosic bioethanol production: a review on pretreatment strategies, biofuel separation, and artificial intelligence/machine learning − based sustainable optimization. Curr. Res. Biotechnol. 2026, 11, 100355. [Google Scholar] [CrossRef]
- du Pasquier, J.; Paës, G.; Perré, P. Principal factors affecting the yield of dilute acid pretreatment of lignocellulosic biomass: A critical review. Bioresour. Technol. 2023, 369, 128439. [Google Scholar] [CrossRef]
- Kululo, W.W.; Habtu, N.G.; Abera, M.K.; Sendekie, Z.B.; Fanta, S.W.; Yemata, T.A. Advances in various pretreatment strategies of lignocellulosic substrates for the production of bioethanol: a comprehensive review. Discov. Appl. Sci. 2025, 7, 476. [Google Scholar] [CrossRef]
- Koppram, R.; Tomás-Pejó, E.; Xiros, C.; Olsson, L. Lignocellulosic ethanol production at high-gravity: challenges and perspectives. Trends Biotechnol. 2014, 32, 46–53. [Google Scholar] [CrossRef]
- Mussatto, S.I.; Roberto, I.C. Acid hydrolysis and fermentation of brewer’s spent grain to produce xylitol. J. Sci. Food Agric. 2005, 85, 2453–2460. [Google Scholar] [CrossRef]
- Paz; Outeiriño, D.; Pérez Guerra, N.; Domínguez, J.M. Enzymatic hydrolysis of brewer’s spent grain to obtain fermentable sugars. Bioresour. Technol. 2019, 275, 402–409. [Google Scholar] [CrossRef]
- Wagner, E.; Sierra-Ibarra, E.; Rojas, N.L.; Martinez, A. One-pot bioethanol production from brewery spent grain using the ethanologenic Escherichia coli MS04. Renew. Energy 2022, 189, 717–725. [Google Scholar] [CrossRef]
- Wahlbom, C.F.; van Zyl, W.H.; Jönsson, L.J.; Hahn-Hägerdal, B.; Otero, R.R.C. Generation of the improved recombinant xylose-utilizing Saccharomyces cerevisiae TMB 3400 by random mutagenesis and physiological comparison with Pichia stipitis CBS 6054. FEMS Yeast Res. 2003, 3, 319–326. [Google Scholar] [CrossRef]
- Ohgren, K.; Bengtsson, O.; Gorwa-Grauslund, M.F.; Galbe, M.; Hahn-Hägerdal, B.; Zacchi, G. Simultaneous saccharification and co-fermentation of glucose and xylose in steam-pretreated corn stover at high fiber content with Saccharomyces cerevisiae TMB3400. J. Biotechnol. 2006, 126, 488–498. [Google Scholar] [CrossRef]
- APHA. Standard Methods for the Examination of Water and Wastewater. 19th Edition; American Public Health Association Inc., New York. - References - Scientific Research Publishing, 1995; Available online: https://www.scirp.org/reference/referencespapers?referenceid=1916575 (accessed on 17 September 2026).
- Eberts, T.J.; Sample, R.H.; Glick, M.R.; Ellis, G.H. A simplified, colorimetric micromethod for xylose in serum or urine, with phloroglucinol. Clin. Chem. 1979, 25, 1440–1443. [Google Scholar] [CrossRef]
- Pinheiro, T.; Coelho, E.; Romaní, A.; Domingues, L. Intensifying ethanol production from brewer’s spent grain waste: Use of whole slurry at high solid loadings. New Biotechnol. 2019, 53, 1–8. [Google Scholar] [CrossRef]
- Rojas-Chamorro, J.A.; Romero, I.; López-Linares, J.C.; Castro, E. Brewer’s spent grain as a source of renewable fuel through optimized dilute acid pretreatment. Renew. Energy 2020, 148, 81–90. [Google Scholar] [CrossRef]
- Wagner, E.; Pería, M.E.; Ortiz, G.E.; Rojas, N.L.; Ghiringhelli, P.D. Valorization of brewer’s spent grain by different strategies of structural destabilization and enzymatic saccharification. Ind. Crops Prod. 2021, 163, 113329. [Google Scholar] [CrossRef]
- Carvalheiro, F.; Duarte, L.C.; Medeiros, R.; Gírio, F.M. Optimization of Brewery’s spent grain dilute-acid hydrolysis for the production of pentose-rich culture media. 2004, 113. [Google Scholar]
- Kanauchi; Mitsuyama, K.; Araki, Y. Development of a functional germinated barley foodstuff from brewer’s spent grain for the treatment of ulcerative colitis. J. Am. Soc. Brew. Chem. 2001, 59, 59–62. [Google Scholar] [CrossRef]
- Meneses, N.G.T.; Martins, S.; Teixeira, J.A.; Mussatto, S.I. Influence of extraction solvents on the recovery of antioxidant phenolic compounds from brewer’s spent grains. Sep. Purif. Technol. 2013, 108, 152–158. [Google Scholar] [CrossRef]
- Waters, D.; Jacob, F.; Titze, J.; Arendt, E.; Zannini, E. Fibre, protein and mineral fortification of wheat bread through milled and fermented brewer’s spent grain enrichment. Eur. Food Res. Technol. 2012, 235, 767–778. [Google Scholar] [CrossRef]
- Gil Rolón, M.; Leonardi, R.J.; Bolzico, B.C.; Seluy, L.G.; Benzzo, M.T.; Comelli, R.N. Multi-Response Optimization of Thermochemical Pretreatment of Soybean Hulls for 2G-Bioethanol Production. Fermentation 2023, 9, 454. [Google Scholar] [CrossRef]
- Alvira, P.; Tomás-Pejó, E.; Ballesteros, M.; Negro, M.J. Pretreatment technologies for an efficient bioethanol production process based on enzymatic hydrolysis: A review. Bioresour. Technol. 2010, 101, 4851–4861. [Google Scholar] [CrossRef]
- Hendriks, A.T.W.M.; Zeeman, G. Pretreatments to enhance the digestibility of lignocellulosic biomass. Bioresour. Technol. 2009, 100, 10–18. [Google Scholar] [CrossRef]
- Carvalheiro, F.; Duarte, L.C.; Medeiros, R.; Gírio, F.M. Optimization of Brewery’s spent grain dilute-acid hydrolysis for the production of pentose-rich culture media. 2004, 113. [Google Scholar]
- Modenbach, A.A.; Nokes, S.E. Enzymatic hydrolysis of biomass at high-solids loadings – A review. Biomass Bioenergy 2013, 56, 526–544. [Google Scholar] [CrossRef]
- Weiss, N.D.; Felby, C.; Thygesen, L.G. Enzymatic hydrolysis is limited by biomass–water interactions at high-solids: improved performance through substrate modifications. Biotechnol. Biofuels 2019, 12 3. [Google Scholar] [CrossRef]
- Bolzico, B.C.; Racca, S.; Khawam, J.N.; Leonardi, R.J.; Tomassi, A.H.; Benzzo, M.T.; Comelli, R.N. Exploring xylose metabolism in non-conventional yeasts: kinetic characterization and product accumulation under different aeration conditions. J. Ind. Microbiol. Biotechnol. 2024, 51, kuae023. [Google Scholar] [CrossRef]
- Guzmán, V.M.; Leonardi, R.J.; Racca, S.; Comelli, R.N. Assessing Process Conditions on Xylose Fermentation in Spathaspora passalidarum: Effects of pH, Substrate-to-Inoculum Ratio, Temperature, and Initial Ethanol Concentration. Curr. Microbiol. 2024, 81, 448. [Google Scholar] [CrossRef]
- Martinez-Jimenez, F.D.; Neitzel, T.; Biazi, L.E.; Pereira, I.O.; dos Santos, L.V.; da Costa, A.C.; Ienczak, J.L. Exploiting the Non-conventional Yeast Spathaspora passalidarum as a Platform for Hemicellulosic Hydrolysate Conversion into Bioproducts: a Mini Review. BioEnergy Res. 2021, 14, 689–708. [Google Scholar] [CrossRef]
- Frontiers | New insights into carbon metabolism in Spathaspora passalidarum for second-generation ethanol production. n.d.). https://www.frontiersin.org/journals/fungal-biology/articles/10.3389/ffunb.2025.1657121/full. Available online: https://www.frontiersin.org/journals/fungal-biology/articles/10.3389/ffunb.2025.1657121/full (accessed on 28 August 2026).
- Albuini, F.M.; de Castro, A.G.; Campos, V.J.; Ribeiro, L.E.; Vidigal, P.M.P.; de Oliveira Mendes, T.A.; Fietto, L.G. Transcriptome profiling brings new insights into the ethanol stress responses of Spathaspora passalidarum. Appl. Microbiol. Biotechnol. 2023, 107, 6573–6589. [Google Scholar] [CrossRef]
- Saengphing, T.; Sattayawat, P.; Kalawil, T.; Suwannarach, N.; Kumla, J.; Yamada, M.; Panbangred, W.; Rodrussamee, N. Improving furfural tolerance in a xylose-fermenting yeast Spathaspora passalidarum CMUWF1-2 via adaptive laboratory evolution. Microb. Cell Fact. 2024, 23 80. [Google Scholar] [CrossRef]
- Wang, G.; Li, Q.; Zhang, Z.; Yin, X.; Wang, B.; Yang, X. Recent progress in adaptive laboratory evolution of industrial microorganisms. In J. Ind. Microbiol. Biotechnol.; 2023; Volume 50, p. kuac023. [Google Scholar] [CrossRef]
- Jansen, M.L.A.; Bracher, J.M.; Papapetridis, I.; Verhoeven, M.D.; de Bruijn, H.; de Waal, P.P.; van Maris, A.J.A.; Klaassen, P.; Pronk, J.T. Saccharomyces cerevisiae strains for second-generation ethanol production: from academic exploration to industrial implementation. FEMS Yeast Res. 2017, 17, fox044. [Google Scholar] [CrossRef]
- Souto-Maior, A.M.; Runquist, D.; Hahn-Hägerdal, B. Crabtree-negative characteristics of recombinant xylose-utilizing Saccharomyces cerevisiae. J. Biotechnol. 2009, 143, 119–123. [Google Scholar] [CrossRef]
- Liguori, R.; Soccol, C.; Porto De Souza Vandenberghe, L.; A. Woiciechowski, V. Faraco, Second Generation Ethanol Production from Brewers’ Spent Grain. Energies 2015, 8, 2575–2586. [Google Scholar] [CrossRef]
- Escanciano, I.A.; Blanco, Á.; Santos, V.E.; Ladero, M. Integral use of brewery wastes as carbon and nitrogen sources for the bioproduction of succinic acid. Biomass Convers. Biorefinery 2025, 15, 6889–6899. [Google Scholar] [CrossRef]
- Leonardi, R.J.; Racca, S.; Comelli, R.N.; Seluy, L.G. Liquid extract with high amino nitrogen obtained by autolysis of brewing yeast can be used as supplement for bioethanol production. Biomass Convers. Biorefinery 2024, 15, 15141–15159. [Google Scholar] [CrossRef]
Table 1.
Factors, levels, and central composite design (CCD) matrix for the thermochemical conditioning of brewery spent grain (BSG).
Table 1.
Factors, levels, and central composite design (CCD) matrix for the thermochemical conditioning of brewery spent grain (BSG).
| Factor | Unit | Inferior value | Superior value |
| Temperature (T) | °C | 93 | 127 |
| Time (t) | min | 13 | 97 |
| [H₂SO₄] | % w/v | 0.82 | 4.18 |
| Central composite design (CCD) | |||
| Treatment | T (°C) | t (min) | [H2SO4] (% w/v) |
| 1 | 100 | 80 | 1.50 |
| 2 | 110 | 13 | 2.50 |
| 3 | 110 | 55 | 2.50 |
| 4 | 110 | 97 | 2.50 |
| 5 | 110 | 55 | 0.82 |
| 6 | 127 | 55 | 2.50 |
| 7 | 93 | 55 | 2.50 |
| 8 | 120 | 80 | 1.50 |
| 9 | 100 | 80 | 3.50 |
| 10 | 120 | 80 | 3.50 |
| 11 | 120 | 30 | 3.50 |
| 12 | 100 | 30 | 3.50 |
| 13 | 110 | 55 | 4.18 |
| 14 | 110 | 55 | 2.50 |
| 15 | 120 | 30 | 1.50 |
| 16 | 100 | 30 | 1.50 |
| 17 | 110 | 55 | 2.50 |
Disclaimer/Publisher’s Note: The statements, opinions and data contained in all publications are solely those of the individual author(s) and contributor(s) and not of MDPI and/or the editor(s). MDPI and/or the editor(s) disclaim responsibility for any injury to people or property resulting from any ideas, methods, instructions or products referred to in the content. |
© 2026 by the authors. Licensee MDPI, Basel, Switzerland. This article is an open access article distributed under the terms and conditions of the Creative Commons Attribution (CC BY) license (http://creativecommons.org/licenses/by/4.0/).
Copyright: This open access article is published under a Creative Commons CC BY 4.0 license, which permit the free download, distribution, and reuse, provided that the author and preprint are cited in any reuse.