

Submitted:
10 November 2026
Posted:
12 November 2026
You are already at the latest version
Abstract
Background: A two-degree-of-freedom (2-DOF) formulation of the tissue-contact-sensor (TCS) stack in a substrate-integrated accelerometer (ACC)-tactile architecture provides a theoretical basis for complementary sensing of motion artifacts (MA), quantified as baseline drift (BD), and arterial pulse motion. Aim: This second of two parts experimentally investigates predicted relationships between tactile sensor and ACC outputs at the carotid artery (CA) and radial artery (RA) and complementary sensing characteristics. Methods: Using a micro/nano-fabricated tactile sensor integrated with a three-axis ACC attached to its substrate, arterial pulse signals were measured at the CA and RA in healthy subjects. A single-degree-of-freedom time-frequency (SDOF-TF) method analyzed tactile sensor and ACC outputs for BD, harmonic amplitudes, instantaneous frequency (IF), instantaneous initial phase (IIP), heart rate (HR), heart rate variability (HRV), respiration rate (RR), and respiration modulation (RM). Results: The tactile sensor provided cleaner arterial pulse signals than the z-axis ACC output and was relatively robust to MA. The absolute harmonic amplitudes of the ACC output were larger than those of the tactile sensor, consistent with the 2-DOF model, whereas normalized harmonic distributions relative to the first harmonic did not quantitatively reproduce the predicted frequency-dependent relationship, indicating measurement errors in the ACC output. Three-axis ACC measurements revealed radial, lateral, and axial components of arterial wall motion and MA. HR and RR were relatively consistent between outputs, whereas larger differences occurred in HRV and RM. Significance: This ACC-tactile architecture provides a framework for preliminary identification of relative relationships among TCS system parameters from complementary tactile and ACC measurements. The validated relative parameter relationships, together with the robustness of time-based indices to MA in the tactile output, provide a basis for deeper exploration of the model and tactile and ACC outputs for quantitative TCS parameter identification and TCS–artery interaction characterization at both arterial sites.
Keywords:
arterial pulse signal
; tactile sensor
; accelerometer (ACC)
; single-degree-of-freedom time-frequency (SDOF-TF) method
; motion artifacts (MA)
; instantaneous parameters
; arterial indices
1. Introduction
Compared with conventional medical instruments, such as arterial tonometry and ultrasound imaging, sensors offer a low-cost and readily deployable approach to arterial pulse measurement [1,2,3] and, consequently, cardiovascular (CV) monitoring and diagnosis [2,3,4]. Among various sensing modalities, photoplethysmography (PPG) sensors have been widely adopted for arterial pulse measurement [1,2], motivating the development of numerous signal-processing techniques to mitigate motion artifacts (MA) [5,6,7] and sensor noise in PPG-based pulse signals [1,8]. For example, adaptive commonly requires a reference signal that characterizes MA [5,6,7,9,10]. Accordingly, accelerometers (ACCs) have been widely placed adjacent to PPG sensors to monitor MA [8,11,12,13,14] and provide a reference for MA mitigation during pulse-signal processing [8,9,10,11,12,13].
Micro/nano-fabricated tactile sensors have also attracted increasing attention for arterial pulse measurement since the 2010s, following advances in micro/nanofabrication technologies [15,16,17,18]. Unlike PPG sensors, which rely on optical transduction [19,20], tactile sensors generally employ electrical transduction and therefore avoid the optical components and associated complexities of PPG sensing [21,22,23,24]. Tactile sensors have been investigated for pulse measurement at both the carotid artery (CA) and radial artery (RA), which are relatively accessible and sufficiently large for sensor contact [3,15,18]. In particular, CA pulse measurement is of considerable interest because the CA pulse is more closely related to central hemodynamics [25,26]. Consequently, tactile sensors with different structures and transduction mechanisms have been developed and evaluated for potential applications in CV monitoring and diagnosis [3,4,15,21].
Despite these advances, tactile-based arterial pulse measurement remains susceptible to MA, as does PPG-based pulse measurement [3,27]. In contrast to PPG-based pulse measurement, for which ACCs have been extensively used to characterize MA [9,10,11,12], to the best of our knowledge, no study has reported on the use of an ACC integrated with a tactile sensor substrate to monitor MA during tactile-based arterial pulse measurement. In tactile sensing, however, the relationship between the measured pulse signal and MA is more complex because a tactile sensor measures the displacement difference between its structure and substrate [28]. Thus, the baseline drift (BD) observed in the tactile sensor output does not directly represent the absolute MA experienced by the sensor substrate [28]. In addition, MA not only produces BD in the measured tactile pulse signal but also induces time-varying system parameters (TVSP) in the tissue–contact–sensor (TCS) stack, thereby producing TVSP-induced distortion in the measured arterial pulse signal [28,29]. Direct measurement of substrate motion may thus provide complementary information for characterizing MA and its effects on pulse measurement. Moreover, as demonstrated in Part I, an ACC attached to the sensor substrate captures not only substrate motion associated with MA but also pulse-related substrate motion. Comparing this ACC output with the corresponding relative motion measured by the tactile sensor can therefore provide information about the dynamic characteristics of the tissue–contact–sensor (TCS) stack and their effects on the extracted arterial pulse waveform (APW), from which arterial indices are commonly derived. Characterizing the TCS-stack dynamics in the absence of MA is also important because the tactile sensor output reflects the coupled dynamics of the sensor structure, substrate, and underlying tissue rather than arterial pulse motion alone.
In Part I of this study, a theoretical framework was developed by treating the TCS stack as a two-degree-of-freedom (2DOF) dynamic system to characterize the relationships among arterial pulse excitation, MA, the TCS stack, and the resulting tactile sensor and ACC outputs. The theoretical analysis established the complementary sensing functions of the two modalities and identified the tactile sensor as a differential-motion measurement and the substrate-integrated ACC as an absolute-motion measurement. The analysis further showed that MA can be characterized through BD and induces TVSP in the TCS stack, while the ACC output contains both MA-related substrate motion and pulse-related substrate motion. These theoretical relationships provide the basis for experimentally examining the complementary sensing capabilities of the two modalities and their effects on arterial pulse measurement.
Building on this framework, Part II experimentally investigates the proposed dual-functional substrate-integrated ACC–tactile architecture for absolute and differential MA monitoring and dual-modality arterial pulse measurement. Specifically, the experiments evaluate (1) the ability of the substrate-integrated ACC to capture substrate motion associated with MA and arterial pulse excitation; (2) the differences in the measured MA and pulse-induced motion between the ACC and tactile sensing modalities; and (3) the relationships between the arterial pulse motions captured by the two sensing modalities and between the MAs captured by the two sensing modalities, as predicted by the 2DOF TCS-stack model. The experimental results are further combined with the theoretical analysis in Part I to identify the TCS system parameters that can be determined from the combined theoretical and experimental analysis. The combined analysis also assesses the extent to which the complementary measurements provided by the ACC and tactile sensor can characterize the effects of MA and TCS-stack dynamics on the measured arterial pulse waveform (APW), from which arterial indices are commonly derived.
2. Materials and Methods
2.1. Substrate-Integrated ACC-Tactile Architecture
Figure 1(a) shows the substrate-integrated ACC-architecture, with the ACC attached to the backside of the substrate. The tactile sensor consists of a PDMS structure with a microchannel embedded underneath. An electrolyte is filled into the microchannel via a reservoir at one of its ends. Afterward, the two reservoirs are then sealed. Electrical connections are made to the five pairs of metal electrodes on the Pyrex substrate for sensor operation. The electrolyte in the microchannel and the five pairs of metal electrodes form a 5×1 resistive transducer array with a spatial resolution of 1.5mm. As shown in Figure 1(b), the ACC used in this work is a three-axis analog accelerometer (LIS344ALH), which is mounted on a custom PCB (1.1cm×1cm×0.2mm), and its three outputs are connected to the breadboard and then to the three identical electrical circuits. The ACC is attached to the backside of the Pyrex substrate. During pulse measurement, the architecture was held by the fingers at the measurement site. Detailed descriptions of the tactile sensor, the ACC, and their operating principles have been reported previously.
Figure 2a,b show a PDMS layer placed over the transducer array during pulse measurement at the carotid artery (CA) to improve the conformity of the architecture to the artery and, consequently, the quality of the measured pulse signal, as indicated by its larger overall amplitude. However, no PDMS layer was placed between the ACC-tactile architecture and the skin during the radial artery (RA) measurements because previous measurements showed that adding a PDMS layer at the RA reduced the overall amplitude of the pulse signal measured by the tactile sensor.
Figure 2(c) illustrates the alignment of the three-axis ACC outputs with the three arterial wall-motion directions. The z-axis is oriented along the radial direction of arterial wall motion, while the x-axis is oriented along the axial direction. If the architecture is perfectly aligned with the center of the artery, the y-axis should ideally exhibit no arterial-pulse-related output. However, misalignment of the architecture from the center of the artery causes a component of the lateral arterial wall motion to be captured along the y-axis. Note that the z-axis output of the ACC and the tactile sensor output correspond to the radial motion of the arterial wall and are therefore used to measure the arterial pulse. As discussed in Part I of this work, the z-axis ACC output represents the mechanical motion of the tactile sensor substrate, whereas the tactile sensor output represents the relative displacement between the sensor structure and the sensor substrate.
Figure 3 depicts the experimental setup for arterial pulse measurement using the ACC-tactile architecture. A function generator was used to operate the tactile sensor, while DC power supplies were used to power the electrical circuits for both the tactile sensor and the ACC. The tactile sensor and ACC outputs were processed through their respective dedicated circuits and then routed to a data acquisition (DAQ) card. The acquired signals were fed into a LabVIEW program for real-time monitoring and recorded at a sampling rate of 1000 Hz. The tactile sensor provides a single output, whereas the ACC provides three outputs corresponding to its three measurement axes. All four output signals were time-synchronized during data acquisition.
2.2. Subjects and Measurement Protocol
This study was conducted in accordance with the requirements of the Institutional Review Board (IRB) of Old Dominion University (ODU). Measurements involving three subjects were acknowledged by the ODU IRB. Because the primary objective of this work was to investigate technical issues associated with arterial pulse measurement, only three subjects were included. All three subjects were male and healthy, with no known diagnosed disease. Subject #1 was 40 years old with a BMI of 22.7, Subject #2 was 39 years old with a BMI of 27.0, and Subject #3 was 22 years old with a BMI of 28.0.
Each subject sat still in a chair during the measurement. The ACC-tactile architecture was placed over the carotid artery (CA) and gently pressed against the CA for approximately 1 min to measure the arterial pulse signal. The radial artery (RA) was subsequently measured using the same architecture.
2.3. Time-Frequency Analysis of Measured Pulse Signals Using an SDOF-TF Method
As established in Part I, the tactile sensor output represents the relative displacement z1(t) − z2(t) between the sensor structure and the sensor substrate, whereas the z-axis ACC output represents the radial mechanical motion az2(t) of the sensor substrate. These two outputs therefore provide complementary measurements of the arterial pulse through the relative motion of the tactile sensor structure and the absolute motion of the sensor substrate. Given the nonstationary nature of these two signals, time-frequency analysis (TFA) of the signals is conducted using the single-degree-of-freedom time-frequency (SDOF-TF) method. Figure 4 shows the signal-processing algorithm based on the SDOF-TF method, which is implemented in MATLAB R2025a. A detailed description of the SDOF-TF algorithm has been reported previously [30]. For completeness, a brief description of the algorithm is provided below to facilitate understanding of the present work.
A measured pulse signal zmea(t) obtained from the tactile sensor consists of the pulse-induced signal z0(t), baseline drift (BD) zbd(t), and sensor noise znoise(t):
zmea(t) = z0(t) + zbd(t) + xnoise(t) with z0(t) = ztf(t) + ztvsp(t)
Note that the pulse-induced signal z0(t) contains the pulse-induced signal ztf(t) free of motion artifacts (MA), with subscript tf denoting time-varying frequency, and distortion induced by time-varying system parameters (TVSP) ztvsp(t).
First, a Fast Fourier Transform (FFT) is conducted on the measured pulse signal zmea(t) by the tactile sensor to obtain the frequency f0 of the first harmonic of zmea(t). Then, a low-pass filter (LPF) is applied to zmea(t) with a cutoff frequency of f0 − 0.4Hz to obtain BD zbd(t) in the signal. A bandpass filter (BPF) is applied repeatedly to z0(t) to obtain each harmonic. Afterward, Hilbert vibration decomposition (HVD) is applied to each harmonic to obtain its instantaneous amplitude (IA) Ai(t), instantaneous frequency (IF) fi(t), and instantaneous initial phase (IIP) ϕ0i(t). Consequently, each harmonic can be expressed in terms of the three instantaneous parameters as:
Due to the multiplicative nature of TVSP-induced distortion, the amplitude, frequency, and initial phase of each harmonic of the measured pulse signal are time-varying. By taking the average values of the IA Ai(t) and the IIP ϕ0i(t) over the analyzed time window of the measured pulse signal, the pulse-induced signal free of MA is obtaind as:
Consequently, the TVSP-induced distortion and sensor noise in the measured pulse signal are also obtained:
ztvsp(t) = zHVD(t) − ztf(t) and znoise(t) = z0(t) − zHVD(t)
Note that the arterial pulse waveform (APW) reconstructed from ztf(t) varies among pulse cycles due to its time-varying frequency. To obtain the APW without variations among pulse cycles, the time-varying frequency is replaced with a constant frequency in Equation (3):
Here, zcf(t) represents the reconstructed APW free of MA and can be used to extract feature-based arterial indices.
Given that the first three harmonics contain less sensor noise than the higher harmonics, because of their relatively large amplitudes, time-domain arterial indices are only derived from these three harmonics. First, heart rate, HR(t), is calculated from the IF of each harmonic, and the HR of a subject is calculated as the average of the mean values of HR(t) obtained from the three harmonics. Heart rate variability (HRV) is calculated as the average of the root-mean-square error (RMSE) of HR(t) obtained from the three harmonics. Respiration rate, RR(t), and respiration modulation, RM(t), are calculated from both the IF and the IIP of the three harmonics. It should be noted that although both the IF and the IIP carry respiration-related information, the IIP is substantially less affected by MA than the IF, as will be shown later. The details about the implementation of the SDOF-TF method and the calculation of these time-based indices have been previously reported.
Figure 4.
Signal-processing algorithm based on the SDOF-TF method for quantifying and removing MA-related distortion and sensor noise from the tactile sensor and the ACC outputs and extracting of time-based arterial indices.
Figure 4.
Signal-processing algorithm based on the SDOF-TF method for quantifying and removing MA-related distortion and sensor noise from the tactile sensor and the ACC outputs and extracting of time-based arterial indices.
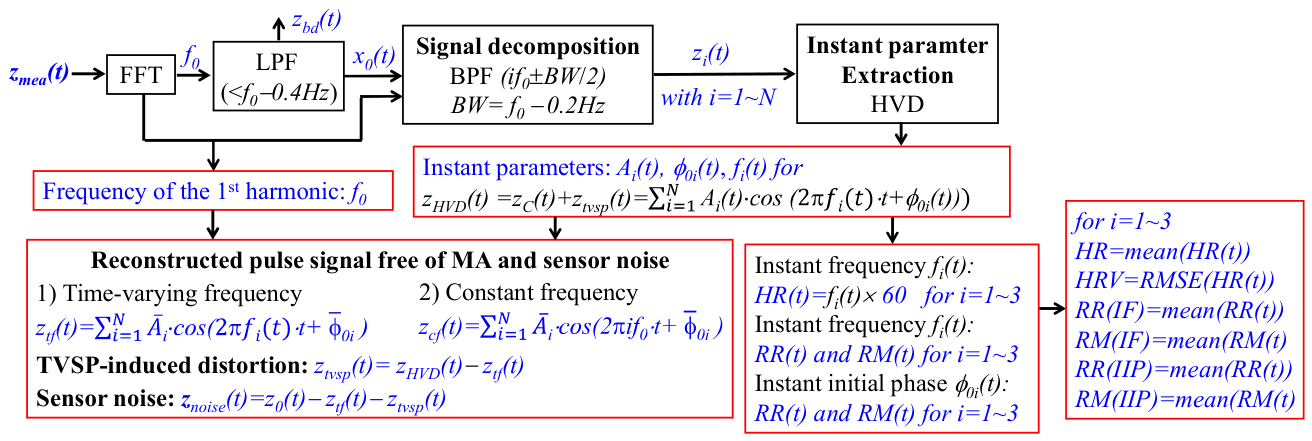
The signal-processing algorithm shown in Figure 4 is also applied individually to the three ACC outputs. For each ACC output, double integration is applied to the BD abd(t) to obtain the BD in the displacement domain. Double integration is also applied to the pulse-induced signal atf(t) free of MA to obtain the corresponding pulse-induced signal in the displacement domain. The errors involved in the double integration of abd(t) and atf(t) have been compensated in our previous work [31].
3. Results
Only the detailed measured results from one subject are presented in the main text to illustrate the performance of the substrate-integrated ACC-tactile architecture and the associated signal-processing method. For the RA measurements, results from only two subjects are presented because the ACC outputs measured at the RA were substantially noisier than those measured at the CA. Consequently, the third subject was not measured at the RA. The detailed measured results from the other two subjects at the CA and the remaining subject at the RA are provided in the Supplementary Materials. A comparison of the derived parameters at the CA among the three subjects and at the RA between the two subjects is presented in the main text. Except in Sec. 3.6, where the three-axis ACC outputs are discussed, all symbols used in the other sections, including amea(t) and abd(t), and symbols with different subscripts, refer to signals associated with the z-axis ACC output.
3.1. Original Measured Pulse signals and Baseline Drift (BD)
Figure 5 shows the original measured signals from the tactile sensor and the z-axis ACC output at the CA, together with their associated BD. Both the tactile sensor and the z-axis ACC output capture the arterial pulse signal and MA, with MA quantified as BD, which contains multiple low-frequency components (<0.7Hz). The BD in the tactile sensor output varies slowly over time, with its overall amplitude being larger than the amplitude of the captured arterial pulse signal. In contrast, the BD in the acceleration domain of the z-axis ACC output is smaller than the peak-to-valley amplitude of the measured pulse-induced acceleration.
Except for the regions surrounding the peaks and valleys, the remainder of the measured acceleration signal appears to be highly noisy. In contrast, the measured displacement signal from the tactile sensor is substantially cleaner, with the arterial pulse waveform (APW) more clearly distinguishable from the background noise.
Figure 6 shows the original measured signals from the tactile sensor and the z-axis ACC output at the RA, together with their associated BD. Compared with the CA measurements, both the pulse-induced signal and BD of the z-axis ACC output are substantially smaller at the RA. In contrast, the BD of the tactile sensor output is markedly larger and exhibits greater temporal variation at the RA than at the CA, while the pulse-induced signal of the tactile sensor output is also noticeably larger at the RA.
The BD of the z-axis ACC output is relatively large compared with the peak-to-valley amplitudes of the pulse-induced signal, as evidenced by markedly larger fluctuations across pulse cycles than those observed at the CA. Consequently, the pulse-induced signal of the z-axis ACC output is substantially noisier at the RA than at the CA. In contrast, although the BD of the tactile sensor output at the RA is also large relative to its pulse-induced signal, it does not cause substantial temporal fluctuations comparable to those in the ACC output. Thus, MA has a much greater effect on the pulse-induced signal measured by the ACC than on that measured by the tactile sensor. As a result, the pulse-induced signal in the tactile sensor output at the RA remains as clearly distinguishable as that at the CA. Furthermore, for both the ACC and tactile sensor outputs, MA is relatively larger at the RA than at the CA when compared with the corresponding pulse-induced signal.
3.2. Comparison of BD, APW, TVSP-Induced Distortion, and Sensor Noise
For a better comparison of the measured signals from the tactile sensor and ACC, the BD and ztf(t)of the tactile sensor output are differentiated with respect to time to obtain their corresponding accelerations. Similarly, the BD and atf(t) of the z-axis ACC output are integrated to obtain their corresponding displacements, with the associated integration errors corrected [31]. Figure 7 compares the BD and measured signals without BD from the two sensors at the CA in the displacement and acceleration domains. As shown in Figure 7(a), the BD in the displacement domain of the z-axis ACC output is substantially larger than that of the tactile sensor output, predicting ks≫k0 based on Equation (10) in Part I. This is consistent with the physical expectation that ks should be larger than k0 to achieve sensor conformity to the artery.
As expected, the BD in the acceleration domain of the z-axis ACC output is also substantially larger than that of the tactile sensor output. Notably, the temporal variation of the BD differs substantially between the two outputs in both domains. The BD of the tactile sensor output exhibits a faster temporal variation, likely reflecting the effect of the TVSP, whereas the BD of the z-axis ACC output varies more slowly. The substantially larger BD of the z-axis ACC output in the displacement domain provides a plausible explanation for the greater TVSP-induced distortion observed in the z-axis ACC output compared with the tactile sensor output.
As shown in Figure 7b,c, the APWs in the displacement and acceleration domains differ substantially between the two outputs, indicating differences in the harmonic amplitudes and initial phases of the measured pulse signals between the two sensors. However, the pulse cycles of the two outputs show close temporal alignment in both domains.
Furthermore, the overall amplitude of the measured pulse signal from the z-axis ACC output is substantially larger than that from the tactile sensor output in both domains. This difference in overall amplitude is also expected because the two sensors measure different physical quantities: the tactile sensor measures the relative displacement between the sensor structure and substrate, whereas the z-axis ACC measures the absolute acceleration of the substrate.
Compared with the CA measurements, as shown in Figure 8, the BD in the displacement domain at the RA is slightly larger for the z-axis ACC output, whereas the BD of the tactile sensor output is substantially larger than that at the CA. In the acceleration domain, the BD of the tactile sensor output exhibits faster temporal variation than that of the z-axis ACC output, similar to the observation at the CA. Beyond these observations, no observable correlation in BD is evident between the CA and RA for either sensor output.
Notably, although the pulse-induced amplitude of the tactile sensor output at the RA is much larger than that at the CA, the pulse-induced amplitude of the z-axis ACC output at the RA is substantially smaller than that at the CA. Thus, the relative magnitude of the pulse-induced signal to the BD provides an important factor for understanding the greater TVSP-induced distortion observed in the z-axis ACC output at the RA than at the CA. In contrast, despite the substantially larger BD of the tactile sensor output at the RA, its much larger pulse-induced amplitude results in a more favorable pulse-to-BD relationship, which helps explain why the greater BD at the RA does not lead to substantially greater TVSP-induced distortion than that observed at the CA.
The reconstructed pulse signal in the displacement domain from the z-axis ACC output still exhibits clear pulse cycles, although its waveform differs substantially from that obtained from the tactile sensor output. In the acceleration domain, the reconstructed pulse signal from the tactile sensor output clearly reveals the pulse peaks and valleys. In contrast, the reconstructed pulse signal from the z-axis ACC output does not exhibit clearly discernible peaks and valleys. This difference further suggests that the relatively small pulse-induced acceleration at the RA is more strongly affected by TVSP-induced distortion and sensor noise, thereby limiting the ability of the z-axis ACC output to resolve the detailed APW.
Figure 9 compares the pulse-induced signals a0(t) and z0(t), TVSP-induced distortion atvsp(t) and ztvsp(t), and sensor noise anoise(t) and znoise(t) from the tactile sensor output in the displacement domain and the z-axis ACC output in the acceleration domain at the two arterial sites. At both the CA and RA, ztvsp(t) and znoise(t) of the tactile sensor output are comparable in amplitude and substantially smaller than z0(t). In contrast, at the CA, atvsp(t) and anoise(t) remain relatively small around the peaks and valleys of a0(t) but substantially obscure the pulse signal over the remainder of each pulse cycle. At the RA, atvsp(t) and anoise(t) are even comparable in amplitude to the peaks and valleys of a0(t), indicating substantially greater contamination of the acceleration-based pulse signal. As pointed out in our previous work [31], the majority of the acceleration-based pulse signal oscillates around zero, which poses a significant challenge for arterial pulse measurement using an ACC.
Figure 10 compares the frequency spectra of the sensor noise in the two sensor outputs at the CA and RA. At the CA, the resonance peaks of the sensor noise from the two sensors span the same frequency range of approximately 1.8–2.8 Hz, which arises from the TVSP. In contrast, at the RA, the tactile sensor output exhibits a resonance within the approximately 1.8–2.8 Hz range, whereas no identifiable resonance is observed in the ACC output over the measured frequency range. The reason why the ACC output does not capture the TVSP-related resonance at the RA is unclear. The same observation was made in the measurements from the remaining subjects, as shown in the Supplementary Materials.
It should be noted that the sensor noise represents broadband excitation of the TCS system, and the resonance observed in the frequency spectrum provides information about the dynamic characteristics of the TCS system and, therefore, may provide insight into its system parameters. Further investigation is needed to establish the relationship between the observed resonance and the individual TCS system parameters
3.3. Normalized Harmonic Amplitude Distribution
Figure 11 compares the normalized harmonic amplitude distributions, relative to the first harmonic amplitude, of the tactile sensor and z-axis ACC outputs at the two arterial sites. At the CA, the normalized harmonic amplitudes of the tactile sensor output are consistently larger than those of the z-axis ACC output, consistent with the theoretical predictions given by Equation (24) in Part I of this work. In contrast, at the RA, the normalized amplitudes of the higher harmonics, particularly the 5th, 6th, and 7th harmonics, are larger in the z-axis ACC output than in the tactile sensor output. This difference is not consistent with the theoretical prediction and may be associated with the relatively large TVSP-induced distortion and sensor noise in the z-axis ACC output at the RA. Because the higher harmonics have relatively small amplitudes, they are more susceptible to the effects of sensor noise and TVSP-induced distortion, which can substantially alter their measured amplitudes, particularly when the pulse-induced acceleration is relatively small.
3.4. Measured IF and Measured IIP and Their Derived RR and RM
Figure 12 compares the measured IF and IIP of the first three harmonics of the tactile sensor output and the z-axis ACC output at the CA, as well as the RR(t) and RM(t)) derived from them. As shown in Figure 12(a), the measured IFs of the tactile sensor output exhibit relatively small temporal variations, whereas the 1st IF of the z-axis ACC output exhibits greater temporal variation; its 2nd and 3rd IFs show relatively little temporal variation. In contrast, as shown in Figure 11(b), the measured IIPs of both sensor outputs exhibit relatively little temporal variation. In particular, although the 1st IF of the z-axis ACC output shows substantial temporal fluctuation, its corresponding IIP exhibits much more moderate fluctuation.
The RR(t) and RM(t) derived from the measured IFs and IIPs of the z-axis ACC output both exhibit substantial temporal variation. In comparison, the RR(t) and RM(t) derived from the measured IIPs of the tactile sensor output show relatively little temporal variation. In particular, the IIP-based RM(t) derived from the tactile sensor output exhibits very little fluctuation over time.
Figure 13 compares the corresponding measured IF and IIP and their derived RR(t)and RM(t) at the RA. Compared with the CA measurements, the z-axis ACC output at the RA exhibits substantially greater temporal fluctuations in both the IF and IIP of all three harmonics. The corresponding RR(t)and RM(t) derived from the IF and IIP of the z-axis ACC output also exhibit pronounced temporal fluctuations. In contrast, the measured IF and IIP of the tactile sensor output remain considerably more stable over time, although their temporal variations are observably greater than those at the CA. The substantially greater fluctuations in the ACC-derived IF and IIP are consistent with the larger TVSP-induced distortion and sensor noise observed in the ACC output at the RA. In contrast, the RR(t)and RM(t) derived from the IIP of the tactile sensor output at the RA remain as stable as those observed at the CA.
3.5. Pulse-Induced Signals and BD of the three-axis ACC Outputs
Figure 14 compares the APWs in the displacement and acceleration domains extracted from the three ACC outputs at the two arterial sites, with the z-, y-, and x-axis outputs representing the radial, lateral, and axial components of arterial wall motion, respectively. As shown in Figure 14(a) for the CA, the z-axis ACC output exhibits the largest amplitude in both domains, whereas the x- and y-axis outputs have comparable amplitudes but exhibit noticeably different waveforms in the displacement domain. These differences among the three-axis outputs reflect the alignment of the ACC-tactile architecture relative to the CA and the directions of arterial wall motion. Ideally, if the architecture were positioned directly over the center of the CA and its axes were perfectly aligned with the corresponding directions of arterial wall motion, the y-axis output would be zero, while the x- and z-axis outputs would predominantly represent the axial and radial components, respectively. In the present measurements, however, the architecture was not perfectly centered over the CA, resulting in a substantial lateral component in the y-axis output. This off-center positioning represents the more substantial source of misalignment in the measurements. Given the anatomical complexity surrounding the CA and the practical difficulty of precisely positioning a small hand-held sensor over the arterial center, such positioning error is expected.
In addition to the off-center positioning, the x-axis may contain contributions from radial and/or lateral arterial wall motion because of residual orientation misalignment between the sensor axes and the anatomical directions of CA motion. This orientation misalignment is expected to be smaller than the misalignment of the sensor position relative to the arterial center. Furthermore, previous imaging studies of CA wall motion have shown that the axial and radial components may exhibit different waveforms [32,33,34]. Therefore, the observed difference between the x- and z-axis signals may reflect both differences in the underlying arterial wall motion and the residual orientation misalignment of the sensor. In measurements from the other two subjects (see Supplementary Materials), the pulse-induced signal along the z-axis was consistently larger than those along the x- and y-axes.
As shown in Figure 14(b) for the measured results at the RA, the extracted APWs in the acceleration domain of all three ACC outputs are extremely noisy. In contrast, the extracted APWs in the displacement domain reveal identifiable pulse cycles along all three directions. The axial (x-axis) pulse-induced signal is much larger than both the radial (z-axis) and lateral (y-axis) pulse-induced signals, with the lateral signal being larger than the radial signal. Similar relative magnitudes among the three displacement-domain signals are also observed in the measurements from the other subjects (see Supplementary Materials). Compared with the CA measurements in Figure 13(a), the three pulse-induced signals in the acceleration domain at the RA are substantially noisier, making the detailed waveform characteristics of the three-axis acceleration signals more difficult to resolve.
The relative magnitudes of the three-axis pulse-induced signals at the CA are consistent with the expected physiological characteristics of arterial wall motion and the alignment of the ACC-tactile architecture relative to the CA. In contrast, at the RA, the axial pulse-induced signal is the largest, followed by the lateral and radial signals. This difference in the relative magnitudes of the three-axis signals may be primarily associated with the greater susceptibility of the RA to mechanical suppression, resulting in substantially reduced radial arterial wall motion under the measurement conditions. Because the RA is more readily compressed than the CA, its radial expansion may be more strongly constrained by the applied sensor contact, with the resulting pulse-induced wall motion appearing more prominently in the axial and lateral directions.
Figure 15 compares the BD in the three directions obtained from the ACC outputs at the two arterial sites in both the displacement and acceleration domains. The three directional BDs collectively characterize the three-dimensional MA experienced by the ACC-tactile architecture. As shown in Figure 15(a), the BDs in the z- and y-axis directions in the acceleration domain are comparable and substantially larger than that in the x-axis direction. In contrast, in the displacement domain, the BD of the z-axis ACC output is substantially smaller than that of the y-axis ACC output. These results indicate that the MA experienced by the architecture at the CA is not adequately represented by the MA measured only along the z-axis. In particular, the y-axis MA contributes substantially to the overall MA, despite its relatively small pulse-induced signal compared with that of the z-axis.
As shown in Figure 15(b), the MA distribution among the three axes differs at the RA, with the BD along the x-axis being substantially larger than those along the other two directions. As shown in the Supplementary Materials, however, the direction associated with the maximum MA varies among the measurements at the two arterial sites and subjects. These results demonstrate that MA is not necessarily dominated by a single fixed direction and that its directional distribution can vary among measurement conditions and subjects. Therefore, consideration of the three-axis ACC outputs provides a more complete characterization of the MA experienced by the ACC-tactile architecture than consideration of the z-axis output alone.
3.6. Comparison of Absolute and Normalized Harmonic Amplitude Distribution
Table 1 compares the overall amplitudes of the measured pulse-induced signals from the two sensors at the two arterial sites. Based on the analysis in Part I, the relationship between the outputs of the two sensors is given by:
where ztactile(t) and zACC(t) denote the pulse-induced signals from the tactile sensor output and the z-axis ACC output, respectively. Comparison of Equation (6) with the data in Table 1 reveals:
This difference can be explained by the substantially larger values of ks and ds at the CA resulting from the addition of the PDMS layer, compared with those at the RA, while msub remains the same at the two arterial sites.
Consequently, Based on Part I and Equation (7), the following relations of , zACC(t), and ztactile(t) to ur(t) hold for the CA measurements:
where denotes the displacement of the mass m0 (or mt) of the tissue-sensor interface; ur(t) denotes the arterial pulse signal; and represents the angular frequency of ur(t)and is used to represent the angular frequency of zACC(t), ztactile(t), and .
In contrast, the corresponding relations for the RA measurements are given by:
Note that the tissue–sensor interface parameters, kt, dt, and mt, remain the same for the two sensor outputs at each measurement site but may differ between the CA and RA measurements. Although the transfer functions between zACC(t) and ur(t) differ between the two arterial sites, as described by Equations (9) and (12), it is believed that the substantial difference in the amplitude of zACC(t) between the CA and RA shown in Table 1 is primarily associated with the substantially different amplitudes of ur(t) at the two sites. In contrast, the relatively large amplitude of ztactile(t) at the RA, compared with that at the CA, results from the substantially smaller values of ks andds at the RA.
Table 2 compares the absolute harmonic amplitude distribution and the normalized harmonic amplitude distribution relative to the 1st harmonic amplitude between the tactile sensor output and the z-axis ACC output at the CA. As shown in Table 2(a), the amplitude of each harmonic in the ACC output is substantially larger than the corresponding amplitude in the tactile sensor output, qualitatively consistent with Equation (7). As shown in Table 2(b), the normalized amplitude of each harmonic (n ≥ 2) from the tactile sensor output is consistently larger than that from the ACC output. However, the measured harmonic amplitudes do not quantitatively capture the frequency-dependent relationship between the two sensor outputs predicted by Equation (6). This discrepancy may be associated with measurement errors in the z-axis ACC output, as evidenced by the atvsp(t) and anoise(t) shown in Figure 9. Because the harmonic amplitudes are obtained from the measured signals, these distortion and noise components can alter the amplitudes of individual harmonics and, consequently, their relative harmonic distributions. Therefore, the absolute harmonic amplitudes qualitatively reflect the substantially larger overall amplitude of the ACC output, whereas the normalized harmonic distributions do not quantitatively reproduce the theoretical frequency-dependent relationship between the two sensor outputs under the present measurement conditions.
Table 3 compares the absolute and normalized harmonic amplitude distributions between the tactile sensor output and the z-axis ACC output at the RA for two subjects. As shown in Table 3(a), the absolute amplitude of every harmonic of the tactile sensor output z-axis ACC output remains larger than that of the corresponding harmonic of the z-axis ACC output for both subjects. However, the difference in the absolute amplitudes between the two sensor outputs is substantially less pronounced at the RA than at the CA. This observation is consistent with the difference in ks and ds between the CA and RA measurements discussed above.
As shown in Table 3(b), the normalized amplitudes of the 2nd through 4th harmonics of the tactile sensor output are consistently, but only slightly, larger than those of the z-axis ACC output for both subjects. In contrast, the normalized amplitudes of the 5th, 6th, and 7th harmonics even show the opposite relationship. This difference is believed to be primarily associated with the significant atvsp(t) and anoise(t) in the z-axis ACC output at the RA, which can substantially alter the measured amplitudes of the higher harmonics.
Overall, Table 2 and Table 3 show that the absolute harmonic amplitudes of the z-axis ACC output are consistently larger than those of the tactile sensor output at both arterial sites. In contrast, the normalized harmonic distributions show a consistent relationship at the CA but greater variability at the RA, particularly for the higher-order harmonics. Although the normalized harmonic amplitudes at the CA qualitatively follow the theoretical trend, they do not quantitatively reproduce the frequency-dependent relationship predicted by the theoretical model. At the RA, the greater variability is consistent with the substantially larger TVSP-induced distortion and sensor noise in the z-axis ACC output, which are particularly influential when the pulse-induced acceleration is small. Therefore, the normalized harmonic amplitudes at either arterial site do not provide a reliable quantitative representation of the theoretical frequency-dependent relationship between the two sensor outputs under the present measurement conditions.
3.7. Time-Based Arterial Indices: HR, HRV, RR, and RM
Table 4 compares the derived time-based indices between the tactile sensor output and the z-axis ACC output at the CA and RA. The difference in HR between the two sensor outputs is relatively small at both arterial sites, whereas the difference in HRV is substantially larger. At the CA, the HRV obtained from the z-axis ACC output is approximately 1.5–2.3 times that obtained from the tactile sensor output, and this difference increases to approximately 2.9–5.3 times at the RA. This larger difference may be associated with the acceleration-domain measurement as well as the substantially greater TVSP-induced distortion and sensor noise in the ACC output, particularly at the RA.
Neither the IF-based RR nor the IIP-based RR shows a consistently large difference between the two sensor outputs. However, the IIP-based RR is consistently substantially higher than the IF-based RR for both outputs and at both arterial sites, consistent with our previous work using a tactile sensor in a healthy male subject [30]. Given that the IIP-based RR is physiologically realistic, it may better reflect the physiological respiratory response than the IF-based RR under the present measurement conditions.
The IIP-based RM from the tactile sensor output is consistently much lower than that from the ACC output at both sites, with the difference particularly pronounced at the RA, where the ACC-derived RM is approximately 10.1 and 4.8 times larger for Subjects #1 and #2, respectively. This observation is consistent with the greater temporal fluctuations in the ACC-derived IIP at the RA shown in Figure 12. Because IIP is less affected by MA than IF, the IIP-based RM from the tactile sensor output may provide a more physiologically representative measure of respiration modulation under the present measurement conditions.
The HRV, RR, and RM derived from the tactile sensor output also show differences between the CA and RA, which can be attributed to differences in MA and the TCS stack at the two arterial sites. However, these differences are relatively small, suggesting that these indices are relatively robust to MA in the tactile sensor outputs under the present measurement conditions. Overall, the substantially larger differences in HRV and RM between the tactile and ACC outputs, particularly at the RA, are consistent with the greater influence of TVSP-induced distortion and sensor noise on the ACC-derived time-frequency parameters.
4. Discussion
The results in Section 3 demonstrate the complementary sensing characteristics of the tactile sensor and z-axis ACC and, more importantly, provide experimental information for exploring the TCS parameters described by the 2-DOF model in Part I. The tactile sensor generally provides a cleaner relative-displacement measurement, whereas the ACC provides absolute substrate motion but is more susceptible to TVSP-induced distortion and sensor noise, particularly at the RA. Despite these measurement limitations, the paired tactile and ACC measurements provide a basis for preliminary estimation of the relative TCS parameters and for identifying the mechanical factors that must be incorporated for reconstruction of the true arterial pulse signal.
4.1. Implications of the Measured Results at the CA and RA
The measured results demonstrate that the ACC-tactile architecture responds differently at the CA and RA, particularly in terms of the effects of MA on the pulse-induced signal. At the CA, the pulse-induced acceleration is sufficiently large to permit extraction of the APW, and the TVSP-induced distortion and sensor noise are relatively small. Nevertheless, residual measurement errors in the z-axis ACC output can affect the extracted APW and, particularly, its harmonic amplitude distribution, which provides important information for quantifying the TCS system parameters. At the RA, the pulse-induced acceleration measured by the z-axis ACC is substantially smaller than that at the CA and is comparable in magnitude to the TVSP-induced distortion and sensor noise. Consequently, the detailed pulse waveform cannot be readily resolved directly from the RA ACC output, and the pulse cycles can only be identified after reconstruction in the displacement domain. In contrast, the tactile sensor continues to provide a clearly identifiable pulse signal despite the relatively large MA at the RA. These observations indicate that the tactile sensor and ACC provide complementary information, but their measurement characteristics depend strongly on the arterial site and on the magnitude of the pulse-induced motion relative to the associated measurement disturbances.
The three-axis ACC results further demonstrate that arterial wall motion is not confined to the radial direction. At the CA, the relative magnitudes of the three directional pulse-induced signals are generally consistent with the expected characteristics of arterial wall motion, although differences in waveform may be affected by the alignment of the ACC axes with the anatomical directions of arterial wall motion. At the RA, the radial pulse-induced displacement is substantially smaller than the lateral and axial components, with the axial component being particularly large. This difference in relative magnitude may be primarily associated with the greater susceptibility of the RA to mechanical suppression. Because the RA is more readily compressed than the CA, radial expansion of the arterial wall may be more strongly constrained under the measurement conditions, with the resulting wall deformation expressed more strongly in the lateral and axial directions. The detailed waveform characteristics may additionally be affected by imperfect alignment between the ACC axes and the corresponding directions of arterial wall motion.
The harmonic and time-based analyses provide additional information about the measurement characteristics of the two sensing modalities. The absolute harmonic amplitudes of the ACC output are substantially larger than those of the tactile output at both arterial sites, qualitatively consistent with the theoretical relationship between the two outputs. However, the normalized harmonic amplitudes do not quantitatively reproduce the predicted frequency-dependent relationship, even at the CA, and become more variable at the RA because of the greater TVSP-induced distortion and sensor noise. In contrast, HR is relatively consistent between the two outputs, whereas HRV and RM show substantially larger differences. The differences in HRV and RM derived from the tactile sensor between the CA and RA are associated with differences in MA and the TCS stack at the two arterial sites. However, the relatively small differences between the two arterial sites suggest that these time-based indices are relatively robust to MA in the tactile sensor outputs under the present measurement conditions. This relative robustness may provide useful physiological constraints for further analysis of the ACC output and for quantitative identification of the TCS system parameters.
4.2. Technical Issue Associated with the z-Axis ACC Output
The 2-DOF model predicts a specific relationship between the tactile output and the ACC output through the sensor–substrate interface, msub, ks, and ds, with msub as a known quantity from sensor design. The measured results do not reproduce this relationship quantitatively, primarily because the ACC directly measures acceleration and the pulse-induced acceleration is small relative to the measurement range of the ACC, particularly at the RA. Except near the peaks and valleys of the pulse waveform, most of each ACC pulse cycle fluctuates around zero, making the measured signal particularly susceptible to TVSP-induced distortion and sensor noise. Consequently, TVSP-induced distortion and sensor noise can have a substantial effect on the measured acceleration, which is further propagated into the reconstructed displacement. In contrast, the tactile sensor directly measures relative displacement. Except near the start and end of a pulse cycle, the tactile output remains well above zero and therefore is less susceptible to the effects of MA and sensor noise.
The present results therefore identify measurement error in the z-axis ACC output as a major limitation to quantitative TCS parameter identification. Nevertheless, the absolute harmonic amplitudes of the ACC output remain substantially larger than those of the tactile output, qualitatively consistent with the theoretical relationship predicted by the 2-DOF model. This qualitative agreement provides experimental support for the complementary sensing behavior predicted by the model and, together with the preliminary relative relationships among the TCS parameters obtained in this study, provides a basis for deeper-level identification of the TCS parameters.
The effect of TVSP-induced distortion on TCS parameter identification has not yet been quantitatively exploited in the present study. Because TVSP-induced distortion is embedded in both the ACC and tactile outputs, further analysis of its characteristics in the two outputs is needed to determine how it can be utilized for quantitative identification of the TCS system parameters. Furthermore, the resonance observed in the sensor-noise spectra may provide additional insight into the dynamic characteristics of the TCS system, although the relationship between the observed resonance and the individual system parameters remains to be established. Together, these measurement- and dynamics-related characteristics may provide additional physical constraints for TCS parameter identification.
The time-based indices provide another potential source of constraints. The relative robustness of HR, HRV, RR, and RM to MA in the tactile sensor output, together with their physiological consistency among the harmonics, may be utilized to distinguish measurement-related distortion from physiologically meaningful pulse characteristics. These physiological and physical relationships may provide complementary constraints for correcting apparent measurement errors in the z-axis ACC output. Such an integrated analysis, together with the harmonic amplitude relationships and TVSP-induced distortion, may enable more complete quantitative identification of ks and ds and the other TCS parameters, k0, d0, m0, as well as characterization of the TCS–artery interaction required for inverse reconstruction of the true arterial pulse signal.
4.3. Preliminary Estimation of the TCS System Parameters and Arterial Interaction
An important outcome of this study is the preliminary identification of the relative TCS system parameters from the paired tactile and ACC measurements. Based on the measured pulse amplitudes and the 2-DOF model, the substantially larger substrate displacement measured by the ACC than the relative displacement measured by the tactile sensor indicates that the sensor–substrate stiffness is substantially greater than the tissue–sensor interface stiffness, i.e., ks≫k0. The amplitude relationship between the two outputs further indicates that the sensor–substrate stiffness and damping terms are substantially greater than the substrate inertial term over the measured frequency range at the CA, providing a qualitative relationship between ks, ds, and msub. These results therefore provide experimental validation of several relative relationships among the TCS system parameters predicted by the 2-DOF model.
Based on the theoretical derivation in Part I, the interaction force exerted on the artery by the TCS stack at the RA and CA is given by Eqs. (14) and (15), respectively:
In the above equations, the arterial pulse signal represents the arterial wall motion after alteration by the TCS stack, rather than the true arterial pulse signal in the absence of the architecture. At the CA, the interaction force is directly related to the tissue–sensor interface, kt, dt, and mt. The sensor–substrate inteface, ks, ds, and msub, may also indirectly affect the interaction force by altering the motion transmitted through the TCS stack and, consequently, the arterial wall motion. In contrast, the interaction force at the RA is explicitly associated with all six TCS system parameters. Because the system response varies with frequency, the interaction force also varies among the harmonics. Quantitative reconstruction of the true arterial pulse signal therefore requires identification not only of the TCS system parameters but also of the interaction between the TCS stack and the artery.
The different pulse amplitudes and directional wall-motion characteristics observed at the CA and RA further indicate that the artery–TCS interaction may depend on the arterial site and measurement conditions. However, the interaction force and the associated alteration of arterial wall motion cannot yet be quantitatively identified from the present measurements. Characterization of this interaction therefore represents an important component of further development of the 2-DOF model for inverse reconstruction of the true arterial pulse signal.
The present results provide preliminary identification of the relative magnitudes and relationships among the TCS parameters rather than complete quantitative identification. The measurements are affected by TVSP-induced distortion and sensor noise, particularly in the ACC output, and the phase shifts of individual harmonics cannot be reliably separated because of measurement errors and therefore were not used for parameter identification in this study. The resulting parameter estimation should consequently be regarded as a first step toward complete identification of the TCS system and its interaction with the artery.
4.4. Limitations and Future Directions
There are several limitations in this study. First, the study was conducted with a small number of healthy subjects because its primary objective was to examine the feasibility, technical issues, and measurement characteristics of the substrate-integrated ACC-tactile architecture as a foundation for future cardiovascular studies, rather than to establish population-level physiological characteristics. The observed measurement characteristics were consistent across the subjects examined and therefore provide an initial characterization of the measurement behavior in healthy subjects under the present experimental conditions. Their applicability to subjects with cardiovascular conditions remains to be established. Second, the true arterial wall motion in the absence of the TCS stack cannot be directly measured under any measurement conditions, because the TCS–artery interaction necessarily alters the arterial wall motion. Third, significant measurement errors in the z-axis ACC output, particularly at the RA, present a major obstacle to complete quantitative identification of the TCS parameters and the artery–TCS interaction from the present data.
Despite these limitations, the present study provides preliminary identification of the relative relationships among the TCS system parameters through the measured harmonic amplitude distributions and overall amplitudes of the tactile and ACC outputs. The results also demonstrate that the time-based arterial indices exhibit relative robustness to MA in the tactile sensor output. In addition, the frequency spectra of the sensor noise reveal resonance characteristics of the TCS system, with the observed resonance frequency providing information about its dynamic behavior. These findings indicate that, beyond the harmonic amplitude relationships used in the present study, additional information contained in the analyzed results may be exploited for deeper-level identification of the TCS system.
In particular, although the 2-DOF formulation accounts for TVSP-induced distortion in both sensor outputs, this distortion has not yet been quantitatively incorporated into the present parameter-identification process. The physiological consistency of HR, HRV, RR, and RM among the first three harmonics has also not yet been incorporated as additional constraints. These time-based indices, together with the observed TVSP-induced distortion and associated physiological and physical relationships, may provide additional constraints for correcting measurement errors in the z-axis ACC output and improving quantitative identification of the TCS system parameters. Similarly, the frequency spectra of the sensor noise and their resonance characteristics may provide additional information about the dynamic parameters of the TCS system, although further work is needed to establish the relationship between the observed resonance and the individual system parameters.
Future work will therefore further explore the 2-DOF TCS model in conjunction with the measured tactile and ACC data to quantitatively characterize TVSP-induced distortion, the TCS–artery interaction force, and the resulting alteration of arterial wall motion. The frequency-dependent harmonic relationships, time-based arterial indices, sensor-noise resonance characteristics, and three-axis ACC measurements will be investigated as complementary constraints for parameter identification. Together with the relative TCS parameter relationships identified in the present study, these additional analyzed results may enable more complete quantitative characterization of the TCS system and its interaction with the artery. The ultimate objective is to establish an inverse framework, built upon the ACC-tactile architecture, that accounts for the alteration of arterial pulse motion by the TCS stack and reconstructs the underlying arterial pulse signal from the measured ACC-tactile data.
5. Conclusions
This study experimentally investigated a substrate-integrated accelerometer (ACC)-tactile architecture for complementary measurement of arterial pulse signals. The tactile sensor measures the relative displacement between the sensor structure and substrate, whereas the z-axis ACC measures the absolute mechanical motion of the substrate. Measurements at the carotid artery (CA) and radial artery (RA) demonstrated that the two sensing modalities provide complementary arterial pulse measurements. The tactile sensor generally provided cleaner pulse signals, whereas the ACC output was more strongly affected by TVSP-induced distortion and sensor noise, particularly at the RA where the pulse-induced acceleration was relatively small. The three-axis ACC measurements further demonstrated the multidirectional nature of arterial wall motion, with lateral motion providing, to some extent, an indication of sensor–artery misalignment and axial motion reflecting, to some extent, the suppression of arterial motion by the TCS stack.
The measured harmonic amplitude relationships between the tactile and ACC outputs were qualitatively consistent with the complementary sensing behavior predicted by the 2-DOF model. The experimental results qualitatively validated several relationships among the TCS system parameters predicted by the model and provided preliminary identification of their relative magnitudes. The time-based indices also showed relative robustness to MA in the tactile sensor output, providing potentially useful physiological constraints. Together with the observed TVSP-induced distortion and the associated physiological and physical relationships, these indices may be utilized to correct measurement errors in the z-axis ACC output and facilitate quantitative identification of the TCS system parameters. The observed resonance in the sensor-noise spectra further provides information about the dynamic characteristics of the TCS system. Deeper-level exploration of the 2-DOF model in conjunction with the tactile and ACC outputs is therefore warranted for quantitative characterization of the TCS system and its interaction with the artery. This study represents the first attempt to quantify the combined effects of MA, sensor design, sensor–artery alignment, and individual- and site-specific tissue properties on a measured arterial pulse signal through the TCS stack, providing a dynamic-model framework for future inverse reconstruction of the true arterial pulse signal.
Author Contributions
Conceptualization, Z.H.; methodology, Z.H.; software, Z.H.; validation: M.H. and Z.H.; formal analysis: M.H.; investigation, M.H. and Z.H.; resources, Z.H.; data curation, M.H.; writing—original draft preparation, Z.H.; writing—review and editing, Z.H. and M.H.; visualization, M.H; supervision, Z.H.; project administration, Z.H.; funding acquisition, Z.H. All authors have read and agreed to the published version of the manuscript. .
Funding
This research receives no funding.
Institutional Review Board Statement
Not applicable.
Informed Consent Statement
Not applicable.
Data Availability Statement
Not applicable.
Acknowledgments
The authors would like to acknowledge that this material is based upon work originally supported by the National Science Foundation under Grant No. 1936005.
Conflicts of Interest
The authors declare the following potential competing financial interests: A provisional patent application has been filed covering the substrate-integrated accelerometer-tactile (ACC-tactile) architecture described in this manuscript, which enables simultaneous measurement of arterial pulse signals using accelerometric and tactile sensing modalities. Author Z.H. also has intellectual property related to the SDOF-TF method and its associated algorithms for arterial pulse signal analysis. The SDOF-TF method and its associated algorithms are applicable to arterial pulse signals measured using a range of sensing modalities, including accelerometers, tactile sensors, photoplethysmography, ultrasound, and tonometry, and are used in the present work to analyze signals measured using the ACC-tactile architecture. The SDOF-TF method and its associated algorithms are being developed into software for potential future commercial licensing, with the software implementation protected by copyright owned by Old Dominion University.:
Abbreviations
The following abbreviations are used in this manuscript:
| ACC | Accelerometer |
| BD | Baseline drift |
| CA | Carotid artery |
| TVSP | Time-varying system parameters |
| MA | Motion artifacts |
| SDOF-TF | Single-degree-of-freedom time-frequency |
| 2-DOF | Two-degree-of-freedom |
| HR | Heart rate |
| RA | Radial artery |
| IF | Instantaneous frequency |
| IIP | Instantaneous initial phase |
| RR | Respiration rate |
| RM | Respiration modulation |
| TCS | Tissue-contact-sensor |
| HRV | Heart rate variability |
| APW | Arterial pulse waveform |
| HVD | Hilbert vibration transform |
References
- Park, J.; Seok, H.S.; Kim, S.-S.; Shin, H. Photoplethysmogram Analysis and Applications: An Integrative Review. Front. Physiol. 2022, 12–2021. [Google Scholar] [CrossRef] [PubMed]
- Pereira, T.; Tran, N.; Gadhoumi, K.; Pelter, M.M.; Do, D.H.; Lee, R.J.; Colorado, R.; Meisel, K.; Hu, X. Photoplethysmography based atrial fibrillation detection: a review. npj Digit. Med. 2020, 3, 3. [Google Scholar] [CrossRef] [PubMed]
- Hou, S.; Chen, X.; Assi, D.S.; Feng, Y.; Wong, C.K.; Tian, J.; Li, J.; Yu, X.; Guan, B.; Zhu, X.; et al. Tactile-Transparent Wearable Sensor for Clinician-Friendly Pulse Wave Velocity Monitoring and Cardiovascular Risk Profiling. ACS Nano 2025, 19, 32822–32835. [Google Scholar] [CrossRef] [PubMed]
- Min, S.; Kim, D.H.; Joe, D.J.; Kim, B.W.; Jung, Y.H.; Lee, J.H.; Lee, B.Y.; Doh, I.; An, J.; Youn, Y.N.; et al. Clinical Validation of a Wearable Piezoelectric Blood-Pressure Sensor for Continuous Health Monitoring. Adv. Mater. 2023, 35, e2301627. [Google Scholar] [CrossRef] [PubMed]
- Pollreisz, D.; TaheriNejad, N. Detection and Removal of Motion Artifacts in PPG Signals. Mob. Netw. Appl. 2022, 27, 728–738. [Google Scholar] [CrossRef]
- Ismail, S.; Akram, U.; Siddiqi, I. Heart rate tracking in photoplethysmography signals affected by motion artifacts: a review. EURASIP J. Adv. Signal Process. 2021, 2021, 5. [Google Scholar] [CrossRef]
- Seok, D.; Lee, S.; Kim, M.; Cho, J.; Kim, C. Motion Artifact Removal Techniques for Wearable EEG and PPG Sensor Systems. In Frontiers in Electronics; 2021; Volume 2—2021. [Google Scholar] [CrossRef]
- Yang, D.; Cheng, Y.; Zhu, J.; Xue, D.; Abt, G.; Ye, H.; Peng, Y. A Novel Adaptive Spectrum Noise Cancellation Approach for Enhancing Heartbeat Rate Monitoring in a Wearable Device. IEEE Access 2018, 6, 8364–8375. [Google Scholar] [CrossRef]
- Islam, M.T.; Tanvir Ahmed, S.; Zabir, I.; Shahnaz, C.; Fattah, S.A. Cascade and parallel combination (CPC) of adaptive filters for estimating heart rate during intensive physical exercise from photoplethysmographic signal. Healthc. Technol. Lett. 2018, 5, 18–24. [Google Scholar] [CrossRef] [PubMed]
- Jarchi, D.; Charlton, P.; Pimentel, M.; Casson, A.; Tarassenko, L.; Clifton, D.A. Estimation of respiratory rate from motion contaminated photoplethysmography signals incorporating accelerometry. Healthc. Technol. Lett. 2019, 6, 19–26. [Google Scholar] [CrossRef] [PubMed]
- Zhang, Z.; Pi, Z.; Liu, B. TROIKA: A General Framework for Heart Rate Monitoring Using Wrist-Type Photoplethysmographic Signals During Intensive Physical Exercise. IEEE Trans. Biomed. Eng. 2015, 62, 522–531. [Google Scholar] [CrossRef] [PubMed]
- Lee, H.; Chung, H.; Ko, H.; Parisi, A.; Busacca, A.; Faes, L.; Pernice, R.; Lee, J. Adaptive scheduling of acceleration and gyroscope for motion artifact cancelation in photoplethysmography. Comput. Methods Programs Biomed. 2022, 226, 107126. [Google Scholar] [CrossRef] [PubMed]
- Kim, S.; Im, S.; Park, T. Characterization of Quadratic Nonlinearity between Motion Artifact and Acceleration Data and its Application to Heartbeat Rate Estimation. Sensors 2017, 17, 1872. [Google Scholar] [CrossRef] [PubMed]
- Aschbacher, K.; Yilmaz, D.; Kerem, Y.; Crawford, S.; Benaron, D.; Liu, J.; Eaton, M.; Tison, G.H.; Olgin, J.E.; Li, Y.; et al. Atrial fibrillation detection from raw photoplethysmography waveforms: A deep learning application. Heart Rhythm O2 2020, 1, 3–9. [Google Scholar] [CrossRef] [PubMed]
- Huang, K.-H.; Chang, C.-M.; Lee, F.-W.; Wang, T.-D.; Yang, Y.-J. Highly-sensitive linear tactile array for continuously monitoring blood pulse waves. Sens. Actuators A Phys. 2018, 280, 261–270. [Google Scholar] [CrossRef]
- Yamaguchi, T.; Yamamoto, D.; Arie, T.; Akita, S.; Takei, K. Wrist flexible heart pulse sensor integrated with a soft pump and a pneumatic balloon membrane. RSC Adv. 2020, 10, 17353–17358. [Google Scholar] [CrossRef] [PubMed]
- Lv, C.; Tian, C.; Jiang, J.; Dang, Y.; Liu, Y.; Duan, X.; Li, Q.; Chen, X.; Xie, M. Ultrasensitive Linear Capacitive Pressure Sensor with Wrinkled Microstructures for Tactile Perception. Adv. Sci. (Weinh) 2023, 10, e2206807. [Google Scholar] [CrossRef] [PubMed]
- Wang, D.; Shen, J.; Mei, L.; Qian, S.; Li, J.; Hao, Z. Performance Investigation of a Wearable Distributed-Deflection Sensor in Arterial Pulse Waveform Measurement. IEEE Sens. J. 2017, 17, 3994–4004. [Google Scholar] [CrossRef]
- Obi, A.I. An Overview of Wearable Photoplethysmographic Sensors and Various Algorithms for Tracking of Heart Rates. Eng. Proc. 2021, 10, 77. [Google Scholar] [CrossRef]
- Charlton, P.H.; Allen, J.; Bailón, R.; Baker, S.; Behar, J.A.; Chen, F.; Clifford, G.D.; Clifton, D.A.; Davies, H.J.; Ding, C.; et al. The 2023 wearable photoplethysmography roadmap. Physiol. Meas. 2023, 44, 111001. [Google Scholar] [CrossRef] [PubMed]
- Nguyen, T.-V.; Mizuki, Y.; Tsukagoshi, T.; Takahata, T.; Ichiki, M.; Shimoyama, I. MEMS-Based Pulse Wave Sensor Utilizing a Piezoresistive Cantilever. Sensors 2020, 20, 1052. [Google Scholar] [CrossRef] [PubMed]
- Zhu, H.; Luo, H.; Cai, M.; Song, J. A Multifunctional Flexible Tactile Sensor Based on Resistive Effect for Simultaneous Sensing of Pressure and Temperature. Adv. Sci. (Weinh) 2024, 11, e2307693. [Google Scholar] [CrossRef] [PubMed]
- Wang, H.; Wang, L.; Sun, N.; Yao, Y.; Hao, L.; Xu, L.; Greenwald, S.E. Quantitative Comparison of the Performance of Piezoresistive, Piezoelectric, Acceleration, and Optical Pulse Wave Sensors. Front. Physiol. 2020, 10. [Google Scholar] [CrossRef] [PubMed]
- Fine, J.; Branan, K.L.; Rodriguez, A.J.; Boonya-Ananta, T.; Ajmal; Ramella-Roman, J.C.; McShane, M.J.; Coté, G.L. Sources of Inaccuracy in Photoplethysmography for Continuous Cardiovascular Monitoring. Biosensors 2021, 11, 126. [Google Scholar] [CrossRef] [PubMed]
- Parittotokkaporn, S.; de Castro, D.; Lowe, A.; Pylypchuk, R. Carotid Pulse Wave Analysis: Future Direction of Hemodynamic and Cardiovascular Risk Assessment. Jma J. 2021, 4, 119–128. [Google Scholar] [CrossRef] [PubMed]
- Cheng, H.M.; Chuang, S.Y.; Wang, T.D.; Kario, K.; Buranakitjaroen, P.; Chia, Y.C.; Divinagracia, R.; Hoshide, S.; Minh, H.V.; Nailes, J.; et al. Central blood pressure for the management of hypertension: Is it a practical clinical tool in current practice? J. Clin. Hypertens. (Greenwich) 2020, 22, 391–406. [Google Scholar] [CrossRef] [PubMed]
- You, J.; Lu, M.; Dazhen, L.; Gao, M.; Zhang, R.; Li, W.; Lei, F.; Ren, W.; Li, G.; Yang, J. Anti-Motion Artifacts Iontronic Sensor for Long-Term Accurate Fingertip Pulse Monitoring. Adv. Sci. (Weinh) 2025, 12, e2414425. [Google Scholar] [CrossRef] [PubMed]
- Rahman, M.M.; Toraskar, S.; Hasan, M.; Hao, Z. An Analytical Model of Motion Artifacts in a Measured Arterial Pulse Signal—Part II: Tactile Sensors. Sensors 2025, 25, 5700. [Google Scholar] [CrossRef] [PubMed]
- Rahman, M.D.M.; Hasan, M.; Hao, Z. Motion Artifacts (MA) At-Rest in Measured Arterial Pulse Signals: Time-Varying Amplitude in Each Harmonic and Non-Flat Harmonic-MA-Coupled Baseline. Biosensors 2025, 15. [Google Scholar] [CrossRef] [PubMed]
- Hao, Z. Motion Artifacts Removal from Measured Arterial Pulse Signals at Rest: A Generalized SDOF-Model-Based Time–Frequency Method. Sensors 2025, 25, 6808. [Google Scholar] [CrossRef] [PubMed]
- Hasan, M.; Rahman, M.M.; Hao, Z. Feasibility of Accelerometer-Based Arterial Pulse Measurement: Part II—Experimental Investigation. Preprints 2026. [Google Scholar] [CrossRef]
- Cinthio, M.; Ahlgren, A.R.; Bergkvist, J.; Jansson, T.; Persson, H.W.; Lindström, K. Longitudinal movements and resulting shear strain of the arterial wall. Am. J. Physiol. Heart Circ. Physiol. 2006, 291, H394–402. [Google Scholar] [CrossRef] [PubMed]
- Yli-Ollila, H.; Laitinen, T.; Weckström, M.; Laitinen, T.M. Axial and radial waveforms in common carotid artery: an advanced method for studying arterial elastic properties in ultrasound imaging. Ultrasound Med. Biol. 2013, 39, 1168–1177. [Google Scholar] [CrossRef] [PubMed]
- Xu, C.; Xiong, H.; Gao, Z.; Liu, X.; Zhang, H.; Zhang, Y.; Du, X.; Wu, W.; Liu, G.; Li, S. Beat-to-Beat Blood Pressure and Two-dimensional (axial and radial) Motion of the Carotid Artery Wall: Physiological Evaluation of Arterial Stiffness. Sci. Rep. 2017, 7, 42254. [Google Scholar] [CrossRef] [PubMed]
Figure 1.
Pictures of (a) the substrate-integrated ACC-tactile architecture, with the ACC attached to the sensor substrate; (b) the ACC mounted on a PCB and its associated breadboard and electrical circuits; and (c) arterial pulse measurement using the tactile sensor integrated with the ACC.
Figure 1.
Pictures of (a) the substrate-integrated ACC-tactile architecture, with the ACC attached to the sensor substrate; (b) the ACC mounted on a PCB and its associated breadboard and electrical circuits; and (c) arterial pulse measurement using the tactile sensor integrated with the ACC.
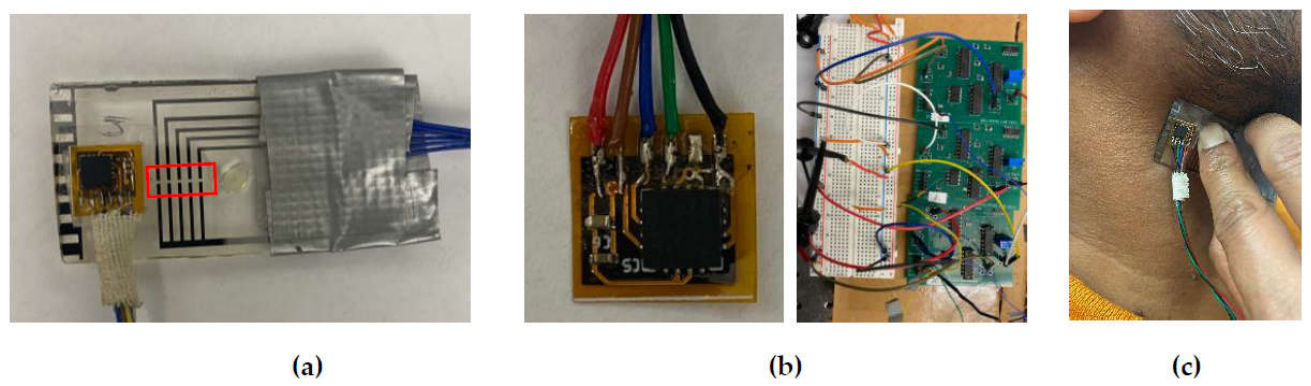
Figure 2.
Pictures of (a) the PDMS layer placed next to the tactile sensor and (b) the PDMS layer placed over the transducer array of the tactile sensor during CA pulse measurement; and (c) schematic of the alignment of the three-axis ACC outputs with the three arterial wall-motion directions.
Figure 2.
Pictures of (a) the PDMS layer placed next to the tactile sensor and (b) the PDMS layer placed over the transducer array of the tactile sensor during CA pulse measurement; and (c) schematic of the alignment of the three-axis ACC outputs with the three arterial wall-motion directions.
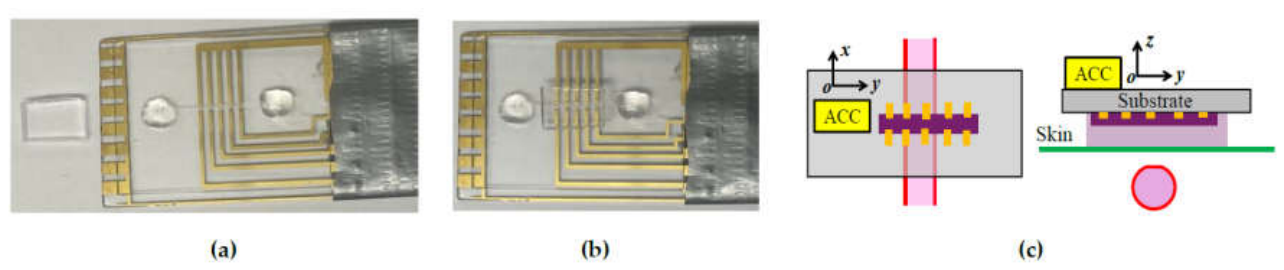
Figure 3.
Schematic of the experimental setup for arterial pulse measurement using the substrate-integrated ACC-tactile architecture.
Figure 3.
Schematic of the experimental setup for arterial pulse measurement using the substrate-integrated ACC-tactile architecture.
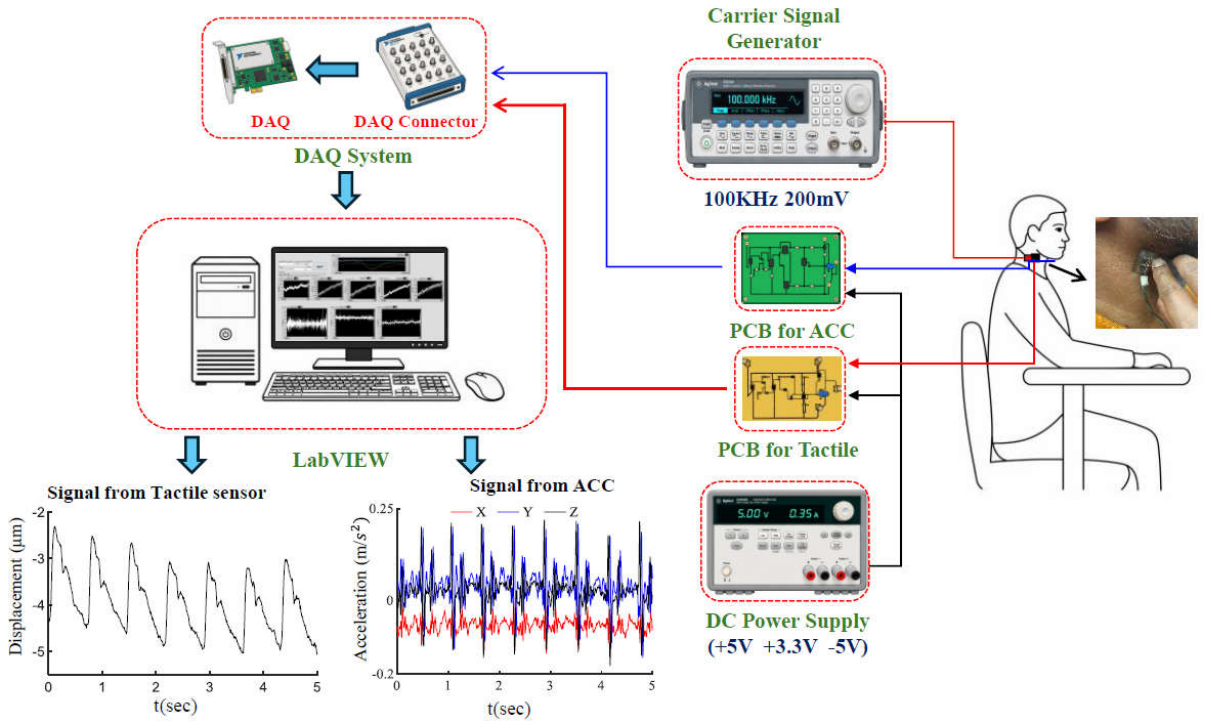
Figure 5.
Original measured pulse signals and measured pulse signals after removal of baseline drift (BD) for Subject #1 at the CA: (a) tactile sensor output; and (b) z-axis ACC output in the radial direction of the arterial wall.
Figure 5.
Original measured pulse signals and measured pulse signals after removal of baseline drift (BD) for Subject #1 at the CA: (a) tactile sensor output; and (b) z-axis ACC output in the radial direction of the arterial wall.
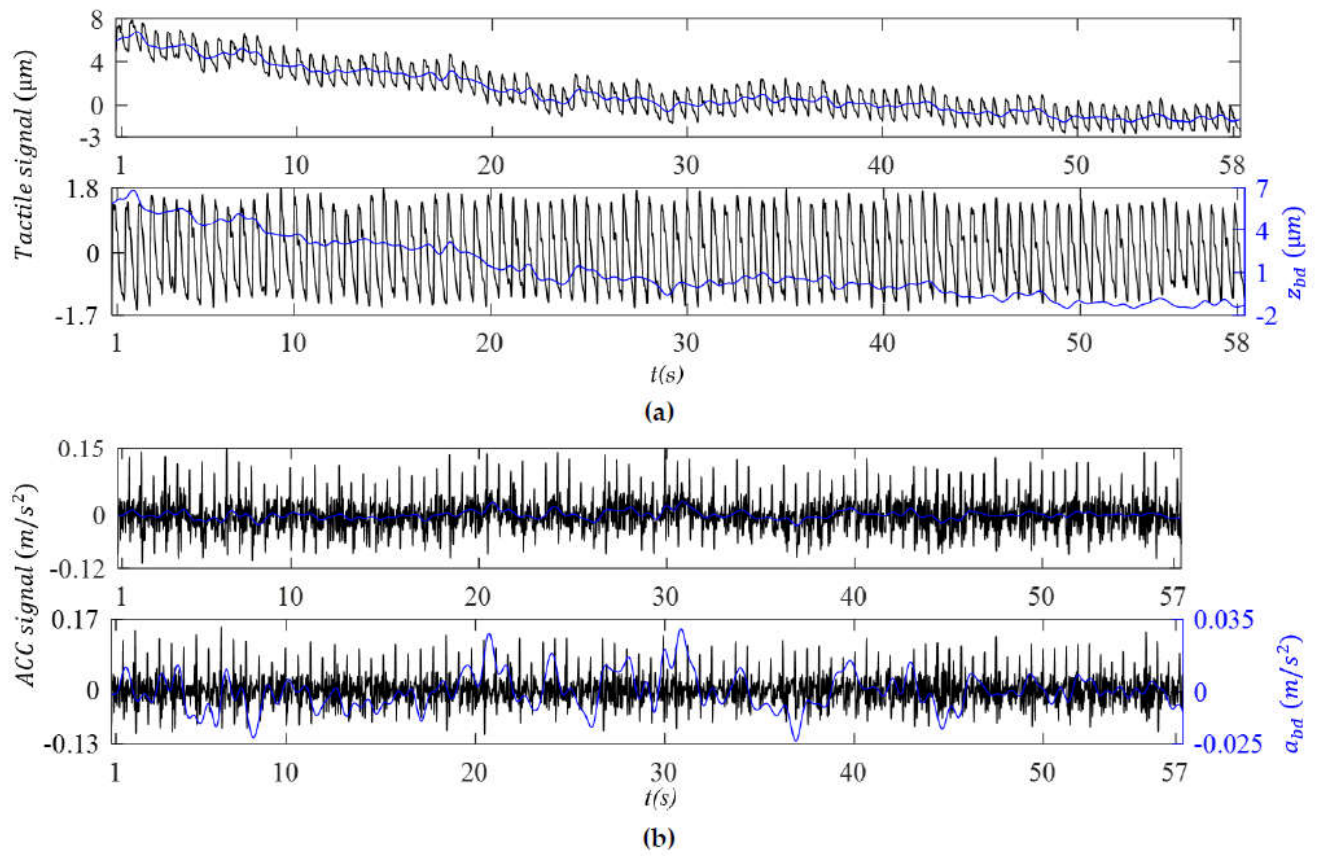
Figure 6.
Original measured pulse signals and measured pulse signals after removal of baseline drift (BD) for Subject #1 at the RA: (a) tactile sensor output; and (b) z-axis ACC output, az(t), in the radial direction of the arterial wall.
Figure 6.
Original measured pulse signals and measured pulse signals after removal of baseline drift (BD) for Subject #1 at the RA: (a) tactile sensor output; and (b) z-axis ACC output, az(t), in the radial direction of the arterial wall.
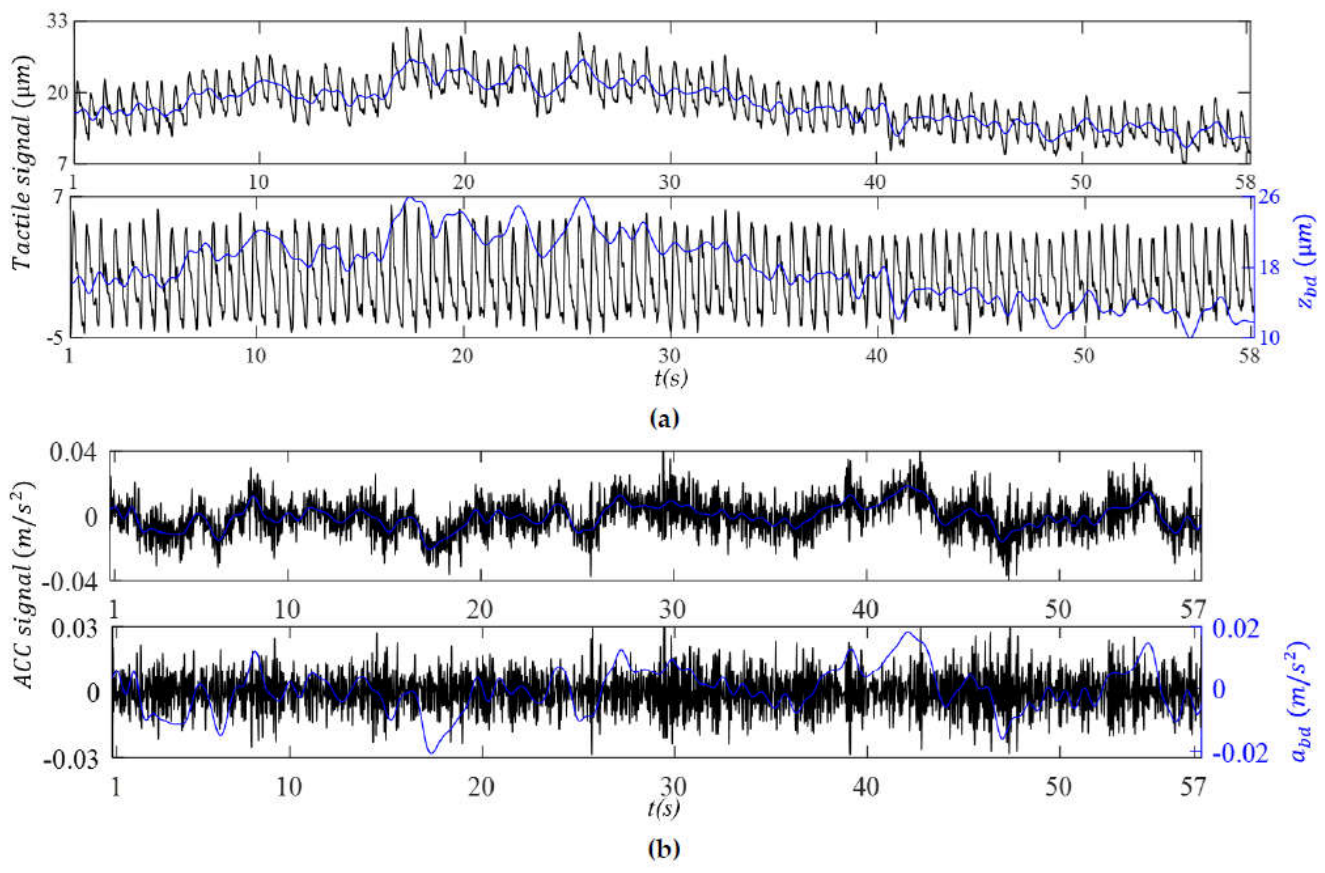
Figure 7.
Comparison between the tactile sensor output and z-axis ACC output for Subject #1 at the CA: (a) BD in the displacement and acceleration domains; (b) reconstructed APW in the displacement domain; and (c) reconstructed APW in the acceleration domain.
Figure 7.
Comparison between the tactile sensor output and z-axis ACC output for Subject #1 at the CA: (a) BD in the displacement and acceleration domains; (b) reconstructed APW in the displacement domain; and (c) reconstructed APW in the acceleration domain.
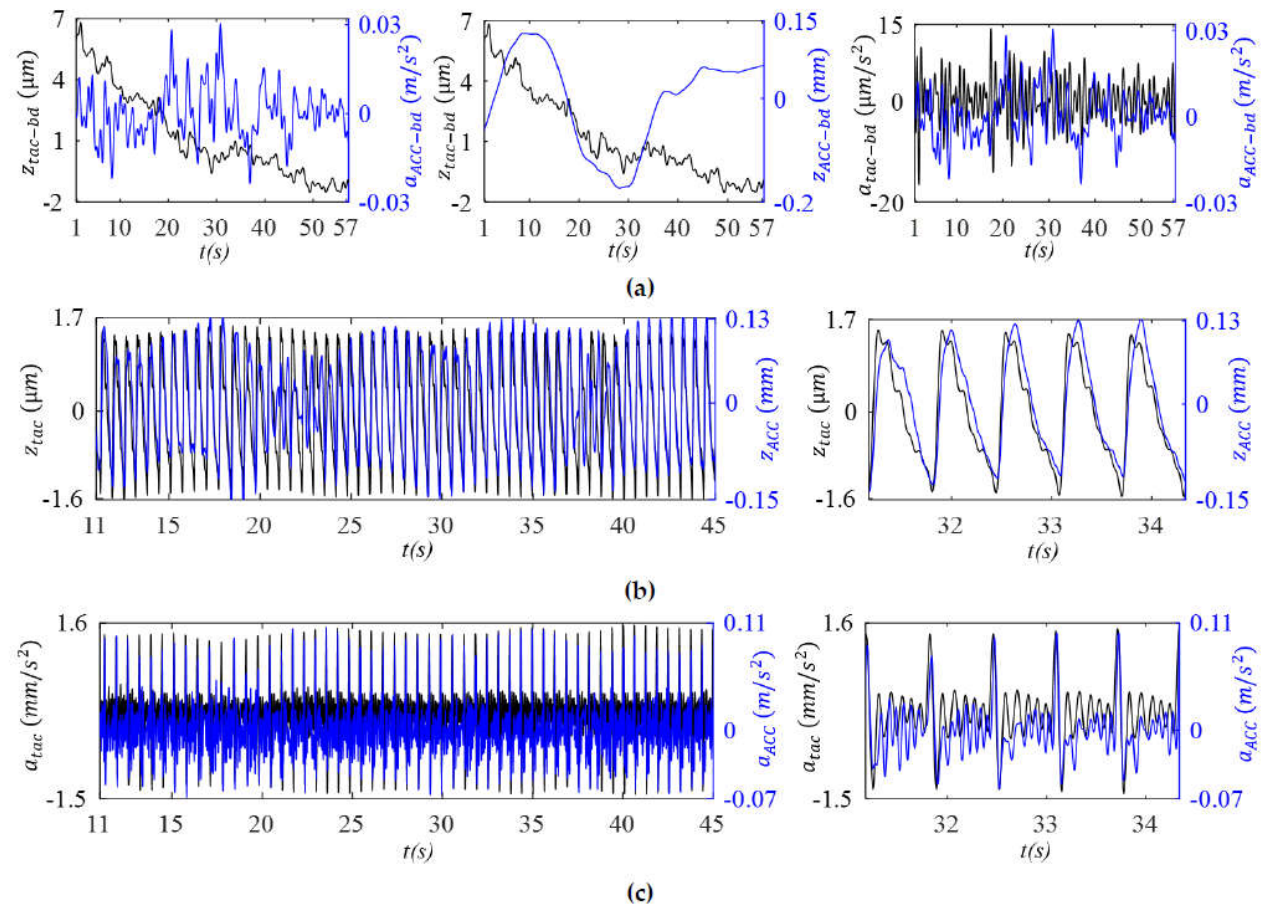
Figure 8.
Comparison between the tactile sensor output and z-axis (radial) ACC output for Subject #1 at the RA: (a) BD in the displacement and acceleration domains; (b) reconstructed APW in the displacement domain; and (c) reconstructed APW in the acceleration domain.
Figure 8.
Comparison between the tactile sensor output and z-axis (radial) ACC output for Subject #1 at the RA: (a) BD in the displacement and acceleration domains; (b) reconstructed APW in the displacement domain; and (c) reconstructed APW in the acceleration domain.
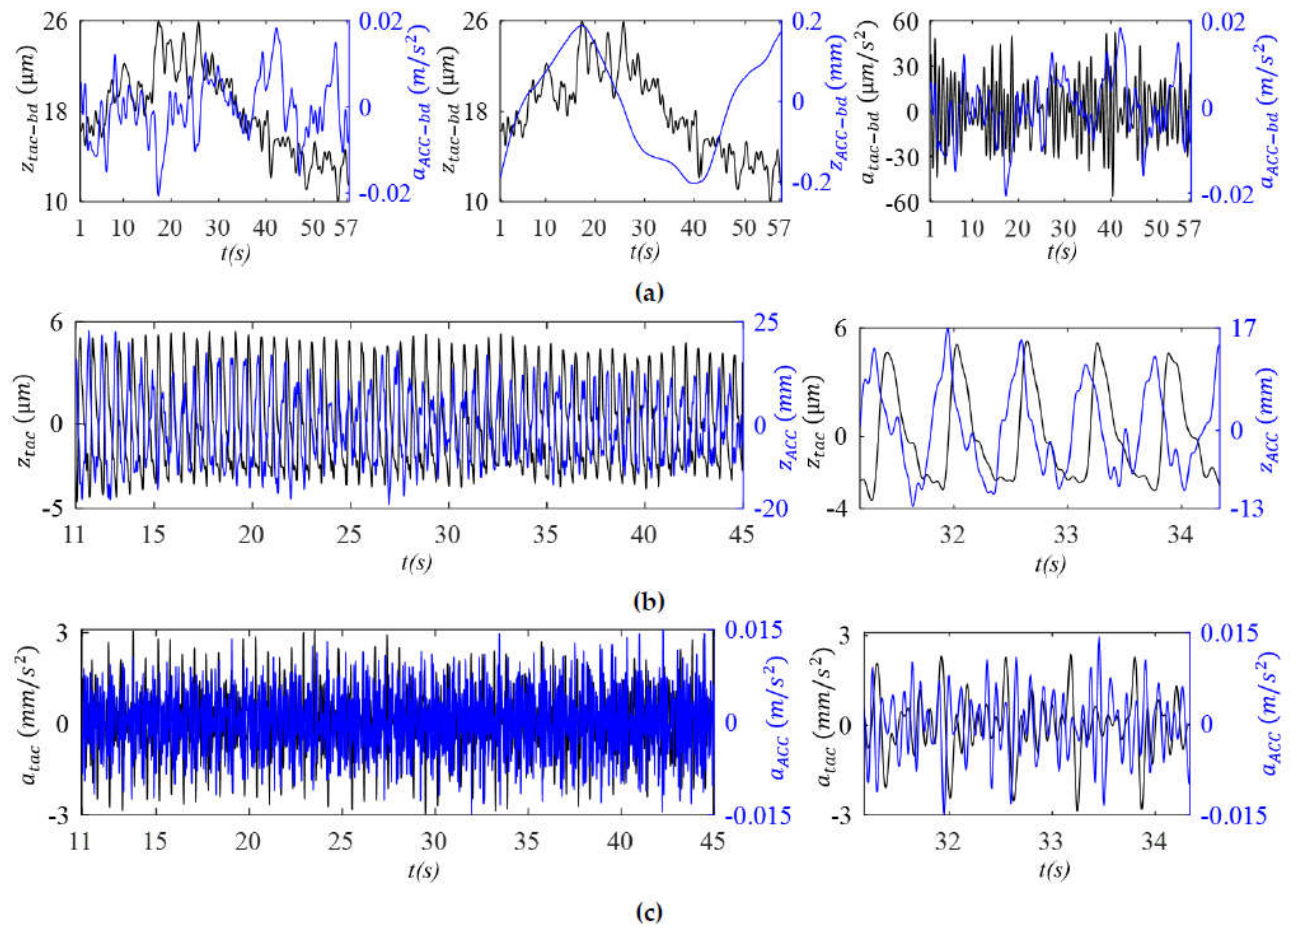
Figure 9.
Comparison of the pulse-induced signal, TVSP-induced distortion and sensor noise in the tactile sensor output and the z-axis ACC output of Subject #1 (a) CA and (b) RA.
Figure 9.
Comparison of the pulse-induced signal, TVSP-induced distortion and sensor noise in the tactile sensor output and the z-axis ACC output of Subject #1 (a) CA and (b) RA.
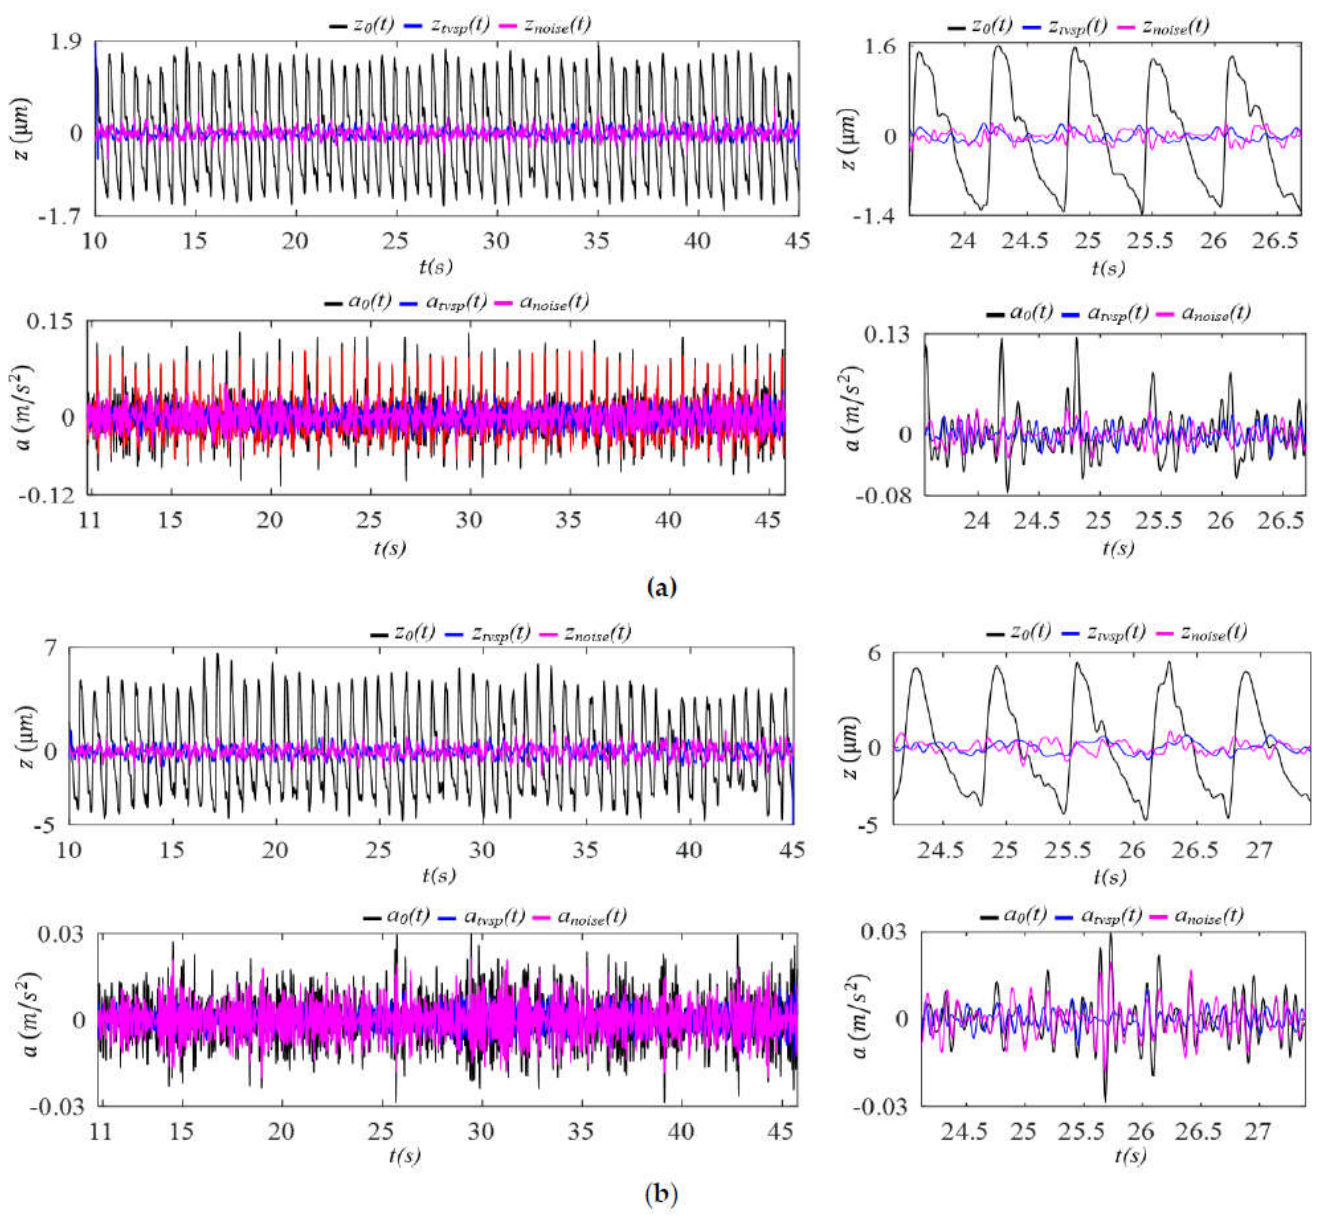
Figure 10.
Comparison of the frequency spectra of the sensor noise in the tactile sensor output and the z-axis ACC output of Subjects #1 (a) CA and (b) RA.
Figure 10.
Comparison of the frequency spectra of the sensor noise in the tactile sensor output and the z-axis ACC output of Subjects #1 (a) CA and (b) RA.
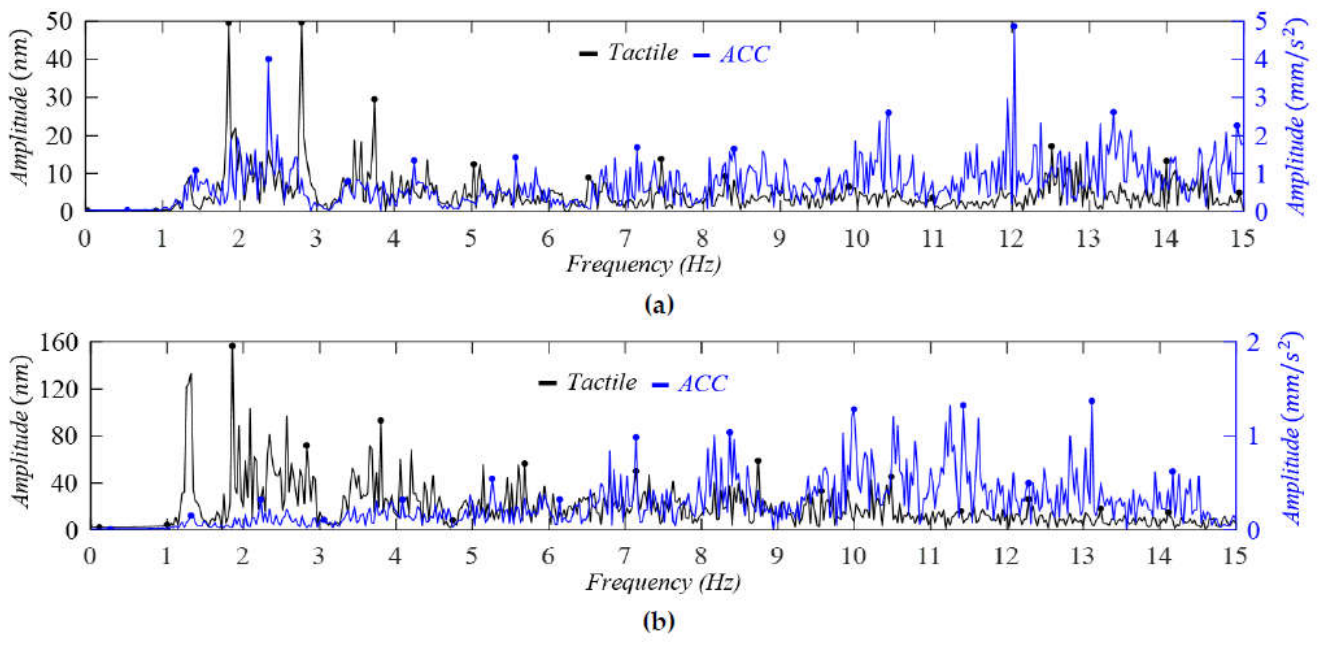
Figure 11.
Comparison of the normalized harmonic amplitude distributions in the displacement domain between the tactile sensor output and the radial ACC output for Subject #1 (a) CA (b) RA.
Figure 11.
Comparison of the normalized harmonic amplitude distributions in the displacement domain between the tactile sensor output and the radial ACC output for Subject #1 (a) CA (b) RA.
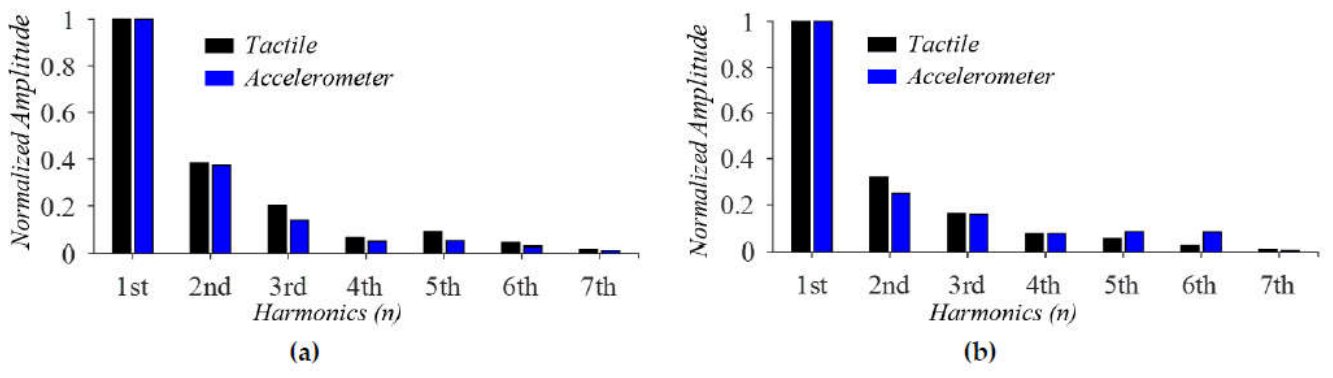
Figure 12.
Comparison of IF and IIP and their derived RR and RM between the tactile sensor and radial ACC outputs for Subject #1 at the CA: (a) IF, IF-based RR, and IF-based RM; and (b) IIP, IIP-based RR, and IIP-based RM.
Figure 12.
Comparison of IF and IIP and their derived RR and RM between the tactile sensor and radial ACC outputs for Subject #1 at the CA: (a) IF, IF-based RR, and IF-based RM; and (b) IIP, IIP-based RR, and IIP-based RM.
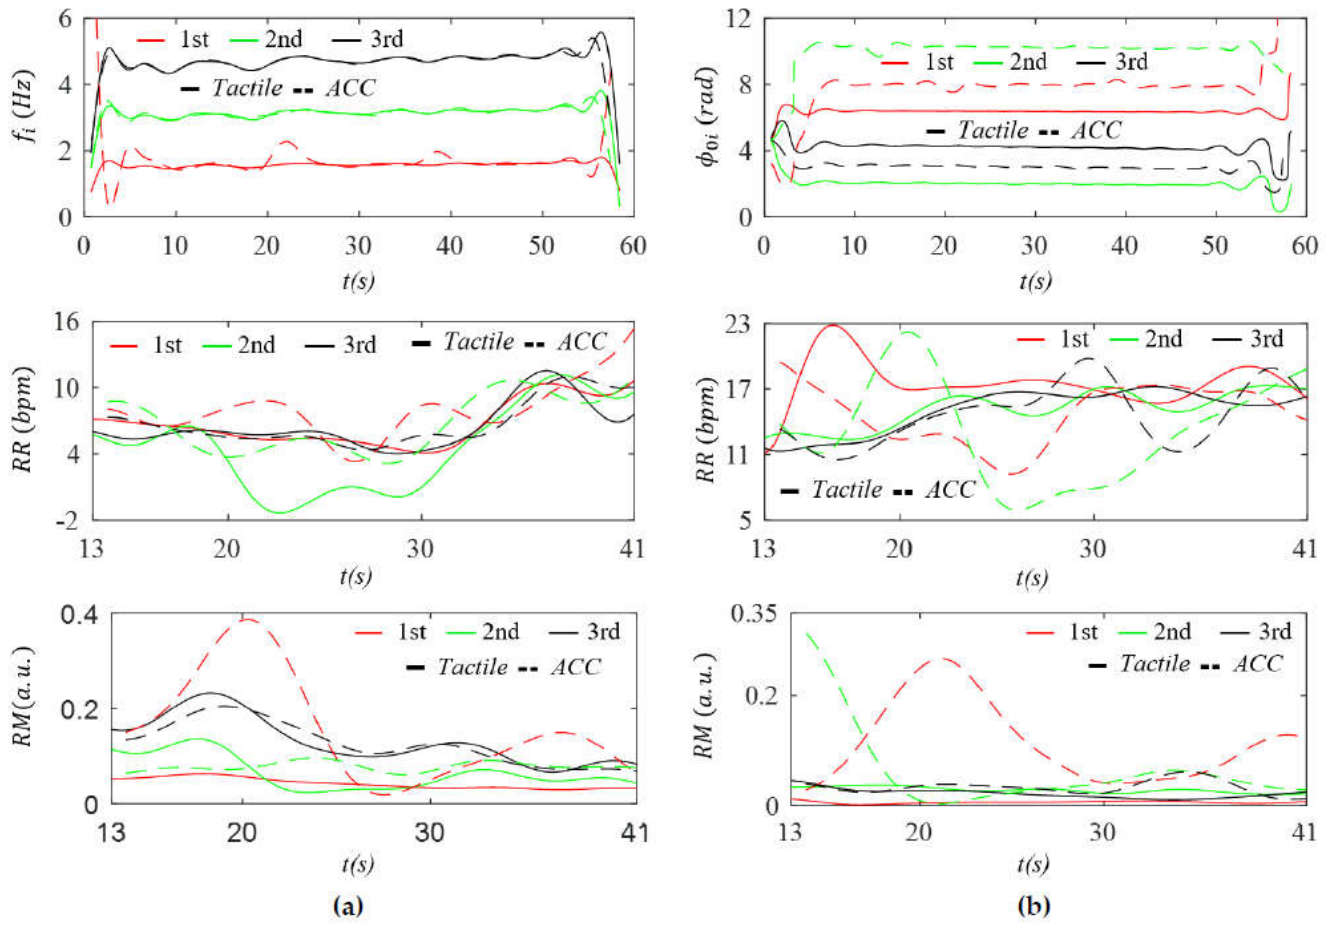
Figure 13.
Comparison of IF and IIP and their derived RR and RM between the tactile sensor and radial ACC outputs for Subject #1 at the RA: (a) IF, IF-based RR, and IF-based RM; and (b) IIP, IIP-based RR, and IIP-based RM.
Figure 13.
Comparison of IF and IIP and their derived RR and RM between the tactile sensor and radial ACC outputs for Subject #1 at the RA: (a) IF, IF-based RR, and IF-based RM; and (b) IIP, IIP-based RR, and IIP-based RM.
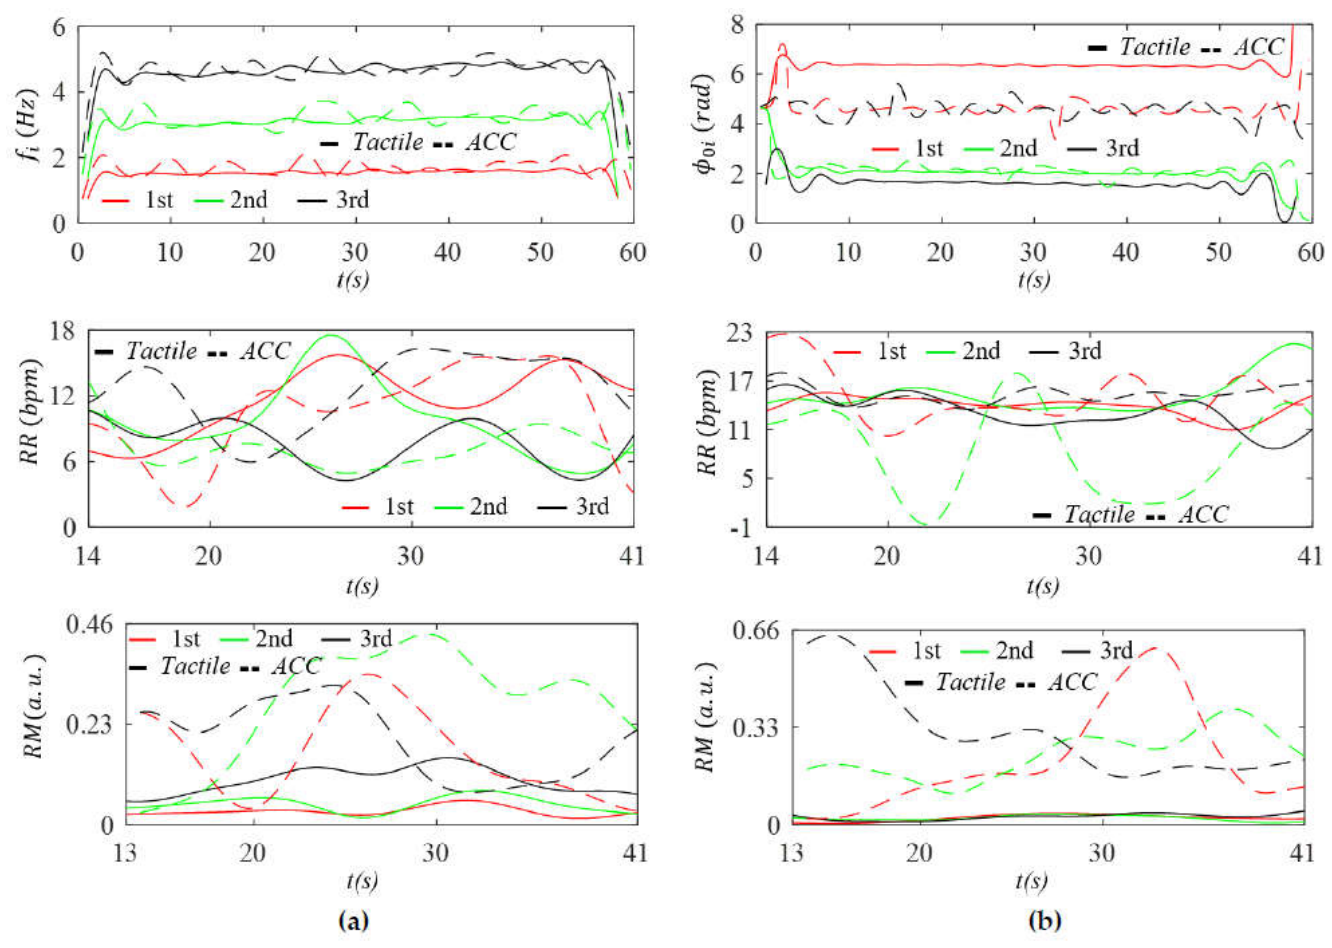
Figure 14.
Measured pulse signals with removal of BD for Subject #1 in the radial (az(t) and z(t)), axial (ax(t) and x(t)), and lateral (ay(t) and y(t)) directions of arterial wall motion in acceleration domain and displacement domains (a) CA (b) RA.
Figure 14.
Measured pulse signals with removal of BD for Subject #1 in the radial (az(t) and z(t)), axial (ax(t) and x(t)), and lateral (ay(t) and y(t)) directions of arterial wall motion in acceleration domain and displacement domains (a) CA (b) RA.
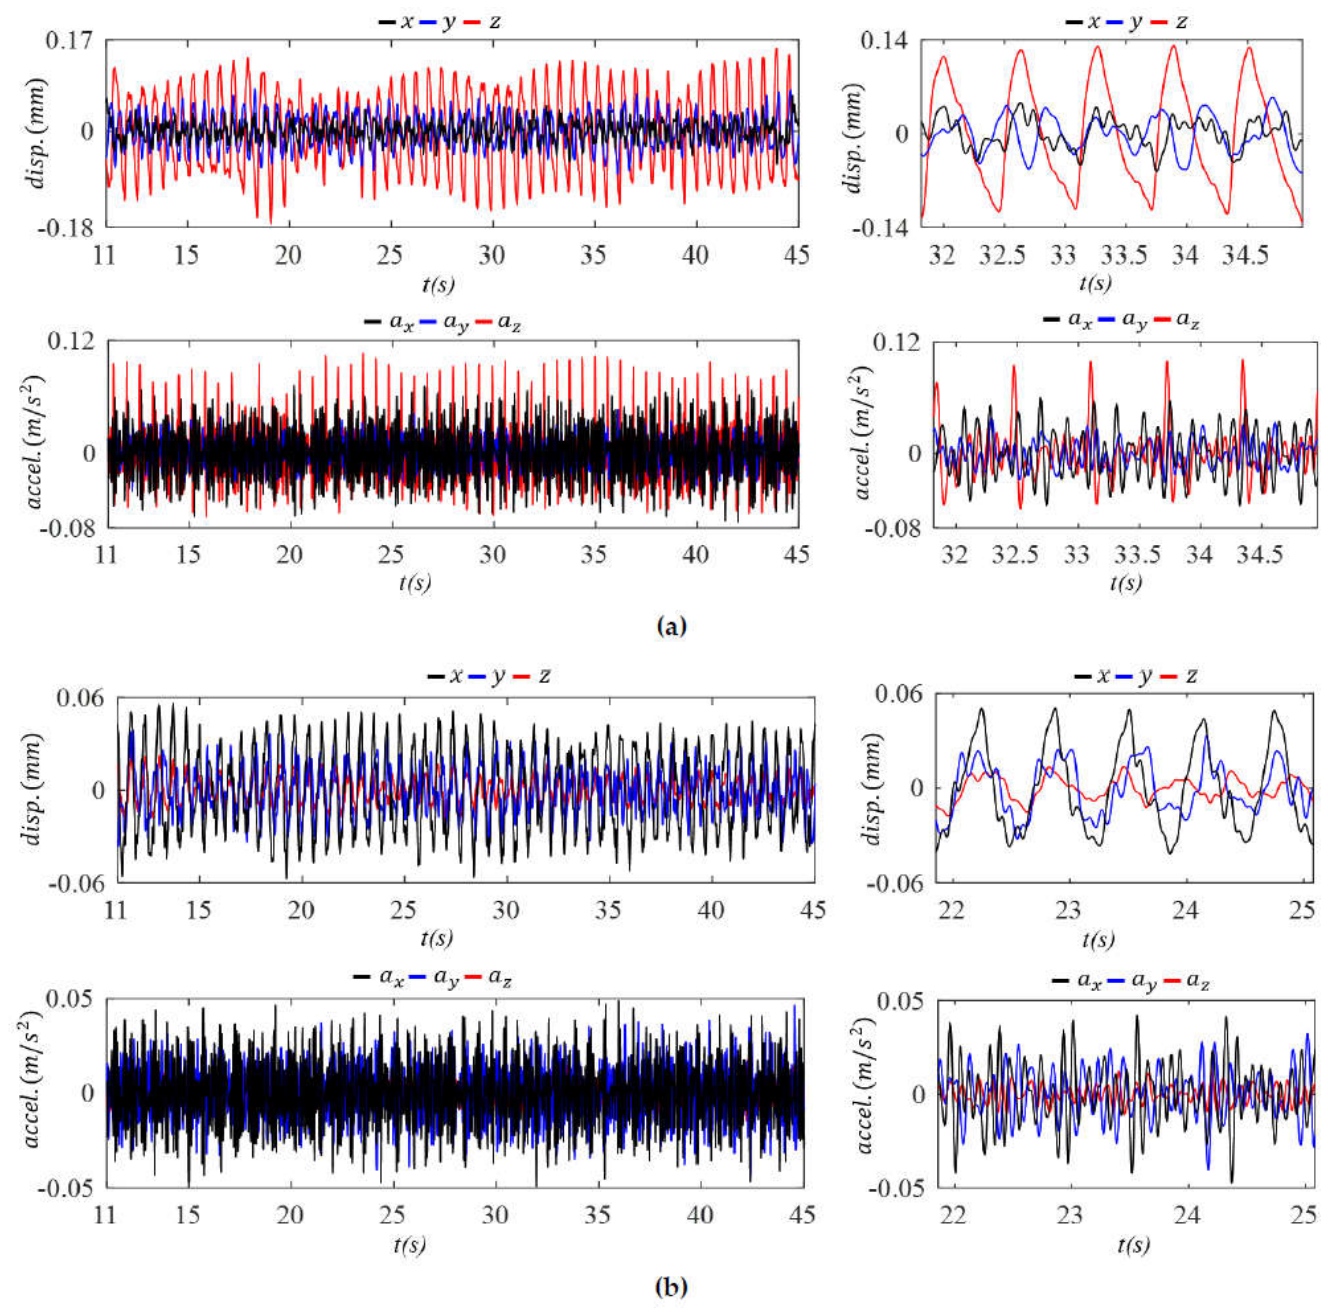
Figure 15.
Comparison of BD among the three directions—radial, axial, and lateral—of the ACC outputs for Subject #1 in the displacement and acceleration domains (a) CA and (b) RA.
Figure 15.
Comparison of BD among the three directions—radial, axial, and lateral—of the ACC outputs for Subject #1 in the displacement and acceleration domains (a) CA and (b) RA.
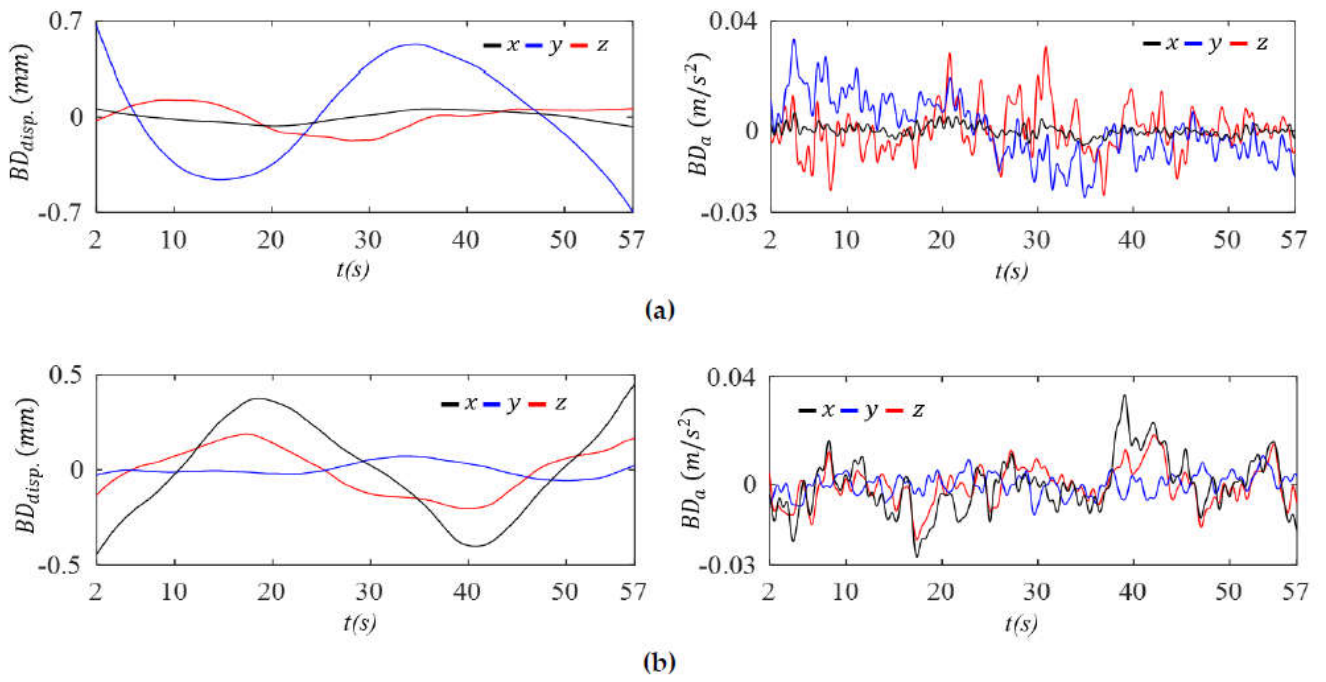

Table 1.
Comparison of the overall amplitudes of the measured pulse signals at the CA and RA from the tactile sensor output and the z-axis ACC output.
Table 1.
Comparison of the overall amplitudes of the measured pulse signals at the CA and RA from the tactile sensor output and the z-axis ACC output.
| Subject ID | #1 | #2 | #3 | ||
|---|---|---|---|---|---|
| Parameters | RA | CA | RA | CA | CA |
| Amplitude of ztactile(t) (µm) | 8.25 | 2.97 | 9.07 | 4.08 | 1.92 |
| Amplitude of zACC(t) (µm) | 27.4 | 226.0 | 57.2 | 597.5 | 329.9 |
Table 2.
Harmonic amplitude distribution comparison in APW in the displacement domain between the tactile sensor and the z-axis ACC outputs of three subjects at the CA (a) absolute values (b) normalized values relative to the first harmonic amplitude.
Table 2.
Harmonic amplitude distribution comparison in APW in the displacement domain between the tactile sensor and the z-axis ACC outputs of three subjects at the CA (a) absolute values (b) normalized values relative to the first harmonic amplitude.
| (a) | ||||||
| #1 | #2 | #3 | ||||
| Harmonics | Tactile (µm) | ACC (µm) | Tactile (µm) | ACC (µm) | Tactile (µm) | ACC (µm) |
| 1st | 0.859 | 55.6 | 1.1937 | 220 | 0.6373 | 100 |
| 2nd | 0.3291 | 20.8 | 0.3955 | 26.9 | 0.231 | 22 |
| 3rd | 0.1731 | 7.67 | 0.2582 | 15.8 | 0.1184 | 8.93 |
| 4th | 0.054 | 2.61 | 0.0859 | 5.76 | 0.0542 | 4.1 |
| 5th | 0.0754 | 2.74 | 0.0583 | 4.68 | 0.0529 | 1.56 |
| 6th | 0.0356 | 1.56 | 0.0579 | 3.3 | 0.0285 | 0.949 |
| 7th | 0.0148 | 0.743 | 0.0496 | 1.45 | 0.0072 | 0.371 |
| (b) | ||||||
| #1 | #2 | #3 | ||||
| Harmonics | Tactile | ACC | Tactile | ACC | Tactile | ACC |
| 1st | 1 | 1 | 1 | 1 | 1 | 1 |
| 2nd | 0.3832 | 0.3742 | 0.3313 | 0.1231 | 0.3624 | 0.2101 |
| 3rd | 0.2016 | 0.1379 | 0.2163 | 0.0724 | 0.1857 | 0.0851 |
| 4th | 0.0629 | 0.0469 | 0.072 | 0.0264 | 0.0851 | 0.0391 |
| 5th | 0.0878 | 0.0492 | 0.0489 | 0.0214 | 0.083 | 0.0149 |
| 6th | 0.0414 | 0.0281 | 0.0485 | 0.0151 | 0.0448 | 0.009 |
| 7th | 0.0173 | 0.0134 | 0.0415 | 0.0066 | 0.0114 | 0.0035 |
Table 3.
Harmonic amplitude distribution comparison in APW in the displacement domain between the tactile sensor and the z-axis ACC outputs of the two subjects at the RA (a) absolute values (b) normalized values relative to the first harmonic amplitude.
Table 3.
Harmonic amplitude distribution comparison in APW in the displacement domain between the tactile sensor and the z-axis ACC outputs of the two subjects at the RA (a) absolute values (b) normalized values relative to the first harmonic amplitude.
| (a) | ||||
| #1 | #2 | |||
| Harmonics | Tactile (µm) | ACC (µm) | Tactile(µm) | ACC (µm) |
| 1st | 1.9067 | 4.3637 | 3.0010 | 12.3924 |
| 2nd | 0.6142 | 1.0900 | 1.2839 | 2.1002 |
| 3rd | 0.3108 | 0.6902 | 0.6488 | 0.8503 |
| 4th | 0.1433 | 0.3252 | 0.2551 | 0.7193 |
| 5th | 0.1009 | 0.3594 | 0.1200 | 0.6403 |
| 6th | 0.0422 | 0.3569 | 0.0756 | 0.3762 |
| 7th | 0.0245 | 0.0315 | 0.0294 | 0.4822 |
| (b) | ||||
| #1 | #2 | |||
| Harmonics | Tactile | ACC. | Tactile | ACC |
| 1st | 1 | 1 | 1 | 1 |
| 2nd | 0.3221 | 0.2498 | 0.4278 | 0.1695 |
| 3rd | 0.1630 | 0.1582 | 0.2162 | 0.0686 |
| 4th | 0.0752 | 0.0745 | 0.0850 | 0.0580 |
| 5th | 0.0529 | 0.0824 | 0.0400 | 0.0517 |
| 6th | 0.0222 | 0.0818 | 0.0252 | 0.0304 |
| 7th | 0.0129 | 0.0072 | 0.0098 | 0.0389 |
Table 4.
Comparison of HR, HRV, RR (IF), RM (IF), RR (IIP), and RM (IIP) between the tactile sensor output and the z-axis ACC output for the three subjects (a) CA (b) RA.
Table 4.
Comparison of HR, HRV, RR (IF), RM (IF), RR (IIP), and RM (IIP) between the tactile sensor output and the z-axis ACC output for the three subjects (a) CA (b) RA.
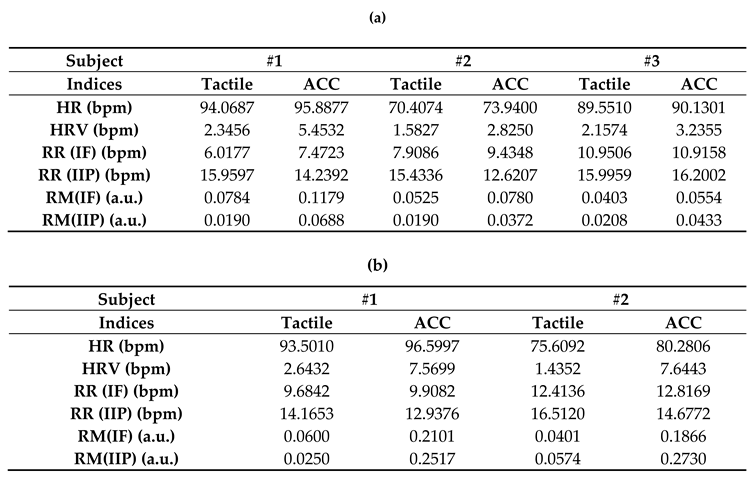
Disclaimer/Publisher’s Note: The statements, opinions and data contained in all publications are solely those of the individual author(s) and contributor(s) and not of MDPI and/or the editor(s). MDPI and/or the editor(s) disclaim responsibility for any injury to people or property resulting from any ideas, methods, instructions or products referred to in the content. |
© 2026 by the authors. Licensee MDPI, Basel, Switzerland. This article is an open access article distributed under the terms and conditions of the Creative Commons Attribution (CC BY) license.
Copyright: This open access article is published under a Creative Commons CC BY 4.0 license, which permit the free download, distribution, and reuse, provided that the author and preprint are cited in any reuse.