
Submitted:
10 November 2026
Posted:
11 November 2026
You are already at the latest version
Abstract
The worldwide push towards decarbonization has placed green hydrogen at the foundation of sustainable energy transitions, particularly in the Middle East and North Africa (MENA) region, where oil and gas corporations are expanding into low-carbon directions. Grounded in the Natural Resource-Based View (NRBV) and Dynamic Capabilities Theory, this study addresses whether green hydrogen supply chain initiatives can translate into competitive organizational performance in emerging market contexts characterized by managerial and technological constraints. Using a quantitative cross-sectional design, data were collected from 510 oil and gas professionals in the MENA region and analyzed through covariance-based structural equation modelling (CB-SEM). The findings indicate that green supply chain practices, specifically regulatory compliance and waste management, have a strong positive impact on organizational performance, while both managerial and technological barriers exert significant negative effects. Moderation analysis reveals an important asymmetry: technological barriers significantly condition the green practice-performance relationship, whereas managerial barriers, though directly harmful to performance, do not significantly moderate that pathway. This asymmetry is interpreted through a DCT lens: it is not green investment per se, but rather a firm's dynamic capacity to sense, seize, and reconfigure resources around those investments, enabled by technological infrastructure that determines whether NRBV-predicted performance advantages are realized. This study makes an original contribution by being among the first to empirically test the NRBV in the context of green hydrogen supply chains, and advances theory by demonstrating that the NRBV's performance logic is contingent on organizational enabling conditions, specifically technological readiness, as a scope condition rather than a mere empirical moderator.
Keywords:
green hydrogen
; supply chain management
; organizational performance
; natural resource-based view
; green supply chain practices
; managerial barriers
; technological barriers
; regulatory compliance
; waste management
; structural equation modeling
; MENA region
; oil and gas industry
1. Introduction
A central challenge in supply chain research concerns whether environmentally oriented capabilities yield performance advantages under conditions of organizational constraint [1,2]. The Natural Resource-Based View (NRBV) [3] predicts that firms developing green capabilities can achieve sustained competitive advantage. Yet this prediction rests on an implicit assumption that organizations possess the managerial and technological readiness to translate green capabilities into operational outcomes [4]. This assumption is rarely tested directly, and prior NRBV applications in supply chain contexts tend to document positive capability–performance associations without specifying the organizational conditions under which these associations weaken or fail [5,6]. Evidence from emerging market contexts, where resource constraints, institutional heterogeneity, and capability gaps are most acute, remains particularly scarce [7]. This is a meaningful theoretical gap, because if the NRBV’s performance logic depends critically on enabling conditions, then the theory’s scope conditions must be made explicit [8], particularly as scholars seek to extend it to novel domains such as green hydrogen supply chains [9].
The global energy transition has placed green hydrogen, produced through electrolysis powered by renewable electricity, at the center of national decarbonization strategies [10,11]. Governments and industry players worldwide have responded with subsidies, large-scale projects, and comprehensive policy packages, including clean hydrogen hubs in the United States [12], multi-billion-dollar investments in Japan [13], and major initiatives across the Middle East and North Africa [14]. These initiatives reflect the growing expectation that green hydrogen will form a cornerstone of hard-to-abate sector decarbonization. At the same time, the global market for green hydrogen is projected to grow at 48.7% per year, reaching an estimated USD 38.1 billion by 2029 [15].
Despite this momentum, translating hydrogen ambitions into commercially viable and environmentally robust supply chains remains deeply complex, and the MENA region illustrates both the promise and the difficulty. Several MENA countries have announced ambitious hydrogen strategies backed by substantial investment [16,17], yet the region is simultaneously characterized by structural vulnerabilities, including institutional heterogeneity, climatic exposure, and the demanding technological requirements of renewable-based hydrogen production at scale [18,19]. These characteristics make MENA oil and gas firms a theoretically important and practically underexplored context: they face strong external pressure to adopt green supply chain practices while confronting significant managerial and technological constraints that may neutralize the expected performance benefits. The cost gap between green and fossil-derived hydrogen, the capital intensity of electrolyzer infrastructure, and regulatory ambiguity further compound these internal barriers [20,21].
The managerial and technological constraints examined in this study can also be understood as organizational readiness conditions. In this study, technological barriers encompass infrastructure deficits, cost burdens, and workforce readiness gaps, whereas managerial barriers encompass leadership resistance, coordination failures, and strategic misalignment. The literature on organizational maturity and readiness assessment recognizes that organizations differ in their capacity to exploit new practices and technologies, and maturity models have been developed to describe and assess such differences across dimensions that include technology, leadership, and strategy [22,23,24].
At the same time, reviews of this literature caution that generic, one-size-fits-all assessments may not capture the conditions that matter in a particular industry or organizational context [25,26]. Rather than proposing or testing a maturity model, the present study contributes to this discussion by empirically examining, within a single sector and regional context, whether technological and managerial barriers affect organizational performance directly and whether they moderate the relationship between green supply chain practices and organizational performance.
Three specific gaps motivate this inquiry. First, NRBV applications in supply chain research have been conducted predominantly in developed-economy contexts where regulatory clarity, managerial capability, and technological infrastructure can be assumed; the theory’s predictive validity in institutional environments characterized by resource constraints, heterogeneous governance, and nascent technology ecosystems remains largely unexamined [7,27]. Second, while green supply chain management has attracted extensive empirical attention across manufacturing and logistics sectors, the green hydrogen value chain, with its distinctive electrolysis-based production logic, capital-intensive storage requirements, and evolving certification landscape, has not been subjected to systematic organizational performance testing; existing studies treat hydrogen largely as a technical or policy problem rather than a strategic capability-building challenge [20,21]. Third, the moderating conditions that determine whether NRBV-predicted advantages actually materialize have been left theoretically underspecified; Hart’s [3] original formulation treats green capability as a near-sufficient condition for advantage, but the organizational enabling conditions, managerial alignment, leadership commitment, and technological readiness, that govern this conversion process are rarely tested as boundary conditions within a single integrated model [4,8]. This study addresses all three gaps simultaneously.
This paper engages directly with the theoretical question of when and for whom the NRBV’s performance prediction holds. It argues that the relationship between green hydrogen supply chain practices, specifically regulatory compliance and waste management, and organizational performance is conditional on two organizational-level moderators: managerial barriers (encompassing leadership resistance, coordination failures, and strategic misalignment) and technological barriers (encompassing infrastructure deficits, cost burdens, and workforce readiness gaps). When these barriers are low, green supply chain practices should convert into efficiency gains, reputational capital, and financial returns consistent with NRBV logic. When barriers are high, the same practices may generate compliance activity without meaningful performance improvement, a decoupling effect between green capability investment and realized advantage. Empirical evidence on this conditionality remains limited, and while studies have explored green supply chain management broadly [28,29,30], little research has empirically examined the green hydrogen value chain and its organizational performance implications in MENA oil and gas firms. Theoretically, this study extends the NRBV by introducing organizational enabling conditions as explicit scope conditions rather than implicit assumptions, thereby specifying when and for whom the theory’s performance logic holds. Practically, the findings offer firm-level guidance on managerial capability development and technology investment prioritization for companies navigating the hydrogen transition. From a policy perspective, the results identify the regulatory levers and institutional enablers that governments and energy agencies can deploy to reduce the organizational barriers currently suppressing the performance returns of green hydrogen investments.
Using covariance-based structural equation modelling (CB-SEM) applied to a sample of 510 professionals from Middle East North Africa (MENA) oil and gas companies, the study makes three contributions. First, it extends the NRBV to the emerging domain of green hydrogen supply chains by examining whether green supply chain practices, comprising regulatory compliance and waste reduction and management, and the implementation of green hydrogen supply chains are associated with organizational performance. Second, it examines managerial and technological barriers both as direct predictors of organizational performance and as moderators of the relationship between green supply chain practices and organizational performance, thereby addressing the boundary conditions that the theory has largely left implicit. Third, it provides evidence from an underexplored regional context, MENA oil and gas firms, with practical implications for firms navigating the hydrogen transition and for policymakers designing enabling frameworks.
2. Theory and Review
2.1. Theoretical Framework
This study is grounded primarily in the Natural Resource-Based View (NRBV) [3], which holds that firms developing proactive environmental strategies, specifically pollution prevention, product stewardship, and sustainable development, can accumulate resources that are rare, valuable, and difficult to imitate, thereby generating sustained competitive advantage. Applied to green hydrogen supply chains, regulatory compliance and waste management routines constitute precisely the kind of tacit, organizationally embedded capabilities that the NRBV predicts will yield performance advantages.
However, the NRBV alone is insufficient to explain why identical green supply chain investments produce divergent performance outcomes across firms. Dynamic Capabilities Theory (DCT) [31,32] provides a complementary lens by focusing on firms’ capacity to sense environmental opportunities, seize strategic positions, and reconfigure existing resource bases in response to changing technological and market conditions [33]. In the context of green hydrogen, dynamic capabilities manifest as the organizational routines through which firms integrate electrolyzer technologies, reconfigure logistics assets for hydrogen distribution, and update workforce competencies in response to evolving regulatory and technical standards. DCT predicts that firms with stronger managerial and technological capabilities will be better positioned to translate green supply chain practices into realized performance gains, because such capabilities enable the conversion of compliance investments and waste management routines into operational efficiency and competitive repositioning. Accordingly, the combined NRBV-DCT framework predicts a positive direct effect of green supply chain practices on performance, consistent with the NRBV’s capability-advantage logic, and a moderating role for organizational capabilities, such that managerial and technological readiness amplifies performance returns while deficits in these capabilities dampen the practice-performance pathway, consistent with DCT’s reconfiguration logic. This integrated framework is summarized in Figure 1.
2.2. Green Hydrogen Supply Chains
Green hydrogen, generated through electrolysis using low-carbon energy sources, has become a central element of modern decarbonization policies owing to its dual economic and environmental advantages. The widespread implementation of green hydrogen is expected to support the emergence of new industries, create employment, and improve energy security by reducing reliance on imported fossil fuels [34,35]. According to IRENA [36], a fully integrated green hydrogen system, spanning industrial, transportation, and power sectors, has the potential to generate up to USD 2.5 trillion per year and approximately 30 million jobs by 2050. Green hydrogen can significantly reduce CO2 emissions across nearly all sectors and can serve as a medium for seasonal or long-term energy storage, thereby facilitating the absorption of intermittent renewable energy sources [37,38]. Concurrently, regulatory and technical standards are evolving rapidly, including the 2023 Renewable Fuel standards, the EU delegated acts on the sourcing of renewable hydrogen [12], and ISO 14687:2025, which specifies purity requirements and acceptable contaminant levels for hydrogen [39].
Hydrogen has applications across both material and energy domains: as a feedstock for ammonia production and petroleum refining, as a reducing agent in steelmaking, and as an energy carrier in transportation, including fuel cell electric vehicles, and power generation [40,41,42]. Ammonia production represents a near-term market in its own right, offering a viable replacement for grey hydrogen with significant potential to reduce CO2 emissions in the fertilizer and chemical industries [35,43]. In the mobility sector, hydrogen fuel cells offer faster refueling and higher gravimetric energy density than batteries, and governments are exploring auction mechanisms to stimulate demand despite prevailing green premium challenges.
Nevertheless, several barriers continue to impede the widespread adoption of hydrogen. Production costs remain high, driven primarily by electricity consumption and the capital intensity of electrolyzer units, although access to cheaper renewable electricity is expected to reduce these costs progressively [21]. Ambiguity in definitions, standards, and carbon accounting methodologies for green hydrogen also contributes to uncertainty in market and regulatory framework development [21]. Long-term implementation requires the coordinated development of integrated supply chain components, including low-carbon production through renewable-powered electrolysis, resilient storage solutions such as high-pressure vessels, liquefaction plants, or geological storage, and distribution networks comprising adapted or dedicated pipelines and maritime transportation to connect production sites with demand centers [44,45]. In the MENA region, major initiatives are advancing: the NEOM Green Hydrogen Project in Saudi Arabia had reached approximately 80% of its construction milestone by early 2025, while Oman has set a target of 1 Mt H2 per year, supported by multi-gigawatt leasing zones planned for 2024 [46,47].
2.3. Organizational Performance
Organizational performance is a heterogeneously defined construct in the management literature. Early research focused predominantly on financial measures such as return on assets (ROA) and return on investment (ROI), which dominated empirical studies in major journals [48,49]. Complementary conceptualizations define performance in terms of outputs generated over a given period, returns on assets [50], or value created for owners relative to their expectations [51]. Venkatraman and Ramanujam [52] defined operational performance as closely intertwined with a firm’s economic goals, while Connolly et al. [53] incorporated stakeholder and customer satisfaction as both antecedents and consequences of corporate success.
More recent research has shifted toward a multidimensional approach in which performance is defined by operational, financial, social, and environmental sub-indicators [54]. This perspective acknowledges important interdependencies, for instance, operational improvements tend to generate positive social and environmental outcomes. By embedding sustainability into core processes, firms can build reputational capital, strengthen stakeholder relationships, and enhance long-term competitiveness [55,56,57]. In the context of green hydrogen supply chains, this multidimensional framework provides a suitable basis for assessing how environmental supply chain practices translate into operational efficiency, financial returns, and broader socio-environmental performance in oil and gas companies. Policy credibility and market mechanism development, as more exogenous determinants of performance, can alleviate uncertainty, improve financing conditions, and accelerate off-take formation, representing additional pathways through which green supply chain management practices may affect both financial and operational performance.
2.4. Hypothesis Development
2.4.1. Impact of Green Supply Chain Practices on Organizational Performance
The decision to operationalize green supply chain practices through regulatory compliance and waste management reflects an evidence-based theoretical rationale. Legislation and regulatory frameworks represent the primary external levers that shape firm incentives, reduce investment uncertainty, and normalize sustainability expectations [58,59]. Empirical studies consistently show that explicit policies, streamlined permitting processes, and financial incentives exert a strong positive effect on green supply chain management implementation and project viability [60,61,62]. Complementarily, waste management captures the key operational processes through which firms realize environmental benefits and cost efficiencies [63,64,65,66,67]. Both dimensions are particularly relevant to oil and gas companies operating within green hydrogen value chains, where regulatory regimes, electrolysis by-products, and hazardous waste streams are central determinants of project feasibility and market credibility, and where robust waste management systems are essential for ensuring regulatory compliance, managing operational risk, and maintaining continuity of operations [68].
The theoretical logic connecting green supply chain practices to performance follows a resource-based mechanism [3]: firms that develop regulatory compliance routines and waste management capabilities accumulate tacit organizational knowledge, reduce operational uncertainty, and build legitimacy with regulators and external stakeholders, advantages that competitors cannot easily replicate [58,69]. Empirical and conceptual research confirms that explicit public policy and enforcement accelerate the adoption of green supply chain management and can improve operational outcomes [59]. Regulatory instruments, including emissions standards, permitting requirements, and product specifications, reduce project risk in the context of green hydrogen, facilitate long-term off-take and investment planning, and encourage firms to internalize environmental externalities [41]. Similarly, rigorous waste management strategies minimize material and disposal costs, reduce regulatory penalties and operational disruptions, and create resource efficiency opportunities [63,67]. In the oil and gas sector, where drilling residues, electrolysis by-products, and hazardous waste streams are ongoing operational concerns, the implementation of robust waste management systems helps reduce environmental impact while improving operational efficiency [68].
H1.
Waste management and regulatory compliance practices in green hydrogen supply chains have a positive impact on organizational performance.
2.4.2. Implementation of Green Hydrogen Supply Chains and Its Impact on Organizational Performance
The adoption of end-to-end green hydrogen supply chains, encompassing electrolysis, storage, distribution, and end-use, represents a strategic diversification of energy assets for incumbent oil and gas companies [70]. Diversification into low-carbon hydrogen can reduce exposure to fossil fuel price volatility, open access to new markets such as ammonia production, low-carbon steel, and long-haul transport, and generate new revenue streams through long-term supply contracts [71,72]. Beyond revenue considerations, green hydrogen integration can improve environmental performance indicators, including carbon intensity and license-to-operate metrics, thereby strengthening firm legitimacy and access to capital [73]. Despite the substantial capital requirements, scale constraints, and technology maturity challenges involved, firms that leverage existing infrastructure, logistics capabilities, and project development expertise are well positioned to achieve competitive advantages through this transition [74].
The literature suggests that effective adoption of green hydrogen supply chains will generate positive organizational outcomes, operational, financial, and reputational, if firms can manage the associated scale, technology, and financing challenges. The theoretical argument draws on the NRBV’s sustainable development capability [3]: end-to-end green hydrogen integration represents a long-horizon, resource-intensive commitment that, once established, creates durable competitive asymmetry. The expected performance effect is positive and direct, operating through revenue diversification, enhanced environmental legitimacy, and reduced exposure to fossil fuel price volatility.
H2.
The implementation of green hydrogen supply chains has a positive impact on the organizational performance.
2.4.3. Impact of Managerial Barriers on Organizational Performance
Managerial barriers, including low levels of leadership commitment, resistance to change, poor cross-functional coordination, and insufficient sustainability-related competencies, represent significant internal constraints on sustainable innovation [66,75,76]. The absence of adequate managerial capabilities leads to inefficient resource allocation, poor decision-making, and the failure to integrate sustainability goals into corporate strategy [77,78]. In the oil and gas industry, the successful execution of complex projects requires effective cross-functional coordination, meaningful stakeholder engagement, and sound long-term investment decisions. Weaknesses in these managerial capabilities can inflate budgets, extend project timelines, and undermine performance outcomes [79]. Empirical evidence consistently shows that poor managerial practices are associated with lower operational efficiency and a reduced capacity to capture the benefits of environmental programs [80]. Accordingly, managerial barriers are expected to exert a negative direct effect on organizational performance by impeding the successful execution and scaling of green hydrogen initiatives. However, a theoretically complete account must specify not only these expected main effects but also the conditions under which they are diminished. The following hypotheses address this conditionality by specifying managerial and technological barriers first as direct negative predictors of performance (H3, H5) and then as moderators of the green practice–performance relationship, with managerial barriers expected to weaken (H4) and technological barriers expected to strengthen (H6) this relationship. This two-part structure separates the independent drag of barriers on performance from their interactive effect on the green practice pathway, an important theoretical distinction.
H3.
Managerial barriers have a negative impact on the organizational performance.
2.4.4. Managerial Barriers as a Moderator of Green Supply Chain Practices on Organizational Performance
Although regulatory compliance and waste management practices create performance potential, the extent to which these practices convert into realized performance gains depends critically on managerial capability. From a Dynamic Capabilities perspective [32], firms with weak managerial alignment, poor inter-departmental coordination, and limited change leadership will lack the sensing and seizing routines needed to translate compliance investments into operational efficiencies or reputational gains. Managerial barriers are therefore theorized as moderators of the relationship between internal green supply chain practices, specifically waste management routines and regulatory compliance, and organizational performance, rather than as moderators of broad supply chain strategy. Empirical evidence confirms that internal alignment is required to realize the benefits of favourable external incentives and standards [48,78,81]. When managerial capability is high, regulatory compliance and waste management practices generate returns through faster learning cycles, stronger stakeholder credibility, and lower compliance risk. When managerial capability is low, the same practices may produce compliance activity without meaningful performance improvement, a decoupling between green investment and realized advantage.
H4.
Managerial barriers negatively moderate the relationship between internal green hydrogen supply chain practices (regulatory compliance and waste management) and organizational performance, such that higher managerial barriers weaken the positive practice–performance relationship.
2.4.5. Impact of Technological Barriers on Organizational Performance
Technological barriers, including reduced electrolyzer efficiency, immature storage and transportation technologies, insufficient recycling and reutilization capabilities, and inadequate digital and data integration infrastructure, directly threaten the cost-effectiveness and scalability of green hydrogen projects [82,83]. High capital costs associated with electrolyzer procurement, storage liquefaction, and pipeline conversion extend project payback periods and increase financial risk [84]. Technical shortcomings also limit operational availability, increase operation and maintenance expenditures, and may compromise safety and regulatory compliance, thereby reducing organizational performance [36,85]. Without adequate technological preparedness, in terms of both equipment and a technically skilled workforce, organizations will struggle to achieve the efficiencies necessary for competitive green hydrogen economics, with negative consequences for both operational and financial performance.
H5.
Technological barriers have a negative effect on the organizational performance.
2.4.6. Technological Barriers as a Moderator of Green Supply Chain Practices on Organizational Performance
Technological readiness defines the extent to which firms can operationalize regulatory compliance and waste management practices into measurable performance outcomes. Compliance with environmental reporting and emissions requirements increasingly depends on digital monitoring systems, automation platforms, and data integration infrastructure; in the absence of such technologies, compliance is costly, error-prone, and unlikely to generate efficiency gains [86,87]. Similarly, advanced recycling technologies, brine treatment systems, and high-pressure storage capabilities can transform waste management programs from cost centers into resource recovery opportunities, creating value that partially or fully offsets disposal costs [68,88]. Technological barriers are therefore theorized as moderators of the specific relationship between internal green supply chain practices, waste management and regulatory compliance, and organizational performance. This framing aligns with the Resource-Based View logic that the value of a capability depends on the complementary assets available to deploy it [51,89]: regulatory compliance routines and waste management systems are valuable only to the extent that the technological infrastructure exists to enact them efficiently. An alternative, compensatory logic, however, suggests the opposite pattern. Where technological infrastructure is deficient, firms cannot rely on technology to achieve efficiency and compliance; organizational routines such as systematic regulatory compliance and structured waste reduction and management then become the primary means of controlling costs, avoiding penalties, and maintaining legitimacy. Under such conditions, the marginal performance contribution of green supply chain practices is likely to be greater than in firms where advanced technologies already deliver these benefits. Following this compensatory logic, technological barriers are expected to strengthen, rather than weaken, the relationship between green supply chain practices and organizational performance.
H6.
Technological barriers positively moderate the relationship between internal green hydrogen supply chain practices (regulatory compliance and waste management) and organizational performance.
The following conceptual framework is being tested in the research that is represented in the following Figure 1.
3. Materials and Methods
This study adopts a quantitative cross-sectional design to empirically test theory-derived propositions grounded in the NRBV [4]. Quantitative designs are appropriate for measuring relationships between constructs using numerical data and inferential statistics, in this case, the relationships between green hydrogen supply chain implementation, green supply chain practices (regulatory compliance and waste management), organizational performance, and the moderating effects of managerial and technological barriers. Cross-sectional surveys capture stakeholder perceptions at a single point in time, which suits a deductive, theory-testing logic rather than inductive theory generation [90], while the NRBV provides directional relational propositions that support objective, generalizable inference [4].
3.1. Research Instrument
Data were collected using a structured questionnaire that operationalized each construct through established scales adapted to the green hydrogen and oil and gas contexts. A 7-point Likert scale (1 = Strongly Disagree, 7 = Strongly Agree) was employed to maximize response variance and measurement sensitivity [91]. Multi-item scales included Implementation of Green Hydrogen Supply Chains (IGHSC1–IGHSC4), Legislations and Regulations (RL1–RL6), Waste Reduction and Management (WRM1–WRM5), Organizational Performance (OP1–OP4), Managerial Barriers (MB1–MB3) and Technological Barriers (TB1–TB6) all specific to MENA operations. Content and face validity were established through expert review and pilot testing, after which items were refined accordingly. Prior to hypothesis testing, internal consistency (Cronbach’s alpha), construct reliability (composite reliability, CR), and convergent validity (average variance extracted, AVE) were assessed for each construct. All α, CR, AVE values are reported in Table 1. The standardized instrument and Likert scale facilitate parametric testing, including CB-SEM, and support cross-construct comparisons and scale refinement [92].
The implementation of green hydrogen supply chains was measured using a four-item scale adopted from Bhandari and Shah [93]. Legislations and regulations were assessed through a six-item scale adapted from Hafezalkotob [94]. Waste management was measured using a five-item scale adopted from Lui et al. [95]. Organizational performance was captured through a four-item scale from Lee et al. [96]. Managerial barriers were measured with a three-item scale adopted from Ilyas et al. [97], while technological barriers were assessed using a six-item scale adopted from Gupta et al. [98]. All constructs were measured on a seven-point Likert scale.
All constructs in this study are specified as reflective, consistent with the assumption that the latent variable causally produces variation in its indicators and items within each scale represent interchangeable manifestations of the same underlying construct [99]. Construct operationalization followed the three-step validation approach recommended by MacKenzie et al. [99], which included explicit theoretical justification of the reflective measurement model, assessment of item-level fit through factor loadings and modification indices in confirmatory factor analysis (CFA), and triangulation of validity evidence across multiple criteria (α, CR, AVE). No construct was treated as formative. However, the composite nature of green supply chain practices, comprising regulatory compliance and waste management as theoretically distinct sub-dimensions, was acknowledged by treating each sub-dimension as a separate first-order reflective factor within a hierarchical model structure.
3.2. Population and Sample
The target population comprises employees of international and regional oil and gas companies operating in the MENA region who are involved in, or directly familiar with, green hydrogen supply chain projects. A purposive (non-probability) sampling approach was adopted to reach respondents with direct knowledge of green hydrogen and sustainability initiatives in MENA oil and gas companies. An industry-based sampling frame was constructed using industry directories, company contacts, and professional networks, with a focus on individuals with direct knowledge of company strategy, operations, or sustainability, including project managers, supply chain leads, and HSE managers. For an unknown population size, the minimum required sample was calculated using the Cochran formula and determined to be approximately n = 384. The survey was distributed to 700 employees to account for non-response and to enable robust subgroup comparisons. Eligibility criteria required respondents to be currently employed by an oil and gas company in the MENA region and to have direct familiarity with hydrogen or sustainability initiatives. The survey was distributed online, yielding 515 responses, a response rate of 73.6%. Five incomplete questionnaires were subsequently removed, leaving a final analytic sample of 510 responses. A response rate exceeding 60% is considered satisfactory; however, given the purposive sampling design, the sample cannot be assumed to be statistically representative of the target population. Missing values, multicollinearity, and outliers were screened prior to analysis, and all 510 remaining observations were used in the descriptive and structural analyses.
3.3. Data Collection Method
Data were collected via a web-based survey platform, which facilitated broad geographic coverage, efficient dissemination, and automated data export for subsequent analysis. Following best practices for transparent data preparation [100], a sequential screening protocol was applied prior to analysis. First, missing data were examined; no case exceeded 5% missingness on any single item, and listwise deletion was applied to the five incomplete questionnaires removed prior to the analytic sample (n = 510). Second, straight lining and response-pattern checks were conducted to identify careless responding, and no cases were flagged beyond those already removed. Third, normality was assessed through item-level skewness (all within ±2) and kurtosis (all within ±7), and multivariate normality was evaluated. Fourth, multicollinearity was diagnosed using variance inflation factors (VIF) and tolerance statistics for all constructs. All VIF values were below 3.5 and tolerance values above 0.28, indicating no problematic multicollinearity. Fifth, potential outliers were identified using Mahalanobis distance (D2) and no observations exceeded the critical χ2 threshold at p < 0.001, and none were removed at this stage.
The descriptive statistics and demographic profiling were calculated using SPSS version 25. Confirmatory factor analysis and hypothesis testing were conducted using covariance-based structural equation modelling in AMOS version 25. CB-SEM enabled the simultaneous testing of the measurement model and the structural model, with overall model fit assessed using indices including CFI, RMSEA, and χ2/df, and path significance evaluated through standardized estimates and bias-corrected confidence intervals (Hair et al., 2014). Managerial and technological barriers as moderators were examined by introducing interaction terms and conducting multi-group analyses; results were interpreted in terms of statistical significance, effect sizes, and their theoretical implications within the NRBV framework.
4. Findings and Analysis
4.1. Demographics
Table 2 summarizes the demographic characteristics of the respondents, providing an important contextual basis for interpreting the study’s findings. The sample was broadly distributed across age groups, with the largest proportions falling in the 25–34 (23.5%), 35–44 (19.0%), 45–54 (18.0%), and 55–64 (17.6%) categories. Notably, 21.8% of respondents were aged 65 or older, indicating that the sample encompasses both younger professionals and highly experienced senior staff. The gender distribution was nearly equal, female 47.5% and male 52.5%, which reduces the likelihood of gender-related bias and contributes to a more balanced interpretation of the findings.
The distribution of industry experience was also favorable. The largest proportion of respondents reported 11–15 years of industry experience (22.4%), consistent with the organizational tenure distribution, in which 23.3% of participants had been in their current position for 11–15 years. These patterns indicate that the sample is composed predominantly of professionals with substantial career backgrounds, thereby supporting the validity of insights drawn regarding organizational practices.
In terms of company profiles, there was a strong representation of large firms. Nearly half of the organizations employed between 5001 and 10,000 staff (49.2%), and 69.4% reported annual revenues exceeding USD 100 billion. The sample was reasonably balanced across firm types, with private (32.9%), public (32.5%), and semi-private (34.5%) entities represented in roughly equal proportions. The distribution of supplier numbers was also well spread, with no single supplier-size category dominating the sample.
Regarding the maturity of green hydrogen adoption, the majority of firms were at the implementation stage: 69.4% reported being midway through the adoption process, 21.4% were at the initial consideration stage, and only 9.2% had reached an advanced level of adoption. This distribution suggests that most organizations remain in transition and have yet to achieve full implementation maturity, despite the growing strategic prominence of green hydrogen.
4.2. Descriptive Analysis
Table 3 presents the descriptive statistics that form the empirical basis for assessing respondents’ perceptions of organizational performance, green supply chain practices, green hydrogen supply chain adoption, and the impact of managerial and technological barriers.
The mean scores for organizational performance (OP1–OP4) range from 4.90 to 4.97 on the 7-point Likert scale, with an overall average of 4.93. These values indicate moderate to positive self-assessments, suggesting that while organizations do not report exceptionally high performance levels, they perceive modest improvements in both operational and strategic performance attributable to their existing practices.
Mean scores for green hydrogen supply chain adoption (IGHSC1–IGHSC4) range from 4.79 to 4.88, reflecting a moderate level of engagement. This is consistent with the demographic data indicating that most organizations are in transition rather than at an advanced stage of adoption. Green supply chain practices were assessed across two dimensions: regulatory compliance (RL1–RL6), with mean values ranging from 4.71 to 4.85, and waste reduction and management (WRM1–WRM5), with mean values ranging from 4.75 to 4.83. Both sets of results indicate that firms are moderately engaged in regulatory compliance and have taken meaningful steps toward adopting waste management practices.
Barriers were examined in the form of managerial constraints (MB1–MB3) and technological constraints (TB1–TB6). Managerial barriers recorded mean scores between 3.22 and 3.34, indicating a low-to-moderate perception of leadership resistance and coordination constraints. Technological barriers showed a similar pattern, with means ranging from 3.12 to 3.27, reflecting moderate concerns regarding infrastructure adequacy and associated costs. Standard deviation values across most items (1.58–1.75) indicate moderate variability, suggesting that while a general consensus exists among respondents, considerable differences in organizational readiness and experience levels remain.
4.3. Normality Analysis
The normality of the dataset was examined to confirm the suitability of parametric statistical methods, including Structural Equation Modeling (SEM). Skewness and kurtosis values were calculated for all observed variables. Skewness coefficients fell within the accepted range of ±2 and kurtosis values within ±7, indicating that the data approximated a normal distribution without significant deviations that could bias subsequent analyses. Normality is a critical assumption in structural equation modelling, as it supports the validity of maximum likelihood estimation, which requires multivariate normality to produce efficient and unbiased parameter estimates [101]. In addition to skewness and kurtosis diagnostics, Mahalanobis distances were computed to detect potential multivariate outliers. No observations exceeded the critical chi-square value at p < 0.001, confirming the absence of problematic outliers. Collectively, these diagnostic results confirm the integrity of the dataset and its suitability for advanced multivariate analysis. The necessary assumptions for SEM were therefore adequately satisfied, supporting the reliability and generalizability of conclusions drawn from the structural model.
4.4. Structural Model Fit
The proposed structural model was tested against the hypothesized structure using covariance-based SEM in AMOS 25, and the results provided in Table 4 show that the model fits well on various indices. The measurement model comprised six latent constructs indicated by 28 observed items, which yielded a model with 406 distinct sample moments. The number of freely estimated parameters, factor loadings, factor variances and covariance, and error variances, produced df = 326 for the CFA solution, consistent with the CMIN reported in Table 4. The CMIN/DF of 2.73 is less than the threshold of 5 thus indicating an acceptable model fit. Fit indices, including GFI (0.910), CFI (0.950) and TLI (0.942) are above the recommended minimum of 0.90, thus validating good model specification. Also, the value of RMSEA of 0.058 is comfortably within the range of 0.08, which is sufficient parsimony and model fit. Factor loadings on all items were always greater than 0.74, which is above the 0.70 criterion of convergent validity, and therefore confirms the coherence of the constructs and their measurement items. Thus, the structural equation model is an appropriate representation of the data and can be used to test the hypothesis.
Discriminant validity was evaluated through two established techniques such as the Fornell-Larcker criterion [102] and the heterotrait–monotrait (HTMT) ratio of correlations [103]. Under the Fornell-Larcker approach, each construct’s average variance extracted (AVE) square root is compared against its inter-construct correlations; discriminant validity holds when the former exceeds the latter for all constructs, reflecting that each variable’s indicators are more closely tied to their own construct than to any other in the model. For the Fornell–Larcker matrix, the square root of each construct’s AVE (presented along the diagonal) surpassed all corresponding inter-construct correlations, satisfying this criterion. Complementing this, the HTMT ratio was examined against the conservative threshold of 0.90 [104], with values below this benchmark indicating that constructs are empirically distinguishable from one another [105]. All HTMT values in the present model fell well below this threshold (Table 5). The results from both approaches provide consistent and robust evidence that discriminant validity is upheld across all constructs in the measurement model.
Figure 2 depicts the structural model.
4.5. Hypothesis Testing
4.5.1. Green Supply Chain Practices and Organizational Performance
The hypothesis testing results, summarized in detail in Table 6, reveal a number of statistically significant relationships between green supply chain practices and organizational performance. The composite path from green supply chain practices to organizational performance (H1) was positive, substantial, and statistically significant (β = 0.538, p < 0.001), with a 95% bias-corrected confidence interval of [0.411, 0.675] that excludes zero entirely. This effect, the largest in the structural model, indicates that the combined influence of regulatory compliance routines and organized waste management practices generates meaningful performance returns. The findings suggest that firms combining compliance with external regulatory requirements and internal waste reduction and management practices report higher organizational performance, consistent with the NRBV’s prediction that green capabilities yield competitive advantage.
4.5.2. Implementing Phase of Green Hydrogen Supply Chains
The findings indicate a positive and statistically significant relationship between green hydrogen supply chain implementation and organizational performance (H2; β = 0.412, p < 0.001). The associated 95% bias-corrected confidence interval [0.278, 0.566] lies entirely above zero, confirming a robust positive effect. These results indicate that the introduction of innovative and sustainable hydrogen-related processes can significantly enhance overall organizational outcomes.
4.5.3. Barriers and Organizational Performance
The analysis of performance barriers reveals that both managerial and technological barriers have statistically significant negative effects on organizational performance. Managerial barriers are negatively associated with performance (H3, β = −0.235, p < 0.001), with a 95% bias-corrected confidence interval of [−0.343, −0.153] that excludes zero. Technological barriers show a similarly significant negative relationship (H5, β = −0.250, p < 0.001), with a confidence interval of [−0.364, −0.155] that likewise excludes zero. These findings suggest that both types of barriers are associated with lower organizational performance over and above the effects of green supply chain practices and green hydrogen supply chain implementation. Consequently, organizations seeking to improve performance during the green hydrogen transition should address these internal and technological impediments directly.
4.5.4. Moderating Effects
The moderation analysis reveals that internal organizational barriers condition the effectiveness of green supply chain practices in distinct ways. The interaction of managerial barriers with green supply chain practices on organizational performance (H4; β = 0.083, p = 0.099) was not statistically significant, and the 95% bias-corrected confidence interval [−0.016, 0.215] includes zero, indicating no reliable moderating effect of managerial barriers at conventional significance levels. H4 is therefore not supported. In contrast, technological barriers significantly moderated the green practice–performance relationship (H6; β = 0.174, p = 0.003), with a 95% bias-corrected confidence interval of [0.058, 0.315] that excludes zero, confirming a consistent interaction effect. The results suggest that the level of technological barriers conditions the degree to which green supply chain practices translate into organizational performance.
Specifically, the positive relationship between green supply chain practices and organizational performance was stronger at higher levels of technological barriers. Together with the negative direct effect of technological barriers (H5), this indicates that firms facing greater technological constraints, although starting from a lower performance baseline, benefit more from regulatory compliance and waste reduction and management practices.
5. Discussion
One of the most noteworthy findings of this research is the strong positive effect of green supply chain practices, comprising legislation and regulatory compliance and waste reduction and management, on organizational performance (β = 0.538), the largest effect in the structural model. This finding supports the argument that external institutional forces, particularly regulatory frameworks, serve as powerful facilitators of environmental strategy adoption and performance improvements [59,106]. When operating within an environment where the environmental laws are strict, firms face a twofold challenge, they must not only comply with applicable standards to avoid penalties but also build legitimacy with the stakeholders. The results are consistent with this rationale: regulatory compliance is one of the two dimensions through which green supply chain practices are associated with higher organizational performance in MENA oil and gas companies.
This finding is consistent with Ballo et al. [61] and Jermsittiparsert et al. [62], who demonstrate that regulatory frameworks function as a form of external governance that reduces investment uncertainty and promotes sustainable investment, particularly in emerging sectors such as green hydrogen. In the MENA energy industry, where political-economic systems are predominantly state-directed, the regulatory environment exerts an even stronger influence on organizational behavior. Unlike liberalized markets, where firm-level discretion is comparatively greater, MENA economies tend to bind organizational incentives, including subsidies, tax benefits, and licensing approvals, with regulatory compliance pathways. As a result, organizations that actively align with hydrogen-related regulatory frameworks not only reduce institutional friction but also place themselves strategically to seize state-supported investment opportunities, international alliances, and preferential procurement contracts.
Both dimensions load substantially on the second-order green supply chain practices construct (waste reduction and management: 0.715; legislation and regulations: 0.682), indicating that the performance effect reflects their combined contribution rather than the dominance of either dimension. Because the two dimensions were modelled as components of a single higher-order construct, their separate effects on organizational performance were not estimated. Whereas firms in Europe or North America often rely on bottom-up waste reduction programs to achieve operational benefits [60], top-down regulatory directives represent the primary organizing principle of strategic and operational priorities in MENA. Whether this policy-driven context makes regulatory compliance a stronger driver of performance than internal waste reduction and management practices therefore remains an open question that future studies estimating the two dimensions separately could address.
These findings carry direct managerial implications: organizations should invest in targeted leadership development programs, change management training, and cross-functional coordination mechanisms as preconditions for sustainability transitions, not as supplementary activities. In particular, MENA state-owned enterprises, which tend to operate within hierarchical governance structures, should prioritize structured leadership alignment initiatives that reframe green hydrogen as a strategic opportunity rather than a compliance obligation. In practical terms, this implies that technology investment should precede or accompany green supply chain practice adoption, rather than follow it. Organizations that implement regulatory compliance frameworks without concurrent investment in digital reporting systems, or that introduce waste management programs without recycling and treatment infrastructure, are likely to incur compliance costs without capturing the associated efficiency benefits. From a policy perspective, this finding supports the case for government co-investment in technology infrastructure and workforce technical capability as necessary complements to regulatory mandates, a balance that is particularly important in MENA energy markets where hydrogen technology ecosystems remain nascent and firms often rely heavily on imported technology.
5.1. Green Hydrogen Supply Chain Implementation
The empirical evidence shows that the deployment of green hydrogen supply chains has a statistically significant positive relationship with organizational performance. This result provides direct empirical evidence to the arguments put forward by sustainability theorists that hydrogen adoption is a two-sided lever, which improves both sustainability and competitiveness [38].
Many companies had already partially adopted green hydrogen initiatives. However, the performance improvements could already be measured. This observation suggests that the complete maturity of green hydrogen is not a precondition to the achievement of economic and operational advantages. The partial implementation, which is achieved by pilot production facilities, creation of small-scale storage facilities, or the introduction of distribution partnerships, can bring instant benefits in the efficiency of operations, the reputation of stakeholders, and compliance with the regulations. These findings support the arguments of Seck et al. [106] who recommend incremental deployment strategies that enable firms to enjoy early benefits of learning-by-doing and reduce the risks of waiting until the market or technology matures.
5.2. Managerial and Technological Barriers
This study provides strong evidence that managerial and technological barriers have a significant direct negative effect on organizational performance in the process of sustainability transition. The negative effect of managerial barriers highlights the persistent weaknesses in leadership alignment and cultural preparedness among oil and gas companies seeking to adopt green hydrogen. Where senior executives are reluctant to invest in emerging technologies or lack a coherent strategic vision, organizational progress is hindered, efficiency improvements are foregone and compliance benefits are delayed. Sustainability transitions require not only material resources but also organizational narrative that position green hydrogen as a strategic opportunity rather than a cost burden, as noted by Busse [77] and Slawinski and Bansal [78]. The absence of such a narrative, particularly within the hierarchical structures of MENA state-owned enterprises, constrains knowledge diffusion, reduces employee commitment, and undermines the implementation of change programs. This finding resonates with Graham et al. [81], who demonstrate that organizational enabling structures, specifically stakeholder engagement mechanisms and human resource practices, are necessary conditions for green supply chain practices to generate competitive advantage; in the absence of these structures, the performance potential of even well designed sustainability programs remains unrealized.
The drag of technological constraints on performance is equally evident. Consistent with Boulmrharj et al. [84], this study finds that inadequate infrastructure, lack of technically skilled staff, and excessive dependence on imported hydrogen technologies limits firms’ capacity to translate hydrogen investments into realized performance gains. This is consistent with the broader observation that hydrogen technology in the MENA region is still in its infancy and requires substantial research and development partnership and significant capital inflows. Without investment in localized technological ecosystems and systematic skills transfer, companies risk becoming passive consumers of hydrogen value chains, rather than being active contributors to their development. Such dependence may increase costs, create operational vulnerabilities, and limit the competitive advantage that green hydrogen adoption could otherwise deliver.
5.3. Moderating Effects of Barriers
The moderation analysis reveals a theoretically important asymmetry between the roles of managerial and technological barriers. Contrary to expectation, managerial barriers did not significantly moderate the relationship between green supply chain practices and organizational performance. This null result should not be dismissed as a non-finding. Rather, it refines the theoretical picture that managerial barriers exert a significant direct negative effect on performance (H3), but do not appear to alter the strength of the green practice-performance pathway itself. This distinction suggests that managerial resistance suppresses overall organizational functioning broadly, rather than specifically undermining the value of regulatory compliance or waste management investments. In contexts where leadership commitment is weak, green supply chain practices may still generate their expected returns, but those returns land on a lower performance baseline.
In contrast, technological barriers significantly and positively moderated the relationship between green supply chain practices and organizational performance (H6). Because technological barriers also have a negative direct effect on performance (H5), this pattern suggests a compensatory role for green supply chain practices: firms facing higher technological barriers start from a lower performance baseline but derive greater performance benefits from regulatory compliance and waste reduction and management practices than firms with fewer barriers. In such firms, organizational routines may partly substitute for missing technological infrastructure. This supports the earlier work of Fiorucci et al. [64] and Giannikos [65], who highlighted that waste minimization in the absence of adequate technological support often generates inefficiencies or misallocated resources. The current study adds new empirical evidence by connecting this technological contingency directly to the green hydrogen supply chain context, an area in which few empirical studies currently exist.
The technological context is therefore an important boundary condition of the green practice–performance relationship, although in the direction of compensation rather than complementarity. In the resource-intensive, state-controlled MENA energy environment, where hydrogen technology ecosystems remain nascent, regulatory compliance and waste reduction and management routines may be particularly valuable for firms that cannot yet rely on advanced technological infrastructure.
5.4. Integration with NRBV
The results support an integrated NRBV–Dynamic Capabilities interpretation of green supply chain performance. Consistent with Hart [3], the findings indicate that green supply chain practices, comprising regulatory compliance and waste reduction and management, and green hydrogen supply chain implementation are positively associated with organizational performance. The DCT lens [32] offers a possible explanation: the significant moderating role of technological barriers suggests that the performance returns of green supply chain practices depend not only on the practices themselves but also on the technological conditions under which they are deployed. Although dynamic capabilities were not measured directly in this study, this pattern is consistent with DCT’s prediction that capability heterogeneity drives performance heterogeneity even when firms adopt nominally identical practices. These findings are consistent with the NRBV logic that firm-specific environmental strategies can function as valuable, and potentially inimitable resources when institutionalized into operational routines. However, the study also highlights the conditional applicability of the NRBV in practice: the relationship between green supply chain practices and organizational performance varies with the level of technological barriers. Importantly, the theoretical contribution of this study extends beyond simply applying the NRBV to a new empirical setting. In its original formulation, the NRBV treats environmental capability as a sufficient condition for advantage [3], leaving underspecified the organizational conditions under which such capabilities fail to perform as predicted. The findings of this study introduce a meaningful qualification: the theory’s core prediction is supported, but the strength of the green practice–performance relationship depends on technological conditions. This represents an advance of the kind described by Sandberg and Alvesson [8], in which a theoretical contribution arises by revealing that an accepted theory operates only within implicit boundary conditions. This conditionality suggests that the NRBV may benefit from explicitly incorporating technological conditions as a scope condition rather than treating them as an implicit assumption. Agyabeng-Mensah et al. [27] reach a complementary conclusion, arguing that focusing exclusively on identifying green practices without specifying the organizational conditions that enable those practices to generate performance benefits produces incomplete theoretical and managerial guidance. This study addressed this gap by testing managerial and technological barriers as explicit boundary conditions of the NRBV.
6. Conclusion
This study examined how green hydrogen supply chain practices, specifically regulatory compliance and waste management, affect the organizational performance of oil and gas firms in the MENA region, and how managerial and technological barriers condition those effects. Using CB-SEM applied to 510 professionals, the research finds consistent support for the NRBV’s core prediction that green capabilities yield performance advantages, while simultaneously identifying the organizational boundary conditions under which those advantages are realized or suppressed.
6.1. Summary of Key Findings
The results establish four principal findings. First, green supply chain practices, comprising regulatory compliance and waste reduction and management, have a strong and significant positive effect on organizational performance (β = 0.538, p < 0.001), representing the largest effect in the structural model. Second, the implementation of green hydrogen supply chains is positively associated with organizational performance (β = 0.412, p < 0.001), suggesting that performance benefits may emerge even before adoption is complete. Third, both managerial barriers (β = −0.235, p < 0.001) and technological barriers (β = −0.250, p < 0.001) exert significant direct negative effects on performance, confirming that internal organizational deficits suppress baseline functioning. Fourth, the moderation analysis reveals a theoretically important asymmetry: technological barriers significantly moderate the green practice-performance relationship (β = 0.174, p = 0.003), indicating that green supply chain practices are more strongly associated with performance in firms facing higher technological barriers, consistent with a compensatory role of these practices, whereas managerial barriers, while directly harmful, do not significantly moderate the practice-performance pathway, suggesting that leadership deficits suppress overall organizational functioning broadly rather than specifically undermining the value of compliance or waste management routines.
6.2. Theoretical and Practical Contributions
This study makes three theoretical contributions. First, it extends the NRBV to the empirically underexplored domain of green hydrogen supply chains, demonstrating that the NRBV’s capability–advantage logic [3] applies to this emerging clean energy context when organizational enabling conditions are adequate. Second, it introduces and empirically confirms the boundary conditions of the NRBV, specifically technological readiness, as a scope condition of the theory rather than merely an empirical moderator. This advances the argument of Sandberg and Alvesson [8] that theoretical contributions arise by specifying the implicit conditions under which accepted theories operate, and supports the call by Cornelissen et al. [9] for more precise scope specification in supply chain theorizing. Third, the integration of DCT [32] with the NRBV provides a richer explanation of why green capability investments produce heterogeneous performance outcomes: it is firms’ dynamic capability to sense, seize, and reconfigure resources around those investments, enabled by technological infrastructure, that converts green practice into realized advantage.
6.3. Managerial Implications
For practitioners, the findings carry direct implications. Firms investing in regulatory compliance systems and waste management infrastructure should recognize that these investments will not automatically translate into performance gains in the absence of parallel investment in technological readiness. This means prioritizing digital monitoring and reporting systems, upgrading electrolysis and storage infrastructure, and investing in workforce upskilling programs that build technical competencies in hydrogen operations, emissions accounting, and waste stream management. Leaders in MENA oil and gas firms should also invest in organizational change management to reduce managerial resistance and build cross-functional coordination mechanisms, not because managerial barriers directly moderate the value of green practices, but because they suppress the organizational baseline on which all sustainability benefits are built. Practically, this implies that training programs targeting leadership alignment, strategic communication of hydrogen transition goals, and incentive structures that reward sustainability performance are necessary preconditions for organizational readiness.
6.4. Policy Recommendations
For policymakers and regulators, the results highlight several levers. The strong positive effect of green supply chain practices, of which regulatory compliance is one of two dimensions, suggests that clear, well-enforced hydrogen standards, including emissions reporting requirements, electrolysis certification frameworks, and waste management mandates, may support firm-level performance improvement. Regulators should therefore prioritize regulatory certainty and simplification of permitting processes to reduce the institutional friction that currently deters investment. Additionally, given the significant negative effect of technological barriers, government-supported capability-building programs, including co-investment in electrolyzer infrastructure, subsidized training for hydrogen technicians, and technology transfer partnerships between advanced economies and MENA firms, would help close the technological readiness gap that currently limits the performance returns of green supply chain adoption. Energy agencies should also design performance-linked incentive schemes that tie subsidy access to demonstrable investments in technological infrastructure and workforce capability, thereby accelerating the organizational readiness conditions that the findings identify as critical.
6.5. Research Limitations
Despite its contributions, this study has several limitations. The focus on the MENA region limits the generalizability of the findings, given the region’s distinctive economic, legal, and cultural characteristics relative to other global contexts. Additionally, cross-sectional research design limits the ability to monitor long-term perceptions, adoption mechanisms, and results associated with green hydrogen technologies. Moreover, because all constructs were measured at a single point in time, the relationships identified in this study should be interpreted as associations rather than causal effects; reverse causality, for example, higher-performing firms being better able to invest in green supply chain practices, cannot be ruled out. Given that green hydrogen is a rapidly evolving industry, longitudinal research would be valuable for tracing the adoption process, monitoring how barriers change, and assessing whether organizational performance benefits are sustained over time. Furthermore, because respondents were selected through purposive (non-probability) sampling from industry directories, company contacts, and professional networks, the findings should be generalized with caution.
A further limitation is the reliance on self-reported survey data, which is susceptible to social desirability bias. Respondents may have overstated their organizations’ sustainability activities or underestimated the intensity of the barriers they face, potentially introducing distortion into the findings. Moreover, while the operationalization of managerial and technological barriers in the study yielded meaningful results, it might not have fully captured the multidimensional nature of these constructs. Future studies should therefore develop more detailed measurement instruments that account for the nuanced dimensions of leadership style, organizational culture, technological infrastructure, and innovation capacity.
6.6. Future Research
Longitudinal studies are needed to clarify how the effects of green hydrogen supply chain practices evolve over time and whether initial barriers diminish as organizations accumulate experience and resource capital. Comparative studies across regions and sectors would also enrich the literature by illuminating how contextual factors shape the relationship between green practices and performance in different settings. A further promising avenue is the investigation of advanced digital technologies, including artificial intelligence, blockchain, and the Internet of Things, in the context of green hydrogen supply chains. While such technologies hold considerable potential for improving transparency, efficiency, and sustainability outcomes, their adoption also introduces new challenges that warrant systematic empirical inquiry. Future research should examine the intersection of technological innovation and sustainability adoption, particularly in resource-constrained environments.
The role of organizational culture and leadership styles in facilitating or impeding sustainable practices also merits further investigation. Analyzing how different management styles and cultural orientations influence the adoption of green hydrogen technologies would generate practical insights for overcoming resistance to change. Incorporating the perspectives of a broader range of stakeholders, including suppliers, customers, policymakers, and non-governmental organizations, could shed light on collaborative approaches to scaling green hydrogen implementation across supply chains. Future studies should also consider integrating financial and socio-ecological performance metrics into the analytical framework. Finally, future research would benefit from mixed-method designs that combine managerial perceptions with objective operational or financial performance records, and that collect data from multiple respondents per organization to more accurately capture organizational-level constructs.
Author Contributions
Conceptualization, K.S., E.K. and M.P.; methodology, K.S., E.K., M.P. and S.Z.; software, K.S. and S.Z.; validation, K.S. and S.Z.; formal analysis, K.S., E.K., M.P. and S.Z.; investigation, K.S.; resources, K.S., E.K., M.P. and S.Z., data curation, K.S.; writing—original draft preparation, K.S., E.K. and M.P.; writing—review and editing, K.S., E.K., M.P. and S.Z.; visualization, K.S., E.K. and M.P.; supervision, E.K., M.P. and S.Z., project administration, E.K., M.P. and S.Z.
Funding
This research received no external funding.
Data Availability Statement
The original contributions presented in this study are included in the article. Further inquiries can be directed to the corresponding author.
Acknowledgments
During the preparation of this manuscript the authors used ChatGPT, Claude 4.6 in order to translate and edit the manuscript. After using this tool/service, the authors have reviewed and edited the output and take full responsibility for the content of this publication.
Conflicts of Interest
The authors declare no conflicts of interest.
Abbreviations
The following abbreviations are used in this manuscript:
| AVE | Average Variance Extracted |
| CR | Composite Reliability |
| CB-SEM | Covariance-based structural equation modelling |
| DCT | Dynamic Capabilities Theory |
| EU | European Union |
| ISO | International Organization for Standardization |
| MENA | Middle East North Africa |
| NRBV | Natural Resource-Based View |
| VIF | Variance Inflation Factors |
References
- Miemczyk, J.; Howard, M.; Johnsen, T.E. Dynamic development and execution of closed-loop supply chains: A natural resource-based view. SCM 2016, 21, 453–469. [Google Scholar] [CrossRef]
- Wiredu, J.; Yang, Q.; Sampene, A.K.; Gyamfi, B.A.; Asongu, S.A. The effect of green supply chain management practices on corporate environmental performance: Does supply chain competitive advantage matter? Bus. Strat Env. 2024, 33, 2578–2599. [Google Scholar] [CrossRef]
- Hart, S.L. A Natural-Resource-Based View of the Firm. Acad. Manag. Rev. 1995, 20, 986. [Google Scholar] [CrossRef]
- Hart, S.L.; Dowell, G. Invited Editorial: A Natural-Resource-Based View of the Firm: Fifteen Years After. J. Manag. 2011, 37, 1464–1479. [Google Scholar] [CrossRef]
- Golicic, S.L.; Smith, C.D. A Meta-Analysis of Environmentally Sustainable Supply Chain Management Practices and Firm Performance. J. Supply Chain Manag 2013, 49, 78–95. [Google Scholar] [CrossRef]
- Li, S.; Jayaraman, V.; Paulraj, A.; Shang, K. Proactive environmental strategies and performance: Role of green supply chain processes and green product design in the Chinese high-tech industry. Int. J. Prod. Res. 2016, 54, 2136–2151. [Google Scholar] [CrossRef]
- Diabat, A.; Govindan, K. An analysis of the drivers affecting the implementation of green supply chain management. Resour. Conserv. Recycl. 2011, 55, 659–667. [Google Scholar] [CrossRef]
- Sandberg, J.; Alvesson, M. Meanings of Theory: Clarifying Theory through Typification. J. Manag. Stud. 2021, 58, 487–516. [Google Scholar] [CrossRef]
- Cornelissen, J.; Stephens, V.; Matthews, L. Unlocking the power of diversity for supply chain knowledge: Is pluralism in theorizing styles the key? J. Supply Chain Manag. 2024, 60, 3–17. [Google Scholar] [CrossRef]
- Acar, C.; Dincer, I. Review and evaluation of hydrogen production options for better environment. J. Clean. Prod. 2019, 218, 835–849. [Google Scholar] [CrossRef]
- Mac Dowell, N.; et al. The hydrogen economy: A pragmatic path forward. Joule 2021, 5, 2524–2529. [Google Scholar] [CrossRef]
- Offutt, M.C. Hydrogen Hubs and Demonstrating the Hydrogen Energy Value Chain. Available online: https://www.congress.gov/crs-product/R47289 (accessed on 7 April 2026).
- Collins, L. “Japanese Government Allocates $21bn to Clean Hydrogen Subsidies,” hydrogeninsight.com. Available online: https://www.hydrogeninsight.com/policy/japanese-government-allocates-21bn-to-clean-hydrogen-subsidies/2-1-1574077 (accessed on 7 April 2026).
- Writer, S. Oman Awards $6.7 Billion Contract for World’s Largest Green Hydrogen Plant—Oil & Gas Middle East. Available online: https://www.oilandgasmiddleeast.com/news/oman-awards-6-7-billion-contract-for-worlds-largest-green-hydrogen-plant (accessed on 7 April 2026).
- Singh, R.; Singh, M.; Gautam, S. Hydrogen economy, energy, and liquid organic carriers for its mobility. Mater. Today Proc. 2021, 46, 5420–5427. [Google Scholar] [CrossRef]
- Abdelshafy, A.; Lambert, M.; Walther, G. MENA Region as a Potential Hydrogen Supplier for the European Market: Analysing a Prospective Route Between Kingdom of Saudi Arabia and Germany; OIES Paper no. 31; The Oxford Institute for Energy Studies: Oxford, UK, 2024. [Google Scholar]
- Martin, P.; Parkes, R. “UAE Targets 15 Million Tonnes of Green Hydrogen Production by 2050 as It Approves National H2 Strategy,” hydrogeninsight.com. Available online: https://www.hydrogeninsight.com/policy/uae-targets-15-million-tonnes-of-green-hydrogen-production-by-2050-as-it-approves-national-h2-strategy/2-1-1480383 (accessed on 7 April 2026).
- Hydrogen. Policy Toolbox for Low Carbon and Renewable Hydrogen. 2021. Available online: https://hydrogencouncil.com/en/policy-toolbox-for-low-carbon-and-renewable-hydrogen/ (accessed on 7 April 2026).
- IRENA. “Green Hydrogen Supply: A Guide to Policy Making,” International Renewable Energy Agency. May 2021. Available online: https://www.irena.org/publications/2021/May/Green-Hydrogen-Supply-A-Guide-To-Policy-Making (accessed on 7 April 2026).
- Vankayala, S.; Singh, S.V.; V J, S.; Dhiman, B. Trends, challenges, and opportunities in the global green hydrogen value chain: A comprehensive bibliometric and thematic analysis. Sustain. Futur. 2025, 10, 100966. [Google Scholar] [CrossRef]
- Velazquez Abad, A.; Dodds, P.E. Green hydrogen characterisation initiatives: Definitions, standards, guarantees of origin, and challenges. Energy Policy 2020, 138, 111300. [Google Scholar] [CrossRef]
- Becker, J.; Knackstedt, R.; Pöppelbuß, J. Developing Maturity Models for IT Management: A Procedure Model and its Application. Bus. Inf. Syst. Eng. 2009, 1, 213–222. [Google Scholar] [CrossRef]
- Schumacher, A.; Erol, S.; Sihn, W. A Maturity Model for Assessing Industry 4.0 Readiness and Maturity of Manufacturing Enterprises. Procedia CIRP 2016, 52, 161–166. [Google Scholar] [CrossRef]
- Kahveci, E.; Toprak, B.; Nebati, E.E.; Zaim, S. Assessing Digital Maturity in the Textile Sector: An Integrated MEREC and OCRA Approach. Adm. Sci. 2026, 16, 135. [Google Scholar] [CrossRef]
- Teichert, R. Digital Transformation Maturity: A Systematic Review of Literature. Acta Univ. Agric. Silvic. Mendel. Brun. 2019, 67, 1673–1687. [Google Scholar] [CrossRef]
- Thordsen, T.; Murawski, M.; Bick, M. How to Measure Digitalization? A Critical Evaluation of Digital Maturity Models. In Responsible Design, Implementation and Use of Information and Communication Technology; Hattingh, M., Matthee, M., Smuts, H., Pappas, I., Dwivedi, Y.K., Mäntymäki, M., Eds.; Lecture Notes in Computer Science; Springer International Publishing: Cham, Switzerland, 2020; Volume 12066, pp. 358–369. [Google Scholar] [CrossRef]
- Agyabeng-Mensah, Y.; Oloruntoba, R.; Earnest, J.; Mohammadi, H. Sustainable Supply Chain Management and Performance Outcomes: Supply Chain Practice View and Mediated Moderation Perspectives. Bus. Strat Env. 2025, 34, 8237–8258. [Google Scholar] [CrossRef]
- Ahmad, N.K.W.; De Brito, M.P.; Rezaei, J.; Tavasszy, L.A. An integrative framework for sustainable supply chain management practices in the oil and gas industry. J. Environ. Plan. Manag. 2017, 60, 577–601. [Google Scholar] [CrossRef]
- Diab, S.M.; AL-Bourini, F.A.; Abu-Rumman, A.H. The Impact of Green Supply Chain Management Practices on Organizational Performance: A Study of Jordanian Food Industries. J. Manag. Sustain. 2015, 5, 149. [Google Scholar] [CrossRef]
- Ferreira, M.A.; Jabbour, C.J.C.; De Sousa Jabbour, A.B.L. Maturity levels of material cycles and waste management in a context of green supply chain management: An innovative framework and its application to Brazilian cases. J. Mater. Cycles Waste Manag. 2017, 19, 516–525. [Google Scholar] [CrossRef]
- Teece, D.J. Explicating dynamic capabilities: The nature and microfoundations of (sustainable) enterprise performance. Strat. Mgmt. J. 2007, 28, 1319–1350. [Google Scholar] [CrossRef]
- Teece, D.J.; Pisano, G.; Shuen, A. Dynamic Capabilities and Strategic Management. Strateg. Manag. J. 1997, 18, 509–533. [Google Scholar] [CrossRef]
- Eisenhardt, K.M.; Martin, J.A. Dynamic capabilities: What are they? Mgmt. J. 2000, 21, 1105–1121. [Google Scholar] [CrossRef]
- Al-Orabi, A.M.; Osman, M.G.; Sedhom, B.E. Analysis of the economic and technological viability of producing green hydrogen with renewable energy sources in a variety of climates to reduce CO2 emissions: A case study in Egypt. Appl. Energy 2023, 338, 120958. [Google Scholar] [CrossRef]
- Li, Y.; Shi, X.; Phoumin, H. A strategic roadmap for large-scale green hydrogen demonstration and commercialisation in China: A review and survey analysis. Int. J. Hydrogen Energy 2022, 47, 24592–24609. [Google Scholar] [CrossRef]
- IRENA. “Hydrogen,” International Renewable Energy Agency. 2022. Available online: https://www.irena.org/Energy-Transition/Technology/Hydrogen (accessed on 7 April 2026).
- Hermesmann, M.; Müller, T.E. Green, Turquoise, Blue, or Grey? Environmentally friendly Hydrogen Production in Transforming Energy Systems. Prog. Energy Combust. Sci. 2022, 90, 100996. [Google Scholar] [CrossRef]
- Stöckl, F.; Schill, W.-P.; Zerrahn, A. Optimal supply chains and power sector benefits of green hydrogen. Sci. Rep. 2021, 11, 14191. [Google Scholar] [CrossRef] [PubMed]
- ISO 14687:2025; ISO: Geneva, Switzerland. Available online: https://www.iso.org/standard/82660.html (accessed on 7 November 2026).
- Atilhan, S.; Park, S.; El-Halwagi, M.M.; Atilhan, M.; Moore, M.; Nielsen, R.B. Green hydrogen as an alternative fuel for the shipping industry. Curr. Opin. Chem. Eng. 2021, 31, 100668. [Google Scholar] [CrossRef]
- Ghavam, S.; Vahdati, M.; Wilson, I.A.G.; Styring, P. Sustainable Ammonia Production Processes. Front. Energy Res. 2021, 9, 580808. [Google Scholar] [CrossRef]
- Ramachandran, R. An overview of industrial uses of hydrogen. Int. J. Hydrogen Energy 1998, 23, 593–598. [Google Scholar] [CrossRef]
- Fúnez Guerra, C.; et al. “Viability analysis of underground mining machinery using green hydrogen as a fuel”. Int. J. Hydrogen Energy 2020, 45, 5112–5121. [Google Scholar] [CrossRef]
- Alasali, F.; Abuashour, M.I.; Hammad, W.; Almomani, D.; Obeidat, A.M.; Holderbaum, W. A review of hydrogen production and storage materials for efficient integrated hydrogen energy systems. Energy Sci. Eng. 2024, 12, 1934–1968. [Google Scholar] [CrossRef]
- Carneiro, J.F.; Matos, C.R.; Van Gessel, S. Opportunities for large-scale energy storage in geological formations in mainland Portugal. Renew. Sustain. Energy Rev. 2019, 99, 201–211. [Google Scholar] [CrossRef]
- Alrahbi, A. Oman on Course to Exceed Green Hydrogen Target by 2030|fm.gov.om. 2024. Available online: https://www.fm.gov.om/en/17513/ (accessed on 7 April 2026).
- Mohammad, S. NEOM Green Hydrogen Project Reaches 80% Construction Completion—SaudiGulf Projects. Available online: https://www.saudigulfprojects.com/2025/06/neom-green-hydrogen-project-reaches-80-completion/ (accessed on 7 April 2026).
- Combs, J.G.; Crook, T.R.; Shook, C.L. The Dimensionality of Organizational Performance and Its Implications for Strategic Management Research. In Research Methodology in Strategy and Management; Emerald (MCB UP): Bingley, UK, 2005; Volume 2, pp. 259–286. [Google Scholar] [CrossRef]
- Miller, C.C.; Washburn, N.T.; Glick, W.H. PERSPECTIVE—The Myth of Firm Performance. Organ. Sci. 2013, 24, 948–964. [Google Scholar] [CrossRef]
- Rumelt, R.P. How much does industry matter? Strateg Manag. J. 1991, 12, 167–185. [Google Scholar] [CrossRef]
- Barney, J.B. Resource-based theories of competitive advantage: A ten-year retrospective on the resource-based view. J. Manag. 2001, 27, 643–650. [Google Scholar] [CrossRef]
- Venkatraman, N.; Ramanujam, V. Measurement of Business Performance in Strategy Research: A Comparison of Approaches. Acad. Manag. Rev. 1986, 11, 801. [Google Scholar] [CrossRef] [PubMed]
- Connolly, T.; Conlon, E.J.; Deutsch, S.J. Organizational Effectiveness: A Multiple-Constituency Approach. Acad. Manag. Rev. 1980, 5, 211. [Google Scholar] [CrossRef]
- Hubbard, G. Measuring organizational performance: Beyond the triple bottom line. Bus. Strat Env. 2009, 18, 177–191. [Google Scholar] [CrossRef]
- Avunduk, Z.B.; Toprak, B.; Kahveci, E.; Zaim, S.; Yılmaz, M.K. Assessing and Weighting Key Barriers to Sustainable Manufacturing in Türkiye. In Sustainable Green Conversion; Durakbasa, N.M., Gülen, K.G., Eds.; Lecture Notes in Mechanical Engineering; Springer Nature: Cham, Switzerland, 2025; pp. 271–289. [Google Scholar] [CrossRef]
- Kumar, N.; Brint, A.; Shi, E.; Upadhyay, A.; Ruan, X. Integrating sustainable supply chain practices with operational performance: An exploratory study of Chinese SMEs. Prod. Plan. Control 2019, 30, 464–478. [Google Scholar] [CrossRef]
- Kahveci, E.; Gürgür, T.; Avunduk, Z.B. From Digital Transformation to Sustained Competitive Advantage: How Strategic Orientation, Technology Sophistication, and Adaptive Capability Drive Operational Efficiency. Adm. Sci. 2026, 16, 401. [Google Scholar] [CrossRef]
- Abbas, J. Green supply chain management and firm sustainable performance: Unlocking the role of transactional and transformational leadership in firm sustainable operations. Environ. Dev. Sustain 2024, 28, 1827–1846. [Google Scholar] [CrossRef]
- Bu, X.; Dang, W.V.T.; Wang, J.; Liu, Q. Environmental Orientation, Green Supply Chain Management, and Firm Performance: Empirical Evidence from Chinese Small and Medium-Sized Enterprises. Int. J. Environ. Res. Public Health 2020, 17, 1199. [Google Scholar] [CrossRef] [PubMed]
- Aydin, M.; Degirmenci, T.; Erdem, A.; Sogut, Y.; Demirtas, N. From public policy towards the green energy transition: Do economic freedom, economic globalization, environmental policy stringency, and material productivity matter? Energy 2024, 311, 133404. [Google Scholar] [CrossRef]
- Ballo, A.; et al. Law and Policy Review on Green Hydrogen Potential in ECOWAS Countries. Energies 2022, 15, 2304. [Google Scholar] [CrossRef]
- Jermsittiparsert, K.; Namdej, P.; Somjai, S. Green Supply Chain Practices and Sustainable Performance: Moderating Role of Total Quality Management Practices in Electronic Industry of Thailand. International Journal of Supply Chain Management 2019, 8, 33–46. [Google Scholar]
- Chintapalli, P.; Vakharia, A.J. The waste management supply chain: A decision framework. Decis. Sci. 2024, 55, 421–435. [Google Scholar] [CrossRef]
- Fiorucci, P.; Minciardi, R.; Robba, M.; Sacile, R. Solid waste management in urban areas. Resour. Conserv. Recycl. 2003, 37, 301–328. [Google Scholar] [CrossRef]
- Giannikos, I. A multiobjective programming model for locating treatment sites and routing hazardous wastes. Eur. J. Oper. Res. 1998, 104, 333–342. [Google Scholar] [CrossRef]
- Gupta, H.; Barua, M.K. A framework to overcome barriers to green innovation in SMEs using BWM and Fuzzy TOPSIS. Sci. Total Environ. 2018, 633, 122–139. [Google Scholar] [CrossRef] [PubMed]
- Malek, W.; Mortazavi, R.; Cialani, C.; Nordström, J. How have waste management policies impacted the flow of municipal waste? An empirical analysis of 14 European countries. Waste Manag. 2023, 164, 84–93. [Google Scholar] [CrossRef] [PubMed]
- Le, T.T.; et al. Comprehensive analysis of waste-to-hydrogen technologies integrated with circular economy principles: Potential and challenges. Int. J. Hydrogen Energy 2025, 139, 1054–1087. [Google Scholar] [CrossRef]
- Avunduk, Z.B.; Kahveci, E.; Habip, E. Linking Extended Business Responsibility to Sustainable Environmental Awareness: Evidence on the Mediating Role of Environmental Values. Bus. Strat Env. 2025, 35, 6728–6744. [Google Scholar] [CrossRef]
- Dawood, H.M.; Bai, C.; Zaman, S.I.; Quayson, M.; Garcia, C. Enabling the Integration of Industry 4.0 and Sustainable Supply Chain Management in the Textile Industry: A Framework and Evaluation Approach. IEEE Trans. Eng. Manag. 2024, 71, 14704–14717. [Google Scholar] [CrossRef]
- Dong, Z.Y.; Yang, J.; Yu, L.; Daiyan, R.; Amal, R. A green hydrogen credit framework for international green hydrogen trading towards a carbon neutral future. Int. J. Hydrogen Energy 2022, 47, 728–734. [Google Scholar] [CrossRef]
- Mneimneh, F.; Ghazzawi, H.; Abu Hejjeh, M.; Manganelli, M.; Ramakrishna, S. Roadmap to Achieving Sustainable Development via Green Hydrogen. Energies 2023, 16, 1368. [Google Scholar] [CrossRef]
- Van De Graaf, T.; Overland, I.; Scholten, D.; Westphal, K. The new oil? The geopolitics and international governance of hydrogen. Energy Res. Soc. Sci. 2020, 70, 101667. [Google Scholar] [CrossRef] [PubMed]
- Gondal, I.A. Offshore renewable energy resources and their potential in a green hydrogen supply chain through power-to-gas. Sustain. Energy Fuels 2019, 3, 1468–1489. [Google Scholar] [CrossRef]
- De Jesus, A.; Antunes, P.; Santos, R.; Mendonça, S. Eco-innovation pathways to a circular economy: Envisioning priorities through a Delphi approach. J. Clean. Prod. 2019, 228, 1494–1513. [Google Scholar] [CrossRef]
- Avunduk, Z.B.; Kahveci, E.; Daim, T. What is holding back industry 4.0 in emerging economies? A SWARA analysis of key barriers. Technol. Soc. 2026, 86, 103328. [Google Scholar] [CrossRef]
- Busse, C. Doing Well by Doing Good? The Self-interest of Buying Firms and Sustainable Supply Chain Management. J. Supply Chain Manag. 2016, 52, 28–47. [Google Scholar] [CrossRef]
- Slawinski, N.; Bansal, P. Short on Time: Intertemporal Tensions in Business Sustainability. Organ. Sci. 2015, 26, 531–549. [Google Scholar] [CrossRef]
- Muhammed, S.; Zaim, H. Peer knowledge sharing and organizational performance: The role of leadership support and knowledge management success. J. Knowl. Manag. 2020, 24, 2455–2489. [Google Scholar] [CrossRef]
- Opoku, R.K.; Li, X. Sustainable management practices, operational and sustainable performance in manufacturing contexts: Empirical evidence from a developing economy. J. Responsible Prod. Consum. 2025, 2, 50–84. [Google Scholar] [CrossRef]
- Graham, S.; Cadden, T.; Treacy, R. Examining the influence of employee engagement in supporting the implementation of green supply chain management practices: A green human resource management perspective. Bus. Strat Env. 2023, 32, 4750–4766. [Google Scholar] [CrossRef]
- Alzoubi, A. Renewable Green hydrogen energy impact on sustainability performance. Int. J. CIM 2021, 1. [Google Scholar] [CrossRef]
- Naseem, M.H.; Yang, J. Role of Industry 4.0 in Supply Chains Sustainability: A Systematic Literature Review. Sustainability 2021, 13, 9544. [Google Scholar] [CrossRef]
- Boulmrharj, S.; Bakhouya, M.; Khaidar, M. Green hydrogen for public transportation fueling and street lighting electrification: Towards more sustainable Moroccan cities. Sustain. Prod. Consum. 2023, 36, 217–232. [Google Scholar] [CrossRef]
- Kahveci, E.; Akgul, A.K.; Daim, T.; Meissner, D. The Critical Mediator Role of Process Management for Effective Industry 4.0 Implementation in SMEs. IEEE Trans. Eng. Manag. 2024, 72, 1–15. [Google Scholar] [CrossRef]
- Ada, N.; Kazancoglu, Y.; Sezer, M.D.; Ede-Senturk, C.; Ozer, I.; Ram, M. Analyzing Barriers of Circular Food Supply Chains and Proposing Industry 4.0 Solutions. Sustainability 2021, 13, 6812. [Google Scholar] [CrossRef]
- Cao, L.; et al. “Biorenewable hydrogen production through biomass gasification: A review and future prospects”. Environ. Res. 2020, 186, 109547. [Google Scholar] [CrossRef] [PubMed]
- Kamilaris, A.; Fonts, A.; Prenafeta-Boldύ, F.X. The rise of blockchain technology in agriculture and food supply chains. Trends Food Sci. Technol. 2019, 91, 640–652. [Google Scholar] [CrossRef]
- Kahveci, E.; Avunduk, Z.B.; Daim, T.; Zaim, S. The role of flexibility, digitalization, and crisis response strategy for SMEs: Case of COVID-19. J. Small Bus. Manag. 2024, 1–38. [Google Scholar] [CrossRef]
- Azungah, T. Qualitative research: Deductive and inductive approaches to data analysis. Qual. Res. J. 2018, 18, 383–400. [Google Scholar] [CrossRef]
- Bryman, A. Social Research Methods; Oxford University Press: New York, NY, USA, 2022. [Google Scholar]
- Bryman, A. Integrating quantitative and qualitative research: How is it done? Qual. Res. 2006, 6, 97–113. [Google Scholar] [CrossRef]
- Bhandari, R.; Shah, R.R. Hydrogen as energy carrier: Techno-economic assessment of decentralized hydrogen production in Germany. Renew. Energy 2021, 177, 915–931. [Google Scholar] [CrossRef]
- Hafezalkotob, A. Modelling intervention policies of government in price-energy saving competition of green supply chains. Comput. Ind. Eng. 2018, 119, 247–261. [Google Scholar] [CrossRef]
- Lui, J.; Chen, W.-H.; Tsang, D.C.W.; You, S. A critical review on the principles, applications, and challenges of waste-to-hydrogen technologies. Renew. Sustain. Energy Rev. 2020, 134, 110365. [Google Scholar] [CrossRef]
- Lee, S.M.; Kim, S.T.; Choi, D. Green supply chain management and organizational performance. Ind. Manag. Data Syst. 2012, 112, 1148–1180. [Google Scholar] [CrossRef]
- Ilyas, M.; et al. Renewable energy, economic development, energy consumption and its impact on environmental quality: New evidence from South East Asian countries. Renew. Energy 2024, 223, 119961. [Google Scholar] [CrossRef]
- Gupta, H.; Kusi-Sarpong, S.; Rezaei, J. Barriers and overcoming strategies to supply chain sustainability innovation. Resour. Conserv. Recycl. 2020, 161, 104819. [Google Scholar] [CrossRef]
- MacKenzie, S.B.; Podsakoff, P.M.; Podsakoff, N.P. Construct Measurement and Validation Procedures in MIS and Behavioral Research: Integrating New and Existing Techniques1. MIS Q. 2011, 35, 293–A5. [Google Scholar] [CrossRef]
- Aguinis, H.; Hill, N.S.; Bailey, J.R. Best Practices in Data Collection and Preparation: Recommendations for Reviewers, Editors, and Authors. Organ. Res. Methods 2021, 24, 678–693. [Google Scholar] [CrossRef]
- Enders, C.K. The impact of nonnormality on full information maximum-likelihood estimation for structural equation models with missing data. Psychol. Methods 2001, 6, 352–370. [Google Scholar] [CrossRef]
- Fornell, C.; Larcker, D.F. Evaluating Structural Equation Models with Unobservable Variables and Measurement Error. J. Mark. Res. 1981, 18, 39–50. [Google Scholar] [CrossRef]
- Henseler, J.; Ringle, C.M.; Sarstedt, M. A new criterion for assessing discriminant validity in variance-based structural equation modeling. J. Acad. Mark. Sci. 2015, 43, 115–135. [Google Scholar] [CrossRef]
- Kline, R.B. Principles and Practice of Structural Equation Modeling, 5th ed.; GUILFORD: New York, NY, USA, 2023. [Google Scholar]
- Rönkkö, M.; Cho, E. An Updated Guideline for Assessing Discriminant Validity. Organ. Res. Methods 2022, 25, 6–14. [Google Scholar] [CrossRef]
- Seck, G.S.; et al. Hydrogen and the decarbonization of the energy system in europe in 2050: A detailed model-based analysis. Renew. Sustain. Energy Rev. 2022, 167, 112779. [Google Scholar] [CrossRef]
Figure 1.
Theoretical Framework.
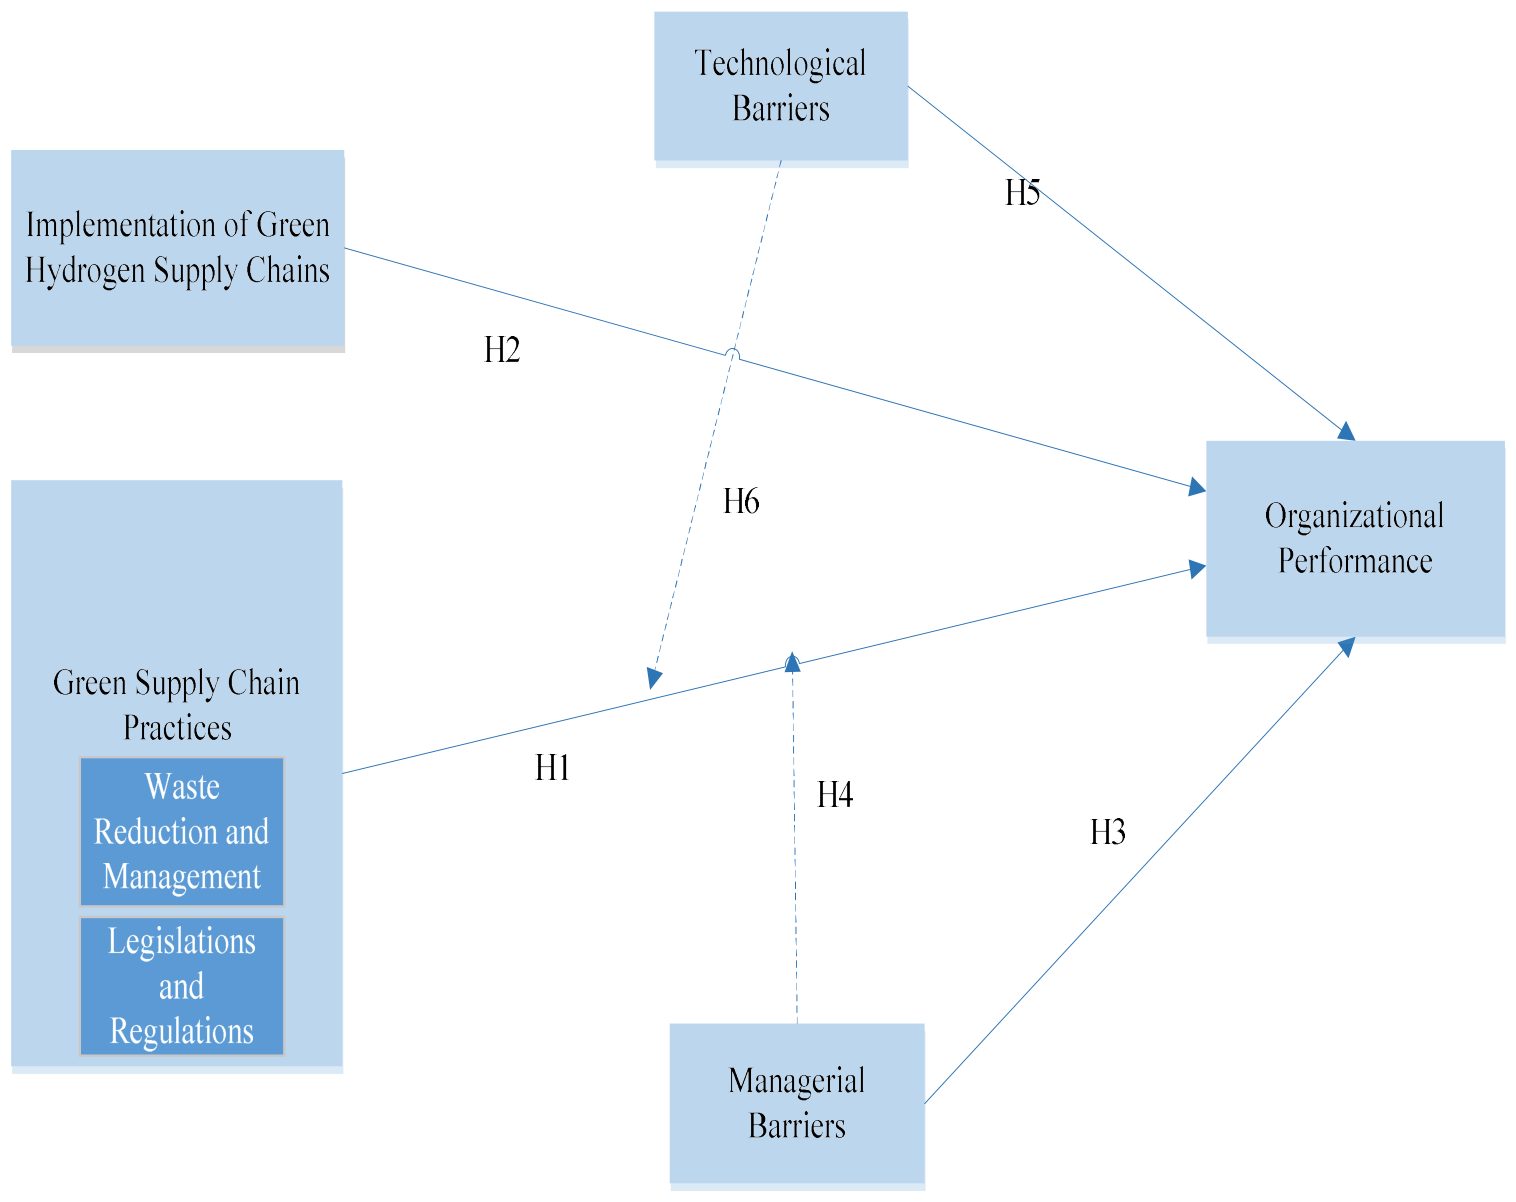
Figure 2.
Structural Model.
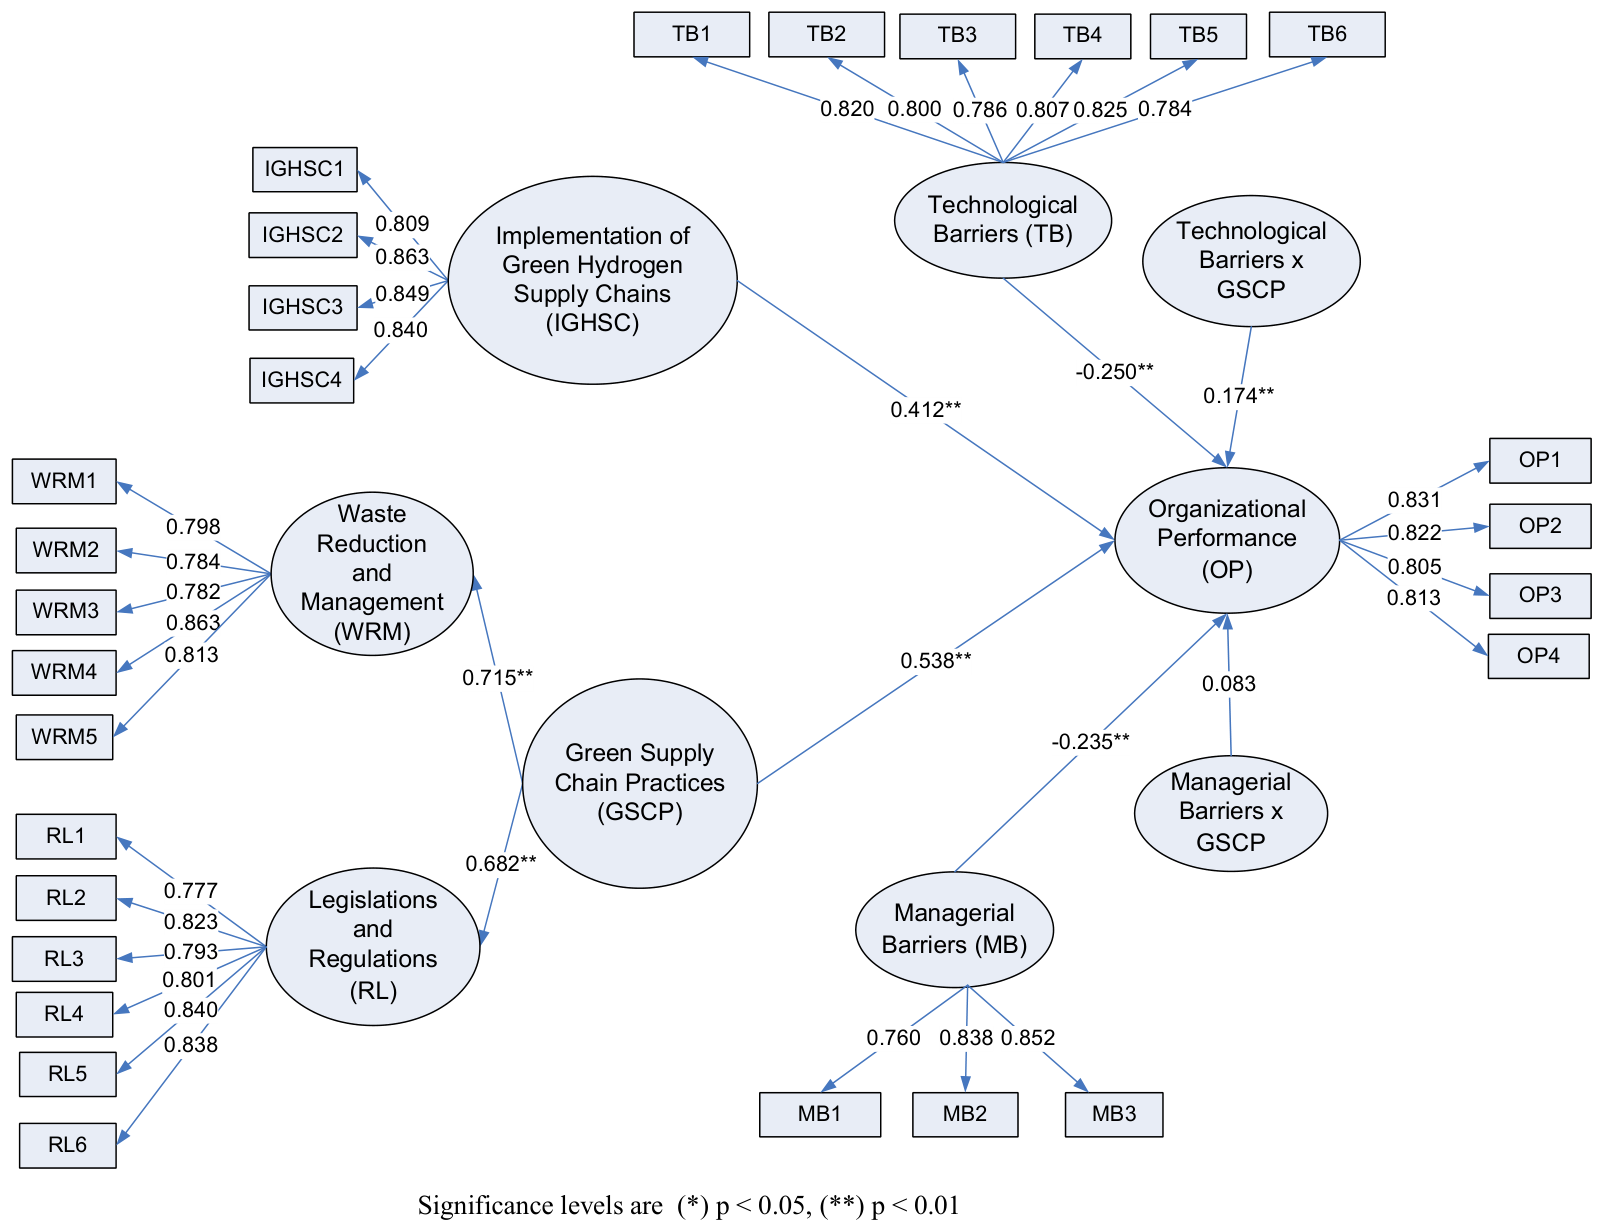

Table 1.
Reliability and Validity.
| Composite Reliability | Average Variance Extracted | Cronbach’s Alpha | |
|---|---|---|---|
| OP | 0.89 | 0.669 | 0.89 |
| IGHSC | 0.906 | 0.706 | 0.906 |
| GSCP | 0.955 | 0.657 | 0.955 |
| MB | 0.858 | 0.669 | 0.857 |
| TB | 0.916 | 0.646 | 0.916 |
OP—Organizational Performance; IGHSC—Implementation of Green Hydrogen Supply Chains; GSCP—Green Supply Chain Practices; MB—Managerial Barriers; TB—Technological Barriers.
Table 2.
Demographics Statistics.
| Age | ||
| Age Groups | Frequency | Percent |
| 25–34 years | 120 | 23.5 |
| 35–44 years | 97 | 19.0 |
| 45–54 years | 92 | 18.0 |
| 55–64 years | 90 | 17.6 |
| More than 65 years | 111 | 21.8 |
| Gender | ||
| Gender Groups | Frequency | Percent |
| Female | 242 | 47.5 |
| Male | 268 | 52.5 |
| Experience in the oil and gas industry | ||
| Experience in industry | Frequency | Percent |
| Less than 5 years | 87 | 17.1 |
| 6 to 10 years | 100 | 19.6 |
| 11 to 15 years | 114 | 22.4 |
| 16 to 20 years | 100 | 19.6 |
| More than 20 years | 109 | 21.4 |
| Experience in the current position | ||
| Experience in position | Frequency | Percent |
| Less than 5 years | 98 | 19.2 |
| 6 to 10 years | 114 | 22.4 |
| 11 to 15 years | 119 | 23.3 |
| More than 20 years | 101 | 19.8 |
| Firm Size | ||
| Firm Size | Frequency | Percent |
| Less than 200 employees | 70 | 13.7 |
| 200 to 2000 employees | 44 | 8.6 |
| 2001 to 5000 employees | 42 | 8.2 |
| 5001 to 10,000 employees | 251 | 49.2 |
| More than 10,000 employees | 103 | 20.2 |
| Firm Age | ||
| Firm Age | Frequency | Percent |
| Less than 10 years | 129 | 25.3 |
| 11 to 20 years | 134 | 26.3 |
| 21–30 years | 123 | 24.1 |
| More than 30 years | 124 | 24.3 |
| Firm Annual Sales | ||
| Firm Annual Sales | Frequency | Percent |
| Less than 10 billion USD | 106 | 20.8 |
| 10 billion to 100 billion USD | 50 | 9.8 |
| More than 100 billion USD | 354 | 69.4 |
| Firm Type | ||
| Firm Type | Frequency | Percent |
| Private | 168 | 32.9 |
| Public | 166 | 32.5 |
| Semi-Private | 176 | 34.5 |
| Number of Suppliers in the Firm | ||
| Number of Suppliers | Frequency | Percent |
| Less than 200 suppliers | 118 | 23.1 |
| 200 to 2000 suppliers | 130 | 25.5 |
| 2001 to 5000 suppliers | 127 | 24.9 |
| More than 5000 suppliers | 135 | 26.5 |
| Status of Implementation of Green Hydrogen Supply Chains | ||
| Status | Frequency | Percent |
| It is starting to think of using green hydrogen | 109 | 21.4 |
| It is midway in their journey of applying and using green hydrogen | 354 | 69.4 |
| It is advanced in using green hydrogen | 47 | 9.2 |
| Total | 510 | 100.0 |
Table 3.
Descriptive Analysis.
| N | Minimum | Maximum | Mean | Std. Deviation | |
| OP1 | 510 | 1.00 | 7.00 | 4.9059 | 1.57303 |
| OP2 | 510 | 1.00 | 7.00 | 4.9020 | 1.62078 |
| OP3 | 510 | 1.00 | 7.00 | 4.9431 | 1.59157 |
| OP4 | 510 | 1.00 | 7.00 | 4.9706 | 1.58118 |
| IGHSC1 | 510 | 1.00 | 7.00 | 4.7882 | 1.66031 |
| IGHSC2 | 510 | 1.00 | 7.00 | 4.8392 | 1.61210 |
| IGHSC3 | 510 | 1.00 | 7.00 | 4.8059 | 1.67484 |
| IGHSC4 | 510 | 1.00 | 7.00 | 4.8784 | 1.57364 |
| GSCP_RL1 | 510 | 1.00 | 7.00 | 4.7078 | 1.62705 |
| GSCP_RL2 | 510 | 1.00 | 7.00 | 4.8000 | 1.61501 |
| GSCP_RL3 | 510 | 1.00 | 7.00 | 4.8176 | 1.64182 |
| GSCP_RL4 | 510 | 1.00 | 7.00 | 4.8843 | 1.58218 |
| GSCP_RL5 | 510 | 1.00 | 7.00 | 4.7373 | 1.61695 |
| GSCP_RL6 | 510 | 1.00 | 7.00 | 4.8529 | 1.65489 |
| GSCP_WRM1 | 510 | 1.00 | 7.00 | 4.7529 | 1.75228 |
| GSCP_WRM2 | 510 | 1.00 | 7.00 | 4.7490 | 1.69239 |
| GSCP_WRM3 | 510 | 1.00 | 7.00 | 4.7902 | 1.64809 |
| GSCP_WRM4 | 510 | 1.00 | 7.00 | 4.7804 | 1.62942 |
| GSCP_WRM5 | 510 | 1.00 | 7.00 | 4.8294 | 1.69604 |
| MB1 | 510 | 1.00 | 7.00 | 3.3412 | 1.80951 |
| MB2 | 510 | 1.00 | 7.00 | 3.2882 | 1.79424 |
| MB3 | 510 | 1.00 | 7.00 | 3.2176 | 1.75786 |
| TB1 | 510 | 1.00 | 7.00 | 3.2235 | 1.75320 |
| TB2 | 510 | 1.00 | 7.00 | 3.1216 | 1.62039 |
| TB3 | 510 | 1.00 | 7.00 | 3.2725 | 1.69195 |
| TB4 | 510 | 1.00 | 7.00 | 3.1588 | 1.73722 |
| TB5 | 510 | 1.00 | 7.00 | 3.1706 | 1.70182 |
| TB6 | 510 | 1.00 | 7.00 | 3.2137 | 1.75498 |
OP—Organizational Performance; IGHSC—Implementation of Green Hydrogen Supply Chains; GSCP_RL—Green Supply Chain Practices_Regulations and Legislations; GSCP_WRM—Green Supply Chain Practices_Waste Reduction and Management; MB—Managerial Barriers; TB—Technological Barriers.
Table 4.
Model Fit Values.
| OP | IGHSC | RL | WRM | MB | TB | |
|---|---|---|---|---|---|---|
| OP1 | 0.831 | |||||
| OP2 | 0.822 | |||||
| OP3 | 0.805 | |||||
| OP4 | 0.813 | |||||
| IGHSC1 | 0.809 | |||||
| IGHSC2 | 0.863 | |||||
| IGHSC3 | 0.849 | |||||
| IGHSC4 | 0.840 | |||||
| GSCP_RL1 | 0.777 | |||||
| GSCP_RL2 | 0.823 | |||||
| GSCP_RL3 | 0.793 | |||||
| GSCP_RL4 | 0.801 | |||||
| GSCP_RL5 | 0.840 | |||||
| GSCP_RL6 | 0.838 | |||||
| GSCP_WRM1 | 0.798 | |||||
| GSCP_WRM2 | 0.784 | |||||
| GSCP_WRM3 | 0.782 | |||||
| GSCP_WRM4 | 0.863 | |||||
| GSCP_WRM5 | 0.813 | |||||
| MB1 | 0.760 | |||||
| MB2 | 0.838 | |||||
| MB3 | 0.852 | |||||
| TB1 | 0.820 | |||||
| TB2 | 0.800 | |||||
| TB3 | 0.786 | |||||
| TB4 | 0.807 | |||||
| TB5 | 0.825 | |||||
| TB6 | 0.784 | |||||
| CMIN/DF | 2.733 (<5) | |||||
| GFI | 0.910 (≥0.9) | |||||
| RMSEA | 0.058 (<0.08) | |||||
| NFI | 0.924 (>0.9) | |||||
| RFI | 0.912 (>0.9) | |||||
| TLI | 0.942 (>0.9) | |||||
| CFI | 0.950 (>0.9) | |||||
OP—Organizational Performance; IGHSC—Implementation of Green Hydrogen Supply Chains; GSCP_RL—Green Supply Chain Practices_Regulations and Legislations; GSCP_WRM—Green Supply Chain Practices_Waste Reduction and Management; MB—Managerial Barriers; TB—Technological Barriers. Note: Values in Italics are threshold values of the modification indices.
Table 5.
HTMT values.
| IGHSC | MB | OP | RL | TB | WRM | MB × WRM | MB × RL | TB × WRM | |
|---|---|---|---|---|---|---|---|---|---|
| MB | 0.664 | ||||||||
| OP | 0.884 | 0.756 | |||||||
| RL | 0.749 | 0.653 | 0.872 | ||||||
| TB | 0.711 | 0.588 | 0.812 | 0.705 | |||||
| WRM | 0.685 | 0.543 | 0.757 | 0.645 | 0.645 | ||||
| MB × WRM | 0.470 | 0.445 | 0.534 | 0.458 | 0.432 | 0.371 | |||
| MB × RL | 0.499 | 0.526 | 0.584 | 0.513 | 0.478 | 0.436 | 0.723 | ||
| TB × WRM | 0.556 | 0.411 | 0.629 | 0.504 | 0.581 | 0.491 | 0.571 | 0.369 | |
| TB × RL | 0.605 | 0.484 | 0.673 | 0.581 | 0.590 | 0.511 | 0.415 | 0.604 | 0.667 |
Table 6.
Hypothesis Testing.
| Hypothesis | Structural Path | Estimate | p | 95% Bias-Corrected CI | Decision |
|---|---|---|---|---|---|
| H1 | GSCP → OP (green supply chain practices → Organizational Performance) | 0.538 | p < 0.001 | [0.411, 0.675] | Accepted |
| H2 | IGHSC → OP (implementation of GHSC → Organizational Performance) | 0.412 | p < 0.001 | [0.278, 0.566] | Accepted |
| H3 | MB → OP (Managerial Barriers → Organizational Performance) | −0.235 | p < 0.001 | [−0.343, −0.153] | Accepted |
| H4 | MB (moderator) → OP (interaction effect of Managerial Barriers on GSCP → OP) | 0.083 | p = 0.099 | [−0.016, 0.215] | Rejected (not significant) |
| H5 | TB → OP (Technological Barriers → Organizational Performance) | −0.250 | p < 0.001 | [−0.364, −0.155] | Accepted |
| H6 | TB (moderator) → OP (interaction effect of Technological Barriers on GSCP → OP) | 0.174 | p = 0.003 | [0.058, 0.315] | Accepted |
Disclaimer/Publisher’s Note: The statements, opinions and data contained in all publications are solely those of the individual author(s) and contributor(s) and not of MDPI and/or the editor(s). MDPI and/or the editor(s) disclaim responsibility for any injury to people or property resulting from any ideas, methods, instructions or products referred to in the content. |
© 2026 by the authors. Licensee MDPI, Basel, Switzerland. This article is an open access article distributed under the terms and conditions of the Creative Commons Attribution (CC BY) license (http://creativecommons.org/licenses/by/4.0/).
Copyright: This open access article is published under a Creative Commons CC BY 4.0 license, which permit the free download, distribution, and reuse, provided that the author and preprint are cited in any reuse.