

Submitted:
10 November 2026
Posted:
11 November 2026
You are already at the latest version
Abstract
Literature reviews are among the most read and cited scholarly publications, yet most draw on one or two databases, privilege the most-cited voices and report conclusions without testing whether they depend on the choice of sources. Reporting guidelines secure transparency of searching and selection but do not prescribe how to balance academic, practice, policy and emerging evidence, or how to measure the robustness of conclusions. We present 360° MDL, the Multidimensional Literature Review Model, developed with a design-science approach and released with an open toolkit and a 30-item reporting checklist. It combines five evidence stream families, a three-gate selection process with a six-criterion quality gate and portfolio rules, eight analysis matrices, and indices of stream balance, coverage, method diversity and resilience; each key finding is graded by its Triangulation Strength across stream families and stress-tested by leaving one family out. Two applied reviews, in clinical artificial intelligence and in genetic cardiomyopathy, demonstrate it: non-database streams supplied 60–64% of the core corpora, most key findings were robust across three or more families, and a database-only design would have missed two to three findings per review. 360° MDL complements PRISMA and offers authors, editors and assessors an auditable route from evidence volume to tested synthesis.
Keywords:
literature review
; review methodology
; evidence synthesis
; grey literature
; triangulation
; citation bias
; research assessment
; reporting guideline
; design science
; responsible AI
1. Introduction
Literature reviews have become one of the most influential forms of scholarly output. They define fields, guide doctoral training, inform clinical and policy decisions, and attract a disproportionate share of citations [1,2,3]. Their production has also grown faster than their quality: redundant, misleading and conflicted reviews are common [4], avoidable waste in the production and reporting of research evidence is well documented [5], and the arrival of large language models lowers the cost of producing review-like texts even further [6,7,8]. For scholarly communication, this creates a double problem: reviews are among the most read and cited publication genres, yet readers, editors and research assessors have few instruments for judging how balanced a review’s evidence base is and how robust its conclusions are. Methodological guidance has responded mainly by standardising reporting. PRISMA 2020 specifies what a systematic review should report about its searches, selection and synthesis [9], PRISMA-S extends this to literature searching [10], and PRISMA-ScR and JBI guidance do the same for scoping reviews [11,12]. Tools such as AMSTAR 2 and ROBIS appraise the conduct of systematic reviews [13,14], and GRADE and GRADE-CERQual rate the certainty or confidence of synthesised findings [15,16].
Three problems remain insufficiently addressed by this guidance, especially for the many reviews that are not meta-analyses of interventions: narrative, integrative, state-of-the-art and mixed-evidence reviews in fast-moving, socio-technical or translational fields.
First, single-source dependence. Most reviews search one or two bibliographic databases. Web of Science and Scopus differ substantially in journal, disciplinary and language coverage [17,18,19], large-scale comparisons show that no single bibliographic source is complete [20,21], and search systems differ in retrieval quality [22,23]. Practice and policy knowledge (industry reports, guidelines, regulatory documents, patient-organisation surveys) lies mostly outside bibliographic databases [24,25,26], and its omission can bias conclusions [27]. Multivocal literature reviews add grey literature [28,29], and guidance exists for searching it [30], but neither prescribes how much of it a corpus should contain or how its evidence should be weighed against academic sources.
Second, citation-driven bias. Selecting by citation counts amplifies the Matthew effect [31], which is intensifying at global scale [32], and the tendency of citations to favour positive results [33]. It under-represents recent, critical and null studies, non-English and Global South scholarship [34,35,36,37] and under-cited groups [38], and it confuses visibility with quality, against the principles of responsible metrics [39,40,41].
Third, untested conclusions. Reviews rarely test whether their conclusions would survive a different choice of sources. In aetiological epidemiology, triangulating evidence from approaches with different, unrelated biases is an established route to robust inference [42,43], and in quantitative research the sensitivity of conclusions to analytic choices is increasingly made explicit through multiverse and many-analyst designs [44,45,46]. This logic has not been operationalised for the sources of a literature review. A review whose key finding rests only on industry reports, or only on one research group, is less robust than one whose finding is echoed by academic, practice, policy and critical sources. The reader, however, usually cannot tell the difference.
This article presents 360° MDL, the Multidimensional Literature Review Model, a review methodology designed to address these three problems while remaining compatible with PRISMA reporting [47]. Its central idea is that a literature review should be built and tested like a portfolio of independent evidence streams. Sources are harvested in five stream families. Items are selected through quality and portfolio gates, analysed along several matrices, and synthesised into key findings whose robustness is measured by how many independent stream families support them. The methodology ends in interpretation and an evidence-traced value framework, not in paper-by-paper summaries.
We make three contributions. (1) We specify the methodology, including its decision rules, matrices and indices, precisely enough to be reproduced and audited, and we release it with an open toolkit and a reporting checklist. (2) We demonstrate it in two complete applied reviews in contrasting fields, clinical artificial intelligence and the genetics of arrhythmic risk in dilated cardiomyopathy, with open data, filled toolkits and a tool-by-tool application report. (3) We evaluate the methodology against explicit design requirements, including a counterfactual analysis of what the same reviews would have concluded with fewer stream families. The article is written for the scholarly-communication community: review authors, journal editors and reviewers, research assessors and doctoral educators who need auditable criteria for the evidence base of a review. Section 4, Section 5 and Section 6 report the results of the design, demonstration and evaluation activities of a design-science study; Section 7 discusses them.
2. Background and Design Requirements
2.1. Review Approaches and What They Provide by Design
Review typologies distinguish between more than a dozen review types, from systematic reviews and meta-analyses to scoping, integrative, critical, state-of-the-art and umbrella reviews [48,49]. Management and information-systems scholars have proposed guidelines for writing and evaluating reviews [1,2,3,50,51,52], and literature search and sample selection in these fields have been shown to be frequent weaknesses [53,54]. Table 1 compares the main families of review guidance on nine design dimensions. The comparison concerns what each approach prescribes by design; competent review teams can add any feature to any approach.
Two observations follow from Table 1. Systematic reviews with GRADE assess the certainty of effect estimates, which depends on risk of bias, inconsistency, indirectness, imprecision and publication bias [15]. They do not assess whether a qualitative or mixed-evidence conclusion depends on the type of source it was drawn from. Multivocal reviews include grey literature [29], but they leave its share and weight to the reviewer. No approach in Table 1 combines source balance, portfolio composition and a robustness test of conclusions.
2.2. Design Requirements
3. Materials and Methods
3.1. Design-Science Approach
360° MDL was developed following the design-science research methodology of Peffers et al. [57] and the guidelines of Hevner et al. [56]. The process had six activities:
- Problem identification: the three problems described in Section 1.
- Objectives: design requirements DR1–DR7 (Section 2.2).
- Demonstration: two complete applied reviews (Section 5).
- Evaluation: a requirement-by-requirement assessment, a cross-case comparison and a counterfactual stream analysis (Section 6).
- Communication: this article, with open data and toolkits [61].
The methodology draws on the author’s experience of more than two decades of editing, reviewing and writing literature reviews in information systems and related fields.
3.2. Demonstration Cases
We selected two topics that differ on the dimensions that matter most for a review methodology:
- Case A, clinical artificial intelligence in healthcare. A fast-moving socio-technical field in which academic evidence, industry deployment and regulation evolve in parallel, and in which practice and policy sources are abundant.
- Case B, arrhythmic risk in dilated cardiomyopathy (DCM) according to the genetic substrate. A specialised clinical field dominated by registries, risk models and guidelines, with a tightly connected international research community and few practice sources.
Both reviews were conducted at the Standard tier in Mode 360 (all three source approaches) in October 2026, each by a single reviewer assisted by generative AI under the Two-Key Rule (Section 4.8). Both are complete review manuscripts with figures and appendices (Supplementary Materials, Files S1 and S2). For Case B, a tool-by-tool application report and a filled toolkit document every intermediate decision (Files S3 and S4).
3.3. Evaluation Design
The evaluation had three parts:
- Requirement fulfilment. For each design requirement, we recorded the observable evidence in both cases.
- Cross-case comparison. We compared corpus composition, gate outcomes and indices between the cases.
- Counterfactual stream analysis. We recomputed each key finding’s Triangulation Strength using only the stream families that a less comprehensive design would have retained: database only (F1); academic only (F1 + F2); without grey literature; and without emerging voices. Items, coding and key findings were held constant.
Because Triangulation Strength is defined over stream families, part of this counterfactual is true by construction: a single-stream review cannot reach a Triangulation Strength above 1. We therefore focus on the non-trivial outcomes: key findings that would be absent entirely, divergences that would be undetectable, and the distribution of robustness across families.
3.4. Ethics and Use of Generative AI
The study used published literature and publicly available documents only. No human participants or personal data were involved, and ethical approval was not required. During the two applied reviews, the author used generative AI (Claude, Anthropic; October 2026) for source discovery and verification, first-pass extraction from abstracts and official pages, provisional 6R scoring and coding, figure production and drafting, under the Two-Key Rule described in Section 4.8; for this article, it was used for language editing and for checking the consistency of numbers against the data files. Every source was confirmed on an opened page, and all codes and interpretations were reviewed by the author, who takes full responsibility for the content.
4. Results I: The 360° MDL Methodology
4.1. Overview
360° MDL rests on seven pillars: (1) multi-stream triangulation; (2) value over volume; (3) CCD curation (Complementarity, Coverage, Diversity); (4) multidimensional analysis; (5) interpretation and value creation; (6) resilience; and (7) transparency and responsible practice, including disclosed and verified use of AI. A review qualifies as a 360° MDL review only if it meets the 3 × 3 Rule: at least three source streams and at least three analysis matrices. Three configurations serve different users: Lite (doctoral chapters; 20–30 core items), Standard (journal reviews; 40–50 core items, all indices) and Advanced (flagship and policy reviews; registered protocol, inter-coder reliability and the Leave-One-Stream-Out test). Figure 1 summarises the model.
4.2. The Seven-Phase Cycle
The review proceeds through seven phases:
- P1 Frame: Review Canvas and protocol, with review questions, scope, tier and mode, streams and slices, preliminary keyword clusters, eligibility criteria and the matrices to be used.
- P2 Source: multi-stream harvesting, with every query logged in a Stream Log.
- P3 Select: the Three Gates.
- P4 Codify: traceable IDs and a Master Table.
- P5 Analyse: matrices M1–M6.
- P6 Synthesise & Interpret: cross-matrix synthesis, the Triangulation and Resilience test, and matrices M7–M8.
- P7 Report & Renew: the MDL-RC 2026 checklist, a flow diagram, open matrices and a living-update plan.
Each phase has a template in the toolkit (T1–T18).
4.3. Multi-Stream Sourcing
Sources are organised in three approaches and five stream families, the unit of triangulation (Figure 2):
- F1 Academic databases (Approach A). Web of Science, Scopus, Google Scholar and discipline databases, each searched in up to three slices: Impact (most-cited), Recency (latest two years) and Frontier (special issues and emerging topics).
- F2 Influencer scholarship (Approach B). Leading scientists identified from public ranking signals (e.g., Clarivate Highly Cited Researchers, standardised citation indicators). One or two papers per scientist are taken: the most-cited and the most recent on the topic. Rankings serve as discovery tools, not quality verdicts, in line with responsible-metrics principles [39,40]; field-normalised indicators are preferred to raw counts [41,62].
- F3 Industry and practice (A4) and F4 Policy and global organisations (A5). White papers, practice reports, guidelines and policy documents with a stated method.
- F5 Emerging and diverse voices (Approach C). A counterbalancing stream with five sub-streams: rising papers, Global South and under-represented regions, regional and non-English scholarship, preprints and conference papers, and critical, dissenting or null-result studies. Approach C directly targets the biases described by Merton [31], Duyx et al. [33] and Abimbola [34].
Three modes combine the approaches: Mode H (A + minimum C), Mode I (B + minimum C) and Mode 360 (A + B + C).
4.4. Selection Through Three Gates
Figure 3 shows the selection funnel.
Gate 1, Eligibility. Explicit inclusion and exclusion criteria are applied, and duplicates across streams are removed. A work found in two or more streams receives a Convergence Flag, a signal of centrality that is reported but, as Section 6 shows, must also be interpreted as a possible signal of non-independence.
Gate 2, the 6R Quality Gate. Every item is scored from 0 to 2 on six criteria:
- R1 Relevance: fit with the review questions.
- R2 Rigour: methodological soundness; for grey literature, the AACODS checklist (authority, accuracy, coverage, objectivity, date, significance) [58].
- R3 Reach: field-normalised impact, or institutional uptake for grey literature.
- R4 Recency: timeliness within the review window.
- R5 Richness: depth and originality of the contribution.
- R6 Representativeness: the perspective, method, region or stream that the item adds.
Items pass if R1 ≥ 1, R2 ≥ 1 and the total is ≥ 7 (out of 12). Items with a total of 5–6 are held in reserve, and all others are excluded. A second reviewer scores a 20% sample, with a target Cohen’s κ ≥ 0.70.
Gate 3, CCD Curation. Passing items are composed into a core corpus of at most 50 items as a portfolio:
- Complementarity: every core item must add something unique.
- Coverage: every keyword cluster must have at least three core items.
- Diversity: no stream family may exceed 40% of the core; grey literature (F3 + F4) must make up 10–30%; F5 must make up at least 10% (Advanced: 15%); no lead author may contribute more than three items; and at least three method families must be represented.
Redundant passing items are moved to an Extended Evidence Pool, which is used for sensitivity checks and living updates. The outcome is reported in a flow diagram compatible with PRISMA 2020, with counts per stream family and per gate [9].
4.5. Codification and Multidimensional Analysis
Each item receives an ID of the form [STREAM]-[SLICE]-[NN], such as SCO-REC-03 (Scopus-indexed, Recency slice, item 3) or EMV-CRI-02 (emerging voices, critical sub-stream). The ID links the item across all matrices, the triangulation matrix and the reference list. Six core matrices are then completed (Figure 4):
- M1 General: topics, approach, method, key findings, contribution and significance.
- M2 Methodology: one of nine method families, with data source, sample and analysis.
- M3 Contribution & Impact: an eight-type contribution taxonomy, CT1 Theoretical to CT8 Societal/Educational, and the impact locus.
- M4 Topics/Keywords Coverage: keywords unified into at most ten clusters, each item mapped to at most eight clusters.
- M5 Research Questions: explicit and implicit research questions, grouped into families (what, why, how, what-if, should).
- M6 Open Research Issues: future research and limitations, clustered into a research agenda.
4.6. Triangulation, Resilience and Indices
Cross-matrix synthesis produces key findings (KF1…KFn), each linked to the IDs of its supporting core items. The Triangulation Strength (TS) of a finding is the number of distinct stream families (1–5) represented among its supporting items. A work found in two streams counts once, in the stream where it was retained. A finding is Robust if TS ≥ 3, Supported if TS = 2 and Tentative if TS = 1. The rationale follows triangulation in epidemiology [42,43]: academic, practice, policy and critical sources are subject to different and partly unrelated biases, so agreement across them is more informative than agreement within one of them.
Table 3 defines the seven indices. They summarise properties of the corpus (balance, coverage, method diversity) and of the conclusions (resilience, stability). Formal definitions and a worked example are given in Appendix A.
4.7. Interpretation and Value Creation
Synthesis ends in two generative matrices. M7 Interpretation & Exploitation records what each finding means and how it can be used: as a benchmark, design guideline, policy instrument, curriculum, managerial toolkit, standard or research agenda. M8 Value-Based Framework arranges the interpretations on a six-layer Input–Process–Output canvas (Enablers → Capabilities → Processes → Outcomes → Value → Measures) for the review’s stakeholder groups. Every cell must be traceable to at least one key finding and, through it, to identified core items. This rule distinguishes an evidence-traced framework from a conceptual one.
4.8 Reporting, Living Updates and Responsible AI
Reviews are reported with the 30-item MDL-RC 2026 checklist (Appendix B), which covers the title and abstract, protocol, sourcing, selection, codification, analysis, synthesis and transparency. It is accompanied by the flow diagram, an index dashboard, open matrices and an AI-use statement. Living updates re-run the Recency and Frontier slices every 12–24 months and version the review [59].
Generative AI may assist with search-string ideation, de-duplication, first-pass extraction, clustering suggestions, translation and drafting, subject to the Two-Key Rule: every AI-produced entry is verified by a human against the source, no item is included that was not retrieved and checked, AI cannot assign 6R scores without human confirmation, and tools and tasks are disclosed. This responds to evidence that large language models can draft search strings and support screening but are not yet reliable substitutes for human reviewers [6,7,64,65], and to the position of major journals that AI tools cannot take responsibility for content [66,67].
5. Results II: Demonstration in Two Applied Reviews
5.1. Case A: Clinical Artificial Intelligence in Healthcare
Case A asked four questions: what is known about the clinical value of AI, why translation into routine care lags, how clinical AI should be governed, and what value and risks generative AI brings (S1). The five streams yielded 79 records (74 unique). Five works were found in two streams, 72 items passed the 6R gate, one was placed in reserve and one was excluded. CCD curation produced a core corpus of 50 items: F1 36%, F2 20%, F3 10%, F4 16% and F5 18%. The indices were SBI 0.95, CovI 1.00, MDI 0.66, RI 0.85 and LOSO 0.85.
Ten of 13 key findings were Robust, two Supported and one Tentative. Robust findings included the following:
- AI matches specialists on retrospective imaging tasks, while evidence of patient-relevant benefit remains thin.
- Performance and fairness degrade across sites.
- Human–AI collaboration is not automatically additive.
- Benchmark strength of large language models has not yet translated into better decisions by real users.
- Generative AI adoption outpaces institutional governance.
The M4 cross-matrix exposed three structural gaps: no industry evidence on diagnostic performance or validation, no influencer scholarship on economic value, and a weak academic voice on regulation. The academic–practice–policy comparison revealed one divergence. Influential scholars argued that post-hoc explainability offers false comfort, whereas a global policy body lists explainability among its core principles. It also revealed one silence: no independent economic evaluation (the Tentative finding rested on industry sources alone). The review ended in an evidence-traced Clinical AI Value Chain with five testable propositions.
5.2. Case B: Arrhythmic Risk in Genetic Dilated Cardiomyopathy
Case B asked which genotypes confer high arrhythmic risk, which markers and modifiers shape that risk, how well risk tools perform, and which emerging approaches and gaps matter (S2). The streams yielded 81 records (64 unique). Seventeen works were found in two streams, 62 items passed and two were held in reserve. The core corpus of 45 items comprised F1 40%, F2 11%, F3 11%, F4 18% and F5 20%. The indices were SBI 0.92, CovI 1.00, MDI 0.35, RI 0.75 and LOSO 0.64. Eight of 14 key findings were Robust, five Supported and one Tentative. Robust findings included the following:
- A defined set of arrhythmic genotypes carries a two- to three-fold higher risk of malignant arrhythmia, largely independent of ejection fraction.
- Gene-specific risk calculators discriminate well internally but over-predict risk on external validation.
- Late gadolinium enhancement adds independent information that most calculators omit.
- Genotype-guided care depends on curated gene validity and on access to testing.
The review ended in a Genotype-Integrated Arrhythmic Risk Pathway with five propositions. Its application report documents every tool with the real data (S3), and the filled toolkit reproduces all indices with live formulas (S4).
5.3. Cross-Case Comparison
Table 4 and Figure 5 compare the two cases. Although the topics differ greatly, the methodology produced corpora of similar size and balance (SBI 0.95 and 0.92) with complete cluster coverage. In both cases, 60–64% of core items came from non-database streams. The cases differed in three diagnostic respects, discussed in Section 6: method diversity, convergence and stability.
6. Results III: Evaluation
6.1. Fulfilment of the Design Requirements
Table 5 summarises the evidence for each design requirement.
6.2. What a Narrower Design Would Have Concluded
Figure 5C and Appendix D report the counterfactual stream analysis. Three results stand out.
Findings would be absent, not merely weaker. A database-only review of the same questions, with the same items and coding, would not contain three of the 13 key findings of Case A at all. These are the adoption–governance gap, the role of evidence and accountability in trust, and the absence of independent economic evaluation. It would also miss two of the 14 key findings of Case B: the dependence of genotype-guided care on gene validity and access, and the ancestry gap in the evidence base. Each of these findings was supported only by influencer, practice, policy or emerging-voice items. An academic-only design (F1 + F2) would still miss one finding in each case.
Robustness concentrates where the streams agree. With academic sources only, no finding in either case reaches TS ≥ 3, and the Resilience Index falls to 0.27 (Case A) and 0.18 (Case B). Removing grey literature lowers it to 0.69 and 0.46, and removing emerging voices to 0.77 and 0.46. These reductions follow partly from the definition of Triangulation Strength. Their distribution, however, is informative: Case B is much more sensitive to the loss of F5 than Case A. Without the critical, regional and population studies of F5, the review could not have shown that penetrance is low in population carriers or that evidence for non-European ancestries is thin, and the registry-based challenge to the calculator’s predictors (sex, variant type) would have been lost.
Divergences require several streams. Both divergences in Table 4 arise between families. In Case A, influential scholars and a global policy body disagree on explainability. In Case B, a gene-specific calculator and national registries disagree on the predictive role of sex and variant type. A single-stream review would have reported one side of each disagreement as settled.
6.3. What the Indices Revealed About the Fields
The indices did more than certify quality; they diagnosed the evidence base of each field.
- Method diversity as a field-level finding. Case B’s MDI of 0.35 fell below target although all CCD rules were met. Every eligible item was an observational cohort, a guideline or consensus document, a model or an AI artefact. There were no qualitative or mixed-methods studies, and no randomised trial of genotype-guided defibrillator implantation. The review reported this as a gap in the field rather than admitting weaker items to raise the index.
- Convergence as a network signal. Case B’s Convergence Rate (31%) was three times that of Case A (10%). Nine of 14 influencer papers had also been retrieved as academic landmarks, and many core items share authors from one international network. Convergence therefore partly indicates collaboration rather than independent confirmation. 360° MDL handles this by counting each work once in triangulation and by reporting convergence separately.
- Stability as a map of dependence. LOSO located the fragility of Case B in two families (F1 and F5), whereas Case A remained stable (0.85) whichever family was removed.
6.4. Traceability: One Finding from Source to Framework
Table 6 traces one Robust finding of Case B through every tool, illustrating the auditable chain that the methodology requires. The finding states that external validation exposes over-prediction and limited transportability of gene-specific risk calculators (KF6). Its three supporting items come from three families. One of them, the Nordic external validation of the LMNA calculator, was found independently in the academic and the critical sub-stream and carries a Convergence Flag; it counts once, in F1. The national registry from Spain (F5) contributes the divergent predictors, and a Heart Failure Association scientific statement (F4) contributes the methodological prerequisites for future scores. The finding is then interpreted as a validation protocol (M7) and appears in two cells of the value framework (M8).
6.5. Feasibility
Each demonstration was completed in one working cycle by a single reviewer with AI assistance, harvesting 79–81 records through 129–147 logged queries. Both reviews also exposed practical constraints. Web of Science and Scopus could not be queried directly from the review environment, so the database streams were filled by targeted, verified discovery of indexed articles, and database hit counts remain to be added. Several publisher pages had to be verified through repository or institutional mirrors. Neither application is a benchmark of effort; the specification’s indicative effort for a Standard review with a second coder is 30–50 person-days.
7. Discussion
7.1. Principal Contributions
360° MDL extends review methodology in three directions. First, it treats the sources of a review as a design variable to be balanced, not a convenience to be accepted. Stream families, quotas and portfolio rules make the composition of the evidence explicit and auditable. Second, it introduces a source-based robustness test for review conclusions. GRADE and CERQual ask how confident we can be in an effect estimate or a qualitative finding given the studies that support it [15,16]. 360° MDL asks a complementary question: would the conclusion survive if one kind of source were removed? The two perspectives can be combined, for example by reporting GRADE certainty for intervention effects and Triangulation Strength for mixed-evidence findings. Third, it closes the review with an evidence-traced framework, so that every element of the proposed model can be traced back to identified items.
7.2. Relation to Existing Guidance
360° MDL is not a substitute for PRISMA 2020. It is a methodology for conducting reviews with its own reporting checklist and a PRISMA-compatible flow diagram, and reviews may report against both [9,10]. Systematic reviews of interventions should continue to follow Cochrane methods [55]. 360° MDL is most useful for state-of-the-art, integrative, translational and policy-relevant reviews in which practice, policy and emerging evidence matter, and for doctoral reviews, through its Lite tier. Its grey-literature practice builds on multivocal reviews [29] and on guidance for grey literature in management studies [24], and adds quotas, a common quality gate and the robustness test.
7.3. Implications for Scholarly Communication and Research Assessment
Review authors obtain a reproducible route from volume to value: a bounded core corpus, matrices that make synthesis comparable, and indices that show readers where conclusions are strong or fragile.
- Editors and reviewers can audit a submitted review with the MDL-RC 2026 checklist and the index dashboard, asking for Triangulation Strength and LOSO when conclusions are contested.
- Doctoral educators can teach the Lite tier as a structured alternative to unguided narrative reviews; an open playbook for doctoral researchers already operationalises it [60].
7.4. When 360° MDL Is Not the Right Choice
360° MDL is not designed to estimate pooled intervention effects; such questions require a systematic review with meta-analysis and certainty assessment [15,55], although the 360° MDL streams can be used to frame or contextualise them. For very narrow questions with no practice or policy evidence, the grey-literature quota cannot be met meaningfully, and Mode H or I with a reduced stream set (Lite tier) is more appropriate. Where grey literature is dominated by commercial interests, the AACODS-based rigour score and the 30% cap limit, but do not eliminate, its influence; such reviews should report the share of industry-sponsored items explicitly. Finally, the methodology’s bounded core corpus (≤ 50 items) favours depth and balance over exhaustiveness; reviews whose purpose is a complete census of a literature, such as mapping studies, should use the Extended Evidence Pool or a bibliometric design.
7.5. Limitations
This study has important limitations:
- Self-evaluation. The methodology was designed, applied and evaluated by its originator. The demonstrations show that it can be applied and what it reveals; they do not show that independent teams obtain the same results. Inter-team reproducibility is untested, and the present evaluation should be read as the first cycle of a design-science programme rather than as validation.
- Inter-coder reliability. Both applied reviews were scored by a single reviewer with AI assistance. The 6R gate’s inter-rater reliability has not yet been measured, and both drafts list second-coder calibration as an open item.
- Partly tautological counterfactual. Triangulation Strength depends on the number of families by definition, so reductions under narrower designs are partly expected. We therefore emphasise absent findings and undetectable divergences, which do not follow from the definition.
- Non-independent families. Stream families are not fully independent. Case B shows that influencer and academic streams can draw on the same research network. Counting each work once mitigates, but does not remove, this dependence.
- Heuristic thresholds. The index targets (e.g., SBI ≥ 0.70, RI ≥ 0.60) are reasoned defaults, not empirically calibrated cut-offs.
- Database access. In both demonstrations, the database streams were harvested by verified web discovery rather than by direct Web of Science or Scopus queries.
- No head-to-head comparison. We did not compare 360° MDL with independent PRISMA-based reviews of the same questions.
7.6. Future Research
Five lines of work follow:
- A Delphi study with review methodologists to validate and refine MDL-RC 2026, with registration of the checklist through the EQUATOR process.
- Inter-rater reliability studies of the 6R gate and of key-finding coding.
- Head-to-head comparisons of 360° MDL and conventional reviews of the same question by independent teams.
- Empirical calibration of index thresholds across fields.
- Open software that automates the indices, the flow diagram and LOSO from the Master Table.
- Studies of adoption and use by review authors, editors and doctoral programmes, including the uptake of the open playbook [60].
8. Conclusions
360° MDL turns a literature review from a summary of what was found into an auditable evidence system. Every claim is traced to identified items, every item to a stream and a quality score, and every conclusion to a measured level of robustness across independent kinds of evidence. In two contrasting applied reviews, the methodology produced balanced corpora, uncovered findings and disagreements that a database-only design would have missed, and diagnosed weaknesses of the fields themselves. The methodology, toolkits and both applied reviews are openly available, and we invite review teams to test, criticise and improve it.
Supplementary Materials
The following supporting information is openly available on Zenodo under CC BY 4.0 at https://doi.org/10.5281/zenodo.23772941 [61]: File S1: Applied review, Case A (clinical artificial intelligence in healthcare); File S2: Applied review, Case B (arrhythmic risk in genetic dilated cardiomyopathy); File S3: Methodology Application Report for Case B; File S4: Filled 360° MDL toolkit for Case B (live formulas); File S5: Blank 360° MDL toolkit, Version 2026; File S6: Record-level data, stream logs and computed indices for both cases; File S7: Counterfactual stream analysis script and outputs.
Author Contributions
Conceptualization, methodology, software, validation, formal analysis, investigation, data curation, writing—original draft preparation, writing—review and editing, and visualization: M.D.L. The author has read and agreed to the published version of the manuscript.
Funding
This research received no external funding.
Institutional Review Board Statement
Not applicable. The study analysed published literature and publicly available documents only and involved no human participants or personal data.
Informed Consent Statement
Not applicable.
Data Availability Statement
The methodology specification, researcher handbook, quick-start guide and Excel toolkit are openly available on Zenodo at https://doi.org/10.5281/zenodo.23724393 [47]. The two applied reviews, the application report, the filled and blank toolkits, the record-level data and the counterfactual analysis script (Files S1–S7) are openly available on Zenodo at https://doi.org/10.5281/zenodo.23772941 [61]. The playbook for doctoral researchers is available at https://doi.org/10.5281/zenodo.23777000 [60].
Acknowledgments
During the preparation of this manuscript and of the two applied reviews, the author used Claude (Anthropic) for the purposes stated in Section 3.4 (source discovery and verification, first-pass extraction, provisional scoring and coding, figure production, drafting and language editing). The author has reviewed and edited the output and takes full responsibility for the content of this publication.
Conflicts of Interest
The author is the originator of the 360° MDL methodology and of its open documents and toolkit, which are released under the Creative Commons Attribution 4.0 licence. The author declares no financial conflict of interest.
Appendix A
Appendix A.1. Formal Definitions and Worked Example of the Indices
Let N be the core corpus size, ni the number of core items in stream family i (i = 1…k, k ≤ 5) and pi = ni / N. Let mj be the number of core items in method family j (j = 1…9) and qj = mj / N. Let C be the set of keyword clusters and ck the number of core items coded to cluster k. For key finding f, let S(f) be the set of stream families of its supporting core items, where each work counts once, in the stream where it was retained after Gate 1.
- SBI = −Σi pi ln pi / ln k
- CovI = |{k ∈ C : ck ≥ 3}| / |C|
- MDI = −Σj qj ln qj / ln 9 (terms with qj = 0 omitted)
- TS(f) = |S(f)|; class(f) = Robust if TS ≥ 3, Supported if TS = 2, Tentative if TS = 1
- RI = (#Robust + 0.5 × #Supported) / #KF
- LOSO = mini |{f : |S(f) \ {i}| ≥ 2}| / #KF
- Convergence Rate = (# core items with a Convergence Flag) / N
Worked example (Case B). Core family counts are 18, 5, 5, 8 and 9 (N = 45). The entropy terms −pi ln pi are 0.367, 0.244, 0.244, 0.307 and 0.322, so H = 1.484 and SBI = 1.484 / ln 5 (1.609) = 0.92. Method families are Quantitative 31, Delphi/Expert 12, Design science 1 and Simulation 1, so H = 0.778 and MDI = 0.778 / ln 9 (2.197) = 0.35. Of 14 key findings, 8 are Robust and 5 Supported, so RI = (8 + 2.5) / 14 = 0.75. Removing F1 or F5 leaves 9 of 14 findings with TS ≥ 2, so LOSO = 0.64. The filled toolkit (S4) reproduces all values with live formulas.
Appendix B
Appendix B.1. The MDL-RC 2026 Reporting Checklist
| Section | # | Item |
| Title & abstract | 1 | Identify the review as a 360° MDL review and state the tier and mode |
| 2 | Structured abstract including streams, corpus size, matrices and Resilience Index | |
| Introduction | 3 | Rationale and the knowledge problem |
| 4 | Review questions | |
| Protocol (P1) | 5 | Review Canvas: scope, time window, languages, disciplines |
| 6 | Protocol registration (registry and ID) or justification | |
| 7 | Team, roles and calibration procedure | |
| Sourcing (P2) | 8 | Streams and slices used, with rationale (≥ 3) |
| 9 | Full search strings, filters and dates per stream (Stream Log) | |
| 10 | Influencer identification sources and profile-selection rules (if Approach B) | |
| 11 | Emerging & Diverse Voices strategy (if Approach C) | |
| Selection (P3) | 12 | Eligibility criteria and de-duplication; Convergence Flags |
| 13 | 6R scoring scheme, thresholds and calibration (κ) | |
| 14 | CCD curation decisions and portfolio rules | |
| 15 | Flow diagram with numbers per stream and per gate | |
| Codification (P4) | 16 | ID scheme and Master Table fields |
| 17 | Keyword-unification procedure and final cluster list | |
| Analysis (P5) | 18 | Matrices used (≥ 3) and coding rules |
| 19 | Contribution taxonomy applied | |
| 20 | Coverage heatmap and Coverage Index | |
| 21 | Method diversity (M2) and MDI | |
| Synthesis & interpretation (P6) | 22 | Key findings with Triangulation Strength |
| 23 | Resilience Index and (Advanced) LOSO test | |
| 24 | Academic–practice–policy convergence and divergence | |
| 25 | Interpretation and exploitation (M7) | |
| 26 | Value-Based Framework (M8) and its derivation from the evidence | |
| 27 | Research agenda from M5/M6 | |
| Transparency (P7) | 28 | Open data: matrices and Stream Log as supplementary files |
| 29 | AI-use statement (tools, tasks, verification) | |
| 30 | Limitations (stream coverage, language, metrics bias) and update plan |
Appendix C
Appendix C.1. Stream Families, Slices and ID Codes
| Family | Approach and streams | Slices and ID codes |
| F1 | A1 Web of Science, A2 Scopus, A3 Google Scholar, A6 domain databases | WOS, SCO, GSC, DOM × IMP (impact), REC (recency), FRO (frontier/special issue), TOP |
| F2 | B1 Clarivate HCR, B2 Stanford–Elsevier top 2%, B3 Google Scholar profiles, B4 Research.com, B5 AD Scientific Index | HCR, T2P, GSP, RCO, ADS × MC (most-cited), MR (most recent); Case B added INS (institutional-profile signal) as a documented deviation |
| F3 | A4 Industry and consulting | IND-WP (white paper / practice report) |
| F4 | A5 Government and global organisations | GOV-PP (policy paper, guideline) |
| F5 | C1–C5 Emerging and diverse voices | EMV × RIS (rising), GLS (Global South), REG (regional), PRE (preprint/conference), CRI (critical/null) |
Appendix D
Appendix D.1. Counterfactual Stream Analysis by Key Finding
Each cell gives the Triangulation Strength (TS) of the key finding when only the listed stream families are retained; 0 = absent. Items and coding are held constant.

Table A1.
Counterfactual stream analysis, Case A (Clinical AI): Triangulation Strength of each key finding under narrower stream designs (0 = finding absent).
Table A1.
Counterfactual stream analysis, Case A (Clinical AI): Triangulation Strength of each key finding under narrower stream designs (0 = finding absent).
| KF | Families (full) | F1 only | F1 + F2 | No grey (F1+F2+F5) | No F5 (F1–F4) | Full TS | Class |
|---|---|---|---|---|---|---|---|
| KF1 | F1, F2, F4, F5 | 1 | 2 | 3 | 3 | 4 | Robust |
| KF2 | F1, F2, F4, F5 | 1 | 2 | 3 | 3 | 4 | Robust |
| KF3 | F1, F5 | 1 | 1 | 2 | 1 | 2 | Supported |
| KF4 | F1, F2, F4, F5 | 1 | 2 | 3 | 3 | 4 | Robust |
| KF5 | F1, F2, F4, F5 | 1 | 2 | 3 | 3 | 4 | Robust |
| KF6 | F1, F2, F4, F5 | 1 | 2 | 3 | 3 | 4 | Robust |
| KF7 | F1, F2, F4, F5 | 1 | 2 | 3 | 3 | 4 | Robust |
| KF8 | F2, F3, F4, F5 | 0 | 1 | 2 | 3 | 4 | Robust |
| KF9 | F1, F3, F5 | 1 | 1 | 2 | 2 | 3 | Robust |
| KF10 | F1, F3, F4, F5 | 1 | 1 | 2 | 3 | 4 | Robust |
| KF11 | F1, F2, F4, F5 | 1 | 2 | 3 | 3 | 4 | Robust |
| KF12 | F2, F3 | 0 | 1 | 1 | 2 | 2 | Supported |
| KF13 | F3 | 0 | 0 | 0 | 1 | 1 | Tentative |
| RI | 0.00 | 0.27 | 0.69 | 0.77 | 0.85 |
Table A2.
Counterfactual stream analysis, Case B (Genetic DCM): Triangulation Strength of each key finding under narrower stream designs (0 = finding absent).
Table A2.
Counterfactual stream analysis, Case B (Genetic DCM): Triangulation Strength of each key finding under narrower stream designs (0 = finding absent).
| KF | Families (full) | F1 only | F1 + F2 | No grey (F1+F2+F5) | No F5 (F1–F4) | Full TS | Class |
|---|---|---|---|---|---|---|---|
| KF1 | F1, F2, F4, F5 | 1 | 2 | 3 | 3 | 4 | Robust |
| KF2 | F1, F4, F5 | 1 | 1 | 2 | 2 | 3 | Robust |
| KF3 | F1, F2 | 1 | 2 | 2 | 2 | 2 | Supported |
| KF4 | F1, F5 | 1 | 1 | 2 | 1 | 2 | Supported |
| KF5 | F1, F4, F5 | 1 | 1 | 2 | 2 | 3 | Robust |
| KF6 | F1, F4, F5 | 1 | 1 | 2 | 2 | 3 | Robust |
| KF7 | F1, F2, F4 | 1 | 2 | 2 | 3 | 3 | Robust |
| KF8 | F1, F2, F5 | 1 | 2 | 3 | 2 | 3 | Robust |
| KF9 | F1, F5 | 1 | 1 | 2 | 1 | 2 | Supported |
| KF10 | F1, F2, F4 | 1 | 2 | 2 | 3 | 3 | Robust |
| KF11 | F2, F3, F4 | 0 | 1 | 1 | 3 | 3 | Robust |
| KF12 | F1, F5 | 1 | 1 | 2 | 1 | 2 | Supported |
| KF13 | F4, F5 | 0 | 0 | 1 | 1 | 2 | Supported |
| KF14 | F1 | 1 | 1 | 1 | 1 | 1 | Tentative |
| RI | 0.00 | 0.18 | 0.46 | 0.46 | 0.75 |
Appendix E
Appendix E.1. Key Findings of the Two Applied Reviews
Table A3.
Key findings of Case A (Clinical AI) with supporting stream families and Triangulation Strength.
Table A3.
Key findings of Case A (Clinical AI) with supporting stream families and Triangulation Strength.
| KF | Key finding | Families | Class (TS) |
|---|---|---|---|
| KF1 | On retrospective, curated datasets, AI reaches or exceeds specialist-level diagnostic accuracy in image-based tasks (dermatology, ophthalmology, mammography). | F1, F2, F4, F5 | Robust (4) |
| KF2 | Evidence of patient-relevant benefit remains thin: most studies are retrospective, single-centre, at high risk of bias and measure accuracy rather than outcomes. | F1, F2, F4, F5 | Robust (4) |
| KF3 | Where prospective evidence exists, in population screening, AI support increases cancer or disease detection and reduces reading workload without raising false positives. | F1, F5 | Supported (2) |
| KF4 | Performance and fairness degrade when models move to new sites; independent local validation and post-market monitoring are prerequisites for safe use. | F1, F2, F4, F5 | Robust (4) |
| KF5 | Algorithms can encode and amplify inequity (proxy labels, under-diagnosis of under-served groups, race-based outputs of LLMs); fairness audits must precede and follow deployment. | F1, F2, F4, F5 | Robust (4) |
| KF6 | Human-AI collaboration is not automatically additive: automation bias and heterogeneous effects mean incorrect AI advice degrades clinician performance. | F1, F2, F4, F5 | Robust (4) |
| KF7 | LLMs perform strongly on knowledge benchmarks and simulated consultations, but this does not yet translate into better decisions by real users or better patient outcomes. | F1, F2, F4, F5 | Robust (4) |
| KF8 | Generative AI adoption by clinicians, hospitals and consumers is accelerating faster than institutional governance, training and transparent evaluation. | F2, F3, F4, F5 | Robust (4) |
| KF9 | The clearest near-term value lies in reducing administrative and documentation burden (ambient scribes, documentation support), with measurable effects on clinician well-being. | F1, F3, F5 | Robust (3) |
| KF10 | Workforce readiness, training and trust are leading bottlenecks to adoption; clinicians and patients report trust gaps and insufficient preparation. | F1, F3, F4, F5 | Robust (4) |
| KF11 | Regulation is moving towards risk-based, lifecycle governance (GMLP, change-control plans, EU AI Act), but implementation timelines lag behind deployment, especially for generalist and generative models. | F1, F2, F4, F5 | Robust (4) |
| KF12 | Trust depends more on validated evidence, transparency of sources and clear accountability than on post-hoc explainability of individual predictions. | F2, F3 | Supported (2) |
| KF13 | Return on investment of clinical AI is mostly expected or self-reported by organisations; independent economic evaluation is largely absent. | F3 | Tentative (1) |
Table A4.
Key findings of Case B (Genetic DCM) with supporting stream families and Triangulation Strength.
Table A4.
Key findings of Case B (Genetic DCM) with supporting stream families and Triangulation Strength.
| KF | Key finding | Families | Class (TS) |
|---|---|---|---|
| KF1 | A defined set of ‘arrhythmic genotypes’ (LMNA, truncating FLNC, DSP/desmosomal, PLN, RBM20 missense, TMEM43) carries a 2.5–3-fold higher risk of malignant ventricular arrhythmia than genotype-negative DCM. | F1, F2, F4, F5 | Robust (4) |
| KF2 | In high-risk genotypes, arrhythmic risk is largely independent of LVEF: events occur at LVEF > 35%, so the LVEF threshold under-protects carriers. | F1, F4, F5 | Robust (3) |
| KF3 | TTN-truncating and genotype-negative DCM carry lower arrhythmic risk, often with reverse remodelling; their risk follows LVEF and sex rather than genotype. | F1, F2 | Supported (2) |
| KF4 | Variant class and location refine gene-level risk (e.g., LMNA truncating vs tail-domain missense; RBM20 truncating vs missense), but these effects are not consistent across cohorts. | F1, F5 | Supported (2) |
| KF5 | Gene-specific risk calculators (LMNA, PLN, DSP, FLNC) and an NDLVC score discriminate well internally (C-statistic about 0.76–0.83) and are now endorsed by guidelines. | F1, F4, F5 | Robust (3) |
| KF6 | External validation exposes over-prediction and limited transportability: the LMNA calculator kept sensitivity but had 26% specificity in a Nordic cohort, and predictors (sex, variant type) differ between national registries. | F1, F4, F5 | Robust (3) |
| KF7 | CMR late gadolinium enhancement (midwall/septal, free-wall and ring-like patterns) adds independent arrhythmic information and differs by genotype, yet most gene-specific calculators omit it. | F1, F2, F4 | Robust (3) |
| KF8 | NSVT, syncope, PVC burden and conduction disease are recurrent predictors across genotypes; sex effects are genotype-dependent (male sex in LMNA, FLNC and TTN; female sex in DSP). | F1, F2, F5 | Robust (3) |
| KF9 | Myocardial inflammation (myocarditis-like ‘hot phases’) is a substrate-specific risk modifier, most evident in DSP cardiomyopathy and NDLVC. | F1, F5 | Supported (2) |
| KF10 | LVEF-based primary-prevention ICD selection in non-ischaemic DCM has limited mortality benefit (DANISH), and guidelines have moved from LVEF-only to genotype- and scar-informed criteria. | F1, F2, F4 | Robust (3) |
| KF11 | Genotype-guided care depends on curated gene validity and on access: only a minority of DCM genes have definitive evidence, yields are 19–25%, DCM patients are offered testing less often than HCM patients, and cascade testing is cost-effective. | F2, F3, F4 | Robust (3) |
| KF12 | In genotype-first (population) carriers penetrance is low and modified by polygenic background, so risk estimates from clinical cohorts may not transfer to incidentally identified carriers. | F1, F5 | Supported (2) |
| KF13 | Evidence is concentrated in European-ancestry cohorts; under-represented ancestries show lower diagnostic yield, more variants of uncertain significance and sparse genotype-specific arrhythmic outcome data. | F4, F5 | Supported (2) |
| KF14 | AI applied to the ECG can match multimodal gene-specific models, but evidence so far is limited to one founder variant in one country. | F1 | Tentative (1) |
Appendix F
Appendix F.1. Responsible-AI Protocol Applied in the Demonstrations
| Element | Practice in Cases A and B |
| Permitted AI tasks | Source discovery; verification of bibliographic details on opened pages; first-pass extraction from abstracts and official summaries; provisional 6R scores and codes; drafting; figure production |
| Two-Key verification | No item was included without an opened page showing its title, authors or issuing body, year and DOI or official URL. Items that could not be verified were dropped and logged |
| Recorded deviations | Secondary pages (institutional repositories, society pages) were used when publisher pages failed; such cases are listed in each review’s verification notes |
| Human responsibility | 6R scores, codes and interpretations are provisional until confirmed against full texts by the author and a second coder |
| Disclosure | AI-use statements in each review and in this article (tool, period, tasks, verification) |
References
- Snyder, H. Literature review as a research methodology: An overview and guidelines. J. Bus. Res. 2019, 104, 333–339. [Google Scholar] [CrossRef]
- Kraus, S.; Breier, M.; Lim, W.M.; et al. Literature reviews as independent studies: Guidelines for academic practice. Rev. Manag. Sci. 2022, 16, 2577–2595. [Google Scholar] [CrossRef]
- Paul, J.; Criado, A.R. The art of writing literature review: What do we know and what do we need to know? Int. Bus. Rev. 2020, 29, 101717. [Google Scholar] [CrossRef]
- Ioannidis, J.P.A. The mass production of redundant, misleading, and conflicted systematic reviews and meta-analyses. Milbank Q. 2016, 94, 485–514. [Google Scholar] [CrossRef]
- Chalmers, I.; Glasziou, P. Avoidable waste in the production and reporting of research evidence. Lancet 2009, 374, 86–89. [Google Scholar] [CrossRef]
- Khraisha, Q.; Put, S.; Kappenberg, J.; Warraitch, A.; Hadfield, K. Can large language models replace humans in systematic reviews? Evaluating GPT-4’s efficacy in screening and extracting data from peer-reviewed and grey literature in multiple languages. Res. Synth. Methods 2024, 15, 616–626. [Google Scholar] [CrossRef]
- Marshall, I.J.; Wallace, B.C. Toward systematic review automation: A practical guide to using machine learning tools in research synthesis. Syst. Rev. 2019, 8, 163. [Google Scholar] [CrossRef]
- Bolaños, F.; Salatino, A.; Osborne, F.; Motta, E. Artificial intelligence for literature reviews: Opportunities and challenges. Artif. Intell. Rev. 2024, 57, 259. [Google Scholar] [CrossRef]
- Page, M.J.; McKenzie, J.E.; Bossuyt, P.M.; et al. The PRISMA 2020 statement: An updated guideline for reporting systematic reviews. BMJ 2021, 372, n71. [Google Scholar] [CrossRef]
- Rethlefsen, M.L.; Kirtley, S.; Waffenschmidt, S.; et al. PRISMA-S: An extension to the PRISMA statement for reporting literature searches in systematic reviews. Syst. Rev. 2021, 10, 39. [Google Scholar] [CrossRef]
- Tricco, A.C.; Lillie, E.; Zarin, W.; et al. PRISMA extension for scoping reviews (PRISMA-ScR): Checklist and explanation. Ann. Intern. Med. 2018, 169, 467–473. [Google Scholar] [CrossRef]
- Peters, M.D.J.; Marnie, C.; Tricco, A.C.; et al. Updated methodological guidance for the conduct of scoping reviews. JBI Evid. Synth. 2020, 18, 2119–2126. [Google Scholar] [CrossRef]
- Shea, B.J.; Reeves, B.C.; Wells, G.; et al. AMSTAR 2: A critical appraisal tool for systematic reviews that include randomised or non-randomised studies of healthcare interventions, or both. BMJ 2017, 358, j4008. [Google Scholar] [CrossRef]
- Whiting, P.; Savović, J.; Higgins, J.P.T.; et al. ROBIS: A new tool to assess risk of bias in systematic reviews was developed. J. Clin. Epidemiol. 2016, 69, 225–234. [Google Scholar] [CrossRef]
- Guyatt, G.H.; Oxman, A.D.; Vist, G.E.; et al. GRADE: An emerging consensus on rating quality of evidence and strength of recommendations. BMJ 2008, 336, 924–926. [Google Scholar] [CrossRef]
- Lewin, S.; Booth, A.; Glenton, C.; et al. Applying GRADE-CERQual to qualitative evidence synthesis findings: Introduction to the series. Implement. Sci. 2018, 13, 2. [Google Scholar] [CrossRef]
- Mongeon, P.; Paul-Hus, A. The journal coverage of Web of Science and Scopus: A comparative analysis. Scientometrics 2016, 106, 213–228. [Google Scholar] [CrossRef]
- Vera-Baceta, M.-A.; Thelwall, M.; Kousha, K. Web of Science and Scopus language coverage. Scientometrics 2019, 121, 1803–1813. [Google Scholar] [CrossRef]
- Tennant, J.P. Web of Science and Scopus are not global databases of knowledge. Eur. Sci. Ed. 2020, 46, e51987. [Google Scholar] [CrossRef]
- Visser, M.; van Eck, N.J.; Waltman, L. Large-scale comparison of bibliographic data sources: Scopus, Web of Science, Dimensions, Crossref, and Microsoft Academic. Quant. Sci. Stud. 2021, 2, 20–41. [Google Scholar] [CrossRef]
- Martín-Martín, A.; Thelwall, M.; Orduna-Malea, E.; Delgado López-Cózar, E. Google Scholar, Microsoft Academic, Scopus, Dimensions, Web of Science, and OpenCitations’ COCI: A multidisciplinary comparison of coverage via citations. Scientometrics 2021, 126, 871–906. [Google Scholar] [CrossRef]
- Gusenbauer, M.; Haddaway, N.R. Which academic search systems are suitable for systematic reviews or meta-analyses? Evaluating retrieval qualities of Google Scholar, PubMed, and 26 other resources. Res. Synth. Methods 2020, 11, 181–217. [Google Scholar] [CrossRef]
- Martín-Martín, A.; Orduna-Malea, E.; Thelwall, M.; Delgado López-Cózar, E. Google Scholar, Web of Science, and Scopus: A systematic comparison of citations in 252 subject categories. J. Informetr. 2018, 12, 1160–1177. [Google Scholar] [CrossRef]
- Adams, R.J.; Smart, P.; Huff, A.S. Shades of grey: Guidelines for working with the grey literature in systematic reviews for management and organizational studies. Int. J. Manag. Rev. 2017, 19, 432–454. [Google Scholar] [CrossRef]
- Haddaway, N.R.; Collins, A.M.; Coughlin, D.; Kirk, S. The role of Google Scholar in evidence reviews and its applicability to grey literature searching. PLoS ONE 2015, 10, e0138237. [Google Scholar] [CrossRef]
- Paez, A. Gray literature: An important resource in systematic reviews. J. Evid. Based Med. 2017, 10, 233–240. [Google Scholar] [CrossRef]
- Conn, V.S.; Valentine, J.C.; Cooper, H.M.; Rantz, M.J. Grey literature in meta-analyses. Nurs. Res. 2003, 52, 256–261. [Google Scholar] [CrossRef]
- Garousi, V.; Felderer, M.; Mäntylä, M.V. The need for multivocal literature reviews in software engineering: Complementing systematic literature reviews with grey literature. In Proceedings of the 20th International Conference on Evaluation and Assessment in Software Engineering (EASE ’16), Limerick, Ireland, 1–3 June 2016; ACM: New York, NY, USA, 2016. [Google Scholar] [CrossRef]
- Garousi, V.; Felderer, M.; Mäntylä, M.V. Guidelines for including grey literature and conducting multivocal literature reviews in software engineering. Inf. Softw. Technol. 2019, 106, 101–121. [Google Scholar] [CrossRef]
- Mahood, Q.; Van Eerd, D.; Irvin, E. Searching for grey literature for systematic reviews: Challenges and benefits. Res. Synth. Methods 2014, 5, 221–234. [Google Scholar] [CrossRef]
- Merton, R.K. The Matthew effect in science. Science 1968, 159, 56–63. [Google Scholar] [CrossRef]
- Nielsen, M.W.; Andersen, J.P. Global citation inequality is on the rise. Proc. Natl. Acad. Sci. USA 2021, 118, e2012208118. [Google Scholar] [CrossRef]
- Duyx, B.; Urlings, M.J.E.; Swaen, G.M.H.; Bouter, L.M.; Zeegers, M.P. Scientific citations favor positive results: A systematic review and meta-analysis. J. Clin. Epidemiol. 2017, 88, 92–101. [Google Scholar] [CrossRef]
- Abimbola, S. The foreign gaze: Authorship in academic global health. BMJ Glob. Health 2019, 4, e002068. [Google Scholar] [CrossRef]
- Amano, T.; González-Varo, J.P.; Sutherland, W.J. Languages are still a major barrier to global science. PLoS Biol. 2016, 14, e2000933. [Google Scholar] [CrossRef]
- Amano, T.; Ramírez-Castañeda, V.; Berdejo-Espinola, V.; Borokini, I.; Chowdhury, S.; Golivets, M.; et al. The manifold costs of being a non-native English speaker in science. PLoS Biol. 2023, 21, e3002184. [Google Scholar] [CrossRef]
- Gomez, C.J.; Herman, A.C.; Parigi, P. Leading countries in global science increasingly receive more citations than other countries doing similar research. Nat. Hum. Behav. 2022, 6, 919–929. [Google Scholar] [CrossRef]
- Larivière, V.; Ni, C.; Gingras, Y.; Cronin, B.; Sugimoto, C.R. Bibliometrics: Global gender disparities in science. Nature 2013, 504, 211–213. [Google Scholar] [CrossRef]
- Hicks, D.; Wouters, P.; Waltman, L.; de Rijcke, S.; Rafols, I. Bibliometrics: The Leiden Manifesto for research metrics. Nature 2015, 520, 429–431. [Google Scholar] [CrossRef]
- Wilsdon, J.; Allen, L.; Belfiore, E.; Campbell, P.; Curry, S.; Hill, S.; et al. The Metric Tide: Report of the Independent Review of the Role of Metrics in Research Assessment and Management; HEFCE: London, UK, 2015. [Google Scholar] [CrossRef]
- Waltman, L. A review of the literature on citation impact indicators. J. Informetr. 2016, 10, 365–391. [Google Scholar] [CrossRef]
- Lawlor, D.A.; Tilling, K.; Davey Smith, G. Triangulation in aetiological epidemiology. Int. J. Epidemiol. 2016, 45, 1866–1886. [Google Scholar] [CrossRef]
- Munafò, M.R.; Davey Smith, G. Robust research needs many lines of evidence. Nature 2018, 553, 399–401. [Google Scholar] [CrossRef]
- Steegen, S.; Tuerlinckx, F.; Gelman, A.; Vanpaemel, W. Increasing transparency through a multiverse analysis. Perspect. Psychol. Sci. 2016, 11, 702–712. [Google Scholar] [CrossRef]
- Hoffmann, S.; Schönbrodt, F.; Elsas, R.; Wilson, R.; Strasser, U.; Boulesteix, A.-L. The multiplicity of analysis strategies jeopardizes replicability: Lessons learned across disciplines. R. Soc. Open Sci. 2021, 8, 201925. [Google Scholar] [CrossRef]
- Silberzahn, R.; Uhlmann, E.L.; Martin, D.P.; Anselmi, P.; Aust, F.; Awtrey, E.; et al. Many analysts, one data set: Making transparent how variations in analytic choices affect results. Adv. Methods Pract. Psychol. Sci. 2018, 1, 337–356. [Google Scholar] [CrossRef]
- Lytras, M.D. 360° MDL: The Multidimensional Literature Review Model—Version 2026 (Methodology Overview, Researcher Handbook, Quick Start Guide and Toolkit); Zenodo: Geneva, Switzerland, 2026. [Google Scholar] [CrossRef]
- Grant, M.J.; Booth, A. A typology of reviews: An analysis of 14 review types and associated methodologies. Health Inf. Libr. J. 2009, 26, 91–108. [Google Scholar] [CrossRef]
- Paré, G.; Trudel, M.C.; Jaana, M.; Kitsiou, S. Synthesizing information systems knowledge: A typology of literature reviews. Inf. Manag. 2015, 52, 183–199. [Google Scholar] [CrossRef]
- Webster, J.; Watson, R.T. Analyzing the past to prepare for the future: Writing a literature review. MIS Q. 2002, 26, xiii–xxiii. [Google Scholar] [CrossRef]
- Templier, M.; Paré, G. A framework for guiding and evaluating literature reviews. Commun. Assoc. Inf. Syst. 2015, 37, 6. [Google Scholar] [CrossRef]
- Rowe, F. What literature review is not: Diversity, boundaries and recommendations. Eur. J. Inf. Syst. 2014, 23, 241–255. [Google Scholar] [CrossRef]
- vom Brocke, J.; Simons, A.; Riemer, K.; Niehaves, B.; Plattfaut, R.; Cleven, A. Standing on the shoulders of giants: Challenges and recommendations of literature search in information systems research. Commun. Assoc. Inf. Syst. 2015, 37, 9. [Google Scholar] [CrossRef]
- Hiebl, M.R.W. Sample selection in systematic literature reviews of management research. Organ. Res. Methods 2023, 26, 229–261. [Google Scholar] [CrossRef]
- Higgins, J.P.T.; Thomas, J.; Chandler, J.; Cumpston, M.; Li, T.; Page, M.J.; Welch, V.A. (Eds.) Cochrane Handbook for Systematic Reviews of Interventions, Version 6.5; Cochrane: London, UK, 2024; Available online: Https://www.cochrane.org/authors/handbooks-and-manuals/handbook/current (accessed on 6 November 2026).
- Hevner, A.R.; March, S.T.; Park, J.; Ram, S. Design science in information systems research. MIS Q. 2004, 28, 75–105. [Google Scholar] [CrossRef]
- Peffers, K.; Tuunanen, T.; Rothenberger, M.A.; Chatterjee, S. A design science research methodology for information systems research. J. Manag. Inf. Syst. 2007, 24, 45–77. [Google Scholar] [CrossRef]
- Tyndall, J. AACODS Checklist; Flinders University: Adelaide, Australia, 2010; Available online: Https://hdl.handle.net/2328/3326 (accessed on 6 November 2026).
- Elliott, J.H.; Turner, T.; Clavisi, O.; et al. Living systematic reviews: An emerging opportunity to narrow the evidence-practice gap. PLoS Med. 2014, 11, e1001603. [Google Scholar] [CrossRef]
- Lytras, M.D. The PhD Literature Review Playbook: Write a Review Your Committee Cannot Fault, Step by Step, with the 360° MDL Methodology, Version 1.0; Zenodo: Geneva, Switzerland, 2026. [Google Scholar] [CrossRef]
- Lytras, M.D. Supplementary Materials for “360° MDL: A Multi-Stream, Multidimensional and Resilience-Tested Methodology for Literature Reviews”—Applied Reviews, Application Report, Toolkits and Data; Zenodo: Geneva, Switzerland, 2026. [Google Scholar] [CrossRef]
- Ioannidis, J.P.A.; Baas, J.; Klavans, R.; Boyack, K.W. A standardized citation metrics author database annotated for scientific field. PLoS Biol. 2019, 17, e3000384. [Google Scholar] [CrossRef]
- Shannon, C.E. A mathematical theory of communication. Bell Syst. Tech. J. 1948, 27, 379–423. [Google Scholar] [CrossRef]
- Wang, S.; Scells, H.; Koopman, B.; Zuccon, G. Can ChatGPT write a good Boolean query for systematic review literature search? In Proceedings of the 46th International ACM SIGIR Conference on Research and Development in Information Retrieval (SIGIR ’23), Taipei, Taiwan, 23–27 July 2023; ACM: New York, NY, USA, 2023. [Google Scholar] [CrossRef]
- Alshami, A.; Elsayed, M.; Ali, E.; Eltoukhy, A.E.E.; Zayed, T. Harnessing the power of ChatGPT for automating systematic review process: Methodology, case study, limitations, and future directions. Systems 2023, 11, 351. [Google Scholar] [CrossRef]
- Thorp, H.H. ChatGPT is fun, but not an author. Science 2023, 379, 313. [Google Scholar] [CrossRef]
- van Dis, E.A.M.; Bollen, J.; Zuidema, W.; van Rooij, R.; Bockting, C.L. ChatGPT: Five priorities for research. Nature 2023, 614, 224–226. [Google Scholar] [CrossRef]
Figure 1.
The 360° MDL model. The inner ring is the seven-phase cycle (P1 Frame to P7 Report & Renew), the middle ring the five stream families used for triangulation (F1–F5), and the outer ring the eight analysis matrices (M1–M8). The side panel lists the seven pillars and the 3 × 3 Rule.
Figure 1.
The 360° MDL model. The inner ring is the seven-phase cycle (P1 Frame to P7 Report & Renew), the middle ring the five stream families used for triangulation (F1–F5), and the outer ring the eight analysis matrices (M1–M8). The side panel lists the seven pillars and the 3 × 3 Rule.
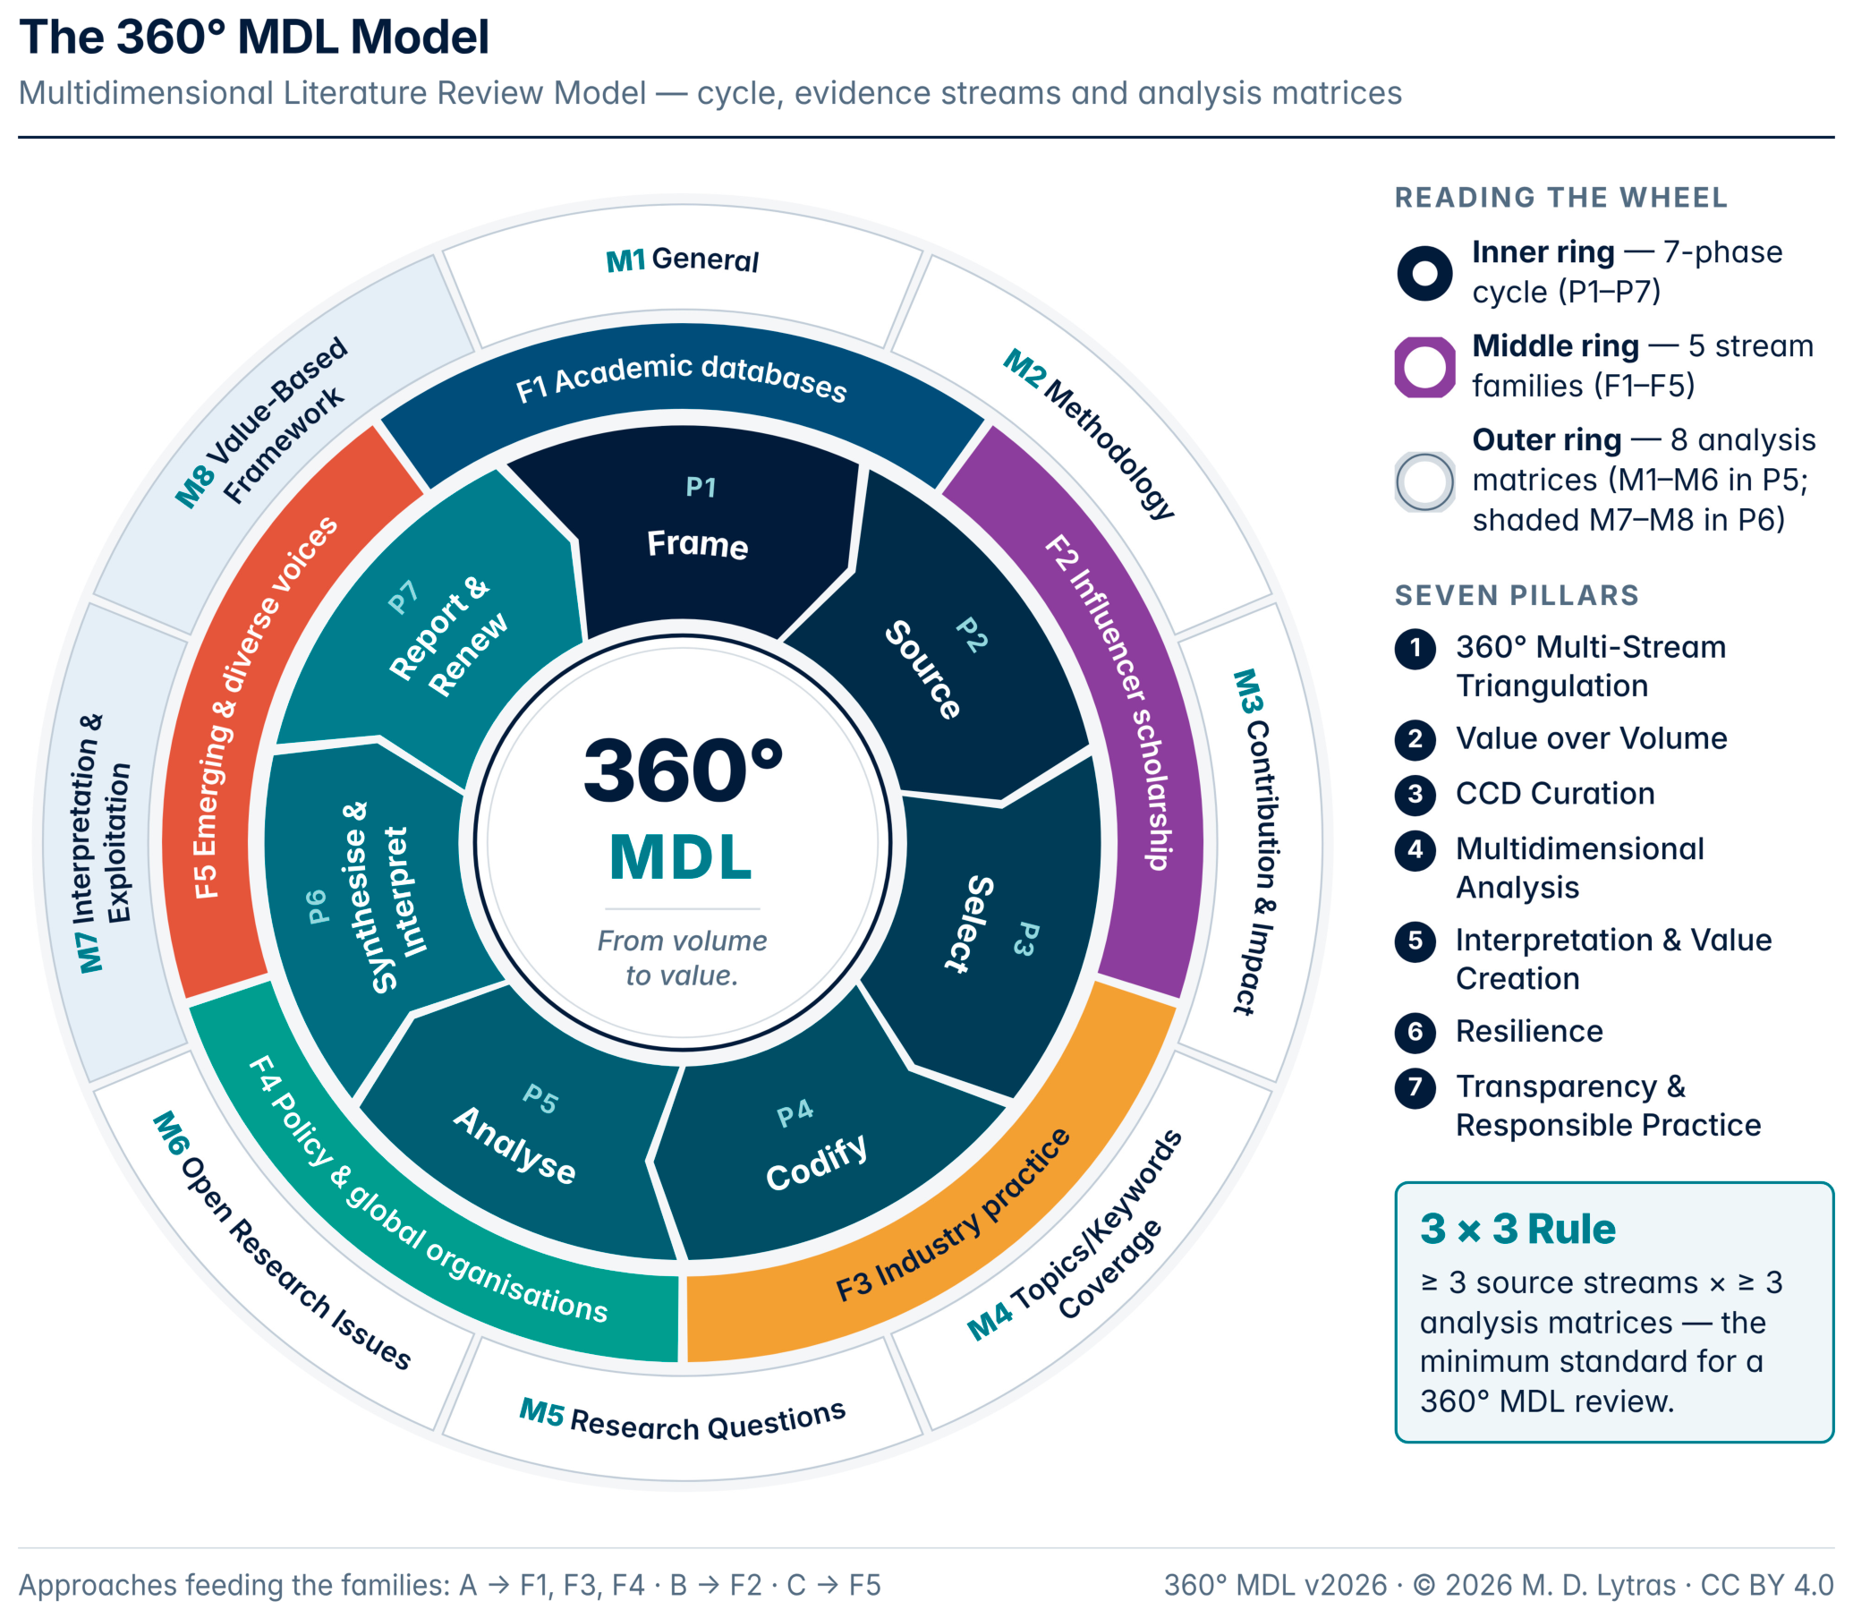
Figure 2.
The five evidence stream families of 360° MDL, with the sources each one draws on, the bias it counterbalances and the indicative harvest sizes of the Lite tier (for F1, 15/5/10 + 5 denotes 15 high-impact, 5 recent and 10 frontier records from one main database plus 5 from Google Scholar).
Figure 2.
The five evidence stream families of 360° MDL, with the sources each one draws on, the bias it counterbalances and the indicative harvest sizes of the Lite tier (for F1, 15/5/10 + 5 denotes 15 high-impact, 5 recent and 10 frontier records from one main database plus 5 from Google Scholar).
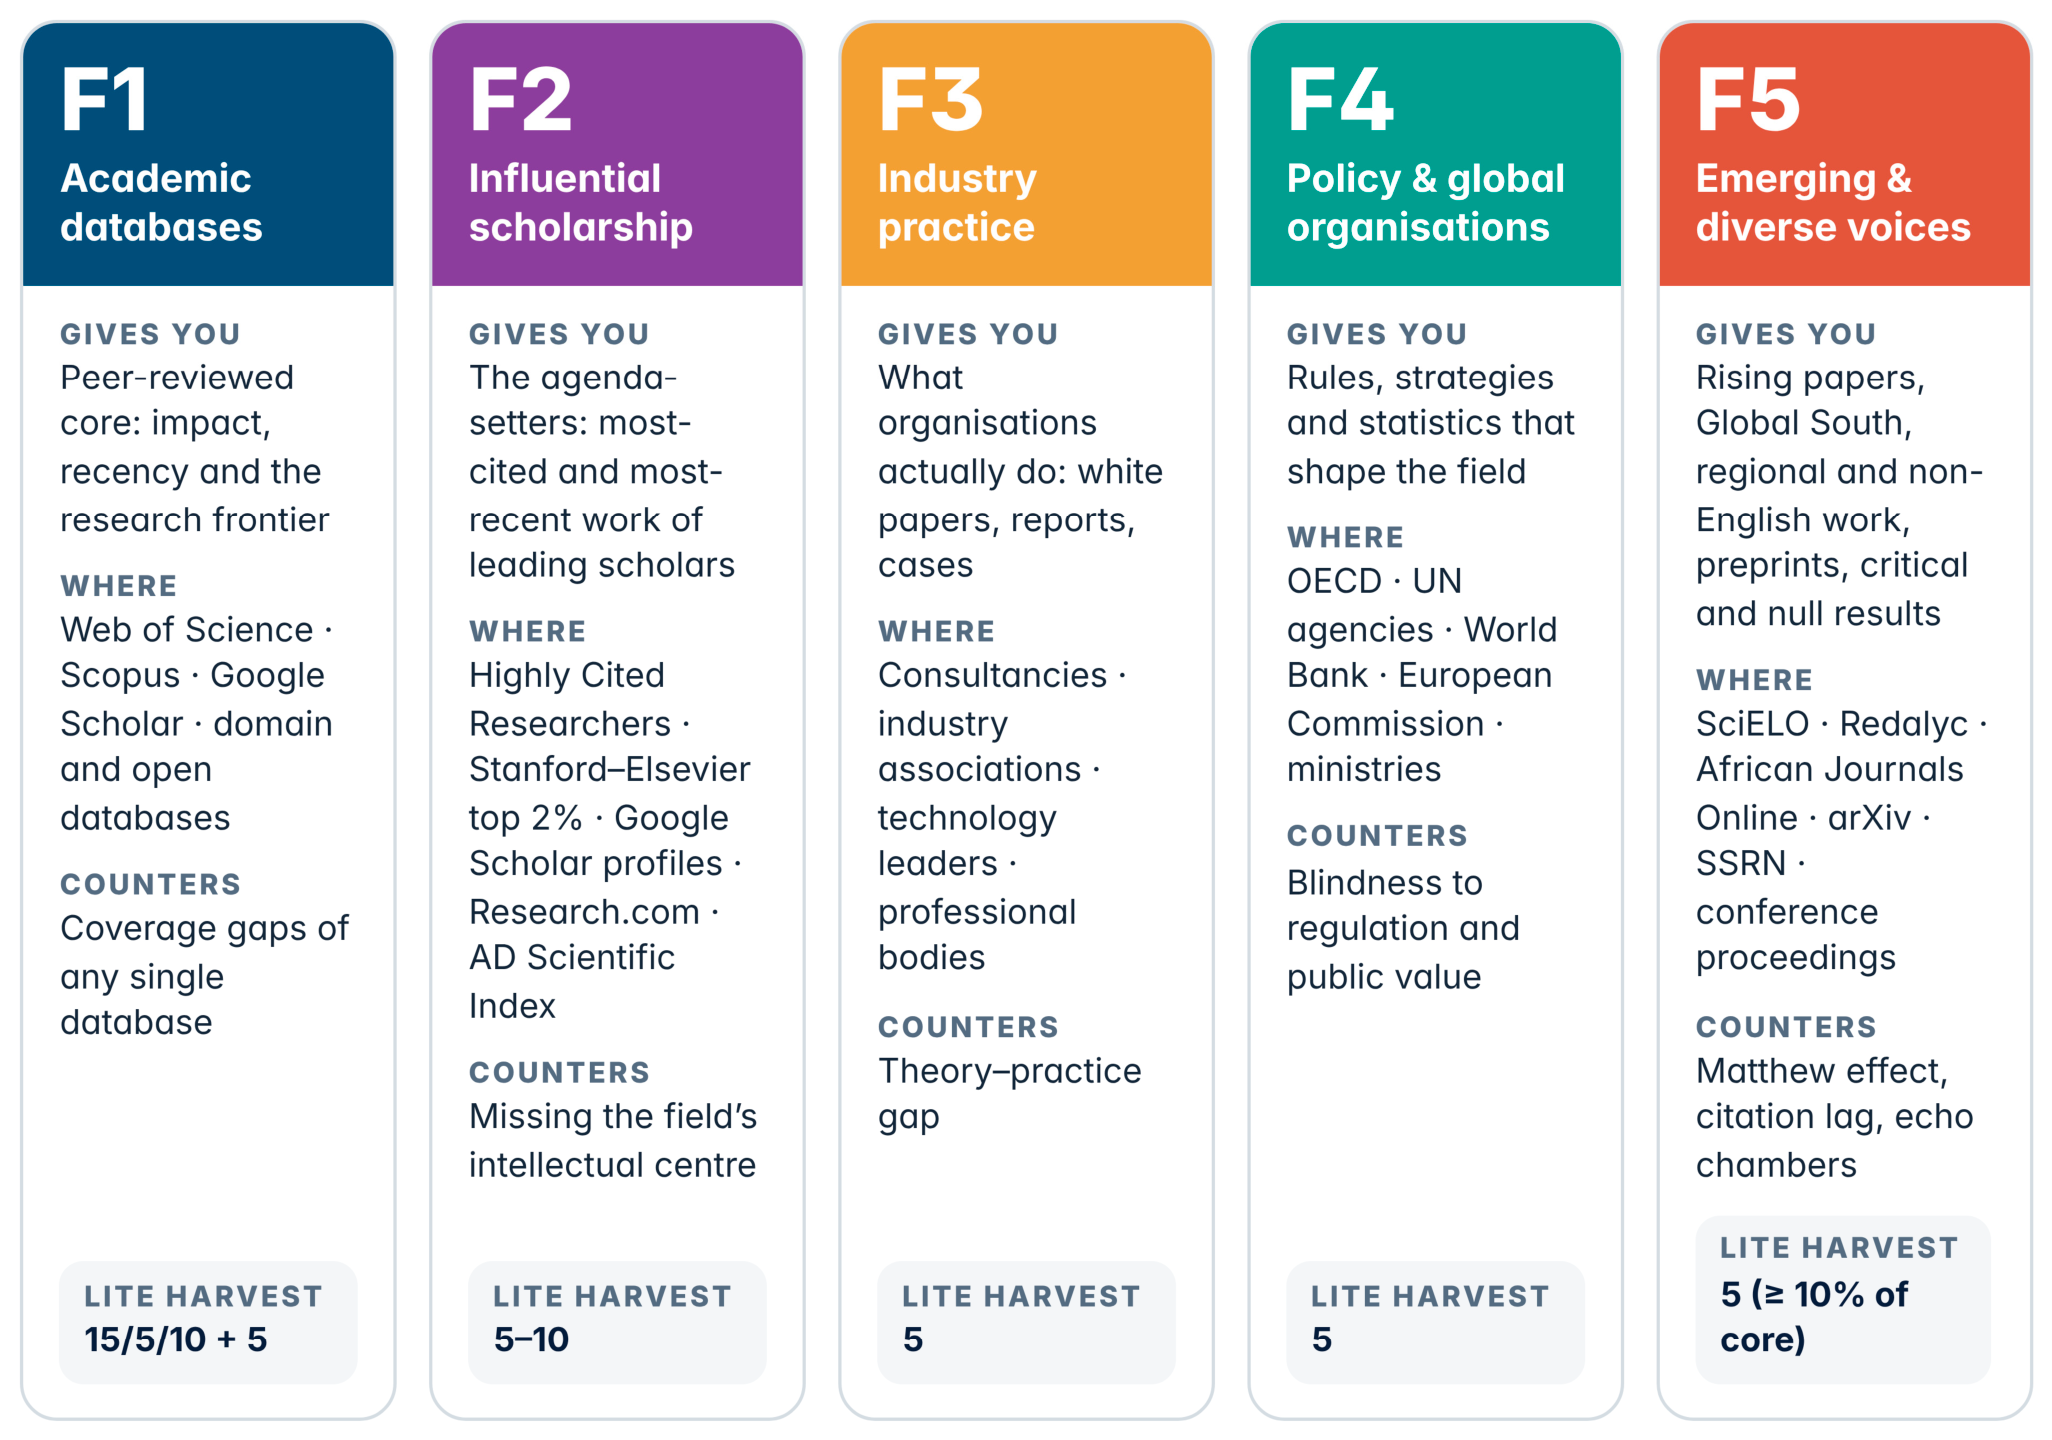
Figure 3.
The Three Gates of phase P3. Gate 1 removes ineligible items and cross-stream duplicates and records Convergence Flags; Gate 2 scores each item on the 6R criteria; Gate 3 composes the core corpus as a portfolio, with redundant items moved to an Extended Evidence Pool.
Figure 3.
The Three Gates of phase P3. Gate 1 removes ineligible items and cross-stream duplicates and records Convergence Flags; Gate 2 scores each item on the 6R criteria; Gate 3 composes the core corpus as a portfolio, with redundant items moved to an Extended Evidence Pool.
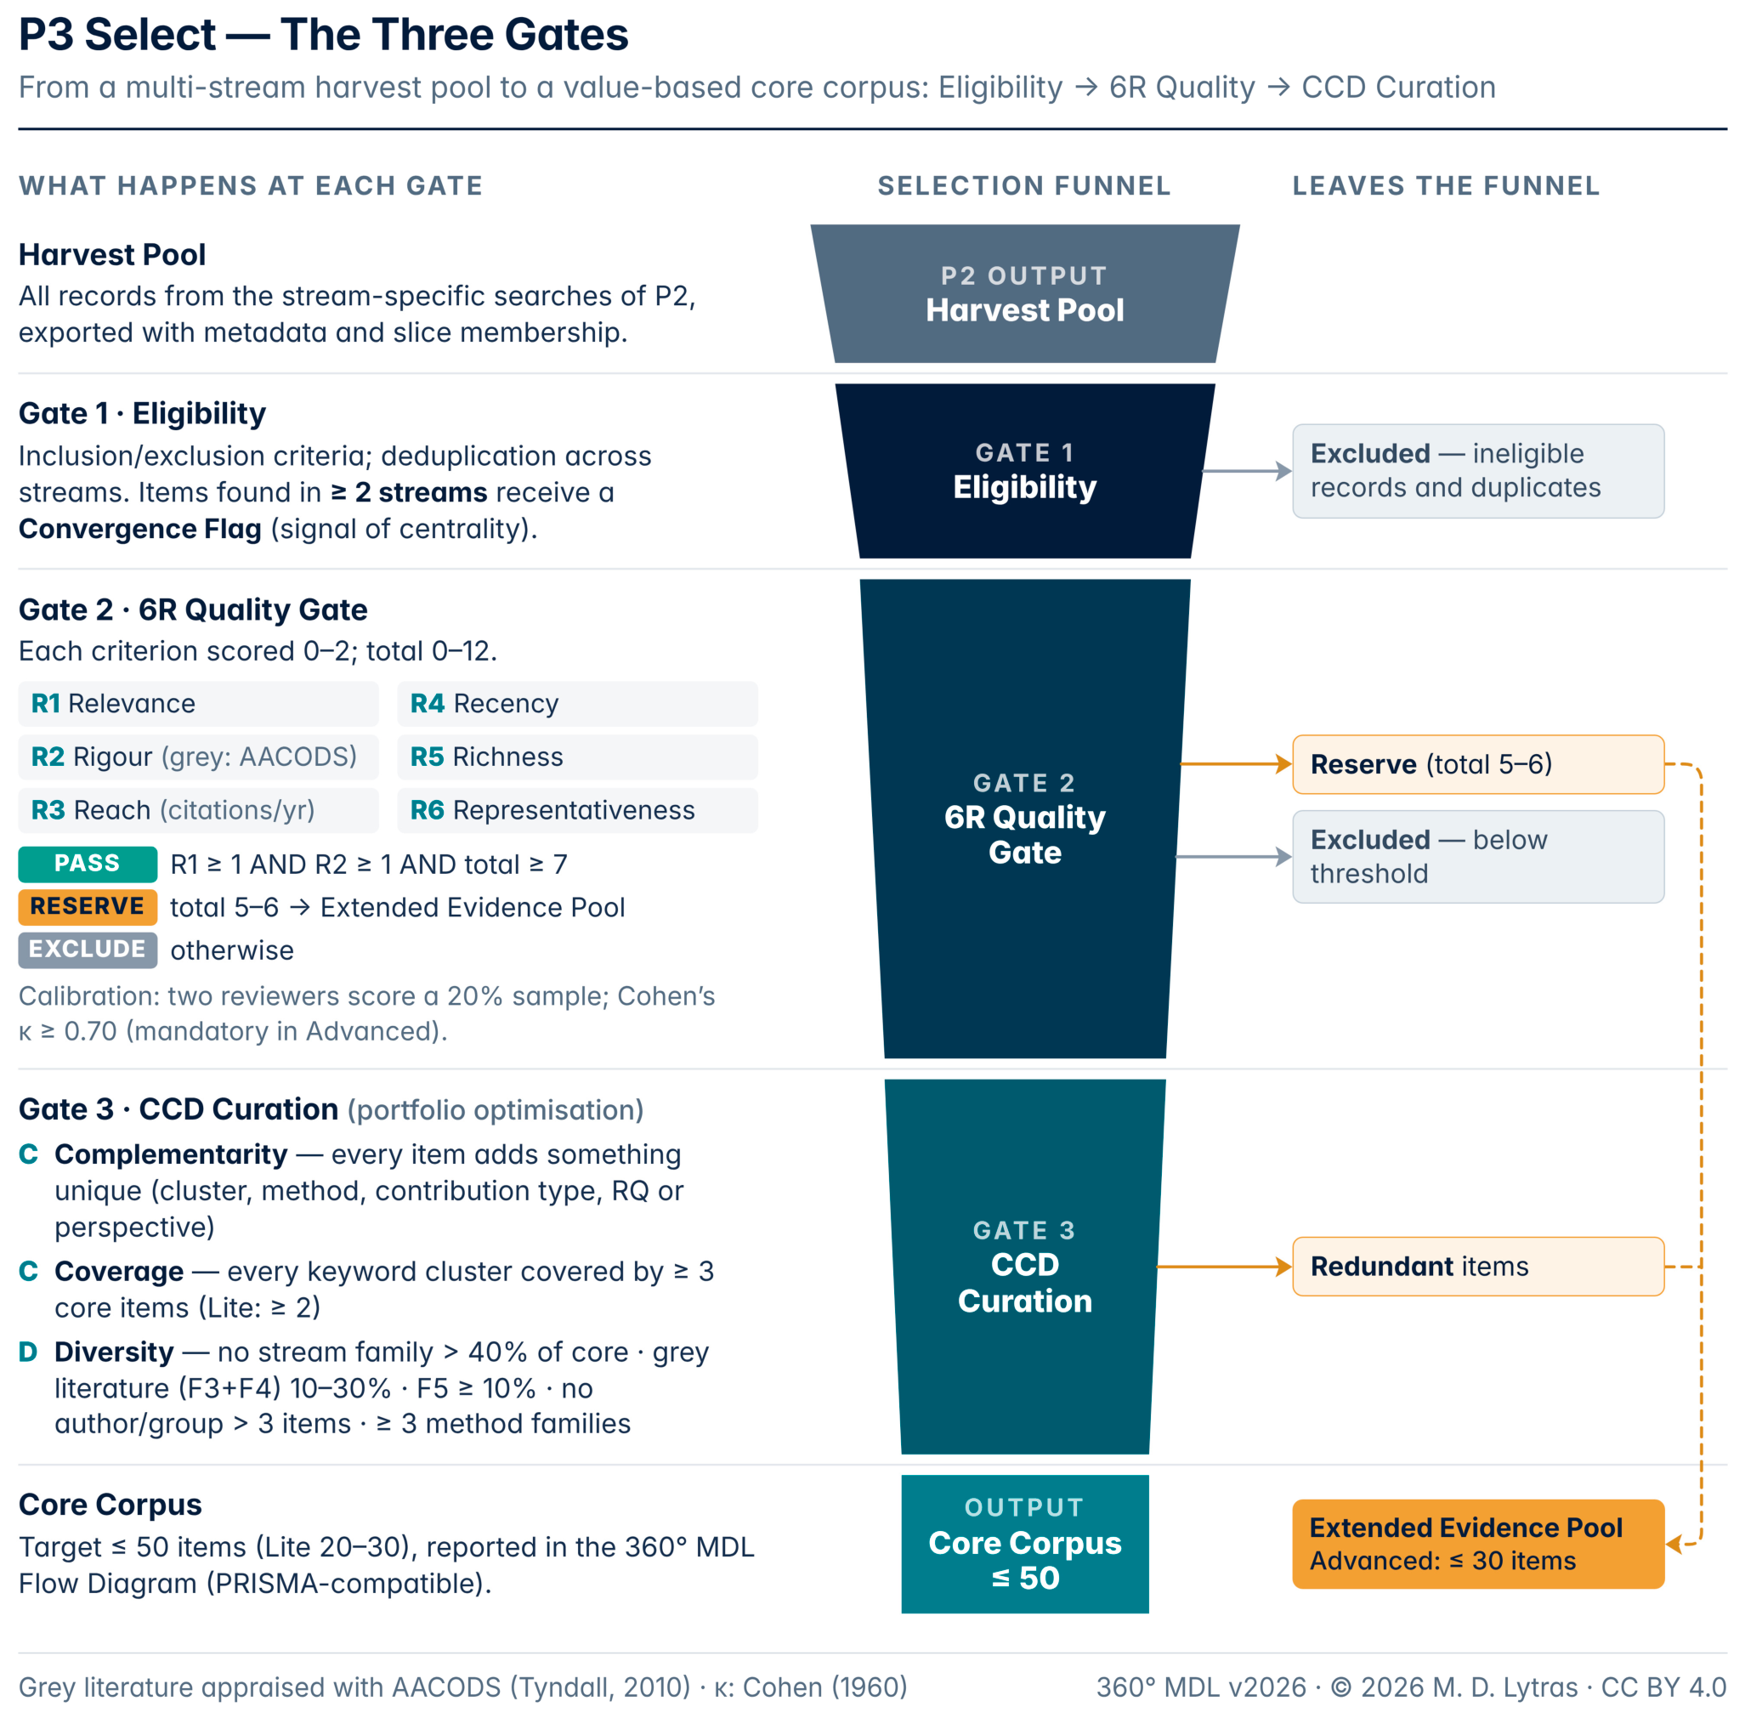
Figure 4.
Analytical layers and the eight matrices: descriptive (M1, M2, M4), evaluative (M3 with the 6R scores), prospective (M5, M6), interpretive (M7) and generative (M8), joined by the P6 synthesis bridge of cross-matrix synthesis and the Triangulation and Resilience test.
Figure 4.
Analytical layers and the eight matrices: descriptive (M1, M2, M4), evaluative (M3 with the 6R scores), prospective (M5, M6), interpretive (M7) and generative (M8), joined by the P6 synthesis bridge of cross-matrix synthesis and the Triangulation and Resilience test.
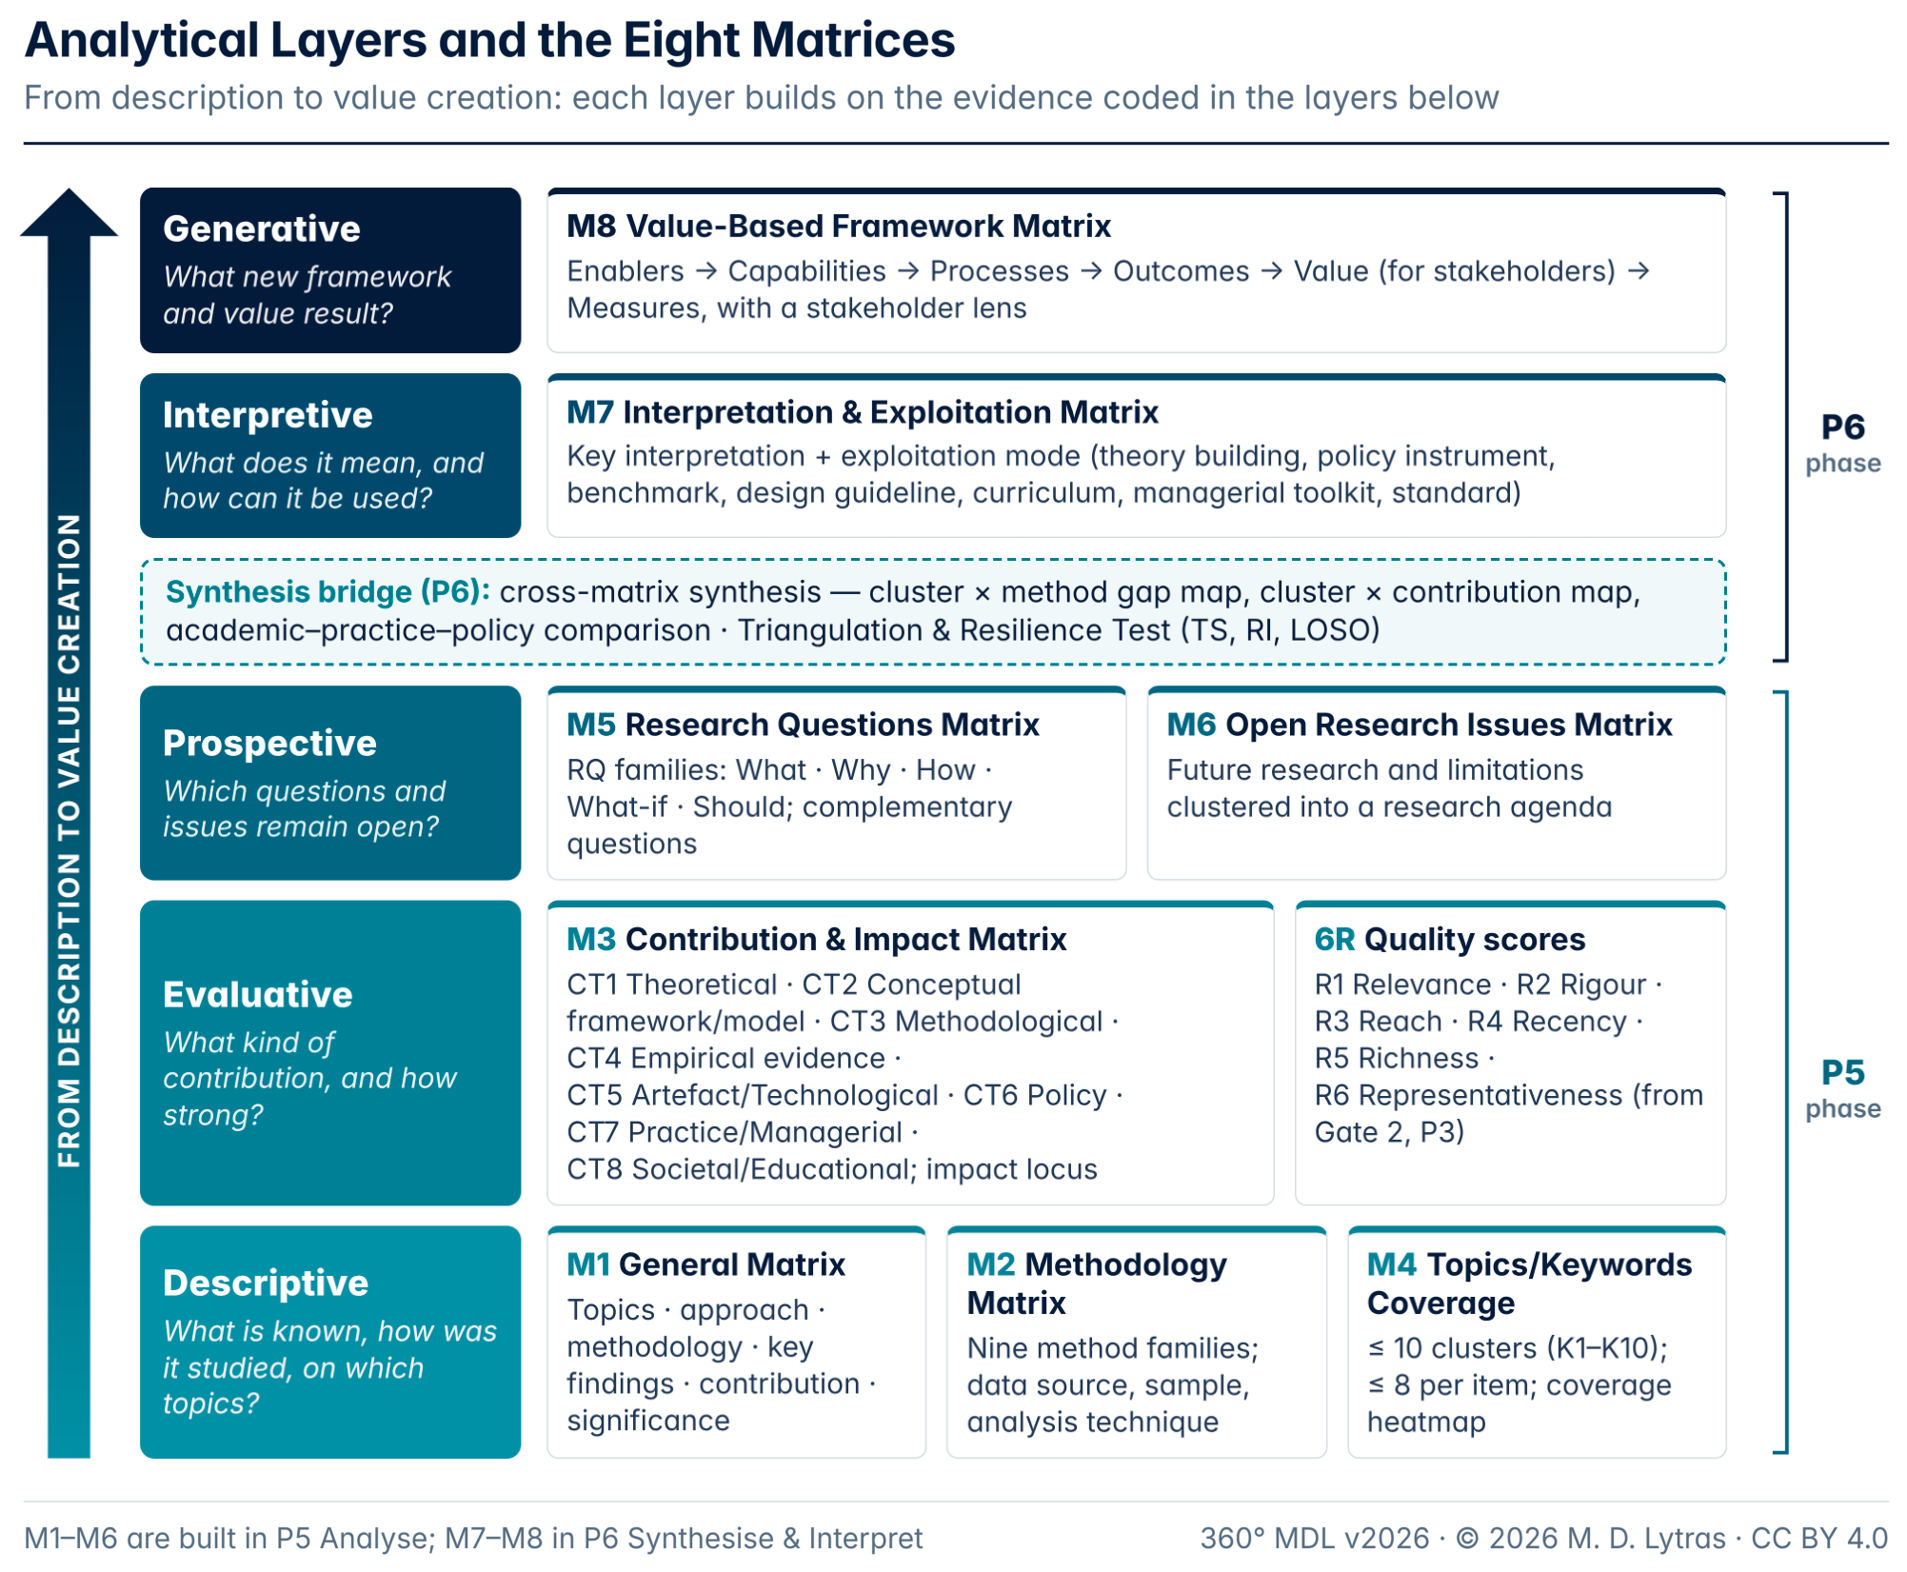
Figure 5.
Cross-case evaluation. (A) Composition of the core corpora by stream family. (B) Index profiles against Standard-tier targets. (C) Counterfactual stream scenarios: key findings re-classified by Triangulation Strength when only the listed stream families are retained, with the resulting Resilience Index.
Figure 5.
Cross-case evaluation. (A) Composition of the core corpora by stream family. (B) Index profiles against Standard-tier targets. (C) Counterfactual stream scenarios: key findings re-classified by Triangulation Strength when only the listed stream families are retained, with the resulting Resilience Index.
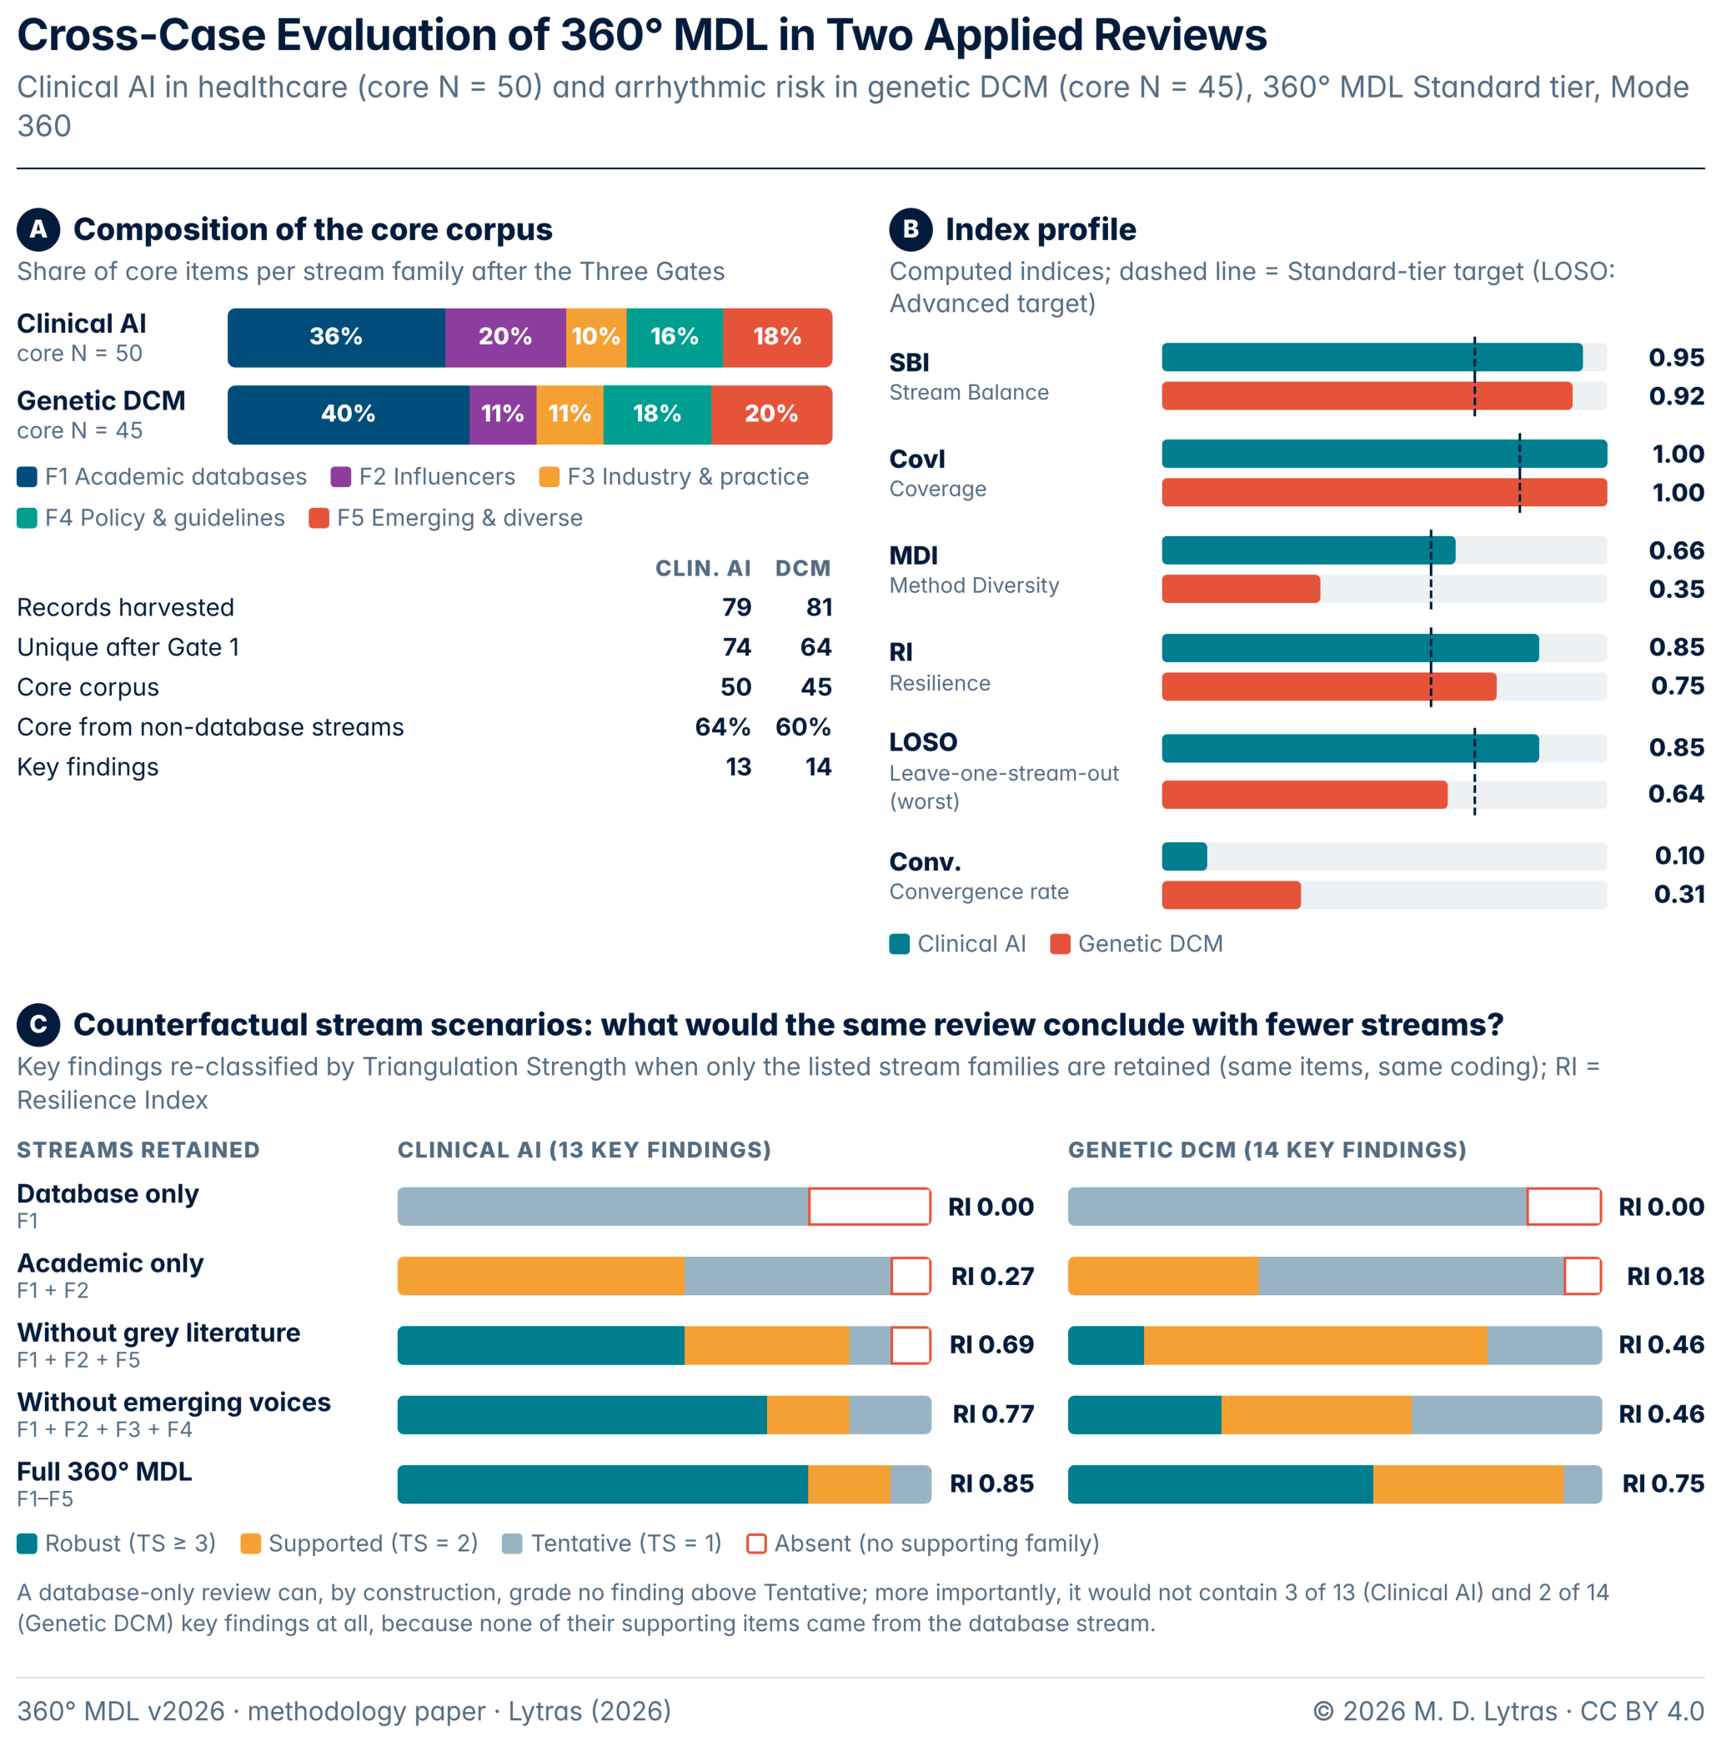
Table 1.
Design features prescribed by major review approaches. ● prescribed; ◐ partial or optional; ○ not addressed. Ratings reflect the author’s reading of each guidance document’s design intent [1,9,11,12,15,29,55].
| Design dimension | Systematic review (PRISMA 2020, Cochrane) | Scoping review (PRISMA-ScR, JBI) | Multivocal review (MLR) | Integrative / narrative review | 360° MDL |
|---|---|---|---|---|---|
| Transparent reporting checklist and flow diagram | ● | ● | ◐ | ○ | ● (MDL-RC 2026; PRISMA-compatible) |
| Structured search of several databases | ● | ● | ● | ◐ | ● |
| Systematic inclusion of practice and policy (grey) sources | ◐ | ◐ | ● | ◐ | ● (quota 10–30%) |
| Explicit counterbalancing of citation bias (emerging, regional, critical voices) | ○ | ○ | ○ | ○ | ● (F5 quota ≥ 10%) |
| Quality appraisal applicable to heterogeneous sources | ● (risk of bias, studies) | ○ (optional) | ◐ (grey-literature checklists) | ◐ | ● (6R gate; AACODS for grey) |
| Portfolio rules for corpus composition (balance, caps) | ○ | ○ | ○ | ○ | ● (CCD rules) |
| Multidimensional coding of each item (methods, contributions, coverage, open issues) | ◐ (data extraction) | ● (charting) | ◐ | ◐ | ● (M1–M6) |
| Assessment of certainty or robustness of conclusions | ● (GRADE: certainty of effect estimates) | ○ | ○ | ○ | ● (Triangulation Strength across source families; LOSO) |
| Interpretation into an actionable framework | ○ | ○ | ◐ | ◐ | ● (M7, M8) |
Table 2.
Design requirements for the methodology and their rationale.
| # | Requirement | Rationale |
|---|---|---|
| DR1 | Harvest evidence from several independent source types, including practice and policy sources | Database coverage differs, and practice and policy knowledge lies outside databases [17,20,22,23,24,25,26] |
| DR2 | Counterbalance citation-driven bias | Matthew effect, positive-result citation bias, under-representation of non-English and Global South scholarship [31,32,33,34,35,37] |
| DR3 | Apply one transparent quality gate to heterogeneous sources | Peer-reviewed and grey sources need comparable but appropriate appraisal [24,58] |
| DR4 | Compose a bounded, balanced core corpus rather than an exhaustive list | Value over volume; redundancy inflates reviews and wastes research effort [4,5,54] |
| DR5 | Analyse every item along several standard dimensions | Move beyond paper-by-paper summaries [1,50] |
| DR6 | Quantify the robustness of each conclusion to the choice of sources | Triangulation across differently biased evidence; sensitivity of conclusions to analytic choices [42,43,44,45] |
| DR7 | End in interpretation and an evidence-traced framework, reported transparently and updatable | Reviews should create usable knowledge and remain current [9,59] |
Table 3.
The 360° MDL indices. Targets are defaults for the Standard tier; LOSO is required at the Advanced tier and reported at the other tiers.
Table 3.
The 360° MDL indices. Targets are defaults for the Standard tier; LOSO is required at the Advanced tier and reported at the other tiers.
| Index | Definition | Range | Target |
|---|---|---|---|
| Stream Balance Index (SBI) | Normalised Shannon entropy [63] of the core corpus over the k stream families used: SBI = −Σ pi ln pi / ln k | 0–1 | ≥ 0.70 |
| Coverage Index (CovI) | Share of keyword clusters with ≥ 3 core items | 0–1 | ≥ 0.80 |
| Method Diversity Index (MDI) | Normalised Shannon entropy over the nine method families: MDI = −Σ qj ln qj / ln 9 | 0–1 | ≥ 0.60 |
| Triangulation Strength (TS) | Number of stream families supporting a key finding | 1–5 | Robust ≥ 3 |
| Resilience Index (RI) | (# Robust + 0.5 × # Supported) / # key findings | 0–1 | ≥ 0.60 |
| Leave-One-Stream-Out (LOSO) | Share of key findings that keep TS ≥ 2 when one family is removed; worst case over families | 0–1 | ≥ 0.70 (Advanced) |
| Convergence Rate | Share of core items found in ≥ 2 streams | 0–1 | Reported |
Table 4.
Cross-case comparison of the two applied reviews. Both reviews: Standard tier, Mode 360, searches on 28 October 2026.
Table 4.
Cross-case comparison of the two applied reviews. Both reviews: Standard tier, Mode 360, searches on 28 October 2026.
| Indicator | Case A: Clinical AI | Case B: Genetic DCM |
|---|---|---|
| Records harvested / unique | 79 / 74 | 81 / 64 |
| Logged queries (web discovery) | 129 | 147 |
| Gate 2: pass / reserve / exclude | 72 / 1 / 1 | 62 / 2 / 0 |
| Extended Evidence Pool | 23 | 19 |
| Core corpus (F1/F2/F3/F4/F5) | 50 (18/10/5/8/9) | 45 (18/5/5/8/9) |
| Grey literature (F3 + F4) · F5 share | 26% · 18% | 29% · 20% |
| SBI · CovI · MDI | 0.95 · 1.00 · 0.66 | 0.92 · 1.00 · 0.35 |
| Key findings: Robust / Supported / Tentative | 10 / 2 / 1 | 8 / 5 / 1 |
| RI · LOSO (worst case) | 0.85 · 0.85 | 0.75 · 0.64 (without F1 or F5) |
| Convergence Rate | 10% (5 of 50) | 31% (14 of 45) |
| Divergences identified | Explainability (influencers vs policy) | Sex and variant-type effects (calculator vs national registries) |
| Original framework (M8) | Clinical AI Value Chain | GIAR Pathway |
Table 5.
Evidence of requirement fulfilment in the two demonstrations. MDL-RC items still open in both drafts concern registration, inter-coder calibration, database hit counts and data deposit.
Table 5.
Evidence of requirement fulfilment in the two demonstrations. MDL-RC items still open in both drafts concern registration, inter-coder calibration, database hit counts and data deposit.
| # | Evidence in Case A (Clinical AI) | Evidence in Case B (Genetic DCM) |
|---|---|---|
| DR1 | Five families; 64% of core from non-database streams; adoption, workforce and governance evidence came from industry and policy sources | Five families; 60% of core from non-database streams; gene-validity curation, laboratory yields and access evidence came from the practice stream |
| DR2 | F5 = 18% of core, including null and critical results (failure of a proprietary sepsis model on external validation, under-diagnosis bias in chest-radiograph models, automation bias) | F5 = 20% of core, including national-registry, population-penetrance and African- and Japanese-ancestry evidence |
| DR3 | 74 items scored with one 6R rubric; grey items appraised with AACODS; one item excluded for rigour | 64 items scored; preprints and congress abstracts scored, not ignored; decision rule applied automatically in the toolkit |
| DR4 | Core of 50 from 72 passing items; all CCD rules met | Core of 45 from 62 passing items; F1 capped at 40%; all CCD rules met |
| DR5 | Six matrices completed; three structural gaps found in M4 | Six matrices completed; three structural gaps found in M4; MDI exposed a methodological gap of the field |
| DR6 | 13 findings graded; RI 0.85; LOSO 0.85 | 14 findings graded; RI 0.75; LOSO 0.64 located the dependence on F1 and F5 |
| DR7 | Clinical AI Value Chain + five propositions; MDL-RC 25/30 in the submission draft | GIAR Pathway + five propositions; MDL-RC 25/30; 12-month update plan |
Table 6.
Traceability of key finding KF6 of Case B from harvesting to the value framework. Full records are in Supplementary Materials, Files S3 and S4.
Table 6.
Traceability of key finding KF6 of Case B from harvesting to the value framework. Full records are in Supplementary Materials, Files S3 and S4.
| Step (tool) | Record for KF6 in Case B |
|---|---|
| P2 Stream Log (T3) | Item 1 retrieved in the F1 Frontier slice and again in the F5 critical sub-stream; item 2 in the F5 regional sub-stream; item 3 in the F4 guideline stream |
| Gate 1 (Convergence) | Item 1 de-duplicated; retained as SCO-FRO-01 with a Convergence Flag (duplicate EMV-CRI-02) |
| Gate 2 (6R, T4) | SCO-FRO-01: 9/12; EMV-REG-02: 9/12; GOV-PP-10: 10/12 — all PASS (R1 ≥ 1, R2 ≥ 1, total ≥ 7) |
| Gate 3 (CCD, T5) | All three kept in the core: each adds a different family and perspective (validation cohort, national registry, scientific statement) |
| M1 / M6 | Specificity 26% and positive predictive value 11% at the recommended threshold; predictors (sex, variant type) not replicated in the national registry; prerequisites for new scores listed. Open issues: small cohorts, founder-variant mixes |
| T15 Triangulation | Families F1, F4, F5 → TS = 3 → Robust; it remains at TS ≥ 2 whichever single family is removed |
| M7 Interpretation | “A calculator is a population-specific instrument until externally validated and recalibrated” → exploitation mode: validation protocol for clinical centres |
| M8 Framework (GIAR Pathway) | Processes layer (“external validation and recalibration”) and Measures layer (“C-statistic, calibration”) |
Disclaimer/Publisher’s Note: The statements, opinions and data contained in all publications are solely those of the individual author(s) and contributor(s) and not of MDPI and/or the editor(s). MDPI and/or the editor(s) disclaim responsibility for any injury to people or property resulting from any ideas, methods, instructions or products referred to in the content. |
© 2026 by the author. Licensee MDPI, Basel, Switzerland. This article is an open access article distributed under the terms and conditions of the Creative Commons Attribution (CC BY) license.
Copyright: This open access article is published under a Creative Commons CC BY 4.0 license, which permit the free download, distribution, and reuse, provided that the author and preprint are cited in any reuse.