
Submitted:
06 November 2026
Posted:
10 November 2026
You are already at the latest version
Abstract
Spatial estimates of reservoir evaporation from satellite observations are often inaccurate due to biases in raw satellite-derived water surface temperature (Ts_sat) and the need for concurrent in situ measurements of water surface temperature (Ts_m) for correction. This study expands the Turbulent Exchange Approach for Reservoir Evaporation Estimation (TEAREE) by developing transferable satellite-derived Ts_sat correction methods that eliminate the need for in situ Ts_m measurements at the application lakes. Analysis of 627 corresponding Ts_sat and Ts_m from 30 lakes across four climatic zones revealed climate-dependent biases, with a pooled mean bias of +1.53 °C and RMSE of 2.43 °C. Global (Method 1) and a climate-zone-based (Method 2) corrections were developed using 22 lakes and independently validated at eight lakes. Method 1 and Method 2 reduced satellite-derived Ts_sat RMSE from 2.92 °C to 2.15 °C and 1.87 °C, respectively. Incorporating these corrections into TEAREE reduced pooled daily evaporation RMSE from 1.37 mm/day to 0.81 mm/day (41%) and 0.62 mm/day (55%), respectively. Method 2 achieved comparable performance to the site-specific correction benchmark, with statistically equivalent mean evaporation estimates and absolute prediction errors at the pooled scale (TOST p < 0.001; ±5% equivalence margin). These findings demonstrate that climate-zone-based correction improves TEAREE evaporation estimates and supports broader application to lakes and reservoirs where in situ Ts_m measurements are unavailable.
Keywords:
evaporation
; water surface temperature
; satellite
; bias correction
; TEAREE
1. Introduction
Lakes and reservoirs are vital sources of water for municipal, agricultural, and industrial use, as well as hydropower generation, flood control, recreation, and environmental sustainability. However, evaporation from reservoir surfaces represents one of the largest consumptive losses of stored freshwater, particularly in arid and semi-arid regions where evaporative demand is high, and water availability is limited. Globally, reservoir evaporation accounts for hundreds of cubic kilometers of freshwater loss annually, a significant component of consumptive water use that reduces the efficiency of reservoir storage systems [1,2]. Projected increases in air temperature and atmospheric evaporative demand associated with climate change are expected to intensify reservoir evaporation losses and further reduce the amount of stored water available for beneficial use [3,4,5]. Accurate estimation of these losses is therefore increasingly important for reservoir operations, drought preparedness, water allocation, and sustainable water resources management.
Open-water evaporation is commonly estimated using Class A evaporation pans [6,7,8], water-budget [9], energy-budget [10,11,12], bulk aerodynamic [11,13,14], eddy covariance (EC) [15,16], and combination approaches [17,18,19,20]. More direct approaches, such as eddy covariance, can provide direct and high-frequency estimates of evaporation and turbulent fluxes but require specialized instrumentation, sustained field operation, and careful data processing, limiting their application across large numbers of reservoirs [15,16,21]. Class A evaporation pans have been widely used for operational evaporation estimation in the United States because of their simplicity and long observational record [22,23]. However, pan evaporation can overestimate open-water evaporation because pans have smaller water volumes and shallower depths, allowing them to respond more quickly to changes in atmospheric and radiative conditions than large lakes and reservoirs [23,24]. Class A pans are also susceptible to expansion and contraction, seasonally, which impacts the accuracy of seasonal estimates. These traditional approaches require site-specific calibration and provide point estimates, limiting their ability to resolve spatial variability in evaporation across large lakes and reservoirs.
Satellite remote sensing has emerged as an effective tool for estimating reservoir evaporation because it provides temporally and spatially distributed observations over large water bodies that are difficult or impossible to monitor with field instrumentation. Thermal infrared sensors onboard satellite platforms such as Landsat, MODIS, and ECOSTRESS provide observations of water surface temperature (Ts) that can be integrated with meteorological observations to estimate evaporation using physically based and hybrid modeling approaches [25,26,27,28]. Ts of a lake is one of the most influential parameters in surface water evaporation because it directly controls saturation vapor pressure at the air–water interface and, therefore, influences latent heat exchange between water and the atmosphere [29,30]. Consequently, errors in satellite-derived Ts_sat can propagate into estimates of sensible and latent heat fluxes and daily evaporation [27,30]. Improving the accuracy of satellite-derived Ts_sat is therefore fundamental for enhancing the reliability of physically based reservoir evaporation models [24,28].
Despite the advantages of thermal infrared remote sensing for reservoir evaporation estimation, satellite-derived Ts_sat remain affected by multiple sources of uncertainty, including atmospheric effects, sensor calibration, surface emissivity assumptions, mixed shoreline pixels, cloud contamination, and viewing geometry [27,28,31,32,33]. These factors can introduce systematic bias between satellite-derived Ts_sat and in situ Ts_m, with the magnitude of the bias potentially varying by water body, climatic conditions, and season [27,28,33,34]. Since surface water evaporation is highly sensitive to Ts, improving the accuracy of satellite-derived Ts_sat is critical for operational reservoir evaporation monitoring [30,32,33,34].
Numerous studies have aimed to improve the accuracy of satellite-derived Ts_sat through enhanced atmospheric correction algorithms, split-window techniques, emissivity correction methods, regression-based calibration, and, more recently, machine learning approaches that relate satellite observations to concurrent in situ measurements [26,33,35,36]. Despite these advances, comparisons with in situ observations have shown that the accuracy and bias of satellite-derived Ts_sat can vary substantially among sensors, water bodies, and environmental conditions. For example, Tavares et al. [25] reported RMSE values of 1.05 and 1.07 °C for MODIS and Landsat 7, respectively, at a subtropical lake. Zhao et al. [26] identified a mean bias of approximately -1.86 °C in MODIS-derived Ts across 21 Northern Hemisphere lakes. More recent evaluations have similarly reported RMSE values below approximately 1 to 2 °C for MODIS under carefully selected validation conditions at large Tibetan Plateau lakes [37] and root mean square deviation (RMSD) of 1.71 °C for Landsat-derived Ts in northern Canadian lakes [38] Although correction approaches can substantially improve satellite-derived Ts_sat retrieval accuracy, many empirical calibration and bias-correction relationships are developed for individual lakes or reservoirs using locally collected in situ Ts_m during satellite overpasses [27,35]. Consequently, these relationships are often site-specific and may not readily transfer to water bodies with different climatic, geographic, or environmental conditions [31,34]. This dependence on concurrent in situ measurements limits the broader operational application of satellite-based evaporation estimation, particularly for unmonitored reservoirs and data-scarce regions where concurrent in situ Ts_m observations are unavailable [27,30].
In our previous study, we developed the TEAREE model, a physically based framework that integrates satellite-derived Ts_sat with routinely measured meteorological variables to estimate spatially distributed daily reservoir evaporation [24]. The TEAREE model showed that incorporating spatial variability in satellite-derived Ts_sat within a bulk aerodynamic framework substantially improves evaporation estimates compared with conventional approaches. However, the original TEAREE framework requires concurrent in situ Ts_m measurements to correct systematic bias in uncorrected satellite-derived Ts_sat before estimating evaporation. Although this calibration procedure ensures high-accuracy TEAREE evaporation estimates, the requirement for local concurrent in situ Ts_m measurements limit its application to reservoirs where such measurements, or frequency of measurements, are available.
A key unresolved question is whether the satellite-derived Ts_sat correction relationship, developed from observations across multiple lakes, can be applied to independent reservoirs under different climatic conditions while maintaining accurate evaporation estimates in the TEAREE model. Recognizing how satellite-derived Ts_sat bias varies across lakes and climate zones highlights the importance of this issue where in situ Ts_m measurements are unavailable or too expensive to collect.
To address this knowledge gap, this study extends the previously developed TEAREE framework by developing and independently evaluating two transferable approaches for correcting satellite-derived Ts_sat without requiring in situ Ts_m measurements at the application reservoir. The objectives of this study were to (i) develop and independently validate global (Method 1) and climate-zone-based (Method 2) Ts_sat correction relationships; and (ii) evaluate the effects of these transferable correction methods on TEAREE daily evaporation estimates relative to the site-specific correction benchmark. The overall goal is to improve the broader applicability of TEAREE to lakes and reservoirs where in situ Ts_m measurements are unavailable.
2. Materials and Methods
This study used satellite-derived Ts_sat data from Landsat 5, 8, and 9 and in situ Ts_m measurements from 30 lakes and reservoirs across North America, South America, Europe, Asia, and Oceania (Table 1). Landsat data were selected because they provide long-term, publicly available data record, and fine thermal spatial resolution of 30 m compared with many other satellite platforms such as MODIS and GOES. This makes them particularly suitable for monitoring water surface temperature in small, medium, and large lakes and reservoirs. We used this diverse dataset to assess satellite-derived Ts_sat against in situ Ts_m across hydroclimatic conditions and to develop general (i.e., Global) and climate-zone-based correction methods to improve satellite-derived Ts_sat estimates and, in turn, evaporation calculations. The flowchart in Figure 1 illustrates the overall methodological framework, including the development and independent validation of the two correction methods and their integration into the TEAREE model for daily evaporation estimation.
Reservoirs and lakes are identified specifically in Table 1, but here we refer to both natural and artificial bodies of water as lakes. The 30 lakes were classified into four major climatic zones, arid/semi-arid, tropical, temperate, and continental/boreal, based on the Köppen–Geiger climate classification [39]. Of the 30 lakes, 22 were used to develop transferable satellite-derived Ts_sat correction relationships using linear regression to estimate Ts for each pixel in the lake satellite temperature map, while reserving the remaining eight lakes, two from each climatic zone, for independent validation. The validation lakes were selected based on the availability of corresponding satellite-derived Ts_sat and in situ Ts_m observations and to ensure representation of all four climatic zones. This development-validation structure was designed to evaluate whether correction relationships developed across multiple lakes and climatic conditions could transfer to independent lakes not used in model development (Ts_sat correction relationship).
The in situ Ts_m and related meteorological data were collected from various field monitoring efforts and published datasets. Measurements for Elephant Butte and Caballo lakes were obtained from field monitoring conducted as part of previous reservoir evaporation studies [24]. Data for Lake Okeechobee were obtained from the U.S. Geological Survey (USGS) monitoring program at the LZ40 platform [40], while observations for Lake Mead and Lake Mohave were obtained from the USGS/Reclamation evaporation monitoring program [41]. Data for Lake Powell and Cochiti Lake were obtained from the U.S. Bureau of Reclamation Information Sharing Environment (RISE) database. White Bear Lake observations were obtained from the field dataset reported by Xiao et al. [16]. For the remaining lakes, in situ Ts_m and meteorological observations were obtained from the global lake dataset compiled by [42], which includes high-frequency measurements from instrumented lakes distributed across multiple continents. These datasets provided in situ Ts_m observations for comparison with satellite-derived Ts_sat and the meteorological observations for TEAREE evaporation estimation.
The satellite-derived Ts_sat was obtained from Landsat 5, 8, and 9 Collection 2 Level-2 surface temperature products and processed using Google Earth Engine (GEE). For each lake, the Landsat image collections were first filtered based on the observation period, and satellite sensor availability. Pixels affected by cloud, cloud-shadow, and cirrus clouds were excluded. Subsequently, the Modified Normalized Difference Water Index (MNDWI) was used to delineate the waterbody boundary and exclude non-water pixels from satellite-derived water surface temperature extraction. To reduce potential land contamination, a one-pixel along the lake shoreline was excluded from satellite temperature extraction. However, this exclusion was not applied to White Bear Lake, an independent validation lake, because it’s in situ monitoring location was close to the shoreline, and applying the exclusion would have removed all valid pixels within the sampling window. Only valid water pixels within the delineated lake boundaries were considered for satellite temperature extraction. Processing of the Landsat Collection 2 Level-2 surface temperature data, including conversion of the satellite image Digital Number (DN) values to physical temperature, followed the procedure described in the original TEAREE model study by Kirupairaja and Bawazir [24].
In order to compare satellite-derived Ts_sat with in situ Ts_m, the satellite-derived Ts_sat was extracted by averaging the available valid pixels within a 3 × 3-pixel window centered on the corresponding in situ measurement location, with exception of small lakes (Lake Annie, White Bear Lake, Crampton Lake, and West Twin Lake). Given the resampled 30-m spatial resolution of Landsat surface temperature products, this window covered an area of 90 × 90 m. An automated Python-based GEE workflow was developed to perform these processing and extraction steps consistently across the 30 study lakes.
Method 1 – Global Ts correction
All satellite-derived Ts_sat and in situ Ts_m observations from the 22 development lakes (n = 375 sample days) were combined into a single dataset. The satellite-derived Ts_sat values (3 x 3 pixels) were paired with the corresponding in situ measurements (Ts_m) at the Landsat overpass time, and a linear regression relationship was developed. The Ts_m measurements were considered the dependent variable and satellite-derived Ts_sat as the independent variable:
where Ts_m is the measured in situ water surface temperature (°C), Ts_sat is the raw satellite-derived water surface temperature (°C), and a & b are the regression coefficients.
The resulting global correction relationship (Equation 1) was then applied independently to each valid Landsat water pixel within the boundaries of the eight validation lakes to generate spatially distributed corrected satellite-derived water surface temperature (T0s_sat). To evaluate the performance and transferability of the global correction at the eight validation lakes, T0s_sat was extracted by averaging the available valid pixels within a 3 × 3-pixel window centered on the in situ measurement location and compared with the corresponding in situ Ts_m at the Landsat overpass time.
Method 2 – Climate-zone-based Ts correction
Method 2 was developed to account for differences in satellite-derived Ts_sat bias among climatic regions. The development lakes were grouped into four climatic zones: tropical, arid/semi-arid, temperate, and continental/boreal. The lakes assigned to each climate zone and their roles in correction model development and validation are summarized in Table 2. Within each climatic zone, the corresponding satellite-derived Ts_sat and in situ Ts_m observations from the development lakes were combined, and a separate linear regression relationship was developed to correct satellite-derived Ts_sat for each climatic zone, following the same functional form as Equation (1).
Two lakes from each climate zone were reserved for independent validation, resulting in eight validation lakes in total. For each validation lake, the correction relationship corresponding to its climatic zone was applied independently to each valid Landsat water pixel within the lake boundary to generate a spatially distributed corrected satellite-derived T0s_sat. At each validation lake, corrected satellite-derived T0s_sat from the valid 3 × 3-pixel window centered on the in situ measurement location was compared with concurrent in situ Ts_m to evaluate the performance and transferability of the corresponding climate-zone-based correction.
2.1. TEAREE Evaporation Estimation
The corrected satellite-derived T0s_sat data obtained from Methods 1 and 2 were used as inputs to the TEAREE model described by Kirupairaja and Bawazir [24]. Although both correction methods improve only the satellite-derived Ts_sat input to TEAREE, the subsequent evaporation calculations remained the same as the original TEAREE framework. Thus, all TEAREE model formulations and parameterizations were kept unchanged between the two correction approaches, and only the corrected satellite-derived T0s_sat input differed. For comparison, we used the original TEAREE approach as a reference benchmark in which satellite-derived Ts_sat is corrected using concurrent local in situ Ts_m measurements. For each of the eight validation lakes, a separate site-specific Ts correction relationship was developed following the procedure described in Kirupairaja and Bawazir [24]. These site-specific relationships were used only to establish the reference benchmark and were not used in the development or application of Methods 1 and 2.
TEAREE was then applied at the eight independent validation lakes using four Ts inputs: (1) uncorrected satellite-derived Ts_sat, (2) corrected satellite-derived T0s_sat using Method 1, (3) corrected satellite-derived T0s_sat using Method 2, and (4) corrected satellite-derived T0s_sat using the site-specific benchmark. The resulting spatially distributed daily evaporation estimates were compared with daily evaporation estimated using the bulk aerodynamic (B_AER) method based on in situ measurements at the eight independent validation lakes, as described in the following section.
For each lake, TEAREE evaporation was extracted by averaging the available valid pixels within a 3 × 3-pixel window centered on the measurement location and compared with the corresponding estimated daily evaporation. Model performance was assessed using slope, intercept, R², RMSE, bias, Nash–Sutcliffe efficiency (NSE), and Kling-Gupta efficiency (KGE). Following Moriasi et al. [43], NSE was also used to classify model performance as very good (0.75 < NSE ≤ 1.00), good (0.65 < NSE ≤ 0.75), satisfactory (0.50 < NSE ≤ 0.65), or unsatisfactory (NSE ≤ 0.50). In addition to NSE, KGE was used to evaluate the agreement between simulated and observed time series by considering correlation, bias, and variability [44].
2.2. Daily Evaporation Estimation Using the Bulk Aerodynamic Method
Daily reference evaporation was estimated using the B_AER method based on in situ Ts_m and meteorological measurements collected at the validation lakes. The B_AER method was selected because of its demonstrated reliability and relatively simple application using routinely measured meteorological parameters and Ts_m [45,46,47]. Previous studies have reported good agreement between B_AER and EC evaporation [47]. According to Kirupairaja and Bawazir [24], TEAREE model demonstrated strong agreement with B_AER evaporation estimates across 12 lakes under different climatic conditions (R² = 0.91-0.99 and RMSE = 0.27-0.85 mm/day), with additional validation against EC measurements. Therefore, B_AER was used as a consistent reference method for evaluating the effects of the proposed satellite-derived Ts_sat correction approaches on TEAREE daily evaporation estimates. Assuming the neutral atmospheric stability, the reference B_AER evaporation was estimated using the formulation described in Kirupairaja and Bawazir [24]:
where E is the daily evaporation rate [LT-1], k is von Karman’s constant (0.41), and are the densities [ML-3] of air and water, respectively, P is the atmospheric pressure [ML-1T-2], z is the wind speed measurement height (10 m) [L], d is the zero-plane displacement height (0 m) [L], zo is the roughness height of the surface (0.00023 m) [L], U10 is the wind speed at 10 m above the water surface [LT-1], es and ea are saturated and actual vapor pressure, respectively [ML-1T-2], RH is the relative humidity (%), and T is the temperature used to estimate saturation vapor pressure in degree Celsius [Θ]. The es was calculated using water surface temperature, whereas the ea was calculated using air temperature and relative humidity. For the B_AER reference method, the measured in situ Ts_m was used to calculate es, while Ts_sat was used in the corresponding TEAREE evaporation calculations. The evaporation rate calculated using Equation (2) was converted from m s⁻¹ to mm/day by multiplying by 8.64 × 10⁷.
3. Results and Discussion
The results of this study are presented in the following sections: Section 3.1 examines the differences between satellite-derived Ts_sat and in situ Ts_m across 30 lakes in four climatic zones. Section 3.2 presents the development of global and climate-zone-based Ts correction relationships using observations from 22 study lakes. Section 3.3 evaluates the performance of these correction approaches using independent in situ Ts_m observations from eight validation lakes. Section 3.4 assesses the effects of the temperature corrections on TEAREE daily evaporation estimates at the eight validation lakes. The evaporation estimates obtained using different Ts correction methods are evaluated against B_AER evaporation estimates, and their performance is further compared with that of the site-specific temperature correction approach.
3.1. Satellite-Derived Water Surface Temperature Bias Across Lakes and Climatic Zones
Satellite-derived Ts_sat were compared with respective measured Ts_m across all 30 lakes, using linear regression, to characterize the magnitude and climatic dependence of the systematic bias. The results of the comparison are shown in Figure 2 and Table 3. Across the pooled dataset (n = 627 sample days), satellite-derived Ts_sat captured the observed temporal variability well (R² = 0.94). However, satellite-derived Ts_sat systematically overestimated measured Ts_m, with a pooled mean bias of +1.53 °C. A two-sided one-sample t-test confirmed that the mean bias differed significantly from zero (p < 0.001), while the RMSE was 2.43 °C. This bias is consistent with the systematic overestimation observed at Elephant Butte and Caballo Reservoirs [24]. Consequently, direct use of uncorrected satellite-derived Ts_sat in the TEAREE framework may introduce systematic error because Ts_sat errors propagate into vapor pressure calculations and ultimately into daily evaporation estimates.
The magnitudes of the bias, however, were not uniform across climatic zones (Figure 2b; Table 3). The largest and most consistent overestimation occurred in the arid/semi-arid zone (bias = +2.23 °C; RMSE = 2.73 °C; n = 390 days). This larger positive bias is likely associated with stronger daytime surface heating and greater satellite-derived Ts_sat and in situ Ts_m differences during the satellite overpass. The temperate (bias = +0.51 °C) and continental/boreal (bias = +0.55 °C) zones exhibited smaller but still statistically significant positive biases (p < 0.05). In contrast, the tropical zone showed a small negative bias (−0.39 °C) that was not statistically different from zero (p = 0.14), and exhibited the lowest RMSE among the four climatic zones (1.59 °C). However, the tropical zone contained considerably fewer observations (n = 36 days) than the other climatic zones, and therefore, this result should be interpreted with caution. Moreover, the near-zero mean bias at tropical zone does not necessarily indicate good agreement between satellite-derived Ts_sat and in situ Ts_m. The regression slope of 0.81 indicates that satellite-derived Ts_sat showed smaller temperature changes than the in situ Ts_m across the observed temperature range, despite the relatively small mean bias.
A one-way analysis of variance further confirmed that the mean bias differed significantly among climatic zones (F-statistic = 64.35, p < 0.001). These findings demonstrate that satellite-derived Ts_sat bias varies among climatic regions and suggest that a single global correction relationship may not perform equally across all climatic conditions. Collectively, these findings provide the scientific basis for the proposed Ts_sat correction framework. First, the statistically significant systematic bias observed across the pooled dataset demonstrates that correction of satellite-derived Ts_sat is necessary before applying the TEAREE model (Method 1). Second, the significant differences in bias magnitude among climate zones support the development of climate-zone-based Ts_sat correction relationships (Method 2).
The observed error magnitudes are comparable to those previously reported for satellite-derived Ts_sat over inland and coastal waters. Kozlov et al. [48] reported RMSD of ≤ 1.31 °C for MODIS sea surface temperature in the Baltic Sea; while Virdis et al. [35] found an RMSE of 2.34 °C across Italian lakes. Tavares et al. [25] reported errors approximately 1.05 °C for Landsat 7 ETM+ over a shallow subtropical lake. In addition, Zhao et al. [26] documented that MODIS-derived Ts_sat are generally biased and require empirical correction before use in evaporation modeling. These studies indicate that the discrepancies observed in the present study are not unique to a single reservoir or dataset, however, represent a systematic bias of satellite-derived Ts_sat that has been widely reported across diverse aquatic environments. The observed systematic bias is particularly important for evaporation estimation because the TEAREE model directly uses Ts_sat to calculate the saturation vapor pressure at the air–water interface.
3.2. Water Surface Temperature Correction Relationships
Following characterization of the uncorrected satellite-derived Ts_sat bias, the global Ts_sat correction relationship (Method 1) was developed using observations from the 22 development lakes (n = 375 sample days). The resulting regression explained 95% of the variability in measured Ts_m (R² = 0.95) with standard error of estimate (SEE) of 1.59 °C (Table 4). The global correction relationship was expressed as Ts_m = 0.97∙Ts_sat - 0.55; a single transferable equation for adjusting satellite-derived Ts_sat across lakes without in situ Ts_m observations.
Separate correction relationships were subsequently developed for each climate-zone under Method 2, and the resulting regression equations are summarized in Table 4. The correction relationships differed among climate zones, indicating that the systematic bias in satellite-derived Ts_sat varies with climatic conditions. The temperate zone relationship was closest to the 1:1 line, with a slope of 0.99 and an intercept of −0.52 °C, indicating that relatively small adjustments were required. However, the tropical zone relationship showed the lowest slope (0.91) and the largest positive intercept (+1.99 °C). Overall, these differences provide further justification for evaluating climate-zone-based correction relationships against the global correction approach at independent validation lakes. Although the tropical correction relationship showed reasonable agreement with measured Ts_m (R2 = 0.79; SEE = 1.10 °C), it was developed from only 16 observations across three lakes. Therefore, the tropical-zone relationship is subject to greater uncertainty than those developed from the larger climate-zone datasets, and additional observations from tropical lakes would be valuable for evaluating its robustness and broader transferability.
3.3. Independent Validation of Corrected Water Surface Temperature
The global and climate-zone-based correction relationships were independently evaluated using in situ Ts_m observations from the eight validation lakes. Across the pooled validation dataset (n = 247 sample days), uncorrected satellite-derived Ts_sat showed an RMSE of 2.92 °C and R2 of 0.9352 compared to in situ measurement of Ts_m (Figure 3a). Application of the Method 1 reduced the pooled RMSE to 2.15 °C, corresponding to a 26% reduction relative to the uncorrected satellite-derived Ts_sat. The Method 2 reduced RMSE to 1.87 °C, representing a 36% reduction, while increasing R2 to 0.9520 (Figure 3b,c). The Method 2 regression was also close to the 1:1 relationship, with a slope of 1.00 and an intercept of 0.83 °C, indicating improved overall agreement between corrected satellite-derived T0s_sat and in situ Ts_m across the independent validation dataset.
At the individual lake scale, the magnitude of improvement varied among sites (Table 5 and Table 6; Figure 3d). Method 2 reduced RMSE relative to uncorrected satellite-derived Ts_sat at four of the eight validation lakes: Elephant Butte Reservoir, Lake Mead, Lake Okeechobee, and Lake Pyhajarvi. In contrast, Method 2 did not reduce RMSE at Corumba Lake, Manso Lake, Lake Taupo, and White Bear Lake. At Corumba Lake, Manso Lake, and Lake Taupo, uncorrected satellite-derived Ts_sat already exhibited relatively low RMSE values of 0.40 °C, 1.22 °C, and 0.59 °C, respectively, leaving less scope for further error reduction through bias correction. Application of either correction increased RMSE at these sites. However, Method 2 produced lower RMSE than Method 1 at each of these three lakes. The relatively small validation datasets at these sites (n = 6, 10, and 11 sample days, respectively) also increase uncertainty in the lake-specific performance statistics, and these results should therefore be interpreted cautiously.
White Bear Lake exhibited a distinctly different response. Uncorrected satellite-derived Ts_sat showed an RMSE of 4.17 °C. Method 1 reduced the RMSE to 3.03 °C, whereas Method 2 slightly increased the RMSE to 4.24 °C. The in situ Ts_m observations at White Bear Lake were collected close to the shoreline, where in situ Ts_m could be strongly influenced by shallow water heating, cooling, and local mixing compared to more open-water locations. Such site-specific conditions may contribute to discrepancies that are not represented by a generalized continental/boreal correction relationship. However, the available data were insufficient to determine whether these site-specific factors were responsible for the observed discrepancies. In addition, the relatively small validation dataset (n = 15 sample days) limits the robustness of the lake-specific performance.
Overall, Method 2 produced a lower RMSE than Method 1 at seven of the eight independent validation lakes. These results indicate that Method 2 correction improves overall transferable performance relative to Method 1 but does not uniformly improve satellite-derived Ts_sat estimates at every lake. The lake-level variability further suggests that climate classification alone does not capture all site-specific factors influencing discrepancies between satellite-derived Ts_sat and in situ Ts_m.
3.4. TEAREE Evaporation Validation at the Independent Lakes
Daily TEAREE evaporation estimated using uncorrected, globally corrected, climate-zone- based corrected, and site-specific corrected satellite-derived T0s_sat was evaluated against estimated B_AER evaporation at eight independent lakes (n = 229 sample days; Table 7; Figure 4 and Figure 5). Correcting the satellite-derived Ts_sat substantially improved TEAREE evaporation estimates. At the pooled scale, RMSE decreased from 1.37 mm/day with uncorrected satellite-derived Ts_sat to 0.81 mm/day with Method 1 and 0.62 mm/day with Method 2, corresponding to reductions in RMSE of 41% and 55%, respectively. Similarly, mean bias decreased from +0.82 mm/day to +0.19 and +0.12 mm/day with Method 1 and Method 2, respectively. The site-specific correction benchmark provided the lowest RMSE of 0.49 mm/day, representing a 64% reduction in RMSE relative to the uncorrected satellite-derived Ts_sat, and nearly eliminated the pooled bias (+0.02 mm/day). Importantly, Method 2 approached the performance of the site-specific correction benchmark, without requiring lake-specific in situ Ts_m measurements for correction. The pooled RMSE of Method 2 was only 0.13 mm/day higher than that of the site-specific correction (0.62 vs. 0.49 mm/day), with high NSE (0.95) and KGE (0.94) values. In addition, the regression slope improved from 1.24 for uncorrected Ts_sat to 1.02 for Method 2, approaching the site-specific benchmark slope of 1.00 (Table 7).
At the individual-lake scale (Figure 4), evaporation estimates obtained using Method 2 generally followed the B_AER evaporation closely and remained near the 1:1 line across most validation lakes. Method 2 also performed consistently well, achieving a “very good” rating at seven of the eight lakes and a “good” rating at Manso Lake, Brazil based on the NSE performance criteria of Moriasi et al. [43]. In contrast, Method 1 was rated “unsatisfactory” at the two tropical lakes, the Corumba and Manso, Brazil; this may be due to only 6 and 11 days, respectively, of available data for validation. The RMSE values obtained using Method 2 were also within the general range of site-specific TEAREE performance (0.27-0.85 mm/day) as reported by Kirupairaja and Bawazir [24] for 12 lakes. Together, these results demonstrate that a substantial portion of the evaporation estimation performance, achieved through site-specific correction, can be retained using a transferable Method 2 without requiring in situ Ts_m measurements.
The lake-level results further demonstrate the importance of accounting for regional differences in satellite-derived Ts_sat bias (Figure 5). Method 2 produced substantial improvements at EBR, Lake Mead, Lake Okeechobee, Lake Taupo, and White Bear Lake relative to the uncorrected case. In contrast, Method 1 increased the RMSE at several validation lakes, including Corumba Lake, Manso Lake, Lake Taupo, and Lake Pyhäjärvi, indicating that a single generalized correction was not consistently effective across all sites. Method 2 generally mitigated these limitations of the global correction and produced lower evaporation RMSE than Method 1 at most validation lakes.
White Bear Lake remained an important exception, where both Method 1 and 2 reduced the error relative to the uncorrected case, but their performance remained poorer than that of the site-specific correction. Notably, Method 2 did not improve corrected satellite-derived T0s_sat RMSE at White Bear Lake, yet TEAREE evaporation RMSE decreased substantially relative to the uncorrected case. This indicates that improvements in evaporation performance are not necessarily proportional to reductions in T0s_sat RMSE alone, because T0s_sat interacts with the other meteorological inputs and nonlinear vapor-pressure calculations within TEAREE. However, Method 2 still showed higher evaporation error than the site-specific correction at White Bear Lake, indicating that Method 2 did not fully account for the local satellite-derived Ts_sat bias at this lake. This result suggests that site-specific correction may provide additional improvement at lakes where the local Ts_sat bias differs from the general bias pattern represented by the climate-zone based relationship.
The practical equivalence of the global (Method 1) and climate-zone-based (Method 2) corrections relative to the site-specific correction was further evaluated using two one-sided tests (TOST). Because no established equivalence threshold is available for daily reservoir evaporation, an equivalence margin of ±0.188 mm/day, corresponding to 5% of the pooled mean measured evaporation (3.75 mm/day), was selected to assess whether Method 1 and Method 2 achieved practically comparable evaporation estimates and absolute prediction errors relative to the site-specific correction. Two comparisons were performed: (i) the mean paired difference in daily evaporation estimates (Method 1 or Method 2 - site-specific), to assess differences in evaporation estimates between each correction method and the site-specific benchmark, and (ii) the mean paired difference in absolute prediction error (Method 1 or Method 2 absolute error − site-specific absolute error), to assess differences in prediction accuracy relative to measured evaporation. The absolute prediction error was calculated as the absolute difference between TEAREE evaporation by each method (Method 1, or Method 2, or site-specific correction) and the corresponding estimated B_AER daily evaporation.
At the pooled scale (n = 229), Method 2 met the equivalence criterion for both comparisons. The mean paired difference in evaporation estimates (Method 2 − site-specific) was +0.099 mm/day (90% confidence interval (CI): 0.054–0.143 mm/day; TOST p < 0.001), indicating that Method 2 estimated evaporation, on average, 0.099 mm/day higher than the site-specific benchmark. Similarly, the mean paired difference in absolute prediction error was +0.103 mm/day (90% CI: 0.067–0.138 mm/day; TOST p < 0.001), indicating that Method 2 had an average absolute prediction error 0.103 mm/day greater than the site-specific correction. Both confidence intervals were entirely within the selected equivalence bounds of ±0.1875 mm/day. In contrast, Method 1 did not establish equivalence for either comparison, as its 90% confidence intervals for evaporation estimates (0.112–0.241 mm/day; TOST p = 0.389) and absolute prediction error (0.191–0.292 mm/day; TOST p = 0.961) extended beyond the upper equivalence bound. These results indicate that, within the adopted 5% equivalence margin, Method 2 achieved practically comparable mean evaporation estimates and absolute prediction errors to the site-specific benchmark without requiring lake-specific in situ Ts_m measurements.
Overall, among the transferable correction approaches evaluated across the eight independent lakes, Method 2 provided the best TEAREE evaporation performance and approached the site-specific benchmark without requiring in situ Ts_m measurements at the validation lakes. Although climate-zone-based correction may not fully account for site-specific factors influencing satellite-derived Ts_sat bias at every lake, the independent validation results indicate that Method 2 provides a reasonable alternative when local in situ Ts_m measurements are unavailable. The approach substantially improved TEAREE evaporation performance and produced results comparable to the site-specific correction. The following is a summary of key findings in this study:
- The global (Method 1) correction relationship, developed using observations from 22 lakes, is expressed as Ts_m = 0.97∙Ts_sat - 0.55 (Table 4). The validation at eight lakes reduced the pooled RMSE of Ts from 2.92 °C (uncorrected) to 2.15 °C, representing a 26% reduction in RMSE.
- Climate-zone-based (Method 2) correction relationships were developed separately for each climatic zone as presented in Table 4. Independent validation reduced the pooled RMSE of Ts from 2.92 °C (uncorrected) to 1.87 °C after correction, a 36% reduction in RMSE. Method 2 performed better than Method 1 at seven of the eight validation lakes.
- Application of satellite water surface temperature correction Methods 1 and 2 reduced the pooled TEAREE daily evaporation RMSE of 8 validation lakes from 1.37 mm/day, using uncorrected Ts_sat, to RMSE of 0.81 and 0.62 mm/day, respectively. This corresponds to daily evaporation reductions of 41% and 55%, respectively. The statistical results are shown in Table 7. The TEAREE daily evaporation using Method 2 was comparable to that of using the site-specific temperature correction benchmark (NSE of 0.95 vs. 0.97).
- Both methods, global and climate-zone-based, can be used to correct Ts_sat where in situ measurements are not available. However, the climate-zone method of correcting Ts_sat performed better in estimating daily lake evaporation using the TEAREE model.
4. Conclusions
This study expands the TEAREE framework by developing methodologies to correct satellite-derived surface temperatures (Ts_sat) without reliance on in situ measurements. An analysis of 627 observations from 30 lakes across four climatic zones revealed a systematic climate-dependent bias in uncorrected Ts_sat of +1.53 °C with an RMSE of 2.43 °C when compared to in situ measurements. Methods 1 (global) and 2 (climate-zone-based) reduced RMSE from 2.92 to 2.15 °C and to 1.87 °C, respectively, achieving reductions of 26% and 36%. Integrating the corrected Tos_sat into TEAREE resulted in a decrease in evaporation RMSE by approximately 41% and 55%. Method 2 proved to be the most effective, yielding estimates comparable to site-specific benchmarks. Overall, these corrections lessen TEAREE's dependence on local temperature measurements while sustaining its performance. This enhancement broadens the applicability of TEAREE to lakes with available meteorological data but limited in situ temperature measurements. Although the proposed correction methods performed well across the eight independent validation lakes, the limited number of observations from tropical lakes should be considered when interpreting the results. Further research, especially in tropical regions, would bolster the validity and applicability of this approach.
Author Contributions
Conceptualization, A.S.B. and T.K.; methodology, A.S.B. and T.K.; software, A.S.B. and T.K.; validation, A.S.B. and T.K.; formal analysis, A.S.B. and T.K.; investigation, A.S.B. and T.K.; resources, A.S.B. and T.K.; data curation, A.S.B., T.K. and A.P.; writing-original draft preparation, A.S.B. and T.K.; writing-review and editing, A.S.B., T.K., A.P., G.C.A., E.I.B.; visualization, A.S.B. and T.K.; supervision, A.S.B.; project administration, A.S.B. and G.C.A.; funding acquisition, A.S.B. and G.C.A. All authors have read and agreed to the published version of the manuscript.
Funding
This research was funded by the U.S. Department of the Interior, Bureau of Reclamation, grant number R19AP00075.
Data Availability Statement
The data supporting the findings of this study are available from the corresponding author upon reasonable request.
Acknowledgments
This research was sponsored by the Science and Technology Program of the Bureau of Reclamation. The authors gratefully acknowledge the support of the National Science Foundation–New Mexico EPSCoR, New Mexico State University, the New Mexico Office of the State Engineer, the Elephant Butte Irrigation District, and the staff and officers of Elephant Butte Dam, Elephant Butte Lake State Park, and Caballo Lake State Park, particularly Chris Bolin, Kevin Wilcox, Austin Wilson, and Cody Creager. We acknowledge the following individuals for their contributions to this project: Juan Solis, Dagmar Llewellyn, Brent Tanzy, Benjamin Kalminson, David Park, Kathleen Holman, and Julia Klejmont. Special thanks are extended to Dr. R. Iestyn Woolway for kindly providing lake water temperature and meteorological datasets used in this study.
Conflicts of Interest
The authors declare no conflicts of interest.
References
- Tian, W.; Liu, X.; Wang, K.; Bai, P.; Liu, C.; Liang, X. Estimation of global reservoir evaporation losses. J. Hydrol. 2022, 607, 127524. [Google Scholar] [CrossRef]
- Zhao, G.; Gao, H. Estimating reservoir evaporation losses for the United States: Fusing remote sensing and modeling approaches. Remote Sens. Environ. 2019, 226, 109–124. [Google Scholar] [CrossRef]
- Rodrigues, I.S.; Costa, C.A.G.; Neto, I.E.L.; Hopkinson, C. Trends of evaporation in Brazilian tropical reservoirs using remote sensing. J. Hydrol. 2021, 598, 126473. [Google Scholar] [CrossRef]
- Zhao, G.; Li, Y.; Zhou, L.; Gao, H. Evaporative water loss of 1.42 million global lakes. Nat. Commun. 2022, 13(1), 3686. [Google Scholar] [CrossRef]
- Zhao, B.; Kao, S.C.; Zhao, G.; Gangrade, S.; Rastogi, D.; Ashfaq, M.; Gao, H. Evaluating enhanced reservoir evaporation losses from CMIP6-based future projections in the contiguous United States. Earth's Future 2023, 11(3), e2022EF002961. [Google Scholar] [CrossRef]
- Abtew, W. Evaporation estimation for Lake Okeechobee in South Florida. J. Irrig. Drain. Eng. 2001, 127(3), 140–147. [Google Scholar] [CrossRef]
- Alvarez, V.M.; González-Real, M.; Baille, A.; Martínez, J.M. A novel approach for estimating the pan coefficient of irrigation water reservoirs: Application to South Eastern Spain. Agric. Water Manag. 2007, 92(1-2), 29–40. [Google Scholar]
- Masoner, J.R.; Stannard, D.I.; Christenson, S.C. Differences in evaporation between a floating pan and class A pan on land 1. JAWRA J. Am. Water Resour. Assoc. 2008, 44(3), 552–561. [Google Scholar] [CrossRef]
- McJannet, D.; Cook, F.; Burn, S. Comparison of techniques for estimating evaporation from an irrigation water storage. Water Resour. Res. 2013, 49(3), 1415–1428. [Google Scholar] [CrossRef]
- Lenters, J.D.; Kratz, T.K.; Bowser, C.J. Effects of climate variability on lake evaporation: Results from a long-term energy budget study of Sparkling Lake, northern Wisconsin (USA). J. Hydrol. 2005, 308(1-4), 168–195. [Google Scholar] [CrossRef]
- Rosenberry, D.O.; Winter, T.C.; Buso, D.C.; Likens, G.E. Comparison of 15 evaporation methods applied to a small mountain lake in the northeastern USA. J. Hydrol. 2007, 340(3-4), 149–166. [Google Scholar] [CrossRef]
- Tanny, J.; Cohen, S.; Assouline, S.; Lange, F.; Grava, A.; Berger, D.; Teltch, B.; Parlange, M. Evaporation from a small water reservoir: Direct measurements and estimates. J. Hydrol. 2008, 351(1-2), 218–229. [Google Scholar] [CrossRef]
- Phillips, R.; Saylor, J.; Kaye, N.; Gibert, J. A multi-lake study of seasonal variation in lake surface evaporation using MODIS satellite-derived surface temperature. Limnology 2016, 17(3), 273–289. [Google Scholar] [CrossRef]
- El-Mahdy, M.E.-S.; Abbas, M.S.; Sobhy, H.M. Development of mass-transfer evaporation model for Lake Nasser, Egypt. J. Water Clim. Change 2021, 12(1), 223–237. [Google Scholar] [CrossRef]
- Nordbo, A.; Launiainen, S.; Mammarella, I.; Leppäranta, M.; Huotari, J.; Ojala, A.; Vesala, T. Long-term energy flux measurements and energy balance over a small boreal lake using eddy covariance technique. J. Geophys. Res. Atmos. 2011, 116(D2). [Google Scholar] [CrossRef]
- Xiao, K.; Griffis, T.J.; Baker, J.M.; Bolstad, P.V.; Erickson, M.D.; Lee, X.; Wood, J.D.; Hu, C.; Nieber, J.L. Evaporation from a temperate closed-basin lake and its impact on present, past, and future water level. J. Hydrol. 2018, 561, 59–75. [Google Scholar] [CrossRef]
- Assouline, S.; Li, D.; Tyler, S.; Tanny, J.; Cohen, S.; Bou-Zeid, E.; Parlange, M.; Katul, G.G. On the variability of the Priestley-Taylor coefficient over water bodies. Water Resour. Res. 2016, 52(1), 150–163. [Google Scholar] [CrossRef]
- Pérez, A.; Lagos, O.; Lillo-Saavedra, M.; Souto, C.; Paredes, J.; Arumí, J.L. Mountain lake evaporation: A comparative study between hourly estimations models and in situ measurements. Water 2020, 12(9), 2648. [Google Scholar] [CrossRef]
- Penman, H.L. Natural evaporation from open water, bare soil and grass. Proc. R. Soc. London. Ser. A Math. Phys. Sci. 1948, 120–145. [Google Scholar] [CrossRef]
- Priestley, C.H.B.; Taylor, R.J. On the assessment of surface heat flux and evaporation using large-scale parameters. Mon. Weather Rev. 1972, 100(2), 81–92. [Google Scholar] [CrossRef]
- Stannard, D.I.; Rosenberry, D.O. A comparison of short-term measurements of lake evaporation using eddy correlation and energy budget methods. J. Hydrol. 1991, 122(1-4), 15–22. [Google Scholar] [CrossRef]
- Farnsworth, R.K.; Thompson, E.S.; Peck, E.L. Evaporation Atlas Contiguous 48 U. S. 1982. [CrossRef]
- Harwell, G.R. Estimation of evaporation from open water-a review of selected studies, summary of US Army Corps of Engineers data collection and methods, and evaluation of two methods for estimation of evaporation from five reservoirs in Texas. Sci. Investig. Rep. 2012, 2012–5202. [Google Scholar]
- Kirupairaja, T.; Bawazir, A.S. A Simple Turbulent Exchange Approach for Estimating Reservoir Evaporation in Managing Water for Irrigation Using Remote Sensing and Ground Measurements. AgriEngineering 2026, 8(5), 169. [Google Scholar] [CrossRef]
- Tavares, M.H.; Cunha, A.H.F.; Motta-Marques, D.; Ruhoff, A.L.; Cavalcanti, J.R.; Fragoso, C.R., Jr.; Bravo, J. Martín; Munar, A.M.; Fan, F.M.; Rodrigues, L.H.R. Comparison of methods to estimate lake-surface-water temperature using Landsat 7 ETM+ and MODIS imagery: Case study of a large shallow subtropical lake in southern Brazil. Water 2019, 11(1), 168. [Google Scholar] [CrossRef]
- Zhao, G.; Gao, H.; Cai, X. Estimating lake temperature profile and evaporation losses by leveraging MODIS LST data. Remote Sens. Environ. 2020, 251, 112104. [Google Scholar] [CrossRef]
- Maleki, S.; Mohajeri, S.H.; Mehraein, M.; Sharafati, A. Lake evaporation in arid zones: Leveraging Landsat 8's water temperature retrieval and key meteorological drivers. J. Environ. Manag. 2024, 355, 120450. [Google Scholar] [CrossRef]
- Gorokhovich, Y.; Cawse-Nicholson, K.; Papadopoulos, N.; Oikonomou, D. Use of ECOSTRESS data for measurements of the surface water temperature: Significance of data filtering in accuracy assessment. Remote Sens. Appl. Soc. Environ. 2022, 26, 100739. [Google Scholar] [CrossRef]
- Brutsaert, W. History of the Theories of Evaporation—A Chronological Sketch, in Evaporation into the Atmosphere: Theory, History and Applications; Springer, 1982; pp. 12–36. [Google Scholar]
- Dias, N.L.; Hoeltgebaum, L.E.B.; Santos, I. STAEBLE: A surface-temperature-and available-energy-based lake evaporation model. Water Resour. Res. 2023, 59(3), e2022WR033012. [Google Scholar] [CrossRef]
- Dyba, K.; Ermida, S.; Ptak, M.; Piekarczyk, J.; Sojka, M. Evaluation of methods for estimating lake surface water temperature using Landsat 8. Remote Sens. 2022, 14(15), 3839. [Google Scholar] [CrossRef]
- Simon, R.N.; Tormos, T.; Danis, P.-A. Retrieving water surface temperature from archive LANDSAT thermal infrared data: Application of the mono-channel atmospheric correction algorithm over two freshwater reservoirs. Int. J. Appl. Earth Obs. Geoinf. 2014, 30, 247–250. [Google Scholar] [CrossRef]
- Jimenez-Munoz, J.C.; Sobrino, J.A.; Skoković, D.; Mattar, C.; Cristobal, J. Land surface temperature retrieval methods from Landsat-8 thermal infrared sensor data. IEEE Geosci. Remote Sens. Lett. 2014, 11(10), 1840–1843. [Google Scholar] [CrossRef]
- Piccolroaz, S.; Zhu, S.; Ladwig, R.; Carrea, L.; Oliver, S.; Piotrowski, A.; Ptak, M.; Shinohara, R.; Sojka, M.; Woolway, R. Lake water temperature modeling in an era of climate change: Data sources, models, and future prospects. Rev. Geophys. 2024, 62(1), e2023RG000816. [Google Scholar] [CrossRef]
- Virdis, S.G.; Soodcharoen, N.; Lugliè, A.; Padedda, B.M. Estimation of satellite-derived lake water surface temperatures in the western Mediterranean: Integrating multi-source, multi-resolution imagery and a long-term field dataset using a time series approach. Sci. Total Environ. 2020, 707, 135567. [Google Scholar] [CrossRef]
- Ptak, M.; Nowak, B.; Amnuaylojaroen, T. Climate-driven Evaporation Shifts in Temperate Lakes: Integrating CMIP6 Projections with Machine Learning Bias Correction. Earth Syst. Environ. 2026, 1–25. [Google Scholar] [CrossRef]
- Lazhu; Yang, K.; Qin, J.; Hou, J.; Lei, Y.; Wang, J.; Huang, A.; Chen, Y.; Ding, B.; Li, X. A Strict Validation of MODIS Lake Surface Water Temperature on the Tibetan Plateau. Remote Sens. 2022, 14(21), 5454. [Google Scholar] [CrossRef]
- Attiah, G.; Pour, H.K.; Scott, K.A. Four decades of lake surface temperature in the Northwest Territories, Canada, using a lake-specific satellite-derived dataset. J. Hydrol. Reg. Stud. 2023, 50, 101571. [Google Scholar] [CrossRef]
- Beck, H.E.; Zimmermann, N.E.; McVicar, T.R.; Vergopolan, N.; Berg, A.; Wood, E.F. Present and future Köppen-Geiger climate classification maps at 1-km resolution. Sci. Data 2018, 5(1), 180214. [Google Scholar] [CrossRef]
- Shoemaker, W.B.W.; Qinglong. Evaporation from the interior of Lake Okeechobee—A large freshwater lake in Florida, 2013–16; US Geological Survey: Reston, Virginia, 2024; p. 17. [Google Scholar]
- Bureau of Reclamation, Implementation Effects of New Evaporation Coefficients for Lake Mead and Lake Mohave: Lake Mead and Lake Mohave, Nevada and Arizona, Lower Colorado Basin Region; U.S. Department of the Interior, Bureau of Reclamation: Lower Colorado Basin Region, 2022.
- Woolway, R.I.; Verburg, P.; Lenters, J.D.; Merchant, C.J.; Hamilton, D.P.; Brookes, J.; de Eyto, E.; Kelly, S.; Healey, N.C.; Hook, S. Geographic and temporal variations in turbulent heat loss from lakes: A global analysis across 45 lakes. Limnol. Oceanogr. 2018, 63(6), 2436–2449. [Google Scholar] [CrossRef]
- Moriasi, D.N.; Arnold, J.G.; Van Liew, M.W.; Bingner, R.L.; Harmel, R.D.; Veith, T.L. Model evaluation guidelines for systematic quantification of accuracy in watershed simulations. Trans. ASABE 2007, 50(3), 885–900. [Google Scholar] [CrossRef]
- Gupta, H.V.; Kling, H.; Yilmaz, K.K.; Martinez, G.F. Decomposition of the mean squared error and NSE performance criteria: Implications for improving hydrological modelling. J. Hydrol. 2009, 377(1-2), 80–91. [Google Scholar] [CrossRef]
- Fournier, J.; Thiboult, A.; Nadeau, D.F.; Vercauteren, N.; Anctil, F.; Parent, A.C.; Strachan, I.B.; Tremblay, A. Evaporation from boreal reservoirs: A comparison between eddy covariance observations and estimates relying on limited data. Hydrol. Process. 2021, 35(8), e14335. [Google Scholar] [CrossRef]
- Guseva, S.; Armani, F.; Desai, A.R.; Dias, N.L.; Friborg, T.; Iwata, H.; Jansen, J.; Lükő, G.; Mammarella, I.; Repina, I. Bulk transfer coefficients estimated from eddy-covariance measurements over lakes and reservoirs. J. Geophys. Res. Atmos. 2023, 128(2), e2022JD037219. [Google Scholar] [CrossRef]
- Metzger, J.; Nied, M.; Corsmeier, U.; Kleffmann, J.; Kottmeier, C. Dead Sea evaporation by eddy covariance measurements vs. aerodynamic, energy budget, Priestley–Taylor, and Penman estimates. Hydrol. Earth Syst. Sci. 2018, 22(2), 1135–1155. [Google Scholar] [CrossRef]
- Kozlov, I.; Dailidienė, I.; Korosov, A.; Klemas, V.; Mingėlaitė, T. MODIS-based sea surface temperature of the Baltic Sea Curonian Lagoon. J. Mar. Syst. 2014, 129, 157–165. [Google Scholar] [CrossRef]
Figure 1.
Flowchart of global and climate-zone-based regression models for correcting raw satellite-derived water surface temperature in the TEAREE model to estimate daily evaporation.
Figure 1.
Flowchart of global and climate-zone-based regression models for correcting raw satellite-derived water surface temperature in the TEAREE model to estimate daily evaporation.
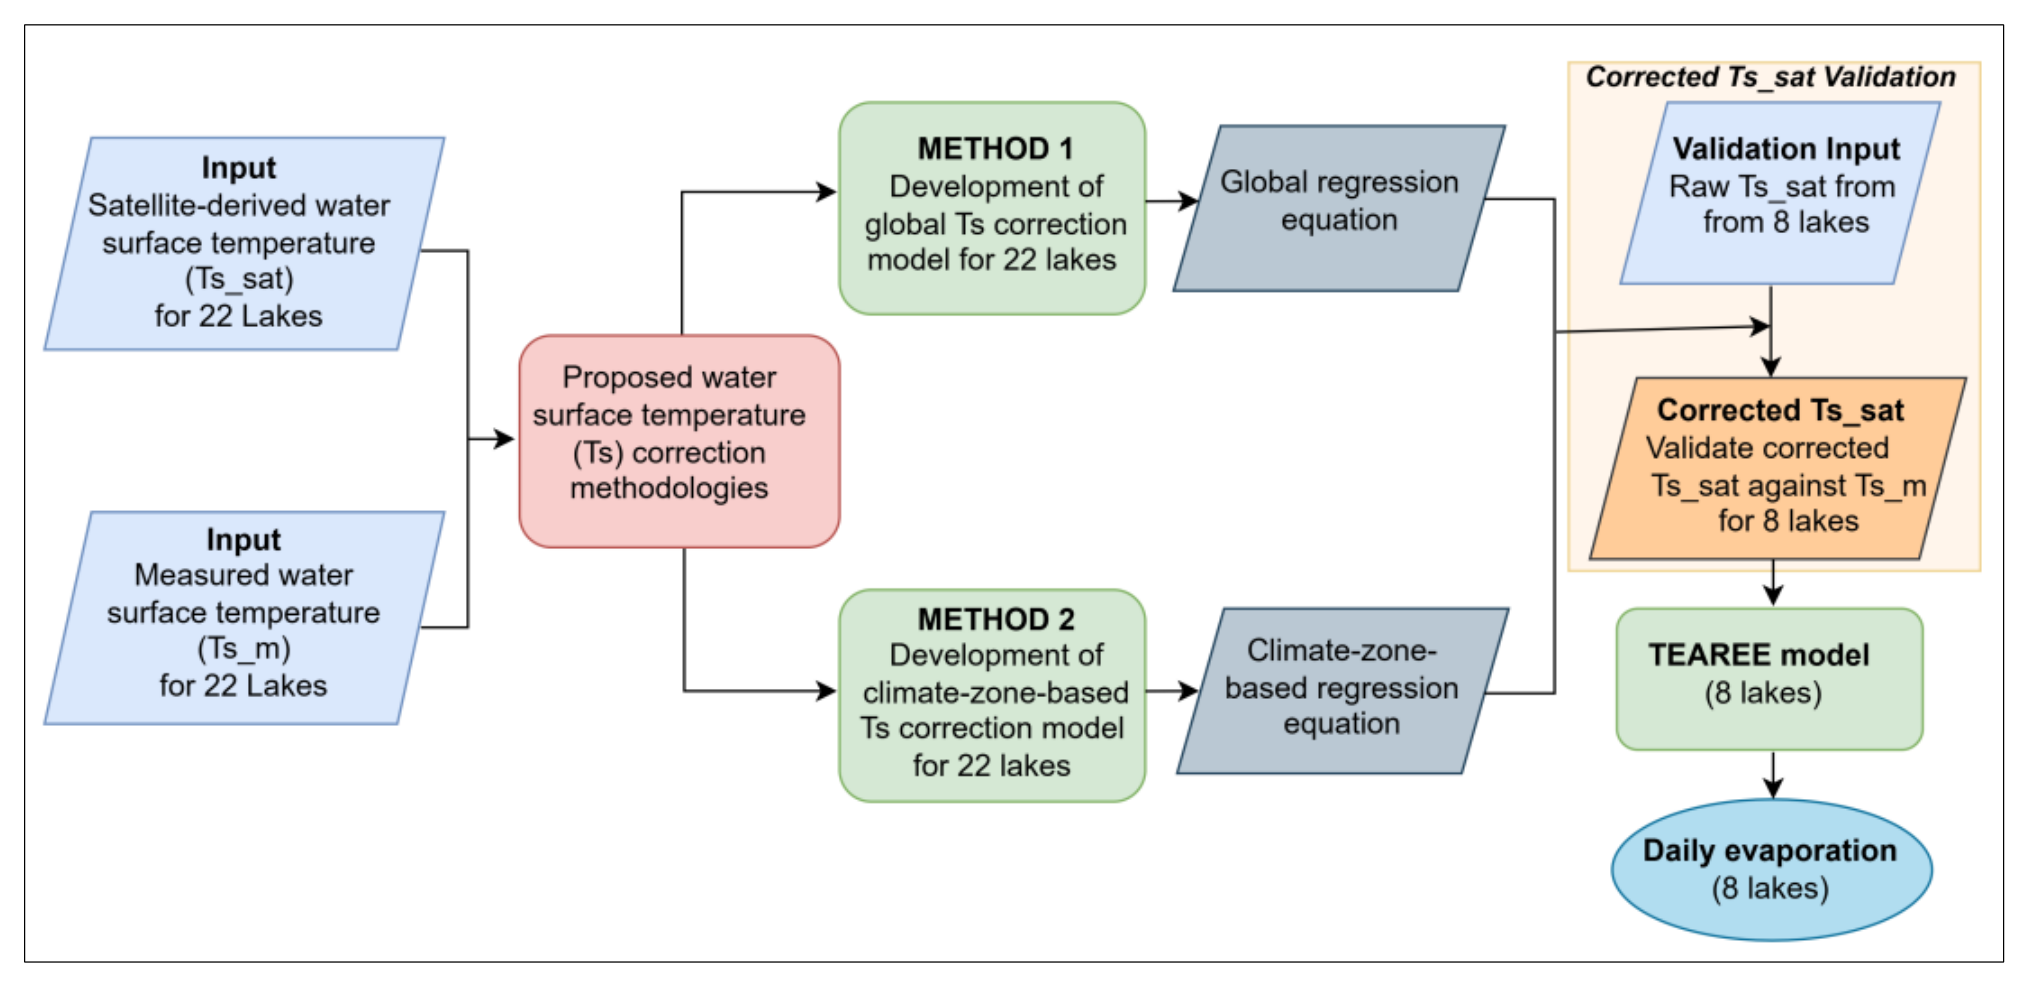
Figure 2.
Comparison of raw satellite-derived water surface temperature (Ts_sat) and measured water surface temperatures (Ts_m) across the 30 study lakes. (a) Pooled scatterplot colored by climatic zone; the dashed line is the 1:1 line and the solid line is the fitted regression. (b) Box plot of water surface temperature bias by climatic zone. Boxes represent the interquartile range (25th–75th percentiles), with horizontal lines indicating the median. Whiskers extend to the most extreme observations within 1.5 times the interquartile range, and open circles indicate outliers. The sample size (n) indicates the number of observations in each climatic zone.
Figure 2.
Comparison of raw satellite-derived water surface temperature (Ts_sat) and measured water surface temperatures (Ts_m) across the 30 study lakes. (a) Pooled scatterplot colored by climatic zone; the dashed line is the 1:1 line and the solid line is the fitted regression. (b) Box plot of water surface temperature bias by climatic zone. Boxes represent the interquartile range (25th–75th percentiles), with horizontal lines indicating the median. Whiskers extend to the most extreme observations within 1.5 times the interquartile range, and open circles indicate outliers. The sample size (n) indicates the number of observations in each climatic zone.
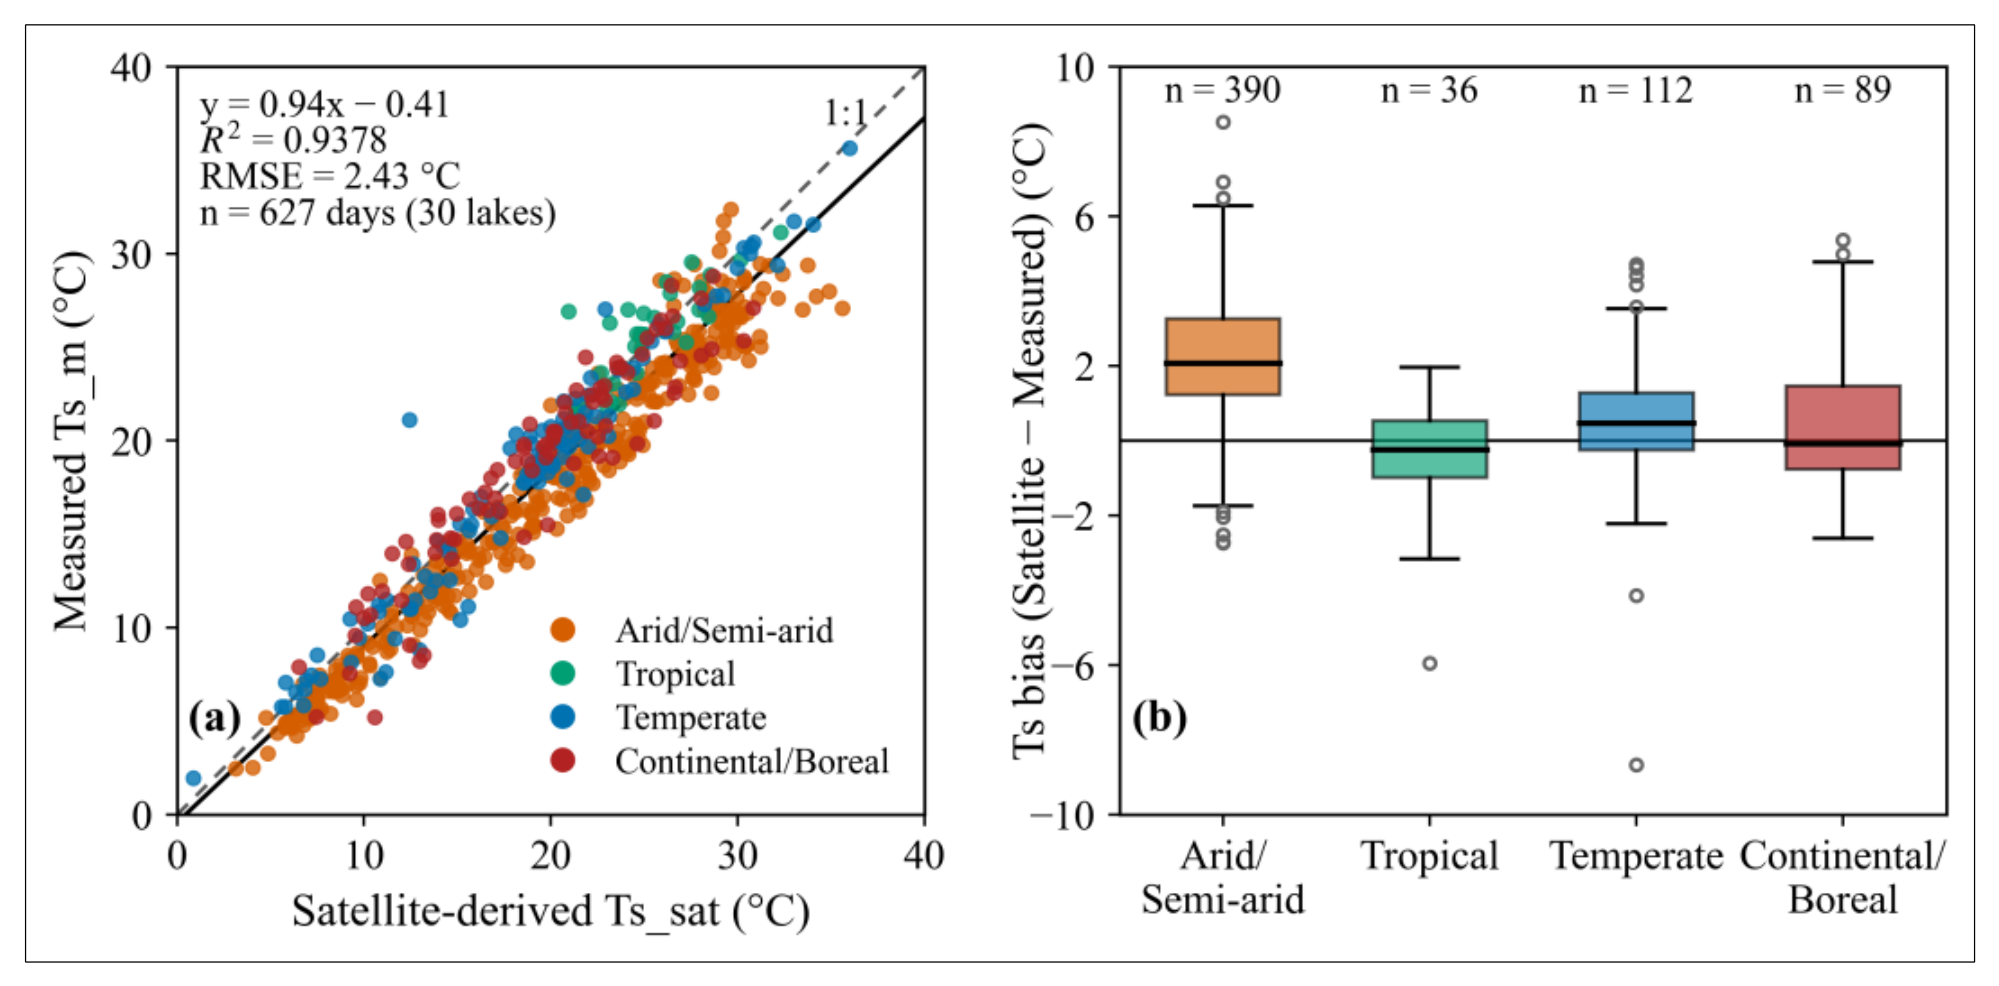
Figure 3.
Independent validation of satellite-derived water surface temperature at eight validation lakes. Panels (a–c) compare in situ temperature (Ts_m) with uncorrected satellite-derived temperature (Ts_sat), globally corrected temperature (T0s_sat), climate-zone-based corrected temperature (T0s_sat), respectively. Dashed lines represent the 1:1 relationship, and solid lines indicate fitted linear regressions. Panel (d) compares lake-specific root mean square errors (RMSE) among the three approaches.
Figure 3.
Independent validation of satellite-derived water surface temperature at eight validation lakes. Panels (a–c) compare in situ temperature (Ts_m) with uncorrected satellite-derived temperature (Ts_sat), globally corrected temperature (T0s_sat), climate-zone-based corrected temperature (T0s_sat), respectively. Dashed lines represent the 1:1 relationship, and solid lines indicate fitted linear regressions. Panel (d) compares lake-specific root mean square errors (RMSE) among the three approaches.
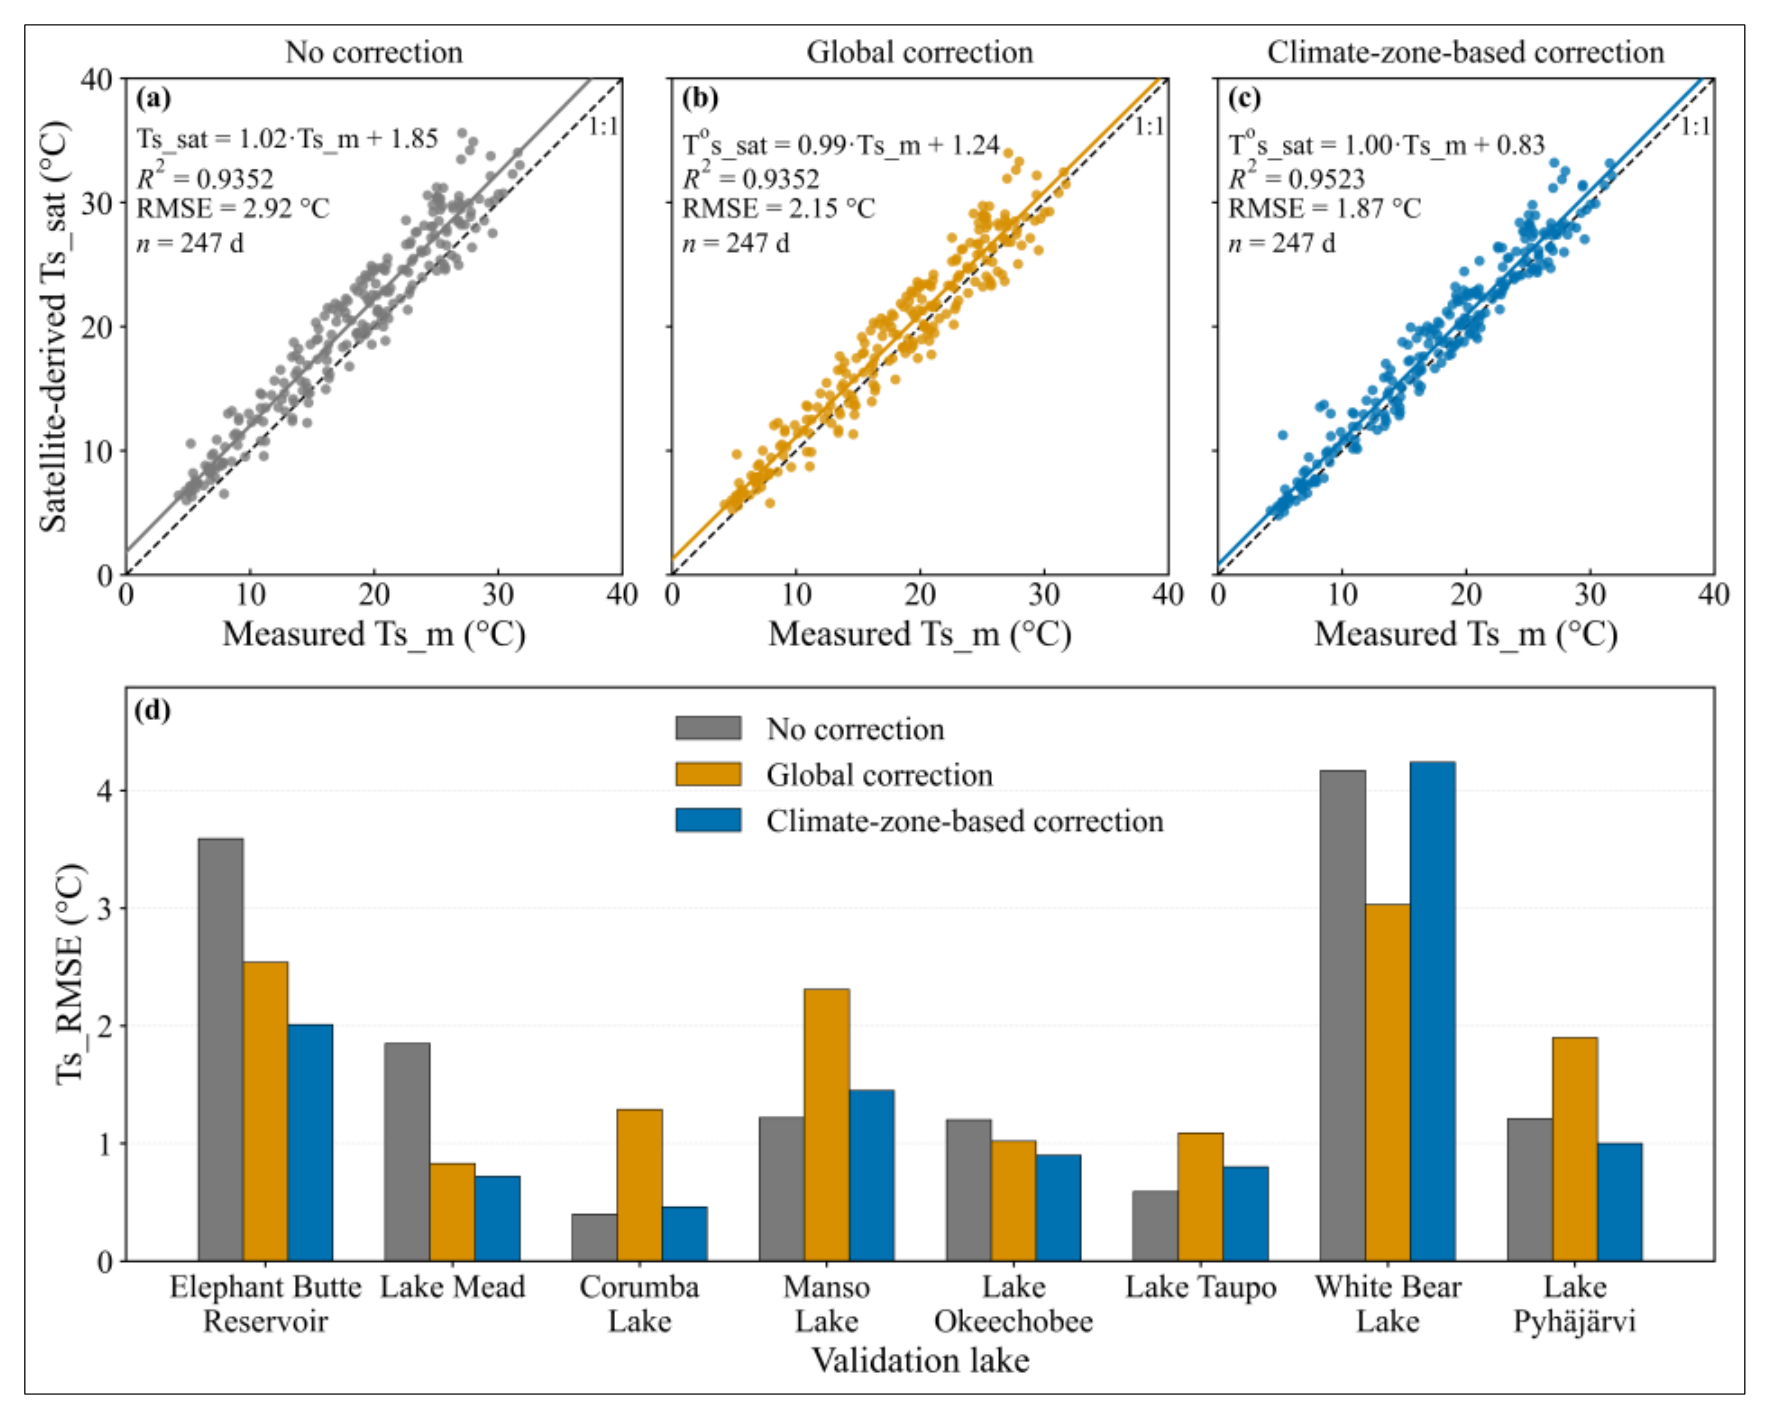
Figure 4.
Comparison of daily TEAREE evaporation estimates obtained using satellite-derived water surface temperatures corrected by the global (Open circles) and climate-zone-based (shaded circles) approaches against daily bulk aerodynamic (B_AER) evaporation at eight validation lakes. The solid black line represents the 1:1 relationship, while the dashed lines represent the corresponding fitted linear regressions.
Figure 4.
Comparison of daily TEAREE evaporation estimates obtained using satellite-derived water surface temperatures corrected by the global (Open circles) and climate-zone-based (shaded circles) approaches against daily bulk aerodynamic (B_AER) evaporation at eight validation lakes. The solid black line represents the 1:1 relationship, while the dashed lines represent the corresponding fitted linear regressions.
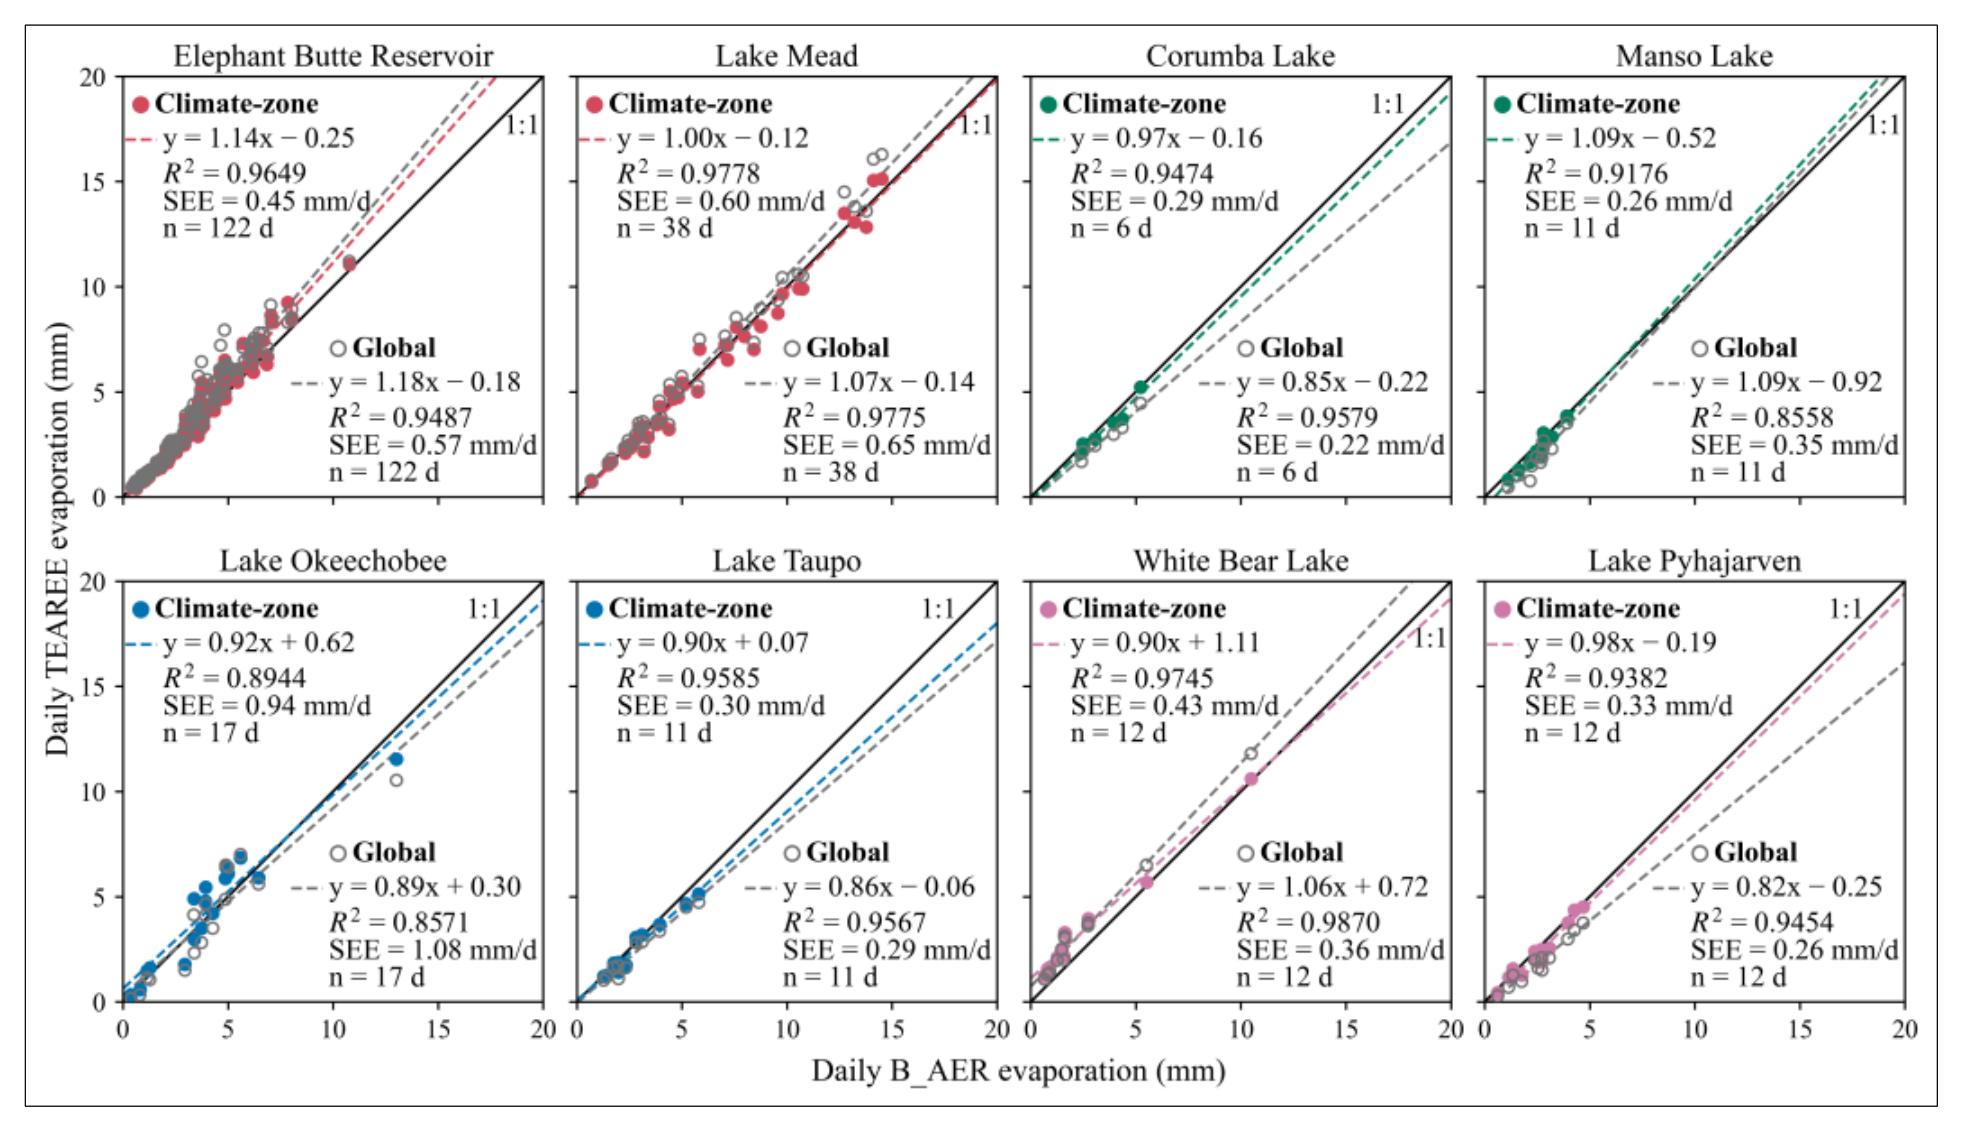
Figure 5.
Root mean square (RMSE) of daily TEAREE evaporation estimates using uncorrected, the globally corrected, the climate-zone-based corrected, and the site-specific corrected satellite-derived water surface temperature at eight validation lakes. The pooled RMSE was calculated using all available evaporation observations across the eight lakes. The vertical dashed line separates the individual lake results from the pooled evaluation.
Figure 5.
Root mean square (RMSE) of daily TEAREE evaporation estimates using uncorrected, the globally corrected, the climate-zone-based corrected, and the site-specific corrected satellite-derived water surface temperature at eight validation lakes. The pooled RMSE was calculated using all available evaporation observations across the eight lakes. The vertical dashed line separates the individual lake results from the pooled evaluation.
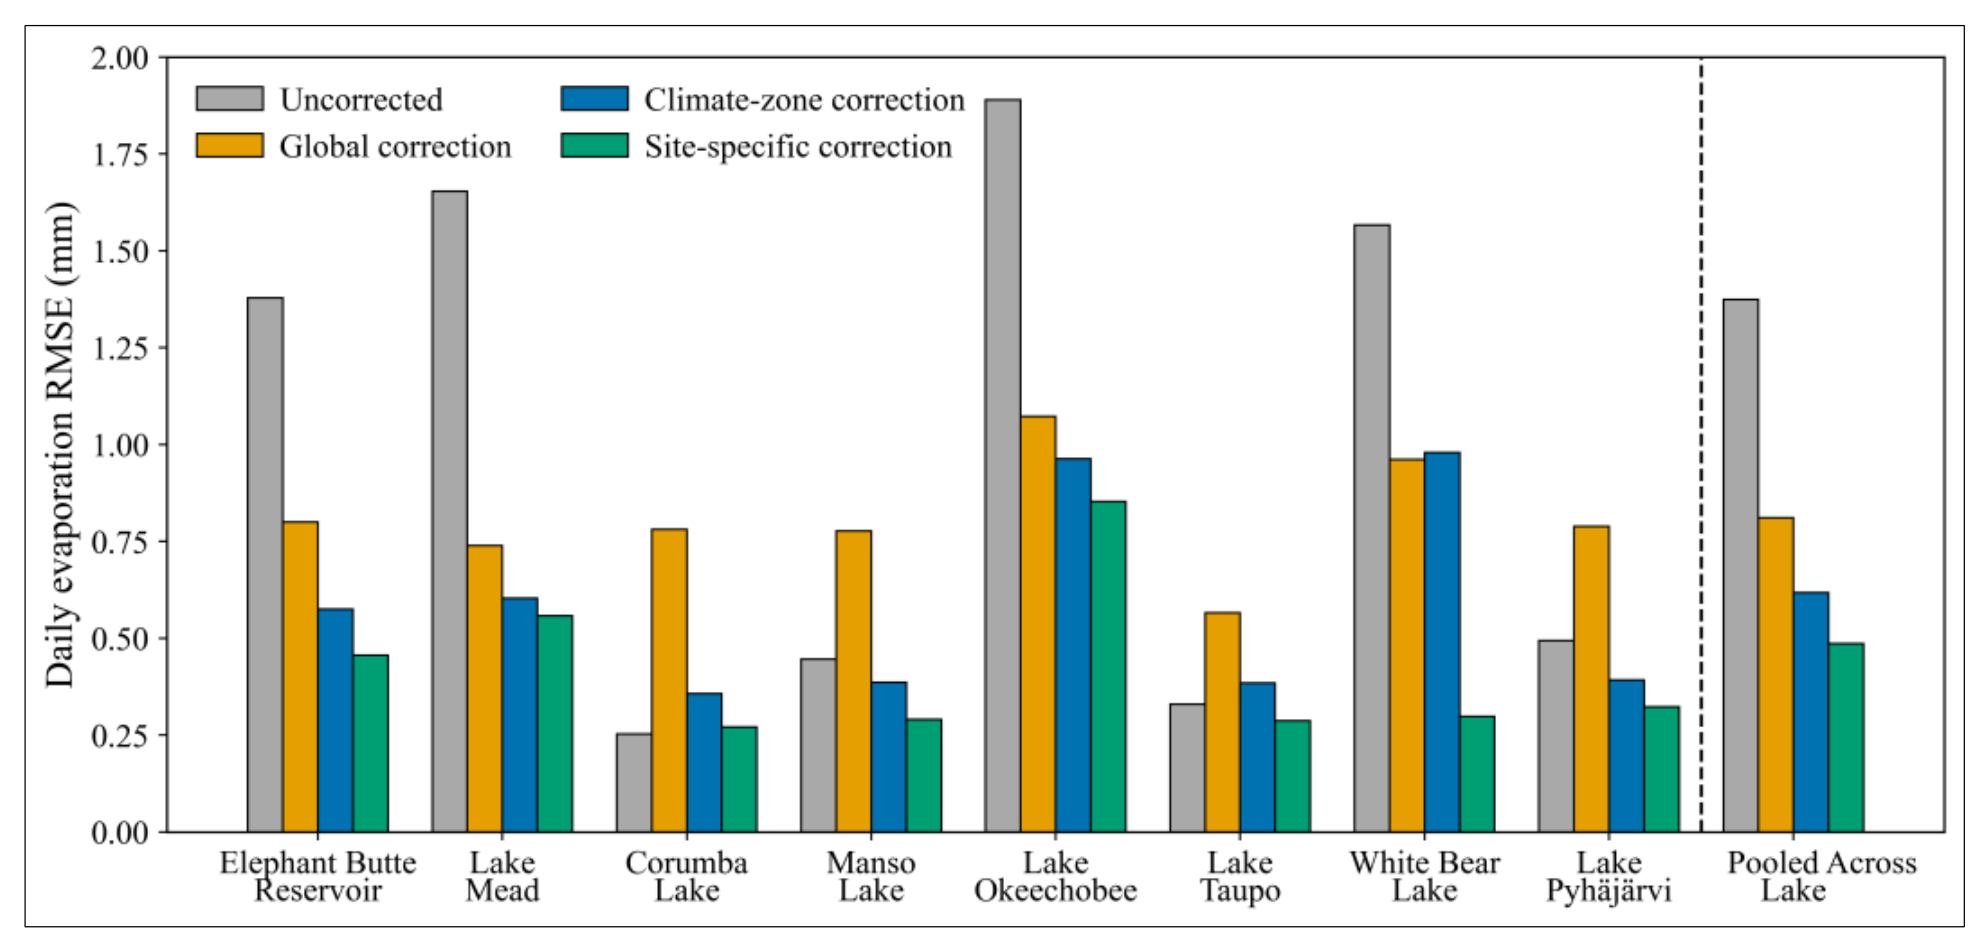

Table 1.
Geographic location, elevation, and surface area at full capacity of the lakes and reservoirs grouped by climate zone. The coordinates are reported in WGS84 (World Geodetic System 1984).
Table 1.
Geographic location, elevation, and surface area at full capacity of the lakes and reservoirs grouped by climate zone. The coordinates are reported in WGS84 (World Geodetic System 1984).
| Name | Country | Latitude | Longitude | Elevation (m) |
Surface Area (km²) |
|---|---|---|---|---|---|
| Arid/Semi-arid | |||||
| Elephant Butte Reservoir* | USA | 33° 09' 12.56" N | 107° 11' 28.25" W | 1343.0 | 147.7 |
| Caballo Reservoir* | USA | 32° 53' 47.04" N | 107° 17' 30.12" W | 1271.8 | 46.7 |
| Cochiti Lake* | USA | 35° 37′ 41.63″ N | 106° 19′ 01.92″ W | 1628.0 | 4.9 |
| Lake Mead* | USA | 36° 02′ 45.96″ N | 114° 44′ 30.12″ W | 375.0 | 637.1 |
| Lake Mohave* | USA | 35° 25′ 50.16″ N | 114° 39′ 06.84″ W | 197.2 | 114.0 |
| Lake Powell* | USA | 36° 56′ 15.14″ N | 111° 29′ 01.54″ W | 1127.8 | 689.0 |
| Tropical | |||||
| Lake Estreito* | Brazil | 20° 09′ 00.00″ S | 47° 15′ 36.00″ W | 622.5 | 46.7 |
| Lake Furnas* | Brazil | 20° 39′ 36.00″ S | 46° 18′ 00.00″ W | 768.0 | 1440.0 |
| Lake Itumbiara* | Brazil | 18° 24′ 36.00″ S | 49° 03′ 36.00″ W | 520.0 | 778.0 |
| Corumba Lake* | Brazil | 17° 46′ 12.00″ S | 48° 33′ 36.00″ W | 595.0 | 65.0 |
| Manso Lake* | Brazil | 14° 52′ 12.00″ S | 55° 46′ 12.00″ W | 289.8 | 427.0 |
| Temperate | |||||
| Lake Okeechobee† | USA | 26° 57′ 00.00″ N | 80° 49′ 59.88″ W | 4.3 | 1732.0 |
| Lake Annie† | USA | 27° 12′ 25.20″ N | 81° 21′ 03.60″ W | 33.7 | 0.4 |
| Lake Tahoe† | USA | 39° 05′ 21.37″ N | 120° 02′ 12.39″ W | 1897.0 | 497.3 |
| Lough Furnace† | Ireland | 53° 55′ 07.89″ N | 09° 34′ 18.84″ W | 3.9 | 1.5 |
| Lake Alexandrina† | Australia | 35° 26′ 02.40″ S | 139° 07′ 15.60″ E | 0.8 | 650.2 |
| Lake Taihu† | China | 31° 10′ 01.20″ N | 120° 09′ 00.00″ E | 3.0 | 2338.0 |
| Lake Taupo† | New Zealand | 38° 48′ 13.82″ S | 175° 54′ 00.95″ E | 357.2 | 622.0 |
| Continental/Boreal | |||||
| White Bear Lake† | USA | 45° 04′ 48.00″ N | 93° 00′ 00.00″ W | 281.7 | 9.7 |
| Acton Lake* | USA | 39° 34′ 13.50″ N | 84° 44′ 50.16″ W | 262.0 | 2.5 |
| Crampton Lake† | USA | 46° 12′ 36.00″ N | 89° 28′ 30.00″ W | 509.0 | 0.3 |
| Lake Mendota† | USA | 43° 06′ 20.23″ N | 89° 25′ 01.29″ W | 260.0 | 39.6 |
| Trout Lake† | USA | 46° 01′ 44.40″ N | 89° 39′ 54.00″ W | 495.0 | 15.6 |
| Lake Sunapee† | USA | 43° 23′ 11.49″ N | 72° 03′ 15.73″ W | 333.0 | 16.8 |
| West Twin Lake† | USA | 41° 11′ 52.80″ N | 81° 20′ 27.60″ W | 334.0 | 0.4 |
| Sparkling Lake† | USA | 46° 00′ 28.80″ N | 89° 42′ 03.60″ W | 508.0 | 0.6 |
| Lake Konnevesi† | Finland | 62° 36′ 00.00″ N | 26° 32′ 24.00″ E | 95.0 | 187.0 |
| Pyhäjärvi† | Finland | 61° 00′ 21.60″ N | 22° 16′ 40.80″ E | 45.0 | 155.0 |
| Lake Erken† | Sweden | 59° 50′ 45.60″ N | 18° 35′ 13.20″ E | 10.0 | 24.0 |
| Võrtsjärv† | Estonia | 58° 18′ 21.60″ N | 26° 02′ 06.00″ E | 33.7 | 270.7 |
* Reservoirs † Natural Lake.
Table 2.
Lakes used for climate-zone-based water surface temperature (Ts) correction model development and validation.
Table 2.
Lakes used for climate-zone-based water surface temperature (Ts) correction model development and validation.
| Climatic zone | Ts correction development lakes | Validation lakes |
| Arid/Semi-arid | Lake Mohave, Lake Powell, Cochiti Lake, and Caballo Reservoir | Elephant Butte Reservoir and Lake Mead |
| Tropical | Lake Estreito, Lake Itumbiara, Lake Furnas | Corumba Lake and Manso Lake |
| Temperate | Lake Tahoe, Lake Taihu, Lake Alexandrina, Lake Annie, and Lough Furnace | Lake Okeechobee and Lake Taupo |
| Continental/Boreal | Lake Erken, Lake Mendota, Trout Lake, Lake Sunapee, Võrtsjärv, Lake Konnevesi, Acton Lake, Crampton Lake, Sparkling Lake, West Twin Lake | White Bear Lake and Pyhäjärvi |
Table 3.
Statistical comparison of raw satellite-derived (Ts_sat) and measured water surface temperatures (Ts_m) by climate zone and all 30 study lakes. * Denotes bias significantly different from zero (p < 0.05, two-sided one-sample t-test).
Table 3.
Statistical comparison of raw satellite-derived (Ts_sat) and measured water surface temperatures (Ts_m) by climate zone and all 30 study lakes. * Denotes bias significantly different from zero (p < 0.05, two-sided one-sample t-test).
| Climate zone | No of Lakes | n (days) | Slope | Intercept (°C) | R² | RMSE (°C) | MAE (°C) | Bias (°C) |
| Arid/Semi-arid | 6 | 390 | 0.92 | -0.79 | 0.9645 | 2.73 | 2.36 | +2.23 * |
| Tropical | 5 | 36 | 0.81 | 5.22 | 0.6711 | 1.59 | 1.11 | -0.39 |
| Temperate | 7 | 112 | 0.97 | 0.08 | 0.9456 | 1.71 | 1.16 | +0.51 * |
| Continental/Boreal | 12 | 89 | 0.90 | 1.35 | 0.8799 | 2.07 | 1.46 | +0.55 * |
| 30 lakes (pooled) | 30 | 627 | 0.94 | -0.41 | 0.9378 | 2.43 | 1.95 | +1.53 * |
Table 4.
Global and climate-zone-based water surface temperature correction relationships developed from the 22 development lakes. Ts_m and Ts_sat represent in situ and raw satellite-derived water surface temperatures, respectively. SEE is the standard error of estimate.
Table 4.
Global and climate-zone-based water surface temperature correction relationships developed from the 22 development lakes. Ts_m and Ts_sat represent in situ and raw satellite-derived water surface temperatures, respectively. SEE is the standard error of estimate.
| Correction | Development lakes | n (days) | Correction equation | R² | SEE (°C) |
| Global | 22 | 375 | Ts_m = 0.97·Ts_sat - 0.55 | 0.9538 | 1.59 |
| Arid/Semi-arid | 4 | 223 | Ts_m = 0.96· Ts_sat - 0.97 | 0.9705 | 1.37 |
| Tropical | 3 | 16 | Ts_m = 0.91· Ts_sat + 1.99 | 0.7863 | 1.10 |
| Temperate | 5 | 81 | Ts_m = 0.99· Ts_sat - 0.52 | 0.9461 | 1.55 |
| Continental/Boreal | 10 | 55 | Ts_m = 0.94· Ts_sat + 1.31 | 0.9474 | 1.26 |
Table 5.
Independent validation of globally corrected satellite-derived water surface temperature (T0s_sat) against in situ water surface temperature (Ts_m) at eight validation lakes.
Table 5.
Independent validation of globally corrected satellite-derived water surface temperature (T0s_sat) against in situ water surface temperature (Ts_m) at eight validation lakes.
| Validation Lake | n (days) |
Relationship Equations | R2 | Uncorrected: RMSE (°C) | Corrected: RMSE (°C) |
|---|---|---|---|---|---|
| Elephant Butte Reservoir | 126 | T0s_sat = 1.14·Ts_m + 0.14 | 0.9876 | 3.59 | 2.54 |
| Lake Mead | 41 | T0s_sat = 1.09·Ts_m - 1.58 | 0.9884 | 1.85 | 0.83 |
| Corumba Lake | 6 | T0s_sat = 0.93·Ts_m + 0.56 | 0.9530 | 0.40 | 1.29 |
| Manso Lake | 10 | T0s_sat = 1.22·Ts_m - 8.24 | 0.8928 | 1.22 | 2.31 |
| Lake Okeechobee | 19 | T0s_sat = 1.08·Ts_m - 2.50 | 0.9760 | 1.20 | 1.02 |
| Lake Taupo | 11 | T0s_sat = 1.03·Ts_m - 1.51 | 0.9839 | 0.59 | 1.09 |
| White Bear Lake | 15 | T0s_sat = 0.93·Ts_m + 4.06 | 0.9860 | 4.17 | 3.03 |
| Lake Pyhäjärvi | 19 | T0s_sat = 1.03·Ts_m - 2.14 | 0.9511 | 1.21 | 1.90 |
Table 6.
Independent validation of climate-zone based corrected satellite-derived water surface temperature (T0s_sat) against in situ water surface temperature (Ts_m) at eight validation lakes.
Table 6.
Independent validation of climate-zone based corrected satellite-derived water surface temperature (T0s_sat) against in situ water surface temperature (Ts_m) at eight validation lakes.
| Validation Lake | n (days) |
Relationship Equations | R2 | Uncorrected: RMSE (°C) | Corrected: RMSE (°C) |
|---|---|---|---|---|---|
| Elephant Butte Reservoir | 126 | T0s_sat = 1.13·Ts_m - 0.29 | 0.9876 | 3.59 | 2.01 |
| Lake Mead | 41 | T0s_sat = 1.08·Ts_m - 1.99 | 0.9884 | 1.85 | 0.72 |
| Corumba Lake | 6 | T0s_sat = 0.87·Ts_m + 3.03 | 0.9530 | 0.40 | 0.46 |
| Manso Lake | 10 | T0s_sat = 1.14·Ts_m - 5.22 | 0.8928 | 1.22 | 1.45 |
| Lake Okeechobee | 19 | T0s_sat = 1.10·Ts_m - 2.50 | 0.9760 | 1.20 | 0.90 |
| Lake Taupo | 11 | T0s_sat = 1.05·Ts_m - 1.50 | 0.9839 | 0.59 | 0.80 |
| White Bear Lake | 15 | T0s_sat = 0.90·Ts_m + 5.77 | 0.9860 | 4.17 | 4.24 |
| Lake Pyhäjärvi | 19 | T0s_sat = 1.00·Ts_m - 0.23 | 0.9511 | 1.21 | 1.00 |
Table 7.
Pooled validation statistics for TEAREE daily evaporation at eight independent lakes using uncorrected, globally corrected, climate-zone-based corrected, and site-specific corrected satellite-derived water surface temperature.
Table 7.
Pooled validation statistics for TEAREE daily evaporation at eight independent lakes using uncorrected, globally corrected, climate-zone-based corrected, and site-specific corrected satellite-derived water surface temperature.
| Ts input | n (days) |
Slope | Intercept | R² | RMSE (mm/d) | Bias (mm/d) | NSE | KGE | Rating |
|---|---|---|---|---|---|---|---|---|---|
| Uncorrected | 229 | 1.24 | -0.08 | 0.9335 | 1.37 | +0.82 | 0.74 | 0.64 | Good |
| Global (Method 1) | 229 | 1.08 | -0.11 | 0.9370 | 0.81 | +0.19 | 0.91 | 0.87 | Very good |
| Climate-Zone (Method 2) | 229 | 1.02 | 0.05 | 0.9538 | 0.62 | +0.12 | 0.95 | 0.94 | Very good |
| Site-Specific | 229 | 1.00 | 0.03 | 0.9684 | 0.49 | +0.02 | 0.97 | 0.98 | Very good |
Disclaimer/Publisher’s Note: The statements, opinions and data contained in all publications are solely those of the individual author(s) and contributor(s) and not of MDPI and/or the editor(s). MDPI and/or the editor(s) disclaim responsibility for any injury to people or property resulting from any ideas, methods, instructions or products referred to in the content. |
© 2026 by the authors. Licensee MDPI, Basel, Switzerland. This article is an open access article distributed under the terms and conditions of the Creative Commons Attribution (CC BY) license (http://creativecommons.org/licenses/by/4.0/).
Copyright: This open access article is published under a Creative Commons CC BY 4.0 license, which permit the free download, distribution, and reuse, provided that the author and preprint are cited in any reuse.