
Submitted:
06 November 2026
Posted:
09 November 2026
You are already at the latest version
Abstract
This study examined the direct effect of five talent management practices (talent acquisition, training and development, performance management, reward and recognition, and retention) on organizational performance in the public sector of the Oromia region, Ethiopia, measured through the four Balanced Scorecard perspectives and framed by the Resource-Based View and the Ability–Motivation–Opportunity framework. An explanatory sequential mixed-methods design covered six regional executive bureaus and produced 350 usable civil service questionnaires (91.15% response rate) and 12 key informant interviews. Covariance-based structural equation modeling (CB-SEM) was run in IBM SPSS AMOS with 5000 bias-corrected bootstrap resamples. Model fit was excellent (χ2 = 14.730, df = 17, p = 0.615; CFI = 1.000; RMSEA = 0.000), and the model explained 56.1% of the variance in performance (R2 = 0.561). Training and development had the strongest direct effect (β = 0.288), followed by reward and recognition (β = 0.267), retention (β = 0.233) and performance management (β = 0.210), all at p<0.001. Talent acquisition had no detectable effect (β = 0.033, p = 0.409). Interviews showed that centralized civil service recruitment and generic written tests decouple hiring from the technical requirements of the bureaus, whereas internal human capital development drives administrative outcomes.
Keywords:
talent management practices
; organizational performance
; balanced scorecard
; covariance-based SEM
; public sector governance
; civil service bureaucracy
; Oromia
1. Introduction
Public administration within developing economies is highly strained. Civil service agencies are required to deliver complex developments within tight budget constraints (Boxall & Purcell, 2022; Kravariti & Johnston, 2020). Traditional personnel management systems include lifelong employment, centralized control systems and adherence to rules, resulting in low levels of responsiveness and flexibility (Boyne, 2002; Ferlie et al., 2007). Agencies are attempting to move away from administrative personnel management to strategic talent management (Collings & Mellahi, 2009; Ployhart, 2006).
Strategic talent management involves systematic processes aimed at attracting, recognizing, developing, motivating and retaining talented individuals within key roles (Meyers & van Woerkom, 2014). However, there is often resistance to implementing market-like tools within a state bureaucracy. Agencies are constrained by strict legal requirements to achieve these outcomes. This includes uniformity of salary rates within the civil service, political appointments, adherence to processes and a high level of red tape.
This was evident throughout sub-Saharan Africa. The regional executives within the Oromia region of Ethiopia are responsible for coordinating socio-economic policies, infrastructure and basic public services. Despite attempts to modernize, there is still a lack of technical expertise, lack of motivation and high levels of attrition in specialist areas.
There is a wealth of evidence relating to talent management practices within corporate environments. However, within public administration there is no clear indication as to what specific practices directly influence performance of public organizations within all four perspectives of the Balanced Scorecard (financial management, internal processes, customer services and learning). The aim of this study is to identify how much of a direct effect five practices have on performance, using interview evidence to explain the results. Data were collected from the regional executives within the Oromia region of Ethiopia.
2. Theoretical Framework and Hypotheses Development
2.1. Theoretical Foundations
The Resource-Based View (RBV; Barney, 1991) of the firm and the Ability-Motivation-Opportunity (AMO) framework (Appelbaum et al., 2000) are used.
The RBV states that sustained competitive advantage is derived from possessing valuable, rare, inimitable and non-substitutable internal resources (Barney, 1991). This requires modification for the public sector as statutory requirements and physical resources rarely provide any advantage. Long-term public competency resides within the people of the organization, possessing specialist administration knowledge, discretion, problem-solving and memory (Collins, 2021; Lepak & Snell, 1999).
The AMO framework looks at how performance is determined by the interaction between employees’ ability (A), motivation (M) and opportunity (O) to participate (Appelbaum et al., 2000). The five practices can be mapped to:
- Talent Acquisition (TA) and Training and Development (TDT) build foundational operational Ability;
- Reward and Recognition (TRR) stimulates intrinsic and extrinsic Motivation;
- Performance Management (TPM) and Talent Retention (TR) provide institutional clarity and the Opportunity to perform (Bos-Nehles et al., 2013; Jiang et al., 2012).
2.2. Conceptual Framework
Combining the RBV and AMO perspectives, we model organizational performance as the outcome of five functional talent management practices acting directly. Figure 1 shows the conceptual model. The five exogenous constructs (Talent Acquisition, TA; Training and Development, TDT; Performance Management, TPM; Reward and Recognition, TRR; and Talent Retention, TR) predict Organizational Performance (OP) directly. OP is a higher-order endogenous construct reflected by four Balanced Scorecard dimensions: Financial, Citizen/Customer, Internal Processes, and Learning and Growth.
2.3. Hypotheses Formulation
This assumes an organization has control over whom it recruits (Collings & Mellahi, 2009). However, civil service recruitment pipelines may cause some challenges, so H1 will be put to the test. If recruitment is done effectively, then it will have a positive impact as it means people are being chosen fairly and therefore talented professionals are placed within technical roles.
H1.
Strategic Talent Acquisition will have a significant positive direct relationship with Organizational Performance.
Training tailored to individual needs will develop an in-house technical skill set for the bureau. This will ensure continuous development for employees to maintain their skills to keep up with evolving statutory and technical requirements.
H2.
Targeted Training and Development will have a significant positive direct relationship with Organizational Performance.
Performance management systems will ensure individuals within the civil service are doing their role to meet the overall goals of the agency (Gerrish, 2016). Positive performance reviews and having clear performance criteria will encourage staff to identify areas for improvement.
H3.
Talent Performance Management will have a significant positive direct relationship with Organizational Performance.
Competitive recognition and promotion based on merit will encourage employees to go above and beyond their role. Although public pay scales are standardized, there is still an opportunity to recognize employees with non-monetary rewards and promote fairly which will increase morale within the civil service.
H4.
Talent Reward and Recognition will have a significant positive direct relationship with Organizational Performance.
Keeping talented professionals will ensure a consistent workflow. There will be little staff turnover, meaning there will be little disruption to the administration.
H5.
Strategic Talent Retention will have a significant positive direct relationship with Organizational Performance.
3. Materials and Methods
3.1. Research Design
An explanatory sequential mixed-methods approach was used to conduct this research. This consisted of a quantitative stage followed by a qualitative stage (Creswell & Creswell, 2018). The quantitative stage used CB-SEM and Maximum Likelihood estimation using IBM SPSS AMOS (Version 28) (Byrne, 2016). The qualitative stage used Reflexive Thematic Analysis (Braun & Clarke, 2022). Semi-structured interviews were carried out with 12 key informants. The informants were purposefully selected based on their formal and institutional roles. Criteria included:
- A senior role (Director) within each bureau;
- Responsible for managing human resources;
- Long-term experience in a senior expert role within the bureau.
Operational staff, technical experts, line supervisors and Executive Directors from 6 regional bureaus within the Oromia Regional Government were selected as the population for this study:
- Oromia Revenue Bureau;
- Oromia Bureau of Health;
- Oromia Bureau of Education;
- Oromia Roads Authority;
- Oromia Water, Mineral & Energy Bureau;
- Oromia Investment & Industry Commission.
3.2. Sampling and Respondent Profile
The required sample size was obtained using the standard population formula (Krejcie & Morgan, 1970) for a large finite population. This gave a sample size of N = 384. Stratified random sampling was used for the administrative levels. We distributed 384 self-administered questionnaires and received 350 usable ones, a response rate of 91.15%. Screening found no missing values among the 350 cases. Table 1 gives the institutional distribution, and Table 2 gives the demographic profile.
3.3. Variable Measurement
Construct scales were adapted from established human resources and public governance instruments (Collings & Mellahi, 2009; Kaplan & Norton, 1996) and respondents responded using a seven-point Likert scale (1=Strongly Disagree to 7=Strongly Agree). The following constructs were included:
Talent Acquisition (TA): 4 items measuring ability to source, fairness of process and merit-based recruitment.
Talent Training and Development (TDT): 4 items measuring technical training, alignment to profession and skills development.
Talent Performance Management (TPM): 6 items measuring clarity of objectives, fair performance appraisal and development feedback.
Talent Reward and Recognition (TRR): 5 items measuring fair promotions, merit and career progression incentives.
Talent Retention (TR): 4 items measuring job security, retention and loyalty.
Organizational Performance (OP): This is a reflective second-order latent construct comprising four dimensions of the Balanced Scorecard (20 items in total). The four dimensions have been aggregated to form composite indicators for each dimension (Kaplan & Norton, 1996).
Financial Perspective (OPFIN_Avg): 5 items measuring budget utilization, audit frequency and financial compliance.
Customer/Citizen Perspective (OPCIT_Avg): 5 items measuring quality of service, responsiveness and citizen satisfaction.
Internal Processes Perspective (OPINT_Avg): 5 items measuring cycle times, administration and digitization.
Learning and Growth Perspective (OPLRN_Avg): 5 items measuring agility, technical competence and knowledge retention.
3.4. Diagnostic Checks
Normality tests: Skewness ranged from -0.341 to -0.125 and Kurtosis ranged from -0.999 to 0.022. These figures are well within the acceptable range of +/- 2.0 (George & Mallery, 2020).
Factorability of the matrix: The Kaiser-Meyer-Olkin measure of sampling adequacy was 0.953. Bartlett’s test of sphericity showed significance (χ² = 19023.20, df = 1830, p < 0.001).
Common method bias: Harman’s single factor test indicated that the first factor accounted for 37.14% of the variance (less than the 50% threshold; Podsakoff et al., 2003). This test is known to have limitations as it only identifies one predominant factor. This means that there may still be method variance across several factors. This test is therefore an indicator and a complete collinearity test was included (Kock, 2015). Variance inflation factors for the five predictors were 1.111 to 1.487 (Table 3), which is far below the conservative threshold of 3.3.
Multicollinearity: Variance inflation factors (VIF) ranged from 1.111 to 1.487 with tolerance values ranging from 0.673 to 0.900 (Table 3). This rules out severe multicollinearity (Hair et al., 2019).
3.5. Model Specification
The structural relationships estimated in AMOS take the form:
where γ1 to γ5 are the structural path coefficients and ζ1 is the structural disturbance term. The reflective measurement equations for performance are:
where λ3 to λ5 are standardized factor loadings and ε2 to ε5 are measurement errors.
Org.performance = γ1(TA_Avg) + γ2(TDT_Avg) + γ3(TPM_Avg) + γ4(TRR_Avg) + γ5(TR_Avg) + ζ1,
OPFIN_Avg = 1.000(Org.performance) + ε2,
OPCIT_Avg = λ3(Org.performance) + ε3,
OPINT_Avg = λ4(Org.performance) + ε4,
OPLRN_Avg = λ5(Org.performance) + ε5,
4. Results
4.1. Measurement Model Evaluation and Confirmatory Factor Analysis
A first-order confirmatory factor analysis (CFA) was conducted following the two-step process of Anderson and Gerbing (1988). The complete measurement model consisted of nine latent constructs and 43 reflective indicators.
The factor loadings (λ) of all 43 items were found to fall within the acceptable range of 0.75 to 0.92 as shown in Table 4. All parameters were significant at p < 0.001 and all factor loadings exceeded the acceptable psychometric criterion of 0.70 (Hair et al., 2019). The item reliability scores (R²) ranged from 0.56 to 0.85.
Both Construct reliability and convergent validity met established standards (Fornell & Larcker, 1981; Nunnally, 1978). Table 5 shows composite reliability (CR) above the 0.70 benchmark (Nunnally, 1978) for all nine latent constructs (range 0.897 to 0.952), and average variance extracted (AVE) above the 0.50 threshold (Fornell & Larcker, 1981) (range 0.649 to 0.833).
We tested discriminant validity with the Fornell-Larcker criterion (Fornell & Larcker, 1981): the square root of each construct’s AVE (√AVE) must exceed its correlations with every other construct. Table 6 gives the first-order inter-construct correlation matrix.
Finper, Custper, IntrBP, and Lgper denote the Financial, Customer/Citizen, Internal Processes, and Learning and Growth perspectives. The five talent management practices met the Fornell-Larcker criterion: their √AVE values (0.805 to 0.913) exceeded all of their inter-construct correlations (r = 0.212 to 0.485). The four Balanced Scorecard perspectives exhibited high correlations with each other (ranging from r = 0.819 to 0.869). However, two pairs did not meet the criteria: Finper and Lgper (r = 0.869 vs. √AVE = 0.846 and 0.852) and IntrBP and Lgper (r = 0.855 vs. 0.846 and 0.852). This is not problematic because budget implementation, internal processes and learning are part of an integrated system for creating public value. The four perspectives are never used as independent variables or dependent variables; they are used as indicators of a single Organizational Performance construct. Therefore, the structural model does not suffer from this issue.
4.2. Structural Model Fit Indices
The structural model provided a good fit to the empirical covariance matrix (Table 7). The chi-square statistic was non-significant (χ2 = 14.730, df = 17, p = 0.615), and the normed chi-square (χ2/df = 0.866) fell below the 2.00 threshold (Byrne, 2016). The incremental indices (CFI = 1.000, TLI = 1.000) and the absolute error measures (RMR = 0.014, RMSEA = 0.000, 90% CI [0.000, 0.042], PCLOSE = 0.982) met established standards (Hu & Bentler, 1999).
4.3. Hypotheses Testing and Structural Path Estimates
We estimated parameters with Maximum Likelihood and checked standard errors and two-tailed significance against 5,000 bias-corrected bootstrap resamples at the 95% confidence level. The structural model explained 56.1% of the variance in Organizational Performance (R2 = 0.561, p = 0.001, bootstrap 95% CI [0.458, 0.648]). Four of the five hypothesized paths are supported; the Talent Acquisition path is not. Figure 2 shows the structural path model, and Table 8 reports the hypothesis tests.
Table 9 reports the measurement parameters of the second-order performance construct. All loadings were high and significant (p < 0.001), and Learning and Growth loaded highest (λ = 0.909, R2 = 0.826). Table 10 reports the correlations among the exogenous predictors with bootstrap confidence intervals.
5. Discussion
Overall, the five talent management practices explained 56.1% of the variance in organizational performance (R2 = 0.561) within the Oromia regional bureaus. However, there was a large difference in contribution between the practices. Four internal practices had significant positive relationships with organizational performance whereas Talent Acquisition did not.
5.1. Talent Acquisition
There was no significant relationship between Talent Acquisition and organizational performance (β = 0.033; t = 0.825; p = 0.409), and the bootstrap 95% CI included 0 (95% CI [-0.042, 0.105]). Therefore, Hypothesis 1 was not supported.
According to strategic talent management theory, recruitment is the start of aligning highly skilled individuals to important roles within an organization (Collings & Mellahi, 2009). However, this was only slightly apparent within the studied bureaus. Centrally directed recruitment strategies from the Civil Service Commission resulted in recruitment practices being driven by compliance, positive discrimination, and standardized written assessments. One departmental HR director explained:
“Recruitment is dictated by civil service guidelines and budgetary allocations. We have a list of approved vacancies we need to fill so we use standardized written assessments. These rarely test any practical skills. As we are driven by compliance, filling these positions does not improve our performance; it just fulfils a requirement.” Informant #7 – HR Director – Regional Revenue Bureau
This suggests that compliance is not being translated into capability within the organization. Recruitment is standardized, which results in meeting legal requirements but does not link to the specific workflows of the executive bureaus. The survey does not allow us to determine if there is a real lack of effect or if there is a low variance due to recruitment being centrally controlled. See section 5.3.
5.2. Internal Capability Building
The main correlate of public organizational performance was investment in current employees. There were four positive and significant relationships.
Training and Development had the largest effect (β = 0.288; t = 6.271; p < 0.001; 95% CI [0.183, 0.378] bootstrapped). This supports Hypothesis 2. New employees rarely have the necessary specialist skills to work within complex bureaucratic systems. This targeted training fills gaps within operations. One senior engineering official explained:
“We only see improvements in our service delivery metrics when we invest heavily in training our current employees. We cannot recruit fresh graduates who understand the regional regulations straight away. We have to build this capability from within through structured on-the-job training.” Informant #4 – Senior Technical Expert – Roads Authority
Reward and Recognition had the second largest effect (β = 0.267; t = 5.668; p < 0.001; 95% CI [0.175, 0.361] bootstrapped). This supports Hypothesis 4. The AMO model suggests motivation relates to discretionary effort (Appelbaum et al., 2000). However, the regional civil service has standardized pay scales which limit the ability of bureau managers to increase monetary rewards. As a result, reward appears to be driven by non-monetary rewards. These include study leave, graduate sponsorship, public service commendations and fast tracking. However, as this was a cross-sectional perception survey, we cannot fully determine if employees are satisfied with the non-monetary rewards or if they feel their base pay is adequate.
Talent Retention had a strong positive relationship (β = 0.233; t = 5.285; p < 0.001; 95% CI [0.150, 0.316] bootstrapped). This supports Hypothesis 5. High staff turnover of specialist roles such as tax auditors, highway engineers and epidemiologists will cause issues with programs. Having experienced employees ensures there is institutional knowledge and stability with capital projects.
Performance Management had a direct positive relationship (β = 0.210; t = 4.745; p < 0.001; 95% CI [0.123, 0.298] bootstrapped). This supports Hypothesis 3. Gerrish (2016) conducted a meta-analysis of public sector studies and found there was a positive relationship between performance management and organizational performance (Gerrish, 2016). This is consistent with our findings. However, this was the smallest of the four supported relationships. This suggests that formal assessment tools cannot make up for a lack of technical capability, employee motivation and retention.
The second order factor loadings showed that Learning and Growth (λ = 0.909; R2 = 0.826), Financial Stewardship (λ = 0.884; R2 = 0.781), Internal Process Efficiency (λ = 0.870; R2 = 0.756) and Citizen Centric Service Delivery (λ = 0.859; R2 = 0.737) had the highest loadings. This is consistent with the Resource-Based View (Barney, 1991). Within public bureaucracies, administrative capability is not driven by physical capital or rigid recruitment targets. Instead it is driven by internal social capital and institutional knowledge.
In practice, filling vacancies does not contribute to increased performance. However, investing in training, recognition, retention and appraisal will. Bureau heads should prioritize targeted training to overcome bottlenecks in operations as they have limited budgets.
5.3. Limitations and Future Research
There are four limitations to consider. First, this was a cross-sectional study. This means we cannot determine causal relationships, and future research should look at longitudinal or quasi-experimental studies to determine if changes in practice lead to changes in performance. Second, all quantitative data was collected from a single source. This means there is a risk of common method bias. The Harman’s single factor test was used to mitigate this; however, this is a weak test (Podsakoff et al., 2003). Future research should include procedural remedies, marker variable tests and latent method factor tests. In addition, objective measures such as budget absorption rates and audit results should be collected. Third, this study only looked at six executive bureaus within one regional government. This means it would be premature to generalize to other regions, levels of government or the national civil service. Comparative research should be conducted to determine how far this pattern extends. Fourth, performance was measured using four composite indicators. These were averaged together. Future research should look at item or parcelled latent variables to determine if the structural relationships exist.
The lack of effect for Talent Acquisition should be considered carefully. We have interpreted this from the interviews. However, we cannot determine if there is really no effect or if there is low variance due to recruitment being centrally controlled. Future research should look at the moderating and mediating factors not included in this model. In addition, the qualitative phase should be expanded to include more diverse informants.
6. Conclusions and Implications
6.1. Conclusions
This study investigated the direct structural relationships between talent management practices and organizational performance within the regional public sector bureaus in Oromia, Ethiopia. Structural equation modeling shows that four internal practices (Training and Development β = 0.288; Reward and Recognition β = 0.267; Talent Retention β = 0.233; Performance Management β = 0.210) directly predict performance. Overall, the five practices explain 56.1% of variance in performance. However, Talent Acquisition did not predict performance (β = 0.033; t = 0.825, p = 0.409). This is due to the limited options with compliance-based civil service recruitment.
These findings provide new insights into how human capital is perceived within regional public bureaucracies. Recruitment is standardized to meet regulatory requirements but does not contribute to increased delivery capability. Investing in internal technical training, non-monetary rewards, employee retention and ongoing development feedback will create public value. To improve operations, regional agencies should move away from transactional people management and create human resource systems that develop and retain internal expertise.
6.2. Policy and Practical Implications
Five interventions follow for regional civil service leadership:
- Reform centralized sourcing systems. The Oromia Civil Service Commission should replace generic, compliance-focused hiring exams. Regional executive agencies (such as Roads, Health, and Revenue) need delegated authority to co-design competency-based assessments and practical work-sample simulations for specialized technical posts.
- Align training budgets with operational bottlenecks. Human resource directors should tie capacity-building allocations directly to performance deficits identified on the Balanced Scorecard (for example, procurement lead times, tax audit backlogs, and capital budget implementation lags).
- Formalize non-monetary merit recognition. Because statutory pay ceilings limit financial rewards, regional bureaus should institutionalize transparent non-financial incentives such as sponsored graduate education, fast-track promotions, and regional public service awards.
- Deploy targeted retention packages for hard-to-replace technical roles. Bureau executives should set up retention packages, including professional development allowances and defined career ladders, for roles such as civil engineers, epidemiologists, and financial auditors. Their departure erodes institutional continuity.
- Shift appraisals from compliance checks to continuous feedback. Bureaus should replace annual paper reviews with quarterly milestone check-ins that give staff actionable, developmental guidance.
Author Contributions
Conceptualization, G.A.C. and Z.A.B.; methodology, G.A.C. and Z.A.B.; software, G.A.C.; validation, Z.A.B.; formal analysis, G.A.C.; investigation, G.A.C.; resources, Z.A.B.; data curation, G.A.C.; writing—original draft preparation, G.A.C.; writing—review and editing, Z.A.B.; visualization, G.A.C.; supervision, Z.A.B.; project administration, G.A.C. All authors have read and agreed to the published version of the manuscript.
Funding
This research received no external funding.
Institutional Review Board Statement
The study was conducted in accordance with the Declaration of Helsinki and approved by the Institutional Review Board of the Oromia Public Sector Research Ethics Committee (protocol code OREC-2023-088, approved 12 September 2023).
Informed Consent Statement
Informed consent was obtained from all subjects involved in the study.
Data Availability Statement
The survey datasets and qualitative interview transcripts supporting the conclusions of this article are available from the corresponding author upon reasonable academic request.
Acknowledgments
The authors thank the operational staff, technical experts, and departmental directors of the six participating Oromia Regional Government executive bureaus for their time and insights during data collection.
Conflicts of Interest
The authors declare no conflicts of interest.
Abbreviations
The following abbreviations are used in this manuscript:
| AGFI | Adjusted goodness-of-fit index |
| AMO | Ability–Motivation–Opportunity |
| AMOS | Analysis of Moment Structures |
| AVE | Average variance extracted |
| CB-SEM | Covariance-based structural equation modeling |
| CFA | Confirmatory factor analysis |
| CFI | Comparative fit index |
| CR | Composite reliability |
| GFI | Goodness-of-fit index |
| IFI | Incremental fit index |
| OP | Organizational performance |
| RBV | Resource-Based View |
| RMR | Root mean square residual |
| RMSEA | Root mean square error of approximation |
| TA | Talent acquisition |
| TDT | Talent training and development |
| TPM | Talent performance management |
| TR | Talent retention |
| TRR | Talent reward and recognition |
| TLI | Tucker–Lewis index |
| VIF | Variance inflation factor |
References
- Anderson, J. C., and D. W. Gerbing. 1988. Structural equation modeling in practice: A review and recommended two-step approach. Psychological Bulletin 103, 3: 411–423. [Google Scholar] [CrossRef]
- Appelbaum, E., T. Bailey, P. Berg, and A. L. Kalleberg. 2000. Manufacturing advantage: Why high-performance work systems pay off. Cornell University Press. [Google Scholar]
- Barney, J. 1991. Firm resources and sustained competitive advantage. Journal of Management 17, 1: 99–120. [Google Scholar] [CrossRef]
- Bos-Nehles, A. C., M. J. Van Riemsdijk, and J. K. Looise. 2013. Employee perceptions of line management performance: Applying the AMO theory to explain the effectiveness of line managers’ HRM implementation. Human Resource Management 52, 6: 861–877. [Google Scholar] [CrossRef]
- Boxall, P., and J. Purcell. 2022. Strategy and human resource management, 5th ed. Bloomsbury Publishing. [Google Scholar]
- Boyne, G. A. 2002. Public and private management: What’s the difference? Journal of Management Studies 39, 1: 97–122. [Google Scholar] [CrossRef]
- Braun, V., and V. Clarke. 2022. Thematic analysis: A practical guide. SAGE Publications. [Google Scholar]
- Byrne, B. M. 2016. Structural equation modeling with AMOS: Basic concepts, applications, and programming, 3rd ed. Routledge. [Google Scholar]
- Collings, D. G., and K. Mellahi. 2009. Strategic talent management: A review and research agenda. Human Resource Management Review 19, 4: 304–313. [Google Scholar] [CrossRef]
- Collins, C. J. 2021. Expanding the resource-based view model of strategic human resource management. The International Journal of Human Resource Management 32, 2: 331–358. [Google Scholar] [CrossRef]
- Creswell, J. W., and J. D. Creswell. 2018. Research design: Qualitative, quantitative, and mixed methods approaches, 5th ed. SAGE Publications. [Google Scholar]
- Ferlie, E., L. E. Lynn, and C. Pollitt, eds. 2007. The Oxford handbook of public management. Oxford University Press. [Google Scholar]
- Fornell, C., and D. F. Larcker. 1981. Evaluating structural equation models with unobservable variables and measurement error. Journal of Marketing Research 18, 1: 39–50. [Google Scholar] [CrossRef]
- George, D., and P. Mallery. 2020. IBM SPSS statistics 26 step by step: A simple guide and reference, 16th ed. Routledge. [Google Scholar]
- Gerrish, E. 2016. The impact of performance management on performance in public organizations: A meta-analysis. Public Administration Review 76, 1: 48–66. [Google Scholar] [CrossRef]
- Hair, J. F., W. C. Black, B. J. Babin, and R. E. Anderson. 2019. Multivariate data analysis, 8th ed. Cengage Learning. [Google Scholar]
- Hu, L., and P. M. Bentler. 1999. Cutoff criteria for fit indexes in covariance structure analysis: Conventional criteria versus new alternatives. Structural Equation Modeling 6, 1: 1–55. [Google Scholar] [CrossRef]
- Jiang, K., D. P. Lepak, J. Hu, and J. C. Baer. 2012. How does human resource management influence organizational outcomes? A meta-analytic investigation of mediating mechanisms. Academy of Management Journal 55, 6: 1264–1294. [Google Scholar] [CrossRef]
- Kaplan, R. S., and D. P. Norton. 1996. The balanced scorecard: Translating strategy into action. Harvard Business School Press. [Google Scholar]
- Kline, R. B. 2023. Principles and practice of structural equation modeling, 5th ed. Guilford Press. [Google Scholar]
- Kock, N. 2015. Common method bias in PLS-SEM: A full collinearity assessment approach. International Journal of e-Collaboration 11, 4: 1–10. [Google Scholar] [CrossRef]
- Kravariti, F., and K. Johnston. 2020. Talent management: A critical literature review and research agenda for public sector human resource management. Public Management Review 22, 1: 75–95. [Google Scholar] [CrossRef]
- Krejcie, R. V., and D. W. Morgan. 1970. Determining sample size for research activities. Educational and Psychological Measurement 30, 3: 607–610. [Google Scholar] [CrossRef]
- Lepak, D. P., and S. A. Snell. 1999. The human resource architecture: Toward a theory of human capital allocation and development. Academy of Management Review 24, 1: 31–48. [Google Scholar] [CrossRef]
- Meyers, M. C., and M. van Woerkom. 2014. The influence of underlying philosophies on talent management: Theory, implications for practice, and research agenda. Journal of World Business 49, 2: 192–203. [Google Scholar] [CrossRef]
- Nunnally, J. C. 1978. Psychometric theory, 2nd ed. McGraw-Hill. [Google Scholar]
- Ployhart, R. E. 2006. Staffing in the 21st century: New challenges and strategic opportunities. Journal of Management 32, 6: 868–897. [Google Scholar] [CrossRef]
- Podsakoff, P. M., S. B. MacKenzie, J.-Y. Lee, and N. P. Podsakoff. 2003. Common method biases in behavioral research: A critical review of the literature and recommended remedies. Journal of Applied Psychology 88, 5: 879–903. [Google Scholar] [CrossRef] [PubMed]
Figure 1.
Conceptual framework and hypothesized structural model.
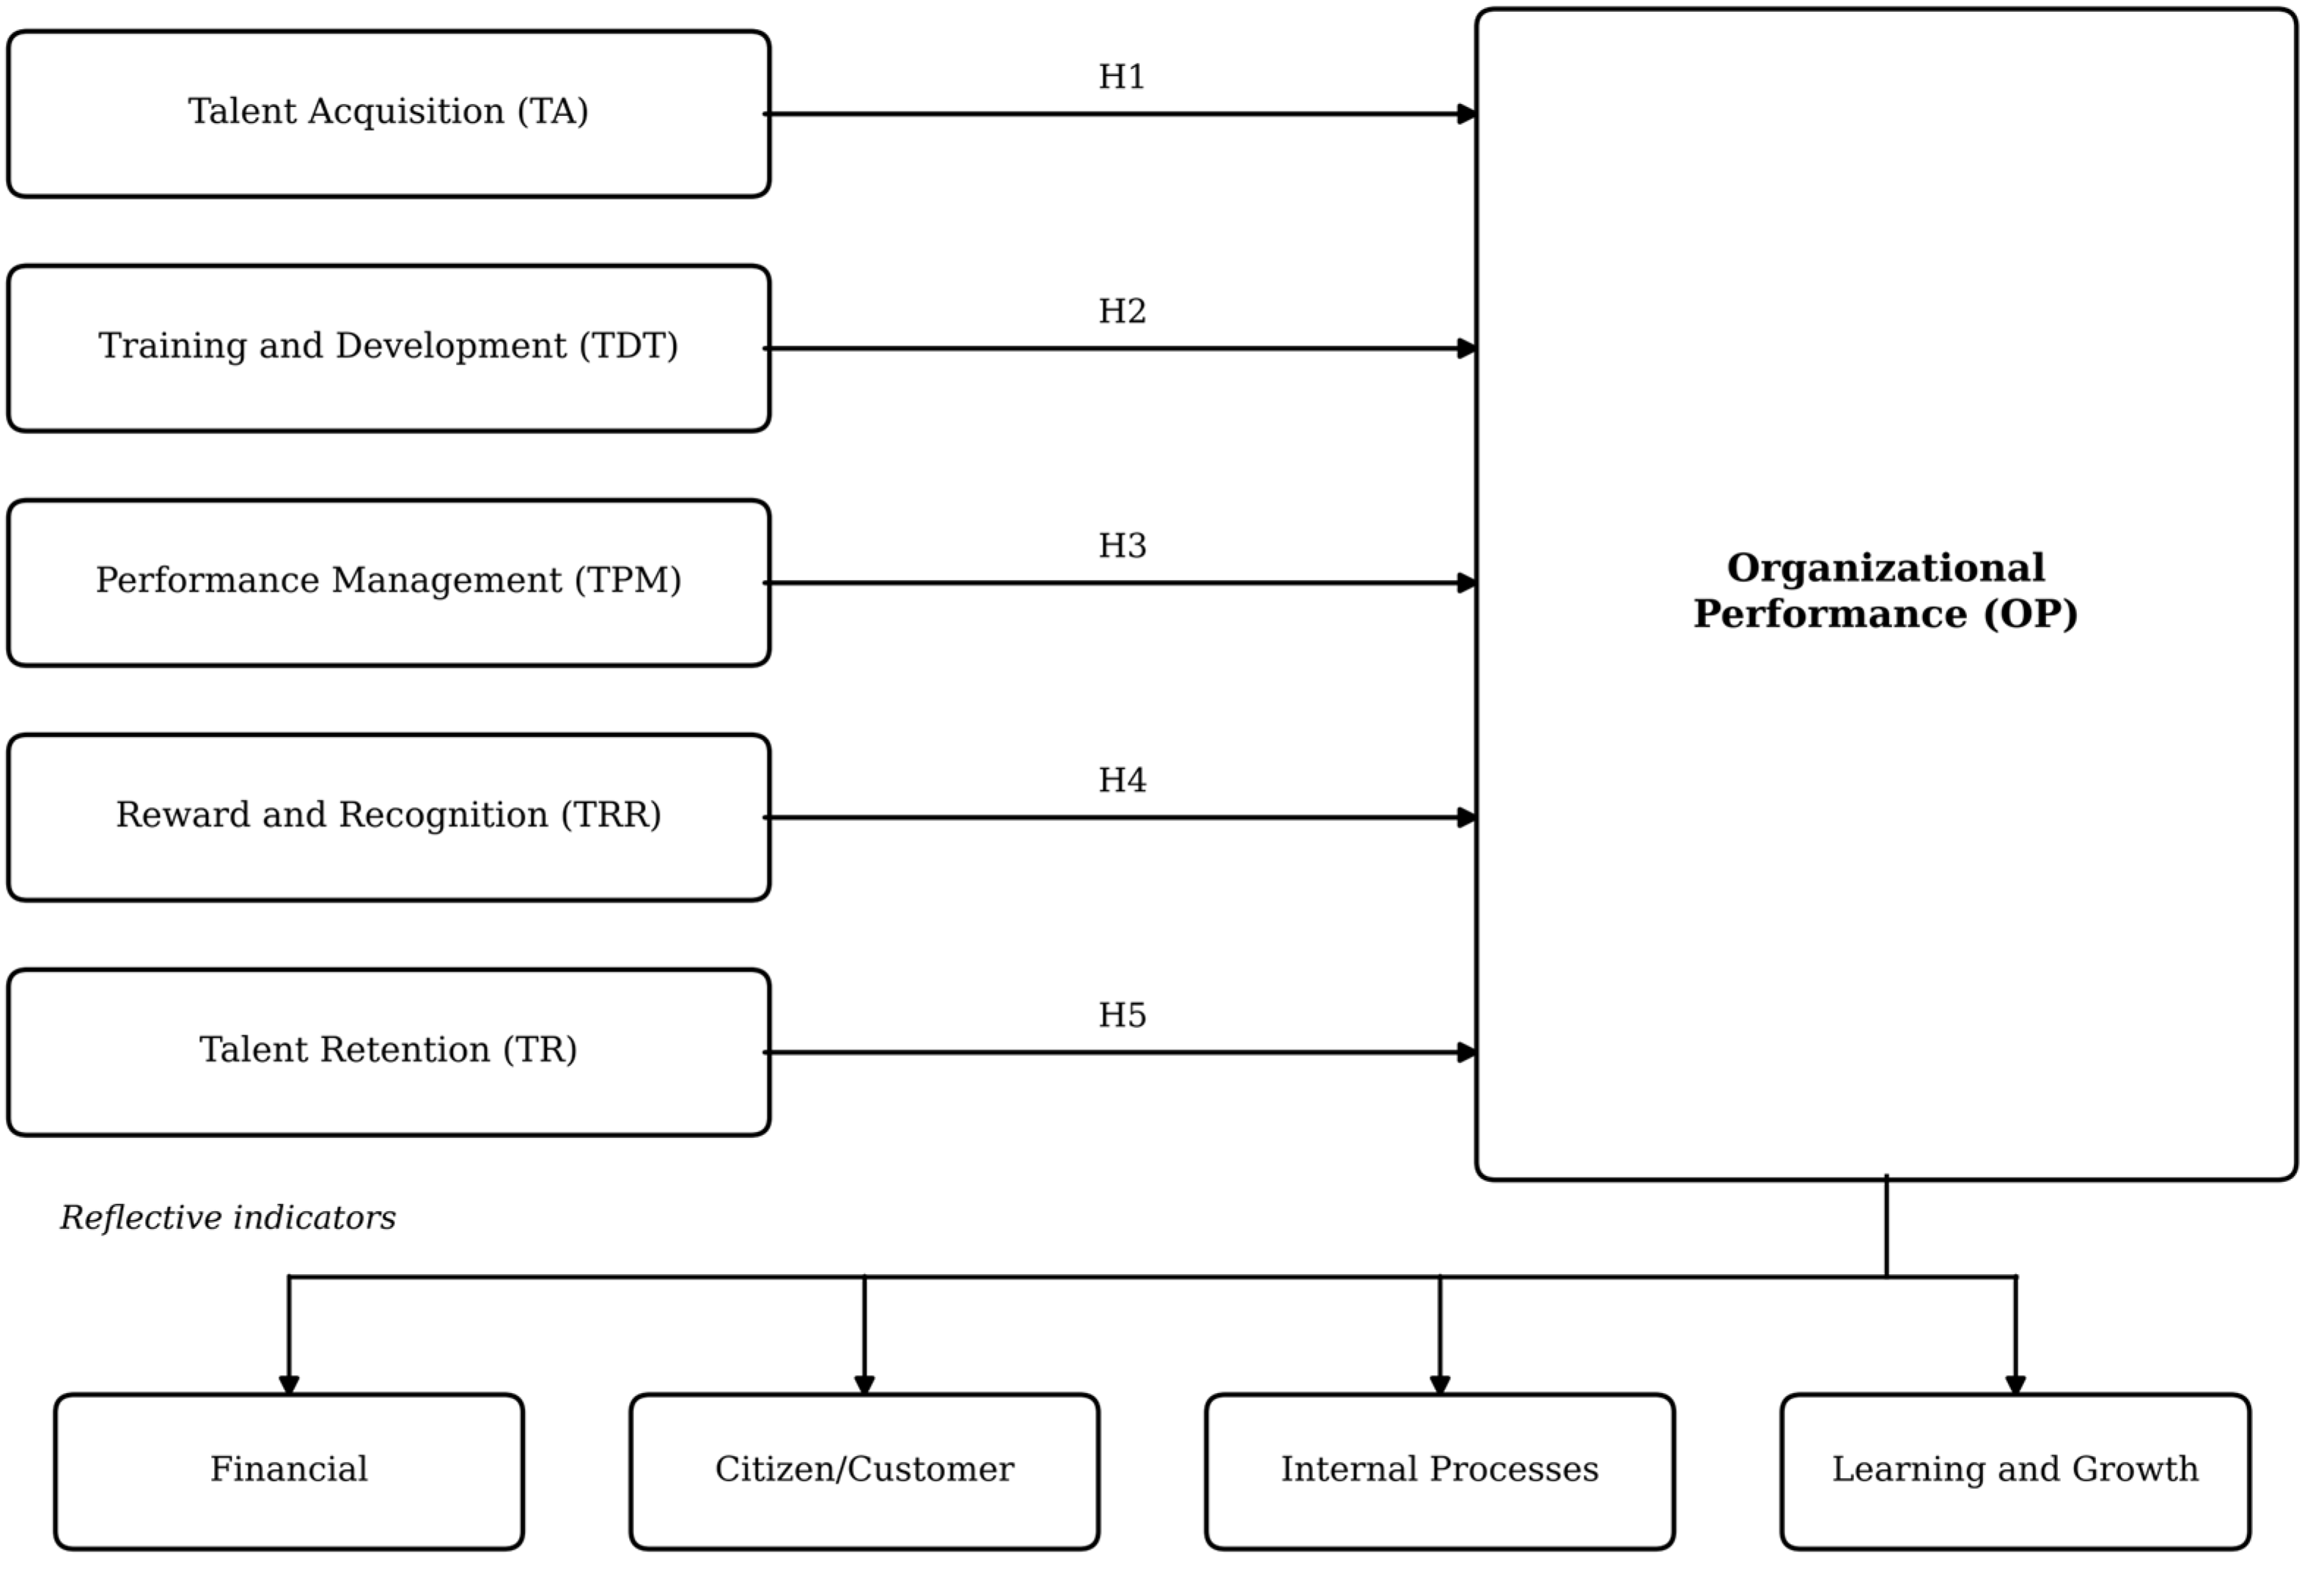
Figure 2.
Empirical structural path model with standardized parameter estimates. The dashed line marks the non-significant path.
Figure 2.
Empirical structural path model with standardized parameter estimates. The dashed line marks the non-significant path.
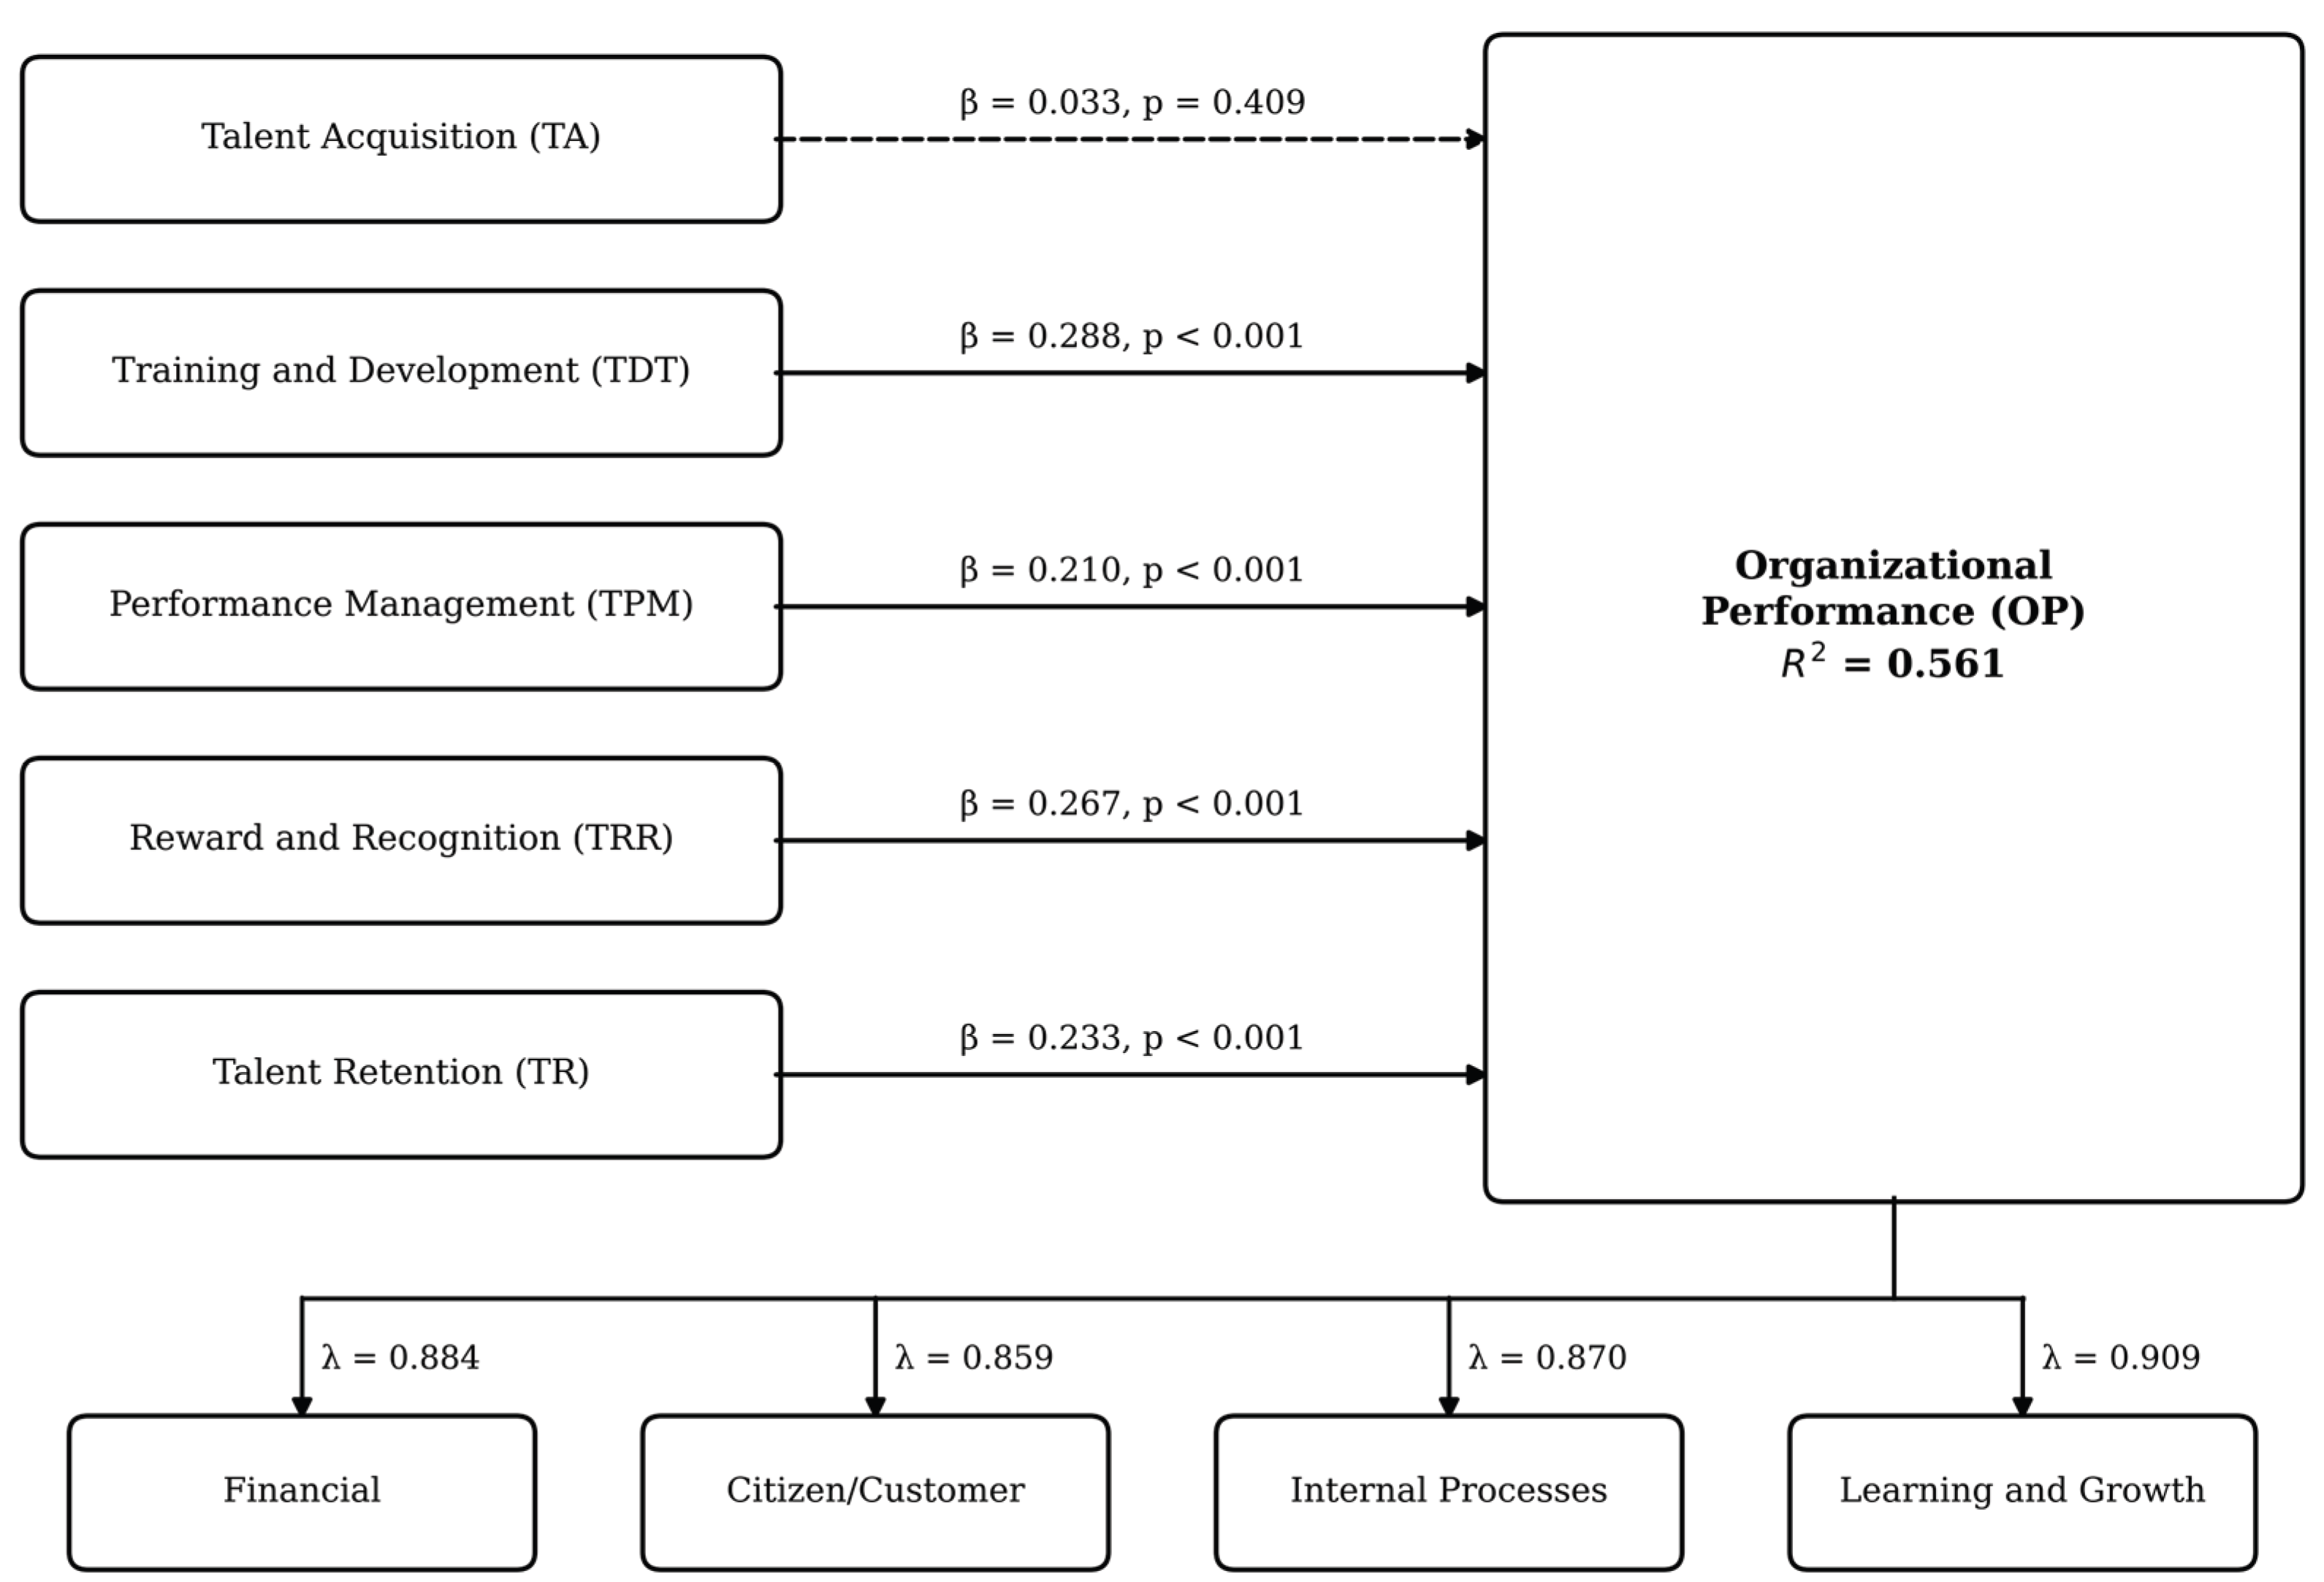

Table 1.
Institutional distribution of survey respondents (N = 350).
| Bureau name / targeted organization | Distributed surveys | Usable returns (n) | Proportion (%) |
| Oromia Revenue Bureau | 75 | 70 | 20.0 |
| Oromia Bureau of Health | 70 | 64 | 18.3 |
| Oromia Bureau of Education | 68 | 62 | 17.7 |
| Oromia Roads Authority | 62 | 58 | 16.6 |
| Oromia Water, Mineral & Energy Bureau | 55 | 50 | 14.3 |
| Oromia Investment & Industry Commission | 54 | 46 | 13.1 |
| Total civil service sample | 384 | 350 | 100.0 |
Table 2.
Demographic profile of respondents (N = 350).
| Demographic dimension | Category | Frequency (n) | Proportion (%) |
| Gender | Female | 156 | 44.6 |
| Male | 194 | 55.4 | |
| Age Cohort | 25–34 Years | 108 | 30.9 |
| 35–44 Years | 123 | 35.1 | |
| 45–55 Years | 119 | 34.0 | |
| Educational Level | TVET / Diploma | 22 | 6.3 |
| Bachelor’s Degree | 154 | 44.0 | |
| Master’s Degree | 172 | 49.1 | |
| Doctoral Degree (PhD) | 2 | 0.6 | |
| Tenure | 1–5 Years | 149 | 42.6 |
| 6–10 Years | 72 | 20.6 | |
| 11–15 Years | 60 | 17.1 | |
| 16–20 Years | 34 | 9.7 | |
| ≥ 21 Years | 35 | 10.0 | |
| Hierarchy Level | Operational / Technical Staff | 202 | 57.7 |
| Mid-level Professional | 87 | 24.9 | |
| Supervisory Personnel | 28 | 8.0 | |
| Departmental Manager | 26 | 7.4 | |
| Executive Leadership | 7 | 2.0 |
Table 3.
Collinearity diagnostics.
| Predictor construct | Unstandardized B | Std. error (SE) | Beta (β) | t-value | p-value | Tolerance | VIF |
| (Constant) | 0.157 | 0.224 | — | 0.700 | 0.484 | — | — |
| Talent Acquisition (TA) | 0.022 | 0.026 | 0.034 | 0.858 | 0.391 | 0.900 | 1.111 |
| Talent Perf. Management (TPM) | 0.204 | 0.044 | 0.201 | 4.681 | < 0.001 | 0.759 | 1.318 |
| Talent Training & Dev. (TDT) | 0.250 | 0.040 | 0.275 | 6.209 | < 0.001 | 0.713 | 1.403 |
| Talent Reward & Rec. (TRR) | 0.241 | 0.043 | 0.256 | 5.632 | < 0.001 | 0.673 | 1.487 |
| Talent Retention (TR) | 0.225 | 0.042 | 0.227 | 5.313 | < 0.001 | 0.766 | 1.305 |
Table 4.
Confirmatory factor analysis loadings, indicator reliability and construct validity (N = 350).
Table 4.
Confirmatory factor analysis loadings, indicator reliability and construct validity (N = 350).
| Construct and indicators | Standardized loading (λ) | Item reliability (R2) | Composite reliability (CR) | Average variance extracted (AVE) |
| Talent Acquisition (TalAQ) | 0.952 | 0.833 | ||
| TA_1.1 | 0.91 | 0.83 | ||
| TA_1.2 | 0.90 | 0.81 | ||
| TA_1.3 | 0.92 | 0.85 | ||
| TA_1.4 | 0.92 | 0.85 | ||
| Talent Performance Management (TaPM) | 0.917 | 0.649 | ||
| TPM_1.1 | 0.82 | 0.67 | ||
| TPM_1.2 | 0.83 | 0.69 | ||
| TPM_1.3 | 0.82 | 0.67 | ||
| TPM_1.4 | 0.80 | 0.64 | ||
| TPM_1.5 | 0.81 | 0.66 | ||
| TPM_1.6 | 0.75 | 0.56 | ||
| Talent Training & Development (TaTD) | 0.897 | 0.685 | ||
| TDT_1.1 | 0.83 | 0.69 | ||
| TDT_1.2 | 0.79 | 0.62 | ||
| TDT_1.3 | 0.85 | 0.72 | ||
| TDT_1.4 | 0.84 | 0.71 | ||
| Talent Reward & Recognition (TaREw) | 0.929 | 0.724 | ||
| TRR_1.1 | 0.85 | 0.72 | ||
| TRR_1.2 | 0.83 | 0.69 | ||
| TRR_1.3 | 0.83 | 0.69 | ||
| TRR_1.4 | 0.82 | 0.67 | ||
| TRR_1.5 | 0.92 | 0.85 | ||
| Talent Retention (TaRet) | 0.910 | 0.716 | ||
| TR_1.1 | 0.80 | 0.64 | ||
| TR_1.2 | 0.92 | 0.85 | ||
| TR_1.3 | 0.82 | 0.67 | ||
| TR_1.4 | 0.84 | 0.71 | ||
| Financial Performance (Finper) | 0.926 | 0.716 | ||
| OPFIN_1.1 | 0.84 | 0.71 | ||
| OPFIN_1.2 | 0.84 | 0.71 | ||
| OPFIN_1.3 | 0.82 | 0.67 | ||
| OPFIN_1.4 | 0.87 | 0.76 | ||
| OPFIN_1.5 | 0.86 | 0.74 | ||
| Citizen/Customer Perspective (Custper) | 0.925 | 0.712 | ||
| OPCIT_1.1 | 0.84 | 0.71 | ||
| OPCIT_1.2 | 0.84 | 0.71 | ||
| OPCIT_1.3 | 0.85 | 0.72 | ||
| OPCIT_1.4 | 0.85 | 0.72 | ||
| OPCIT_1.5 | 0.84 | 0.71 | ||
| Internal Business Processes (IntrBP) | 0.927 | 0.716 | ||
| OPINT_1.1 | 0.87 | 0.76 | ||
| OPINT_1.2 | 0.81 | 0.66 | ||
| OPINT_1.3 | 0.87 | 0.76 | ||
| OPINT_1.4 | 0.85 | 0.72 | ||
| OPINT_1.5 | 0.83 | 0.69 | ||
| Learning & Growth Perspective (Lgper) | 0.930 | 0.726 | ||
| OPLRN_1.1 | 0.86 | 0.74 | ||
| OPLRN_1.2 | 0.86 | 0.74 | ||
| OPLRN_1.3 | 0.84 | 0.71 | ||
| OPLRN_1.4 | 0.85 | 0.72 | ||
| OPLRN_1.5 | 0.85 | 0.72 |
Note: All standardized factor loadings are statistically significant at p < 0.001.
Table 5.
Construct reliability and convergent validity estimates.
| Latent construct | Number of items | Composite reliability (CR) | Average variance extracted (AVE) | Status |
| Talent Acquisition (TalAQ) | 4 | 0.952 | 0.833 | Confirmed |
| Talent Performance Management (TaPM) | 6 | 0.917 | 0.649 | Confirmed |
| Talent Training & Development (TaTD) | 4 | 0.897 | 0.685 | Confirmed |
| Talent Reward & Recognition (TaREw) | 5 | 0.929 | 0.724 | Confirmed |
| Talent Retention (TaRet) | 4 | 0.910 | 0.716 | Confirmed |
| Financial Performance (Finper) | 5 | 0.926 | 0.716 | Confirmed |
| Citizen/Customer Perspective (Custper) | 5 | 0.925 | 0.712 | Confirmed |
| Internal Business Processes (IntrBP) | 5 | 0.927 | 0.716 | Confirmed |
| Learning & Growth Perspective (Lgper) | 5 | 0.930 | 0.726 | Confirmed |
Table 6.
Discriminant validity matrix (Fornell-Larcker criterion).
| Construct | TalAQ | TaPM | TaTD | TaREw | TaRet | Finper | Custper | IntrBP | Lgper |
| TalAQ | (0.913) | ||||||||
| TaPM | 0.212 | (0.805) | |||||||
| TaTD | 0.290 | 0.424 | (0.828) | ||||||
| TaREw | 0.230 | 0.452 | 0.485 | (0.851) | |||||
| TaRet | 0.241 | 0.331 | 0.396 | 0.452 | (0.846) | ||||
| Finper | 0.264 | 0.474 | 0.576 | 0.557 | 0.489 | (0.846) | |||
| Custper | 0.213 | 0.473 | 0.525 | 0.546 | 0.485 | 0.827 | (0.844) | ||
| IntrBP | 0.277 | 0.473 | 0.539 | 0.517 | 0.494 | 0.819 | 0.824 | (0.846) | |
| Lgper | 0.239 | 0.534 | 0.596 | 0.590 | 0.515 | 0.869 | 0.832 | 0.855 | (0.852) |
Note: Bold values in parentheses on the diagonal are the square roots of the average variance extracted (√AVE). Off-diagonal values are first-order inter-construct correlations (p < 0.001).
Table 7.
Structural model goodness-of-fit summary.
| Fit index / metric | Observed AMOS value | Recommended benchmark | Reference | Fit assessment |
| Chi-square (χ2) | 14.730 | — | Hair et al. (2019) | Baseline statistic |
| Degrees of freedom (df) | 17 | — | Kline (2023) | Model over-identification |
| Probability level (p) | 0.615 | > 0.05 | Kline (2023) | Excellent fit |
| Normed chi-square (χ2/df) | 0.866 | < 2.00 | Kline (2023) | Excellent fit |
| Goodness-of-fit index (GFI) | 0.991 | ≥ 0.95 | Byrne (2016) | Excellent fit |
| Adjusted GFI (AGFI) | 0.976 | ≥ 0.90 | Byrne (2016) | Excellent fit |
| Comparative fit index (CFI) | 1.000 | ≥ 0.95 | Hu and Bentler (1999) | Excellent fit |
| Tucker-Lewis index (TLI) | 1.000 (1.003) | ≥ 0.95 | Hu and Bentler (1999) | Excellent fit |
| Incremental fit index (IFI) | 1.000 (1.001) | ≥ 0.95 | Byrne (2016) | Excellent fit |
| Root mean residual (RMR) | 0.014 | ≤ 0.05 | Kline (2023) | Excellent fit |
| RMSEA | 0.000 | ≤ 0.05 | Hu and Bentler (1999) | Excellent fit |
| RMSEA 90% confidence interval | [0.000, 0.042] | Upper bound < 0.08 | Kline (2023) | High precision |
| RMSEA PCLOSE | 0.982 | > 0.05 | Hair et al. (2019) | Excellent fit |
| Hoelter critical N (0.05) | 654 | > 200 | Byrne (2016) | Sample size adequate |
Note: Unconstrained TLI and IFI values slightly above 1.000 (1.003 and 1.001) indicate a sample discrepancy function close to zero; they are reported as 1.000 (Byrne, 2016).
Table 8.
Structural path coefficients and hypothesis testing results (N = 350).
| Hypo. | Structural path | Unstd. B | Std. error | t-value (C.R.) | p-value | Std. β | Bootstrap 95% CI | Bootstrap p | Outcome |
| H1 | Talent Acquisition → Org. Performance | 0.021 | 0.025 | 0.825 | 0.409 | 0.033 | [−0.042, 0.105] | 0.369 | Not supported |
| H2 | Training & Development → Org. Performance | 0.251 | 0.040 | 6.271 | < 0.001 | 0.288 | [0.183, 0.378] | < 0.001 | Supported |
| H3 | Performance Management → Org. Performance | 0.204 | 0.043 | 4.745 | < 0.001 | 0.210 | [0.123, 0.298] | < 0.001 | Supported |
| H4 | Reward & Recognition → Org. Performance | 0.240 | 0.042 | 5.668 | < 0.001 | 0.267 | [0.175, 0.361] | < 0.001 | Supported |
| H5 | Talent Retention → Org. Performance | 0.221 | 0.042 | 5.285 | < 0.001 | 0.233 | [0.150, 0.316] | < 0.001 | Supported |
Note: Dependent variable: Organizational Performance (R2 = 0.561, SE = 0.048, p = 0.001). Bootstrap resamples = 5,000.
Table 9.
Measurement structure of the endogenous performance construct.
| Indicator | Balanced Scorecard perspective | Unstd. B | SE | C.R. (t) | Standardized loading (λ) | Variance (R2) | Error term |
| OPFIN_Avg | Financial | 1.000 | — | — | 0.884 | 0.781 | ε2 |
| OPCIT_Avg | Citizen/Customer | 0.985 | 0.044 | 22.230 | 0.859 | 0.737 | ε3 |
| OPINT_Avg | Internal Processes | 0.991 | 0.043 | 22.802 | 0.870 | 0.756 | ε4 |
| OPLRN_Avg | Learning & Growth | 1.054 | 0.042 | 24.979 | 0.909 | 0.826 | ε5 |
Note: All factor loadings are significant at p < 0.001. OPFIN_Avg was fixed to 1.000 for model identification.
Table 10.
Correlations among the exogenous predictors.
| Association | Correlation (r) | Std. error (SE) | Bootstrap 95% CI | p-value |
| TA_Avg ↔ TDT_Avg | 0.269 | 0.050 | [0.170, 0.363] | < 0.001 |
| TA_Avg ↔ TPM_Avg | 0.204 | 0.053 | [0.098, 0.304] | < 0.001 |
| TA_Avg ↔ TRR_Avg | 0.217 | 0.055 | [0.105, 0.322] | < 0.001 |
| TA_Avg ↔ TR_Avg | 0.223 | 0.058 | [0.108, 0.335] | < 0.001 |
| TDT_Avg ↔ TPM_Avg | 0.387 | 0.046 | [0.293, 0.475] | < 0.001 |
| TDT_Avg ↔ TRR_Avg | 0.447 | 0.042 | [0.361, 0.526] | < 0.001 |
| TDT_Avg ↔ TR_Avg | 0.356 | 0.045 | [0.263, 0.441] | < 0.001 |
| TPM_Avg ↔ TRR_Avg | 0.420 | 0.039 | [0.338, 0.491] | < 0.001 |
| TPM_Avg ↔ TR_Avg | 0.315 | 0.050 | [0.214, 0.412] | < 0.001 |
| TRR_Avg ↔ TR_Avg | 0.423 | 0.046 | [0.325, 0.506] | < 0.001 |
Disclaimer/Publisher’s Note: The statements, opinions and data contained in all publications are solely those of the individual author(s) and contributor(s) and not of MDPI and/or the editor(s). MDPI and/or the editor(s) disclaim responsibility for any injury to people or property resulting from any ideas, methods, instructions or products referred to in the content. |
© 2026 by the authors. Licensee MDPI, Basel, Switzerland. This article is an open access article distributed under the terms and conditions of the Creative Commons Attribution (CC BY) license (http://creativecommons.org/licenses/by/4.0/).
Copyright: This open access article is published under a Creative Commons CC BY 4.0 license, which permit the free download, distribution, and reuse, provided that the author and preprint are cited in any reuse.