

Submitted:
03 November 2026
Posted:
06 November 2026
You are already at the latest version
Abstract
The study investigates hidden costs of green trade, focusing on environmental regulation, market access, and unequal value capture in West African cocoa supply chains. Environmental due diligence increases the commercial importance of verified origin information, reshaping supplier relationships and the distribution of compliance burdens. Focusing on Côte d’Ivoire, with Ghana and five additional West African producers providing regional context, the analysis combines 2016–2024 cocoa export destinations with 2024 trader-level procurement disclosures. An exposure–visibility decomposition measures European market dependence and public sourcing traceability, while sharp allocation bounds and an aggregate adding-up constraint examine indirect procurement among six major trading groups. In 2024, 66.16% of Ivorian cocoa exports were directed to the European Union, and EU-bound indirect sourcing together with undisclosed-origin trade represented 31.70% of national exports. Despite incomplete company-level cross-tabulations, eight pairwise comparisons identify guaranteed differences in EU-bound indirect procurement volumes. A disclosure-priority measure identifies where additional transaction information could reduce uncertainty effectively. The study advances the literature by connecting identifiable trade-network structures to the economic governance of traceability and by specifying how disclosure requirements can address consequential information gaps. A complementary framework examines producer adaptation costs, buyer screening, record portability, and bargaining opportunities as channels shaping inclusive market participation and value capture. Policy implications concern targeted data disclosure, interoperable verification systems, and safeguards for supplier mobility. The trade-based evidence identifies sourcing exposure and asymmetries in public disclosure; producer-level distributional outcomes and environmental effects require linked farm, buyer, and ecological records. Across countries, institutional differences warrant cautious interpretation of regional comparisons.
Keywords:
West African cocoa
; environmental due diligence
; market access
; cocoa supply chains
; partial identification
; international trade
1. Introduction
International trade governance increasingly reaches beyond tariffs, quotas, and customary product standards. Environmental due diligence, geolocation, supply-chain transparency, and commodity-origin verification now influence market participation. These requirements can improve accountability for environmental externalities embedded in international consumption, but they also alter transaction costs, the informational capabilities suppliers must possess, and the bargaining relationships between producers and downstream firms. Consequently, their development implications depend on who finances compliance, who owns or controls the resulting information, and who appropriates associated commercial gains. The case of cocoa is analytically important. Côte d’Ivoire and Ghana play central roles in cocoa production, but much of the international value chain is organised beyond the farm. Cocoa growers are often smallholders, while institutions and companies with markedly different levels of capital and information coordinate purchasing, finance, trade, processing, manufacturing, and retail transactions. Meeting a new environmental requirement can protect a farmer’s access to a purchaser without necessarily increasing farm productivity, net income, or negotiating power. Conversely, shared services and credible contracts can make traceability a stronger, more reliable basis for participation. Beyond Côte d’Ivoire and Ghana, West African cocoa production extends to Nigeria, Sierra Leone, Liberia, Togo and Guinea. This broader regional geography matters because compliance-related fixed costs, aggregation arrangements and buyer options may have different implications across production systems of very different scales. The study therefore retains its detailed trade-network measurement for Côte d’Ivoire, its institutional comparison for Ghana, and adds a transparent seven-country production baseline. This contextual extension should not be mistaken for seven-country estimates of EUDR compliance, producer income or export-market access. The European Union Deforestation Regulation (EUDR), Regulation (EU) 2023/1115 as amended, creates an especially relevant contemporary setting. Under the current timetable, principal obligations apply from 30 December 2026 to large and medium operators, with a later 30 June 2027 date for most qualifying micro and small operators. It covers cocoa and specified derived products, among other commodities, and links market access to deforestation, legality, and due diligence requirements [1,2] (European Commission, 2026; European Union, 2023). These describe obligations for regulated operators and traders; they should not be mistaken for a direct, blanket legal duty that applies identically to every individual farmer in an exporting country. Three outcomes are routinely conflated. Environmental compliance concerns whether a product and its associated due diligence information satisfy applicable requirements. Commercial inclusion concerns whether particular producers can continue supplying buyers who serve regulated markets. Economic upgrading concerns whether those producers retain additional income, services, capabilities, or bargaining opportunities after accounting for costs. The outcomes are connected, but no logical identity makes them equivalent. A procurement network might improve its documented environmental profile by retaining better-equipped suppliers and dropping less-equipped ones. Aggregate compliance would then rise, while vulnerable producers would lose commercial opportunities. Alternatively, buyers could finance traceability infrastructure, farmers could keep portable records, and cooperative organisations could negotiate conditions that let all three outcomes improve. These distinctions matter for empirical interpretation. National export values or volumes cannot reveal which farmers were excluded from a monitored network. Registering a farm does not establish that its beans have reached an EUDR-compliant consignment. A nominal farm-gate premium does not establish that net income has risen. Likewise, a firm’s assertion of traceability does not independently verify forest outcomes. Analysis must therefore define each outcome precisely and use data corresponding to the level at which the proposition is made. The study asks under which institutional and commercial conditions environmental traceability promotes inclusive upgrading rather than exclusionary restructuring in cocoa-producing economies. The general answer advanced here is conditional. Regulatory requirements produce new fixed and recurrent costs and make origin information commercially valuable. The consequences depend on how those costs are distributed, the quality of collective organisations, the portability of information, access to alternative purchasers, and public institutions’ ability to coordinate credible services. The study makes a deliberately narrower claim than the assertion that environmental standards exclude farmers. Its object is the empirical condition under which verification improvements coexist with gains or losses for the original producer population. That population includes suppliers who remain with incumbent buyers, producers who switch purchasers, and growers who leave particular export channels. Consequently, a favourable average return among recorded compliant sellers is an incomplete sustainability statistic. The conceptual contribution is an accounting measure of adaptation-cost incidence; the theoretical contribution is a two-sided selection model in which producer investment and buyer procurement choices jointly determine participation; the methodological contribution is a set of estimands that preserves the initial population denominator. The three elements are complementary, and each can be rejected by appropriately designed field evidence. The point of departure also differs from a general critique of certification. Cocoa certification studies have already shown that collective membership, contract design, and social and environmental outcomes can move in different directions [3,4,5] (Ingram et al., 2018; Krumbiegel & Tillie, 2024; Wätzold et al., 2025). New evidence on contract formalisation suggests that documentation may constrain buyer choice [6] (Carodenuto et al., 2025). The present study asks what to measure to determine whether improved documentary conformity reflects genuinely broader producer capability or a narrower, easier-to-monitor supplier set. This is a testable distinction, rather than a presumption about the consequences of the European regulation. The research’s incremental contribution is narrow and verifiable. Existing research has mapped Ivorian sourcing transparency, established the importance of independent governance in public disclosure, and examined first-mile contractual power [7,8] (Trase, 2026; Guye et al., 2026). The analysis uses those marginal totals to identify what it can say about EU-bound indirect procurement for named trading groups without assuming how each group allocates its intermediated cocoa across destinations. The study reports both the national jointly observed gap and sharp company-specific bounds, incorporates the aggregate cross-company adding-up constraint, and identifies robust procurement-volume orderings. A separate theory of supplier retention and cost incidence disciplines the economic interpretation. The novelty is this transparent identification exercise and its connection to a refutable welfare framework, not a claim to have discovered opacity, exclusion, information rents or the underlying mathematics of partial identification. The regional scope is specified at three analytical levels. West African cocoa-producing countries Côte d’Ivoire, Ghana, Nigeria, Sierra Leone, Liberia, Togo and Guinea, enter a common-calendar-year production comparison. Côte d’Ivoire alone contributes the matched destination-by-sourcing statistics needed for the study’s partial-identification exercise. Ghana remains a separately documented institutional comparator, while the five additional producing countries provide external-validity context rather than assumed replication of Ivorian estimates. Cameroon is an important nearby cocoa producer, but it is geographically in Central Africa and is not counted as a West African observation. This explicit hierarchy makes the title geographically informative without overstating the geographic reach of the econometric findings. The remainder of the research is organised as follows. Section 2 reviews the relevant literature and develops the theoretical framework. Section 3 presents research methodology details. Section 4 reports the empirical results. Section 5 discusses the implications for market access, information governance, and inclusive economic upgrading. Section 6 concludes with the principal findings and directions for further research.
2. Literature Review and Theoretical Framework
Sustainability-oriented trade regulation alters the conditions under which a commodity can reach a destination market. The economic effect is therefore broader than the administrative burden of completing a form: compliance can become a prerequisite for participating in a particular transaction, reshape how buyers identify suppliers, and change the relative value of verifiable information. The European Union Deforestation Regulation (EUDR) is particularly relevant because it links specified commodities and derived products, including cocoa, to due diligence, deforestation-free and legality requirements. The regulation distinguishes legally responsible operators and traders from cocoa farmers who supply the underlying commodities. The regulation’s principal obligations are scheduled to apply from 30 December 2026, with the later date of 30 June 2027 for qualifying micro and small operators [9] (European Union, 2025). At the time of this study, evidence primarily concerns preparation, anticipation, voluntary policies and changing procurement practices rather than realized post-application producer effects. The analytical starting point is that public legal obligations and private buyer protocols are not interchangeable.
Public law establishes requirements for covered activities; importers, exporters and intermediaries may implement additional contractual procedures to manage legal exposure, reputational risk or sourcing complexity. The downstream firm’s privately optimal response can be to improve support for a broad supplier population, to concentrate procurement among previously registered suppliers, or to separate regulated from other destinations. Because the same legal framework permits different organizational responses, observed changes in farmer welfare cannot be attributed to regulatory text alone. Research on private standards has long stressed distinctions among public rules, buyer-specific standards and their institutional effects [10] (Blind et al., 2017). That insight becomes especially important when private information platforms are treated as if they were legal requirements imposed identically on every individual producer. Global value-chain theory explains why market-access benefits are rarely divided according to the number of participants. An established governance framework relates interfirm coordination to transaction complexity, codifiability and supplier capabilities.
An established governance framework relates interfirm coordination to transaction complexity, codifiability and supplier capabilities [11] (Statsenko et al., 2025). Applying that logic to cocoa suggests that documentation and geolocation raise the codifiability of origin-related attributes while shifting the locus of competitive advantage toward organizations that can assemble, validate and transfer reliable records. Greater codification may improve transparency, yet it may also alter bargaining asymmetries when one buyer controls the records required to establish eligibility. The governance mechanism is therefore not the mere existence of data, but the distribution of access rights, verification authority and the ability to contract with alternative buyers.
2.1. Governance, Standards and Producer Capability
The political economy of sustainability provides a complementary account of distribution. When environmental management becomes a source of competitive differentiation and market assurance, downstream firms can capture commercially valuable rents even where ecological improvements occur upstream [12] (Ponte, 2020). Such a finding should not be read as evidence that every buyer benefits at farmers’ expense. Competition, long-term contracting, cooperative services and public investment may transmit gains toward origin countries. The testable tension is narrower: a chain can achieve process or product-related environmental upgrading without equivalent income, functional or bargaining upgrading for cocoa producers. Thus, sustainable sourcing is better assessed through distinct environmental, commercial and distributional outcomes than by a single compliance rate.
Transaction-cost economics provides a mechanism for uneven adaptation. Parcel mapping, record correction, staff training, documentation, duplicate registrations and the time spent verifying origin introduce initial and recurrent resource requirements. A portion may be a fixed cost, creating scale economies in compliance per unit sold; other expenses vary with shipment volume or the number of trading relationships. Under incomplete information, buyers also face uncertain verification and reputational costs. They may respond by increasing the frequency of checks or reducing their supplier base. A contracting perspective from transaction-cost economics is useful here because it directs attention to governance alternatives rather than assuming spot markets will efficiently allocate complex verification tasks [13] (Trejo-Pech et al., 2023). The empirical issue is who ultimately bears each cost after transfers, subsidies and contractual adjustments.
Evidence from standards-intensive agricultural trade cautions against one-sided predictions [14,15] (Traldi, 2021; Fateh et al., 2026). In Senegalese horticulture, tighter standards coincided with restructuring away from smallholder contracts, but income gains continued through employment channels, showing that supplier exclusion and household welfare need not move in the same direction. A review of producer-level certification found that credible evidence of economic or environmental benefits was more limited than promotional claims often suggested [16] (Fiankor et al., 2021). These contributions justify studying both the extensive margin of supplier participation and the unconditional welfare of households, including alternative sales and nonfarm income where relevant. They do not establish the magnitude of any EUDR-specific effect in cocoa.
Recent cocoa research has improved identification of organizational determinants of sustainable practices. Evidence from more than 1,700 growers in Côte d’Ivoire and Ghana indicates that certification and cooperative participation are associated with different sustainability outcomes across the two countries, underscoring the importance of the institutional setting (Krumbiegel and Tillie, 2024). An investigation of western Côte d’Ivoire links cooperative participation to greater awareness of new European regulatory demands, while distinguishing knowledge of requirements from actual verified compliance [17] (Moluh Njoya et al., 2025). These studies demonstrate that collective organization can provide access to training and administrative capabilities; they do not identify how the privately borne financial burden of traceability is divided between retained and excluded producers.
Regional scholarship and comparative evidence should distinguish the dominant producing economies from smaller origins rather than treating ‘West Africa’ as a homogeneous cocoa system. FAOSTAT-based production data show that Nigeria, Sierra Leone, Liberia, Togo and Guinea also contribute to regional cocoa supply. Their inclusion reveals variation in the scale over which fixed verification investments could be spread, but production volumes alone cannot establish registration quality, buyer concentration, sustainability-program intensity or the distribution of compliance costs. Consequently, hypotheses about heterogeneous burdens remain conditional and require comparable buyer- and producer-level records for each origin [18,19] (FAO, 2025; Our World in Data, 2026).
Research on corporate forest policies likewise reveals the limits of treating project participation as a full sustainability outcome. Drawing on stakeholder interviews in Côte d’Ivoire and Ghana, reported evidence points to shortcomings in the design and implementation of forest-focused company policies, including difficulties engaging farmers outside direct sourcing arrangements [20] (Addoah et al., 2025). The implication is methodological: measuring success within the organizational perimeter of a corporate program can systematically omit people exposed to sourcing changes. Such evidence motivates a baseline producer-population approach. It does not establish that all private forest policies are ineffective, or that farmers outside a particular company’s supply chain necessarily suffer income losses.
A growing body of work makes contracting itself an object of inquiry rather than a neutral implementation device. Evidence from 107 interviews across Côte d’Ivoire and Ghana examines first-mile formalization and shows that more structured arrangements can coexist with restrictions on autonomy and buyer choice [21] (Razak et al., 2024). Formality can improve clarity and reduce disputes while making relationships more exclusive or information-dependent. Neither the existence of a signed agreement nor the receipt of a training certificate identifies the producer’s actual ability to exit. Relevant observables include pricing clauses, data access, exclusivity, repayment obligations, dispute-resolution procedures and the number of buyers who will accept a producer’s existing records.
2.2. Contracts, Intermediaries and the Unresolved Identification Problem
The role of intermediaries is similarly heterogeneous. Evidence assembled by the European Commission’s Joint Research Centre from 1,071 cocoa producers and 293 buyers finds differences in trust, the stability of relationships and purchasing services across cooperatives, agents and other primary buyers [22] (Van Hee et al., 2025). Such relationships often provide liquidity, logistics, weighing services and local information. Replacing intermediaries may simplify verification while simultaneously removing valuable commercial services. A welfare analysis therefore needs a net accounting of benefits forgone and services replaced, rather than equating direct sourcing with inclusion or indirect sourcing with wrongdoing. These findings also limit the value of generic contrasts between a nominally centralized Ghanaian system and a more fragmented Ivorian network.
Supply-chain transparency has become measurable at some aggregate levels, but the underlying concepts require discipline. Previous research links traceability limitations to deforestation-risk assessment in Ivorian cocoa sourcing [23] (Renier et al., 2023). A subsequent Trase analysis reports that 48% of the cocoa export volume from Côte d’Ivoire in 2024 could be linked, using publicly disclosed trader information, to cooperatives and their departments of production; 34% was associated with indirect sourcing, while 18% lacked sufficient supplier disclosures [24] (French et al., 2026). These are categories of public supply-chain visibility and disclosure. They are neither the fraction of farms legally compliant with the EUDR nor measures of the share of cocoa that is deforestation-free. The distinction matters because an information gap may reflect the absence of publication even where private verification records exist.
Data infrastructure nonetheless influences the organization of economic exchange. A cooperative or buyer that verifies parcel attributes bears some expense in creating commercially useful information. If validated records are not accessible or reusable, a producer changing purchasers may have to pay again for mapping, risk screening or administrative corrections. Such switching costs can reinforce incumbent relationships even where suppliers meet the substantive environmental standard. Conversely, independently verifiable and permission-based portable records may reduce duplicate expense without reducing legal diligence. A well-designed study must therefore record data custody, permission to transfer records, actual transfer delays and rejection rates; a binary variable indicating possession of a digital identifier is insufficient.
Market power also matters beyond the first mile. Qualitative research on Ghana identifies the possibility that EUDR-related arrangements may fragment cocoa supply chains as destination markets differ in regulatory requirements and buyers reorganize their networks [25] (Weber, 2026). This finding complicates a simple prediction of universal harmonization. Producers may shift output toward buyers serving less restrictive destinations, but the resulting price, payment security and environmental consequences are empirical questions. Segmentation can reduce economic damage to an excluded producer when alternative markets are remunerative, or increase vulnerability if the alternatives pay less or provide fewer services. The appropriate analytical unit is therefore the producer’s feasible choice set rather than membership in a single certified or monitored chain.
The strongest findings of the existing literature already establish three propositions that this study does not claim to discover: standards can reorganize agricultural procurement; cooperatives and contracts affect adaptation capabilities; and sourcing transparency can be incomplete even in internationally integrated commodity chains [26] (Gupta et al., 2024). Yet these strands use different outcomes and observation units. Studies of sustainable practices often focus on participants; studies of contracting examine autonomy and power; trade maps assess public visibility of export flows; and institutional analyses examine the geography of regulatory diffusion. None of those outcomes, taken alone, identifies the distribution of the economic surplus from verified sourcing across the original producer population.
A particularly close point of comparison is a recent analysis arguing that public supply-chain transparency complements and corrects regulatory due diligence, illustrated with West African cocoa data. That study establishes a normative and institutional case for disclosure, whereas the present article asks a narrower econometric question: with a destination total, a procurement-channel total and overall sectoral constraints, which company-level EU sourcing comparisons are logically identified? The answer is an identification region and a set of guaranteed orderings, not an estimate of an EUDR impact. Related Ghanaian research also finds segmentation of compliance-oriented supply chains, while producer-level evidence associates cooperative membership with preparedness rather than completed compliance [27] (Ayam, 2024). These studies jointly motivate an analysis that refuses to interpret missing public sourcing links as unlawful procurement or to generalize Ivorian trading-group arithmetic to Ghanaian farm incomes. The contribution developed below is an accounting and selection-aware synthesis with a clear falsification criterion. It joins privately borne net adaptation costs to a two-sided participation process in which both the producer and purchaser must choose to transact. It subsequently treats record portability and local buyer competition as complementary conditions shaping the producer’s share of incremental surplus. This approach predicts circumstances in which average returns among monitored suppliers rise as overall participation falls, as well as circumstances in which verification, access and incomes improve together. Its value lies in the explicit integration and testability of these mechanisms, not in claiming to invent transaction costs, certification economics, bargaining asymmetry or producer exclusion.
The literature therefore supports two claims but leaves a specific quantitative interface underdeveloped. Supplier capability and purchasing governance affect the feasibility of standards, while information disclosure is uneven along commodity networks. What remains analytically useful is to connect a measurable destination-exposure distribution with observed sourcing visibility, while preserving the distinction between aggregate vulnerability, legal compliance and welfare incidence. This study does so through a transparent exposure measure and a complementary microeconomic model whose distributional predictions are deliberately testable rather than assumed. Related methodological insight. Partial-identification econometrics supplies a way to report what trade data reveal when a required cross-tabulation is absent, instead of substituting a model-based guess for the missing joint allocation. Its contribution to this paper is limited but precise: the sharp bounds in Section 3 are arithmetic consequences of observed trader margins. They do not identify producer welfare or replace the contract and cooperative literatures discussed above.
2.3. Theoretical Framework
Environmental traceability may change cocoa supply chains through three mechanisms: the incidence of verification costs, two-sided supplier selection and bargaining over information-enabled surplus. These mechanisms are complementary but empirically distinct. More extensive origin documentation can coexist with improved producer opportunities, uncompensated adjustment burdens or a smaller procurement network. Public source visibility, consignment-level legal diligence and household welfare therefore require separate measurements [28] (McDermott et al., 2025). Compliance costs and productive capability. Parcel geolocation, record correction, mapping, training and ongoing verification impose fixed and variable resource demands. The farmer’s private burden depends on cost sharing, fees, deductions and the reliability of cooperative or buyer services. A high fixed cost per kilogram can make participation difficult for small-volume growers, but shared infrastructure may improve affordability. Recent evidence concerning cocoa and chocolate firms documents sizable organizational adjustments, without establishing equivalent costs for individual West African farming households [29,30] (Braun et al., 2026; Van Loco and Campera, 2026). Two-sided selection and market access. A producer must prefer a verified selling arrangement to available alternatives, and a purchaser must simultaneously be willing to finance and transact with that supplier. Buyers may respond to verification expenses by financing supplier support or concentrating purchases among readily documented farms. Contract formalization can increase certainty while narrowing a grower’s freedom to sell elsewhere. Accordingly, observed exit should be separated into buyer refusal, voluntary switching and production-related interruption. Information control and unequal value capture. Origin data are economically useful only when accurate, accessible and accepted for relevant transactions. A buyer-controlled record may reduce audit uncertainty while generating switching costs if it cannot be reused by other purchasers. Record portability is likely to improve bargaining conditions when viable competing buyers exist, rather than automatically raising producer prices. The distributional question concerns incremental net benefits retained after farmers’ own compliance expenses and forgone alternatives. This framework motivates the Compliance–Value Capture Gap and a baseline-cohort inclusion measure defined in Section 3, rather than claiming that export-volume statistics reveal farm incomes. The framework yields falsifiable expectations: relatively high privately borne fixed costs may reduce continued participation among low-volume suppliers; effective cooperative services may attenuate that burden; and accepted, portable records may improve bargaining where buyer competition is credible. Average benefits among retained suppliers could rise while unconditional income among the initial producer cohort falls. These predictions remain prospective. Their testing requires linked farm transactions, actual verification payments, reasons for market exit, accepted record transfers and observable alternative-market earnings. No post-application causal effect of the European Union Deforestation Regulation is inferred from 2016–2024 trade data.
3. Methodology
3.1. Research Design, Data and Provenance
The analysis separates three observation levels. Calendar-year destination volumes from 2016 to 2024 describe the exposure of Côte d’Ivoire cocoa exports to European markets. The 2024 trader and source-origin aggregates support an accounting decomposition and sharp bounds for six major trading groups and the remaining exporters. A separate seven-country calendar-year production comparison provides regional context. Ghana is examined institutionally; individual producers’ verification expenses and welfare are not observed. The design is descriptive and partially identified, rather than a causal impact evaluation. The primary source is the published Côte d’Ivoire cocoa supply-chain mapping and accompanying downloadable tables. The sources report disclosed commercial links, not EUDR-compliant consignments or verified absence of deforestation. Destination is recorded at the observed trade stage and need not equal final consumption. Production comparisons use the FAOSTAT cocoa-bean production quantity series for calendar year 2024, also distributed through Our World in Data, for Côte d’Ivoire, Ghana, Nigeria, Sierra Leone, Liberia, Togo and Guinea. Cocoa-year estimates for Côte d’Ivoire and Ghana are retained separately as reported by the International Cocoa Organization. Differing calendars, units and source methodologies are not treated as interchangeable. Data are reported as published and calculations are rounded only for presentation. The operational definitions and their observational status are reported in Table 1 and Table 2. Variables constructed from trade records are distinguished from proposed producer-income measures that are not estimated. All quantitative trade components use reported export tonnes, and the same source vintage and denominator are maintained for each identity.
3.2. Modelling Cocoa Export Specialisation
3.2.1. Destination Exposure and Public Visibility
Let Xdt denote tonnes exported to destination group d in year t, and let Tt denote reported national export tonnes across all groups. The European destination share, Et, is defined by Equation (1). Changes in the share represent differences in first-destination concentration rather than changes in individual farmers’ legal status.
For 2024, IEU denotes EU-bound tonnes acquired via indirect procurement, and UEU denotes EU-bound tonnes without publicly attributed supplier origin. Equation (2) defines the share of total national exports with an EU-bound public visibility gap, MEU, and the corresponding conditional share of EU exports, CEU. The two categories represent distinct kinds of missing public sourcing information; neither is a legal noncompliance rate.
3.3. Trader-Level Partial Identification and National Constraints
For trading group j, Tj is total exported tonnage, Ej is EU-destined tonnage, Ij is tonnage sourced indirectly across all destinations and xj is the unobserved overlap between the latter two flows. Independent allocation of indirect purchases across destinations cannot be assumed. Non-negativity of the four cells in the underlying destination-by-procurement cross-tabulation therefore implies the sharp logical bounds in Equation (3) [31,32] (Manski, 1989; Tamer, 2010).
The six named trading groups are complemented by a seventh residual group representing all other exporters. If company and national categories are harmonized to the same reporting universe, the national observed EU-indirect total imposes the additional adding-up identity in Equation (4). Feasible minimum and maximum values of each xj are obtained under these joint constraints by linear programming. The assumption of a shared and exhaustive accounting universe is essential; categories with incompatible coverage cannot be added mechanically.
The same feasible set gives robust comparisons: group j is necessarily larger in EU-bound indirect tonnage than group k only if the minimum possible value of xj − xk over all feasible allocations is positive. This establishes a strict ordering of volumes, not a ranking of legal compliance, profitability or farmer treatment. The supplied results additionally report conservative comparisons supported by independent company bounds. Deterministic bounds are neither confidence intervals nor estimates of an unobserved overlap.
An additional descriptive statistic is the identified interval width wj = Uj − Lj. This is the maximum absolute tonnage uncertainty that would disappear if the trader disclosed the relevant destination-by-channel cell. Ranking wj gives a reproducible public-information priority, not a measure of deforestation, misconduct or actual verification cost
3.4. Producer Cost Incidence and Welfare Estimands
The conceptual producer-level extension distinguishes physical compliance resources, the share privately paid by a farmer and the benefits actually retained. denote annualised privately financed verification expenses for farmer i in period t, including out-of-pocket fees, attributable administrative costs and valued time. denote incremental, nonduplicated monetary and service benefits attributable to the arrangement relative to a stated feasible alternative. Equation (5) defines the Compliance–Value Capture Gap. A positive value denotes a shortfall in retained attributable benefits relative to private adaptation costs; it is not a measure of total farm profitability.
Continued participation requires both buyer willingness to transact and producer acceptance relative to credible outside options. For a fixed cohort of initially eligible producers, inclusion is the proportion completing at least one regulated-channel transaction, and cohort welfare is mean net cocoa-related income across all buyers, including those who exit the original network. Mean income restricted to retained suppliers is a selected statistic and cannot replace the baseline-cohort denominator. Differences across policy-support arrangements could be evaluated through linked producer and purchaser records, verified baseline comparability and a defensible identification strategy [33] (Callaway and Sant’Anna, 2021). Such records are outside the current dataset, so neither the gap nor a producer welfare effect is numerically estimated.
3.5. Reproducibility, Checks
All reported ratios can be reproduced by summing published source categories and checking their shared denominators. Identification bounds require verification of Tj ≥ Ej, Tj ≥ Ij, and Lj ≤ Uj, together with non-negativity and national accounting consistency before solving the joint feasible region. Calculations can be implemented using Python 3.10 and Microsoft Excel, including Excel Solver for linear programming.
4. Results
4.1. Evolution of European Market Share in Côte D’ivoire’s Cocoa Exports
The destination panel shows the EU as the largest reported first-destination group throughout 2016–2024. Its share rose from 63.30% of export tonnes in 2016 to 66.16% in 2024, an increase of approximately 2.9 percentage points. However, this evolution was not monotonic: the share declined to 55.47% in 2021 before reaching 66.16% in 2024, while its nine-year unweighted average was 60.44%. Consequently, the data indicate persistent European market concentration alongside substantial annual fluctuations, rather than a continuous upward trend. Figure 1 illustrates these variations throughout the study period.
EU-bound cocoa export volume was approximately 940,870 tonnes in 2016 and 1,016,314 tonnes in 2024. The 2024 EU volume was lower than the 2022 Figure 1 of 1,160,183 tonnes even though its share was larger in 2024. This divergence indicates that the EU destination share can increase when exports to other destinations decline more rapidly than shipments to the European market. The same distinction applies to export value and volume; this study uses physical tonnes and does not equate the destination measure with export earnings, prices or value added. The EU’s substantial share of Côte d’Ivoire’s cocoa exports highlights the importance of European market requirements and buyer procurement decisions for the organization of cocoa supply chains. However, the observed destination shares describe trade concentration rather than the effects of environmental regulation. Because the EUDR application dates are in late 2026 and mid-2027, the 2016–2024 destination observations cannot be interpreted as treatment outcomes following implementation. They document the commercial structure within which anticipatory investments and later adjustments may occur.
4.2. Exact 2024 Eu Sourcing Decomposition
The 2024 table permits the countrywide destination share and the EU’s origin-attribution categories to be combined at the same level of aggregation. Out of approximately 1,536,045 exported tonnes, around 1,016,314 tonnes went to EU destinations, corresponding to 66.16% of all exports. Within that EU-directed volume, Trase reports 343,666 tonnes sourced indirectly through intermediaries and 143,231 tonnes assigned to unknown publicly disclosed supplier origin. The remaining 529,418 tonnes are attributed to directly linked sourcing. The two unlinked categories sum to about 486,896 tonnes, or 47.91% of exports to the EU. Viewed against all national cocoa exports, EU-bound indirect purchases account for 22.37 percentage points and EU-bound unknown attribution for 9.32 percentage points. Their sum is the precisely defined destination-specific information gap M_EU = 31.70% of the national export volume in 2024. Table 3 and Figure 2 exhibit the components separately. This distinction is policy-relevant because intermediary sourcing and disclosure deficits are administratively different phenomena, even when both prevent the public reconstruction of farm-origin links.
The directly linked EU category represents 34.47% of all exports, while exports to other destinations account for 33.84%. These four shares total 100% subject to rounding: EU direct-linked, EU indirect, EU publicly unidentified and non-EU. This exhaustive accounting acts as an internal validation check. It does not imply that only 34.47% of national production is geolocated, or that the other categories fail EU legal requirements. A producer may have valid private evidence unavailable in the public Trase map, and mapping a cooperative to a department is weaker than tracing a regulated consignment to the relevant individual land plots.
The 31.70% figure is more informative than multiplying countrywide origin visibility by the EU export share, because the direct joint EU breakdown exists in the source. It is also preferable to assigning the same 48.21% national direct-procurement rate to every destination. The exact total shows that the EU-linked public-origin gap is concentrated in procurement routes and disclosure categories rather than being a uniform property of the entire export portfolio. It should be called an exposure–visibility accounting result, not a compliance-adjusted export risk score.
4.3. Partial Identification of Company-Level Eu Cocoa Procurement
The six leading trader groups together handled approximately 1,029,990 tonnes, equivalent to 67.05% of all reported Ivorian cocoa exports in 2024. Their volume-weighted direct sourcing was 62.79%, substantially above the reported overall direct sourcing figure of 48.21%. This difference shows that the sourcing pattern of the largest named traders is unrepresentative of the broader trading population. It is consistent with differences in procurement organization and public reporting, without by itself establishing which organizational practice is environmentally or economically superior. Company-level direct-sourcing shares span 19.11% for Sucden to 86.35% for Barry Callebaut. The underlying EU-bound volumes and company-specific indirect totals do not reveal their intersection. Equation (3) turns this missing joint allocation into an informative interval. Ecom’s EU-directed indirect share is bounded between 46.08% and 83.22%; Sucden’s between 69.45% and 100%; Touton’s between 19.06% and 74.10%. Cargill’s bound is 2.20% to 26.82%. Barry Callebaut’s lower bound is zero and upper bound is 21.33%, whereas Olam’s range is zero to 37.90%. These are sharp logical identification regions under the disclosed margins in Table 4.
The lower bound has an intuitive interpretation. If a trading group reports a larger combined tonnage of EU sales and indirect procurement than its total exports, at least the amount of that excess must occupy both categories. The upper bound follows because the overlap cannot exceed either marginal volume. For Sucden, for example, the reported indirect procurement is so large relative to total volume and EU sales that even a maximally favorable allocation cannot eliminate EU-bound intermediary sourcing. For Barry Callebaut and Olam, the published margins permit an allocation in which none of the indirectly procured tonnes is directed to the EU. This difference is informative about identification, not about actual buyer compliance.
Figure 3 displays the six intervals without midpoint markers, preventing readers from misreading an arbitrary central value as an estimate. The intervals also indicate which supplementary information would be most valuable: disclosure of EU-directed procurement by sourcing channel would transform broad bounds into point-identified quantities, allowing regulators and researchers to distinguish a firm’s destination mix from its procurement strategy. Different intervals should not be interpreted as a league table of regulatory performance or compared causally across companies with unlike business models, reporting boundaries and exposure to indirect suppliers.
4.3.1. Joint Feasibility and Robust Procurement Comparisons
The adding-up exercise produces a substantive aggregate. The six leading groups jointly exported 712,277 tonnes to the EU, but the public tables do not identify how much of that specific flow came through intermediaries. The residual exporters held only 136,203 tonnes of indirect procurement across all destinations. Consequently, at least 207,463 of the known 343,666 EU-bound indirect tonnes must be attributable to the six leading groups, while their theoretical maximum equals the full EU-bound indirect total. Their jointly feasible range is therefore 60.4%–100.0% of EU-directed indirect procurement. This inference is sharper for the group of six than summing their stand-alone lower bounds, because it imposes the national identity. For each individual group, however, linear optimization confirms that the national constraint leaves the original bounds unchanged.
The remaining identifying information is relational. Based on absolute EU-bound indirect tonnes, ECOM’s minimum feasible volume (63,555 tonnes) exceeds the upper bounds for Cargill (49,947 tonnes), Barry Callebaut (26,802 tonnes), Olam (46,388 tonnes) and Touton (48,080 tonnes). Sucden’s minimum (52,229 tonnes) exceeds these same four upper bounds. Thus eight strict pairwise orderings are guaranteed without observing the missing destination-by-procurement cross-tabulation. No unconditional ordering can be established between ECOM and Sucden: their feasible intervals overlap. These statements are not claims about deliberate opacity, noncompliance, environmental performance or household exploitation.
Figure 4 visualizes the identified comparisons. Filled markers indicate guaranteed strict volume orderings for every joint allocation satisfying the published national and company margins. Open markers denote indeterminate comparisons; they do not indicate equal volumes or identical regulatory performance. The central result is an information-prioritization rule: requesting destination-by-procurement cross-tabulations would replace these wide intervals with directly observed cells, enabling more informative debate over market exposure.
Filled circles indicate necessarily larger procurement volumes under all feasible allocations; hollow circles indicate comparisons without a definitive ranking; grey diagonal cells represent comparisons within the same trading group.
Source: author calculations from (Trase, 2026).
The interval-width diagnostic adds a concrete information-priority result in Table 5. On the currently reported stand-alone intervals, Ecom has the largest unresolved EU-indirect tonnage allocation (51,237 tonnes), followed by Olam (46,388) and Cargill (45,850). These are lengths of identification intervals, not missing physical cocoa volumes. Company-level EU-by-procurement cross-tabulation would collapse the corresponding interval to its observed intersection; the diagnostic therefore quantifies the maximum information recovered by disclosure. Joint national constraints may change the informational ranking if they tighten specific intervals, so the values below are explicitly the disclosed-marginal widths.
The data identify two distinct disclosure questions. The EU-specific unlinked total is directly observed in published source categories, whereas the allocation of EU-directed indirect cocoa across named exporters is only partially identified. The missing trader-by-destination sourcing cell would eliminate the firm-level interval width measured in Table 6 while leaving legal compliance and producer-income questions unanswered. The study thus identifies a precise incremental information requirement, rather than equating more digital records with improved producer welfare.
4.4. Cocoa-Output Context and the Limits of Observed Outcomes
ICCO’s 2025 bulletin reports 2,241 thousand tonnes of Ivorian cocoa output in cocoa year 2022/23 and 1,674 thousand tonnes in 2023/24, a decline of 25.30%. Ghana’s corresponding series moves from 654 to 449 thousand tonnes, a decline of 31.35%, while global output declined by 12.92%. Figure 5 places the two countries’ changes in context. These are production-year estimates rather than destination-year shipments and should not be merged as though they share a calendar or establish a traceability treatment effect.
The comparison nevertheless explains why producer-level conclusions are vulnerable to confounding. Disease, rainfall, farm management, world prices, buying finance and aggregate supply constraints may change both the volume delivered and the willingness of firms to maintain particular networks. An unadjusted difference in a cooperative’s marketed tonnes following registration could represent agronomic shock rather than a regulation-induced procurement decision. Similarly, the observed producer premium may reflect a world-price surge rather than compensation for compliance. This paper does not assert farm exit, private net losses, forest outcomes or causal effects from these national series. The observed contribution is narrower but verifiable: the location of public information gaps within an export market of pronounced European concentration and heterogeneous intermediary sourcing.
The West African regional perspective can be assessed with a separate and consistently dated production dataset. In FAOSTAT year 2024, reported cocoa-bean output reached 1,890,442 tonnes in Côte d’Ivoire, 530,000 tonnes in Ghana and 350,000 tonnes in Nigeria. Sierra Leone (93,750 tonnes), Liberia (30,000 tonnes), Togo (25,000 tonnes) and Guinea (24,222 tonnes) together added 172,972 tonnes. Across these seven reported origins, the sum is approximately 2.94 million tonnes; Côte d’Ivoire and Ghana account for 82.23%, Nigeria for 11.89% and the four smaller producers for 5.88%. Table 7 and Figure 6 report these observed differences.
The seven-country series establish regional reach while preserving inferential boundaries. The predominance of Côte d’Ivoire and Ghana explains the focus of much sectoral research, but it also leaves a set of additional West African origins relevant to future region-wide environmental trade monitoring. Nigeria is the largest of these additional producers in the 2024 baseline. The smaller countries are analytically important because a common administrative template may translate into quite different per-supplier fixed costs when cooperative size, public service availability and purchaser alternatives vary. These mechanisms require direct measurement: the present production table offers no independent evidence of poorer traceability, greater exclusion or lower value capture in any one country. FAOSTAT year production and ICCO cocoa-year production represent distinct time conventions and must not be mechanically combined.
Figure values are production, not exports, legal compliance or producer welfare.
5. Discussion
5.1. What the Observed Decomposition Contributes to Theory
EU market concentration makes origin verification commercially consequential. The fact that almost one-third of all exported cocoa volume is simultaneously EU-bound and not publicly linked to a source through the reviewed data identifies a substantive measurement problem located in a clearly defined portion of the trade system. Because the result is decomposable, it distinguishes the organizational problem of indirect aggregation from the reporting problem of unknown public supplier identity. Neither is reducible to a farmer’s failure to comply. A coherent explanation has to allow that chain participants who manage legitimate mixed sourcing may possess information that a public observer cannot access, and that producer costs may be paid by firms rather than households [34] (Berthet and Fusacchia, 2024).
The contribution can be situated against existing research without overstating novelty. Global value-chain analysis explains asymmetric governance and upgrading possibilities. Research on cocoa certification, cooperatives and environmental policy establishes heterogeneous institutional capacity. Direct attention to cocoa contract formalization and intermediary roles further weakens any attempt to present buyer dependence or fixed costs as unstudied phenomena. The added analytical step is the exact destination-and-visibility decomposition coupled with partial-identification bounds at the trader level and a separate causal model for producer welfare. These distinct levels of evidence can be joined conceptually without disguising missing farm data [35] (Solar et al., 2025).
The two-sided participation model offers one mechanism by which the observed information structure could affect outcomes. Buyers facing high audit or verification costs may choose networks with reliable records, and farmers unable to finance record generation may switch buyers or exit EU-facing procurement. Yet the selection mechanism could also run in the opposite direction: buyer-financed geolocation, cooperative pooling or portable records might reduce private costs and make previously excluded farms eligible. Public-origin opacity has no necessary sign for household welfare. The firm margins therefore cannot prove the model’s exclusion prediction; they establish the scale and heterogeneity of the institutional setting in which the prediction becomes worth testing [36] (Hill et al., 2025).
A useful counterexample is a purchasing network that relies heavily on intermediaries but uses an effective private system of plot identifiers, segregation, consent-based verification and compensation. Such a network could appear opaque in a public dataset yet attain regulatory compliance and preserve farmer returns. Another counterexample is a directly sourced network that increases mapped coverage while passing time-intensive data collection onto smallholders and imposing exclusive selling contracts. Public transparency may then be higher even as bargaining and compensation deteriorate. The empirical categories should therefore be interpreted as information observability, not ranked on a common sustainability scale [37] (Eller, 2025).
Trader-level bounds serve a further theoretical purpose. They show exactly where published corporate information stops identifying the allocation needed for a market-access argument. If researchers had multiplied an exporter’s EU share by its indirect sourcing share, they would have manufactured a firm-specific intersection using an unjustified independence assumption. The wide identified sets for several traders are not an analytic failure; they quantify the limits of information disclosure and indicate what additional cross-tabulation would resolve the uncertainty. The distinction echoes the methodological case for partial identification when available evidence supports informative ranges but not unique point values.
5.2. Rival Explanations, Transportability and Causal Limits
Three alternative explanations merit particular attention. A high indirect-sourcing share may reflect aggregation and logistical services in fragmented production areas rather than deliberate supplier concealment. Limited public disclosure may reflect commercial confidentiality, imperfect interoperability among registries or publication delays, even when private verification records exist. Differences in firms’ direct-sourcing shares may also arise from geography, product mix and established cooperative relationships rather than regulatory strategies. The distinction between private sourcing systems and legally required due diligence is important in interpreting these patterns [38] (Partzsch, 2025). Accordingly, observed differences among trading groups in 2024 are descriptive and cannot be interpreted as effects of environmental regulation.
Regional transferability requires equally careful treatment. The FAOSTAT comparison extends production coverage to Nigeria, Sierra Leone, Liberia, Togo and Guinea, but it provides none of the matched EU-destination-by-procurement data necessary to calculate the Ivorian identification bounds. The 31.70% public-origin information gap and the robust ordering of Ivorian traders therefore cannot be transferred numerically to other producing countries. Differences in organizational capacity, digital readiness and sourcing arrangements may alter how verification requirements affect smallholders across commodity systems and countries [39] (Van Noordwijk; 2025). Assessing such variation requires harmonized country-specific procurement data and comparable information on the initial population of producers.
The producer-level framework also raises selection concerns. Farmers retained in monitored networks may already differ in farm size, documentation, liquidity or proximity to purchasing posts. Restricting an assessment to retained suppliers could overstate average benefits if producers facing high adjustment costs disappear from the observed network. Evidence from Ghanaian certification schemes further indicates that training, inspection and knowledge of premiums can vary substantially across participating smallholders [40] (Ansah et al., 2026). Conversely, a decline in deliveries to an EU-oriented trader need not imply withdrawal from cocoa production: farmers may redirect sales to another buyer, an intermediary or a domestic processor. A credible welfare assessment would therefore follow the original producer cohort across channels and measure net income alongside monetary and time-related verification costs.
The comparison between Côte d’Ivoire and Ghana remains institutionally informative rather than a country-level causal experiment. Their producer-pricing arrangements, marketing institutions, financing systems, cooperative networks and data infrastructures can allocate compliance responsibilities differently. Recent institutional analysis of Ghana’s cocoa marketing system illustrates how price formation and the distribution of price risk depend on sector-specific contracting and governance arrangements [41] (Van Huellen et al., 2026). Ivorian trade-flow estimates cannot be applied to Ghana without a matched Ghanaian dataset. A future comparison would require harmonized producer and purchaser records, differentiated by farm size and local buyer concentration, together with consistent destination-specific sourcing classifications.
Regulatory timing further limits causal interpretation. Regulation (EU) 2023/1115, as amended by Regulation (EU) 2025/2650, provides for principal application from 30 December 2026 and, for qualifying micro and small operators, from 30 June 2027. The 2016–2024 observations may capture pre-existing private initiatives and anticipatory adjustments, but they cannot identify realized post-application effects. An evaluation of future regulatory impacts would require an explicit intervention definition, a credible comparison group and appropriately dated producer outcomes. Concurrent cocoa-price movements and production shocks would also need to be distinguished from regulatory changes; the sensitivity of cocoa production to climatic conditions reinforces this concern [42] (Asante et al., 2025).
Origin traceability and deforestation-free production must likewise remain distinct measures. Published mappings that connect traders to cooperatives or departments improve the observability of sourcing geography, but cannot, by themselves, establish the legal status or forest history of every plot supplying an individual shipment. High-resolution cocoa-mapping research illustrates both the value of spatial evidence and the difficulties of identifying plantation extent accurately in Côte d’Ivoire and Ghana [43] (Kalischek et al., 2023). A department-level origin classification does not replace plot-level verification, while observed forest loss cannot be assigned to particular marketed cocoa volumes without spatially and temporally linked evidence. The present analysis consequently measures public supply-chain visibility, not verified forest outcomes.
The strongest conclusion supported by the results is that a substantial, precisely defined portion of Côte d’Ivoire’s 2024 cocoa exports to the EU lacks publicly reconstructable farm-origin links, while the available company marginals identify bounds rather than exact EU-directed indirect-procurement volumes for individual trading groups. The study’s contribution lies in expressing this information boundary through a reproducible destination-specific decomposition, feasible allocation intervals and robust comparisons, and in connecting it to clearly testable producer-level hypotheses. It does not establish observed producer losses, regulatory violations or causal welfare effects.
5.3. Innovative Policy Implications
A new policy implication follows from decomposing visibility gaps rather than reporting one opaque percentage. Public authorities and buyers should classify EU-directed export volumes into directly attributed, intermediary-based and publicly undisclosed categories, preserving a common national denominator and a separate EU-only denominator. A decline in indirect sourcing might result from stronger cooperative buying systems, but it might also reflect the exclusion of smaller aggregation routes. A decline in nondisclosure could reflect improved public reporting without any change in producer treatment. Monitoring both components prevents information coverage from being mistaken for a sufficient welfare outcome.
The decomposition supports differentiated intervention. Where intermediary chains account for a large volume, a sensible investment is interoperable lot-level provenance and chain-of-custody reconciliation, with verifiable links from aggregators to cooperatives and eligible plots. Where unknown attribution reflects public nondisclosure, attention should turn to common metadata definitions, safe disclosure protocols, error correction and independent verification. Neither intervention should require public release of sensitive personal or commercial data; authorized access, data minimization and security design are part of effective traceability. A shared registry is economically beneficial only if its recurring cost, data control and access terms are explicit.
The partial-identification results lead to a specific and testable transparency recommendation: publish a destination-by-procurement-channel table for each reporting trading group, together with consistent definitions and protected verification fields. Unlike broad requests for ‘more traceability,’ this proposal identifies the missing statistical object. The resulting two-way table would collapse the Fréchet intervals in Equations (5)–(6), expose the underlying cells for the eight currently robust orderings and clarify the remaining incomparable pairs. Publication should occur at a suitable aggregation level, with commercial confidentiality and producer privacy protected. International coordination could harmonize these categories so that apparent improvements in disclosure are not mistaken for changes in actual sourcing channels.
A proposed policy evaluation dashboard should have three separate registers. The environmental-assurance register would measure lot-level validation, geographic accuracy, correction rates and independently measured forest outcomes. The inclusion register would record the number and characteristics of baseline suppliers who remain eligible to sell, including farmers diverted to alternative buyers. The distributive register would record privately borne costs, actual price or service compensation and net cocoa income across all outlets. None should be algebraically collapsed into a single green-competitiveness score without transparent welfare weights and sensitivity analyses.
5.4. A Distribution-Sensitive Implementation Strategy
A further innovation is the recommendation to pair origin infrastructure with an explicit cost-incidence and supplier-retention audit. Before funding or imposing a documentation scheme, implementing agencies should identify the economic actor paying for initial farm mapping, recurrent updates, travel, training, corrective requests and delayed payment. A process that shifts investment from large downstream buyers to cash-constrained smallholders may increase the privately borne cost share even where the real resource cost of verification is unchanged. Matching publicly funded registries with transparent procurement contracts could reduce that incidence, but the effect should be tested rather than assumed.
Collective arrangements deserve evaluation by delivered services instead of membership labels. An effective cooperative may amortize recordkeeping across many farms, arrange financing, negotiate service fees and assist growers whose locations or tenure information generate difficult correction cases. Yet cooperative exclusivity may also reinforce a sole buyer’s bargaining advantage. The model predicts that record portability is most useful where producers have credible alternative purchasers; when local buyer competition is absent, a technically portable certificate may do little to improve outside options. Policymakers should therefore consider portability and market contestability as complements, not substitutes.
For small producer inclusion, support can be triaged using observed operational barriers rather than crude cutoffs based solely on farm area. Producers far from purchasing posts, lacking transport or formalized documents, or repeatedly failing record validation may face unusually high participation expenses. Transparent appeal procedures, targeted advisory assistance and reliable correction protocols may be more effective than undifferentiated subsidies. Evaluation should follow farmers who are rejected or leave a purchasing network; otherwise the policy appears successful merely because its denominator has shrunk.
The design also has implications for regulation beyond cocoa. In coffee, palm oil, rubber and cattle-related supply chains, origin data can be concentrated in downstream-controlled systems while compliance costs are partly generated upstream. The analytical principle travels more readily than the specific percentages: measure destination exposure and public information visibility at the same transaction level, use bounds where intersections are unobserved, and test farmer or supplier welfare with a separate baseline-cohort design. Cross-commodity comparisons should respect differences in production cycles, market organization and legal product coverage rather than transplanting an Ivorian cocoa coefficient.
5.5. Policy Evaluation, Disclosure and Evidence Priorities
The research suggests a clear sequence for evidence generation. More informative public volume disclosure can improve descriptive identification immediately, while producer surveys and buyer records are necessary for assessing social incidence. A country-level panel of exports alone cannot answer who paid for geolocation, whose records remain portable or who lost an EU-facing contract. Commissioning a representative baseline survey before the principal regulatory dates, preserving farmer identifiers securely across waves, and tracking both direct and intermediary buyers would make later policy evaluation substantially more credible.
The wider West African policy extension is a harmonized reporting protocol rather than a presumption that every country has the same traceability system. Nigeria, Sierra Leone, Liberia, Togo and Guinea should be included in future interoperable country inventories of cocoa production, buyer channels, export destinations, traceability-record governance and farmer-borne registration costs. The public information standard proposed here would require comparable definitions of direct sourcing, intermediary flows and undisclosed origins, together with an explicit record of excluded or switching suppliers. Such a protocol would make subsequent regional comparison possible without imposing a one-size-fits-all compliance burden or falsely attributing Ivorian trade statistics to neighbouring origins.
The central policy question becomes whether environmental assurance is achieved through capability building or supplier substitution. The distinction is empirically testable if procurement data separately identify newly registered producers, retained producers, rejected consignments and sellers shifted to other channels. A program should be evaluated on its joint ability to maintain verified market access, preserve diverse supplier participation and produce benefits that exceed privately borne adaptation costs. The relevant innovation is not an additional compliance label; it is a transparent decision rule that prevents changes in measured supplier composition from masquerading as inclusive progress.
An original practical implication is a two-register reporting requirement: trade-network information measures destination, direct versus intermediated buying, and public supplier linkage; producer-cohort accounts separately record fee incidence, buyer retention, switching, rejection and net farm returns. Joint reporting makes it possible to assess whether better transparency results from costly exclusion or inclusive support. Where public trade margins alone are available, agencies can publish the set of logically feasible outcomes and guaranteed comparisons, alongside an explicit statement that no farmer-level distributional effects have been identified. This precaution is particularly important before policy implementation, when anticipation and data-collection changes can otherwise be misread as realized causal effects.
For Sustainability’s cross-disciplinary readership, the implications are intentionally bounded. Better public data can strengthen accountability, but complete public transparency is neither necessary nor sufficient for conformity with the EUDR. More directly sourced procurement can reduce some information-friction costs, but it can also marginalize intermediary-dependent growers if no transition support is provided. A defensible policy recommendation must therefore combine transaction-level verification with observed participation and welfare evidence. The distinctive contribution is an auditable separation of these objectives rather than a promise that a single traceability technology achieves all three.
The empirical tables identify pre-application source visibility and distributional hypotheses, not causal changes in cocoa incomes, verified deforestation or compliance with a future legal obligation. Novelty is an original combination of published evidence and identification diagnostics; uniqueness against all unpublished studies cannot be established.
6. Conclusions, Limitations and Future Research
This study examines the economic problem created when environmental market access increasingly depends on information generated at multiple points in a fragmented commodity chain. Its analytical claim is deliberately conditional: stronger verification can coexist with inclusive producer upgrading, costly continued participation or supplier displacement, depending on who finances documentation, who controls usable records and whether growers retain credible purchasing alternatives. The theoretical model separates the farmer’s participation threshold from the buyer’s procurement decision, while distinguishing environmental credibility, commercial retention and attributable net returns. The quantitative contribution is a reproducible decomposition of public origin visibility within a European-exposed cocoa export portfolio. In 2024, the European Union received 66.16% of the cocoa volume exported from Côte d’Ivoire. Of all exported tonnes, 22.37% were EU-bound and indirectly sourced, and 9.32% were EU-bound without a publicly linked supplier origin. Together, they total 31.70%, indicating a transparent destination-specific public information gap rather than an EUDR violation rate. For six leading trading groups, sharp partial-identification bounds demonstrate how far publicly reported EU sales and indirect purchasing totals can identify an unreported intersection. The results are descriptive, not causal, and do not measure households’ actual compliance costs or net incomes. The measurable contribution is the discipline imposed on claims from incomplete public data. Existing work establishes the importance of cocoa sourcing opacity and public transparency. The present calculations also show that published company margins identify eight strict pairwise indirect-EU-volume orderings and a 207,463–343,666-tonne interval for the six leading traders, despite wide firm-specific uncertainty. The mathematical bounds are established tools, but their application to a published destination–procurement disclosure problem gives a replicable answer to a practical regulatory research question. Producer-level welfare remains unmeasured: the next causal study must connect documentation costs and buyer decisions to a baseline roster including displaced farmers, rather than infer harms from opaque trade categories. For Côte d’Ivoire, the results motivate a practical statistical disclosure standard and a targeted audit of intermediary-oriented sourcing, while rejecting the interpretation of unlinked public origins as EUDR violations. Ghana enters as a carefully bounded institutional comparator, not as a second country with an estimated parallel dataset. The wider contribution is a framework that connects trade-network information to the two-sided decision to retain a producer and the distinct question of who captures any compliance-related surplus. It remains necessary to test those mechanisms with longitudinal producer and buyer records. Greater statistical transparency is an identified immediate output of the present exercise; inclusive economic upgrading remains a consequential, falsifiable hypothesis rather than an asserted empirical effect. The West African designation is supported by a supplementary seven-country production baseline that incorporates Nigeria, Sierra Leone, Liberia, Togo and Guinea alongside Côte d’Ivoire and Ghana. It documents the geographic distribution of cocoa production in calendar year 2024, rather than extending Ivorian traceability measurements or making unobserved cross-country claims about the distribution of green-trade costs. This separation of regional coverage from country-specific causal evidence strengthens the article’s external-validity statement and identifies a concrete path for future comparable regional datasets.
6.1. Limitations and Future Research
The findings are subject to identifiable measurement boundaries. The 2016–2024 trade series records reported first destinations rather than final consumption, and the 2024 sourcing categories describe what can be reconstructed from published supply-chain information. Consequently, the 31.70% national exposure–visibility gap identifies exported volume that was directed to the European Union but not publicly linked to an originating supplier through the reviewed mapping. It is neither a measure of unlawful trade nor evidence that the underlying plots lacked valid private due-diligence records. Changes in corporate disclosure, intermediary classification, and data-matching coverage may also alter measured visibility independently of changes in sourcing conduct. The partial-identification results inherit the informational limits of their published margins. Company-specific European destination totals and indirect-procurement volumes do not reveal their joint allocation. The sharp bounds and national adding-up restriction describe the allocations compatible with the available totals, conditional on common reporting definitions and data quality; they are not confidence intervals or estimates of actual company-level sourcing intersections. Similarly, guaranteed pairwise comparisons concern the absolute volume of potentially overlapping trade, not regulatory compliance, producer treatment, or relative sustainability performance. Narrower identification requires destination-by-procurement-channel cross-tabulations for each trader, together with explicit rules for indirect sourcing, unknown origins, and residual exporters. Geographical comparability is also asymmetric. Côte d’Ivoire provides the quantitative trader-network evidence; Ghana serves as an institutional comparator, while Nigeria, Sierra Leone, Liberia, Togo, and Guinea enter through a common-year cocoa-production baseline. National harvest totals cannot substitute for harmonised destination, sourcing, or producer-level measures, and country differences in marketing institutions may alter the incidence of verification costs. Thus, the Ivorian visibility gap and company orderings cannot be extrapolated to the other six economies without comparable transaction-level evidence. The proposed Compliance–Value Capture Gap and the model of two-sided supplier selection provide testable distributional mechanisms, but the assembled trade records contain no linked baseline producer roster, itemized compliance payments, unpaid time, contractual terms, alternative-market earnings, or independently assessed plot-level forest outcomes. Accordingly, this article estimates neither producer welfare effects nor environmental additionality. Its 2024 sourcing snapshot also precedes the principal application dates of the amended European Union Deforestation Regulation, precluding interpretation of these results as realized post-application regulatory effects.
Future research can address these gaps through two complementary data designs. At the network level, repeated trader-by-destination-by-procurement tables, with consistent denominators and disclosure definitions, would replace wide allocation bounds with observed intersections and reveal whether traceability expansion reflects better documentation or supplier reallocation. At the producer level, a longitudinal baseline cohort should follow retained, rejected, and switching farmers across all purchasers, recording annualized verification costs, subsidies, payment deductions, accepted record transfers, buyer competition, price-quality schedules, and net income. Linking these records with plot-level geolocation and independent forest monitoring would permit the separate evaluation of environmental assurance, market inclusion, and attributable private benefits. A comparative extension across the seven West African producing countries would test whether collective verification services, information portability, and local purchasing competition condition these outcomes differently across market systems. Where implementation or support intensity varies credibly over time, pre-specified cohort comparisons and appropriately diagnosed staggered-adoption designs could examine causal effects; anticipation, endogenous program placement, changing cocoa prices, production shocks, and spillovers across buyers would still require explicit treatment. Such evidence would determine whether improved documentary visibility corresponds to broader producer capabilities and more equitable value capture, rather than assuming that the aggregate trade indicators establish those outcomes.
Author Contributions
Conceptualization, D.D.A.; methodology, D.D.A.; software, D.D.A.; validation, D.D.A.; formal analysis, D.D.A.; investigation, D.D.A.; resources, D.D.A.; data curation, D.D.A.; writing—original draft preparation, D.D.A.; writing—review and editing, D.D.A.; visualization, D.D.A.; supervision; Michu Woreket Atnafu. All authors have read and agreed to the submitted version of the manuscript.
Funding
This study was not funded and reflects the sole work of the authors.
Institutional Review Board Statement
Not applicable. This study analyzes publicly available aggregate data and does not involve the recruitment of human participants.
Informed Consent Statement
Not applicable.
Data Availability Statement
The data used in this study are publicly available from the sources identified in the manuscript. The compiled analytical dataset is available from the corresponding author upon reasonable request.
Acknowledgments
During the preparation of this manuscript, the authors used ChatGPT (OpenAI) to assist with language editing, grammatical corrections, and improvements in readability. All AI-assisted revisions were carefully reviewed and verified by the authors, who retain full responsibility for the accuracy, originality, scientific integrity, and final content of the manuscript.
Conflicts of Interest
The authors declare no conflicts of interest. The authors sincerely thank Professor Yu Pei for his valuable guidance, constructive comments, and continued support during the development and preparation of this research.
References
- Commission, E., Commission Notice: Guidance document for Regulation (EU) 2023/1115 (C/2026/3896). Official Journal of the European Union. Available online: https://eur-lex.europa.eu/eli/C/2026/3896/oj/eng (accessed on 25 October 2026). 2026.
- Union, E., Regulation (EU) 2023/1115 on deforestation-free products. Official Journal of the European Union. Available online: https://eur-lex.europa.eu/eli/reg/2023/1115/oj (accessed on 25 October 2023). 2023.
- Ingram, V., et al., The Impacts of Cocoa Sustainability Initiatives in West Africa. Sustainability, 2018. 10(11): p. 4249. [CrossRef]
- Krumbiegel, K. and P. Tillie, Sustainable practices in cocoa production. The role of certification schemes and farmer cooperatives. Ecological Economics, 2024. 222: p. 108211. [CrossRef]
- Wätzold, M.Y.L., et al., Do voluntary sustainability standards improve socioeconomic and ecological outcomes? Evidence from Ghana’s cocoa sector. Ecological Economics, 2025. 229: p. 108474. [CrossRef]
- Carodenuto, S., et al., Formalization through contracts: Implications for power in smallholder cocoa supply chains. Geoforum, 2025. 164: p. 104323. [CrossRef]
- Trase, Côte d’Ivoire cocoa exports and deforestation: Interactive destination, trader and department data tables, 2016–2024. Available online: https://trase.earth/insights/cote-d-ivoire-cocoa-exports-and-deforestation-2026 (accessed on 25 October 2026). 2026.
- Guye, V., P. Meyfroidt, and E.z. Ermgassen, The Need for Improved Public Transparency in the Era of Due Diligence Regulations. Regulation & Governance, 2026. 1: p. 8. [CrossRef]
- Union, E., Regulation (EU) 2025/2650 amending Regulation (EU) 2023/1115. Official Journal of the European Union. Available online: https://eur-lex.europa.eu/eli/reg/2025/2650/oj (accessed on 2 October 2026). 2025.
- Blind, K., S.S. Petersen, and C.A.F. Riillo, The impact of standards and regulation on innovation in uncertain markets. Research Policy, 2017. 46(1): p. 249-264. [CrossRef]
- Statsenko, L., K. Scholten, and M. Stevenson, The influence of global value chain governance on supply network resilience. Supply Chain Management: An International Journal, 2025. 30(2): p. 161-177. [CrossRef]
- Ponte, S., Green Capital Accumulation: Business and Sustainability Management in a World of Global Value Chains. New Political Economy, 2020. 25(1): p. 72-84. [CrossRef]
- Trejo-Pech, C.J.O., R. Servín-Juárez, and Á. Reyes-Duarte, What sets cooperative farmers apart from non-cooperative farmers? A transaction cost economics analysis of coffee farmers in Mexico. Agricultural and Food Economics, 2023. 11: p. 1-24. [CrossRef]
- Traldi, R., Progress and pitfalls: A systematic review of the evidence for agricultural sustainability standards. Ecological Indicators, 2021. 125: p. 107490. [CrossRef]
- Fateh, M., et al., Assessing agricultural trade efficiency and untapped export potential: evidence from India and G20 economies. Cogent Economics & Finance, 2026. 14(1): p. 2746218. [CrossRef]
- Fiankor, D.-D.D., O.-K. Haase, and B. Brümmer, The Heterogeneous Effects of Standards on Agricultural Trade Flows. Journal of Agricultural Economics, 2021. 72(1): p. 25-46. [CrossRef]
- Moluh Njoya, H., et al., Can cooperative membership foster compliance with New European Union regulations on deforestation-free production? Evidence from cocoa farmers in Western Côte d’Ivoire. Trees, Forests and People, 2025. 20: p. 100897. [CrossRef]
- Data, O.W.i., Cocoa bean production (1961–2024), source: FAOSTAT QCL. Available online: https://ourworldindata.org/grapher/cocoa-bean-production (accessed on 25 October 2026). 2026.
- Nations, F.a.A.O.o.t.U., Crops and livestock products: Cocoa beans, production quantity (FAOSTAT QCL, item 661, element 5510). Available online: https://www.fao.org/faostat/en/#data/QCL (accessed on 25 October 2026). 2025.
- Addoah, T., et al., Is the Implementation of Cocoa Companies’ Forest Policies on Track to Effectively and Equitably Address Deforestation in West Africa? Sustainable Development, 2025. 33(4): p. 5197-5213. [CrossRef]
- Razak, Ghadafi M., M. Stevenson, and Linda C. Hendry, “I Am Because We Are”: The Role of Sub-Saharan Africa’s Collectivist Culture in Achieving Traceability and Global Supply Chain Resilience. Journal of Supply Chain Management, 2024. 60(4): p. 46-74. [CrossRef]
- Van Hee, J., Krumbiegel, K., & Tillie, P, Intermediaries in the West-African cocoa sector: A buyer and producer perspective (JRC Working Papers on Economic Analysis of Policies in Africa 2025/11). European Commission, Joint Research Centre. Available online: https://publications.jrc.ec.europa.eu/repository/handle/JRC142321 (accessed on 25 October 2026). 2025.
- Renier, C., et al., Transparency, traceability and deforestation in the Ivorian cocoa supply chain. Environmental Research Letters, 2023. 18(2): p. 024030. [CrossRef]
- French, N., Titley, M., Gollnow, F., & Guye, V, (May 12). Côte d’Ivoire cocoa exports and deforestation. Trase. Available online: https://trase.earth/insights/cote-d-ivoire-cocoa-exports-and-deforestation-2026 (accessed on 25 October 2026). 2026.
- Weber, K., Environmental Supply Chain Regulations in a Changing Market Environment: Exploring the EU’s Regulatory Power in the Cocoa Sector in Ghana. JCMS: Journal of Common Market Studies, 2026. 64(2): p. 811-834. [CrossRef]
- Gupta, R., et al., Traders as ecosystem orchestrators for sustainable foods supply chain transformation. Business Strategy and the Environment, 2024. 33(5): p. 4024-4038. [CrossRef]
- Ayam, J.R.A., Ghanaian Institutions and Supply Chain Management Practices: A Systematic Review of Evidence. African Journal of Management Research, 2024. 30(1): p. 116. [CrossRef]
- McDermott, C.L., et al., Equity in unilateral value chain policies: A monitoring framework for the EUDR and beyond. Forest Policy and Economics, 2025. 174: p. 103469. [CrossRef]
- Braun, D., J. Börner, and D. Hermann, Deforestation-Free Cocoa: Implications for Organizational Adaptation and Compliance Costs. Business Strategy and the Environment, 2026. n/a(n/a): p. e71586. [CrossRef]
- Van Loco, A. and M. Campera, The EU Deforestation Regulation: Challenges, Opportunities and the Potential Impacts on the Producing Countries of Cocoa and Coffee. Environmental Policy and Governance, 2026. 1: p. 1.
- Manski, C.F., Nonparametric Bounds on Treatment Effects. The American Economic Review, 1989. 80: p. 319-323.
- Manski, C.F. Partial Identification in Econometrics. 2, p 167-195. 2010. [CrossRef]
- Callaway, B. and P.H.C. Sant’Anna, Difference-in-Differences with multiple time periods. Journal of Econometrics, 2021. 225(2): p. 200-230.
- Berthet, E. and I. Fusacchia, Navigating the Complexity: The Sustainability Challenges in Global Value Chains. Annual Review of Resource Economics, 2024. 16: p. 349-377. [CrossRef]
- Solar, J., Y. Ivanova, and C. Oberlack, Human Rights and Environmental Due Diligence Regulations for Deforestation-Free Value Chains? Exploring the Implementation of the EU Regulation on Deforestation-Free Products in the Cocoa and Coffee Sectors of Peru. Global Policy, 2025. 16(4): p. 602-614. [CrossRef]
- Hill, D., D. Gregg, and D. Baker, Trading off inclusion, value, and scale within smallholder targeted value chains. World Development, 2025. 191: p. 106973. [CrossRef]
- Eller, K.H., Pricing and distribution in global value chain regulation. Leiden Journal of International Law, 2025. 38(3): p. 455-476. [CrossRef]
- Partzsch, L., Hardening sustainability: Supply chain laws complement cocoa and coffee certifications. Forest Policy and Economics, 2025. 181: p. 103661. [CrossRef]
- Van Noordwijk, M., B. Leimona, and P.A. Minang, The European deforestation-free trade regulation: collateral damage to agroforesters? Current Opinion in Environmental Sustainability, 2025. 72: p. 101505. [CrossRef]
- Ansah, E.O., et al., How sustainability certification works for smallholder farmers across different crops. Agroecology and Sustainable Food Systems, 2026. 50(3): p. 571-593. [CrossRef]
- Van Huellen, S., et al., The political economy of pricing and Ghana’s cocoa marketing system. Competition & Change, 2026: p. 10245294261464704.
- Asante, P.A., et al., Climate change impacts on cocoa production in the major producing countries of West and Central Africa by mid-century. Agricultural and Forest Meteorology, 2025. 362: p. 110393. [CrossRef]
- Kalischek, N., et al., Cocoa plantations are associated with deforestation in Côte d’Ivoire and Ghana. Nature Food, 2023. 4: p. 384 - 393.
Figure 1.
European destination share of Ivorian cocoa exports, 2016–2024. Source: Trase,, calculated in Python by the author.
Figure 1.
European destination share of Ivorian cocoa exports, 2016–2024. Source: Trase,, calculated in Python by the author.
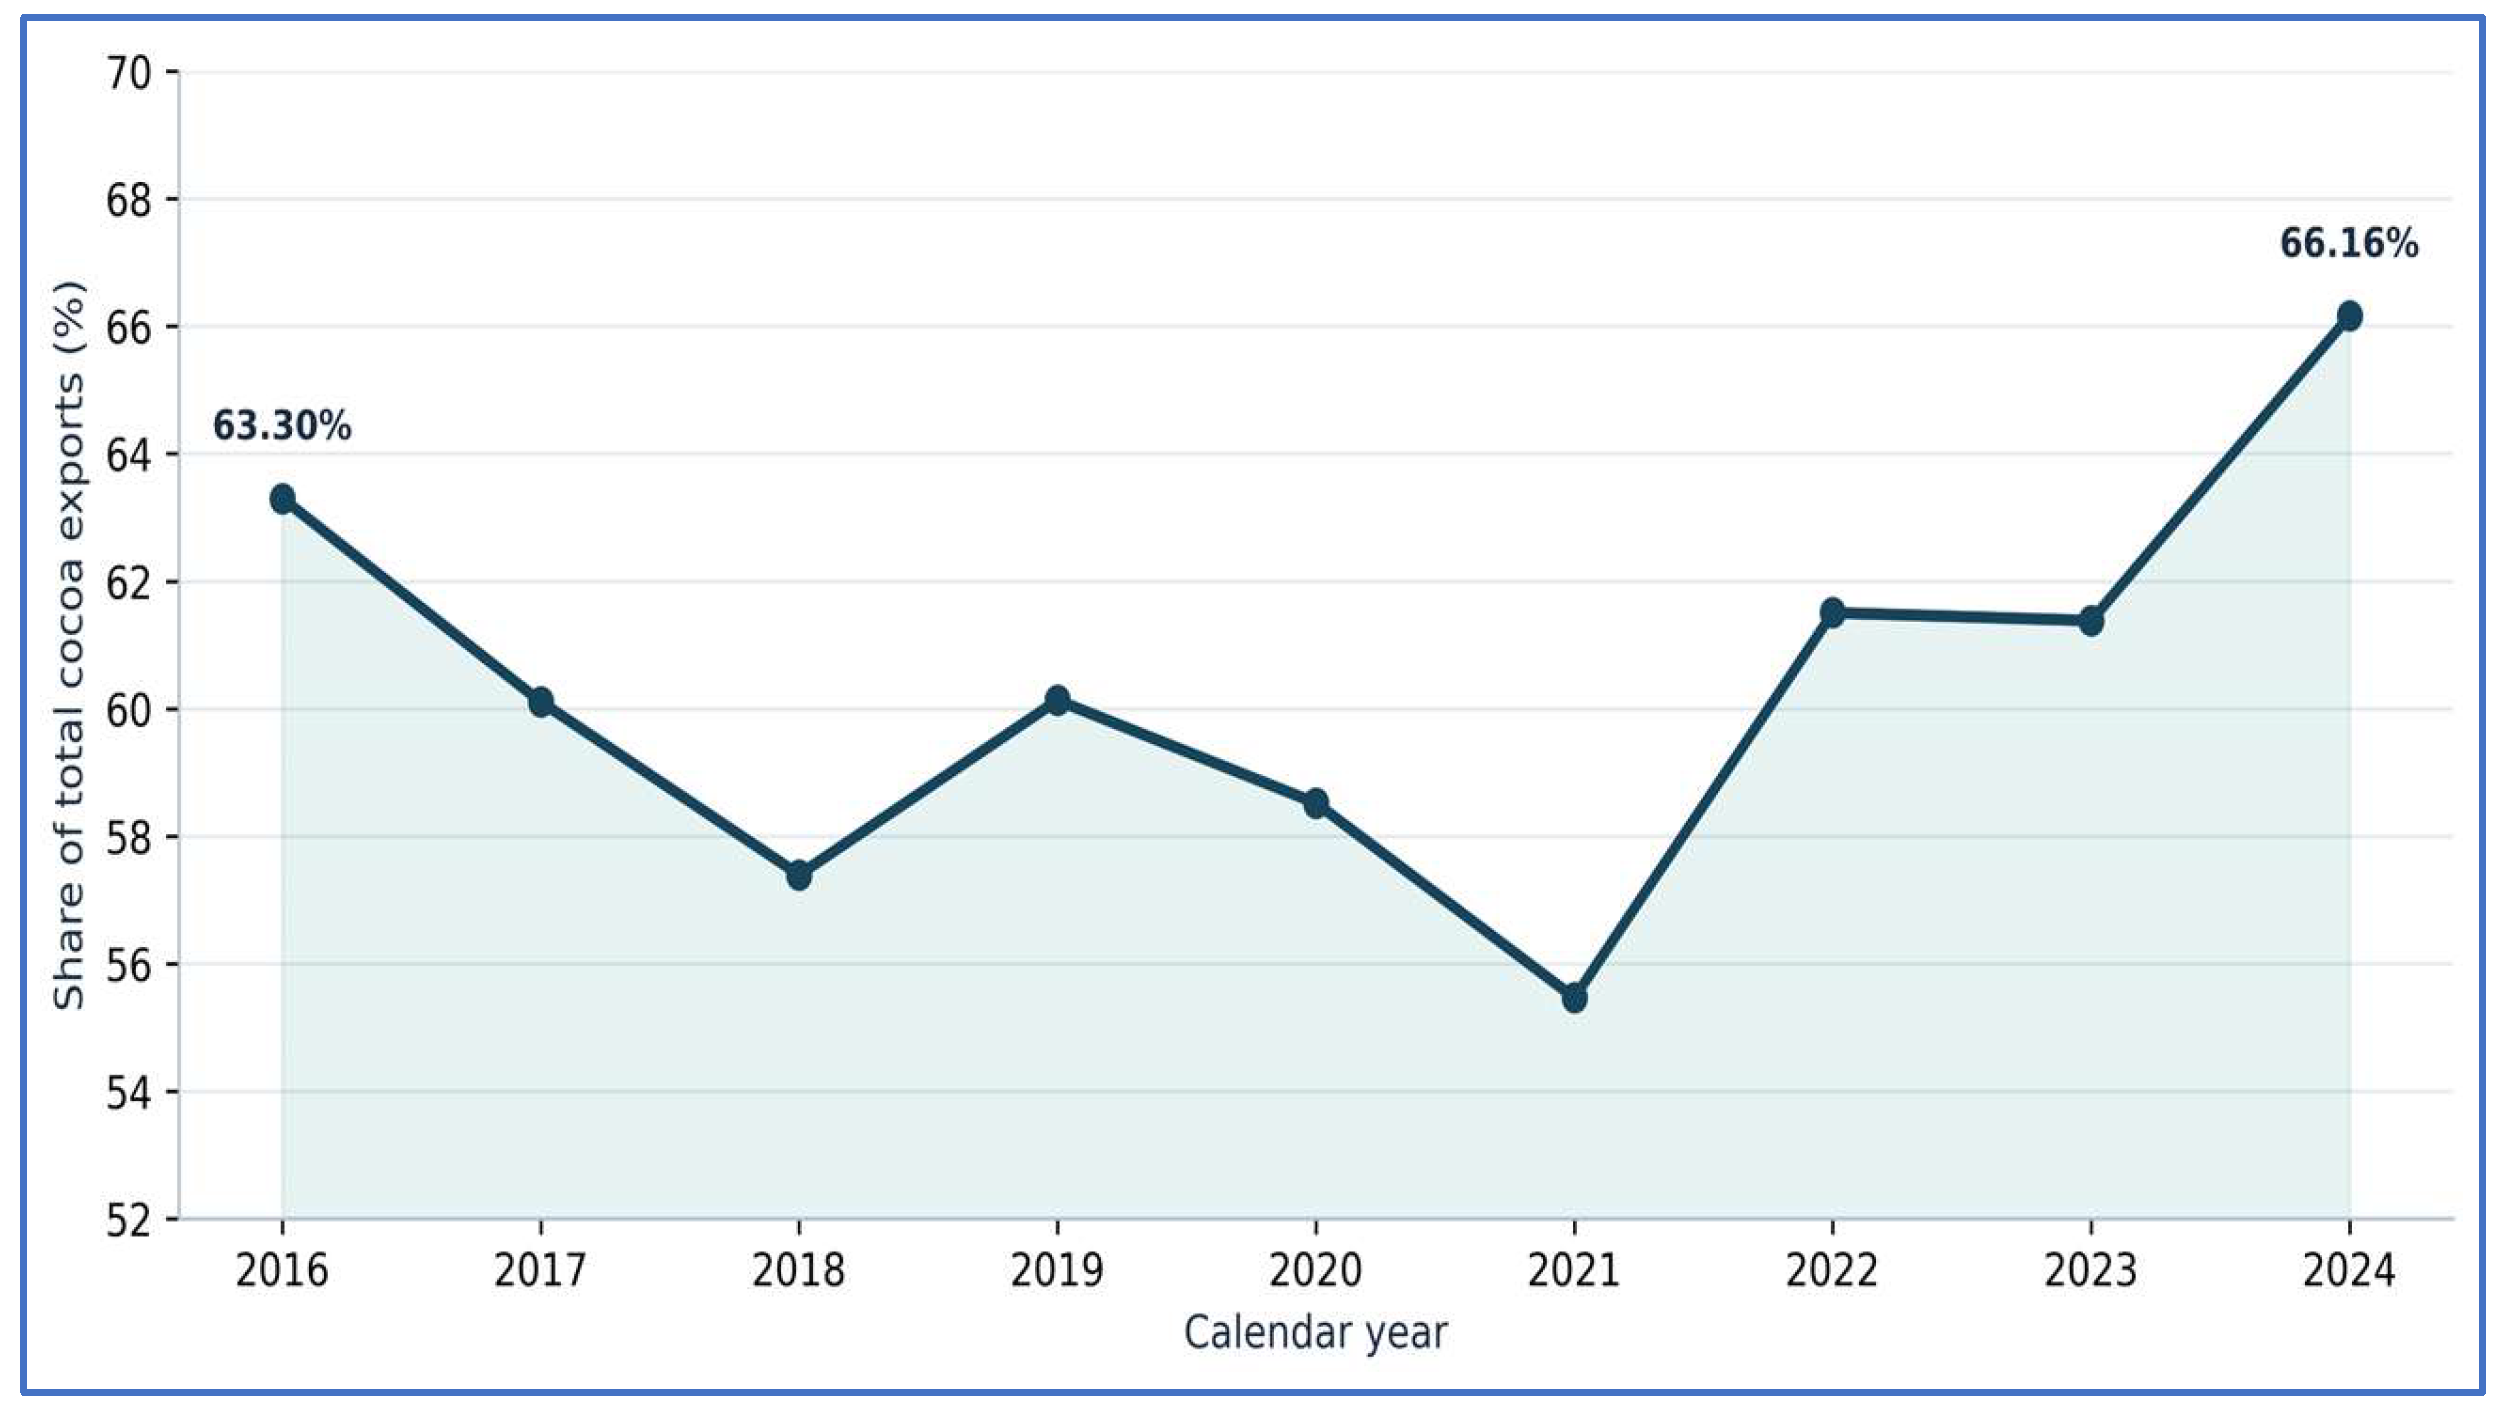
Figure 2.
Composition of national export volumes by EU destination, 2024. Source: (Trase, 2026), computed by the author.
Figure 2.
Composition of national export volumes by EU destination, 2024. Source: (Trase, 2026), computed by the author.
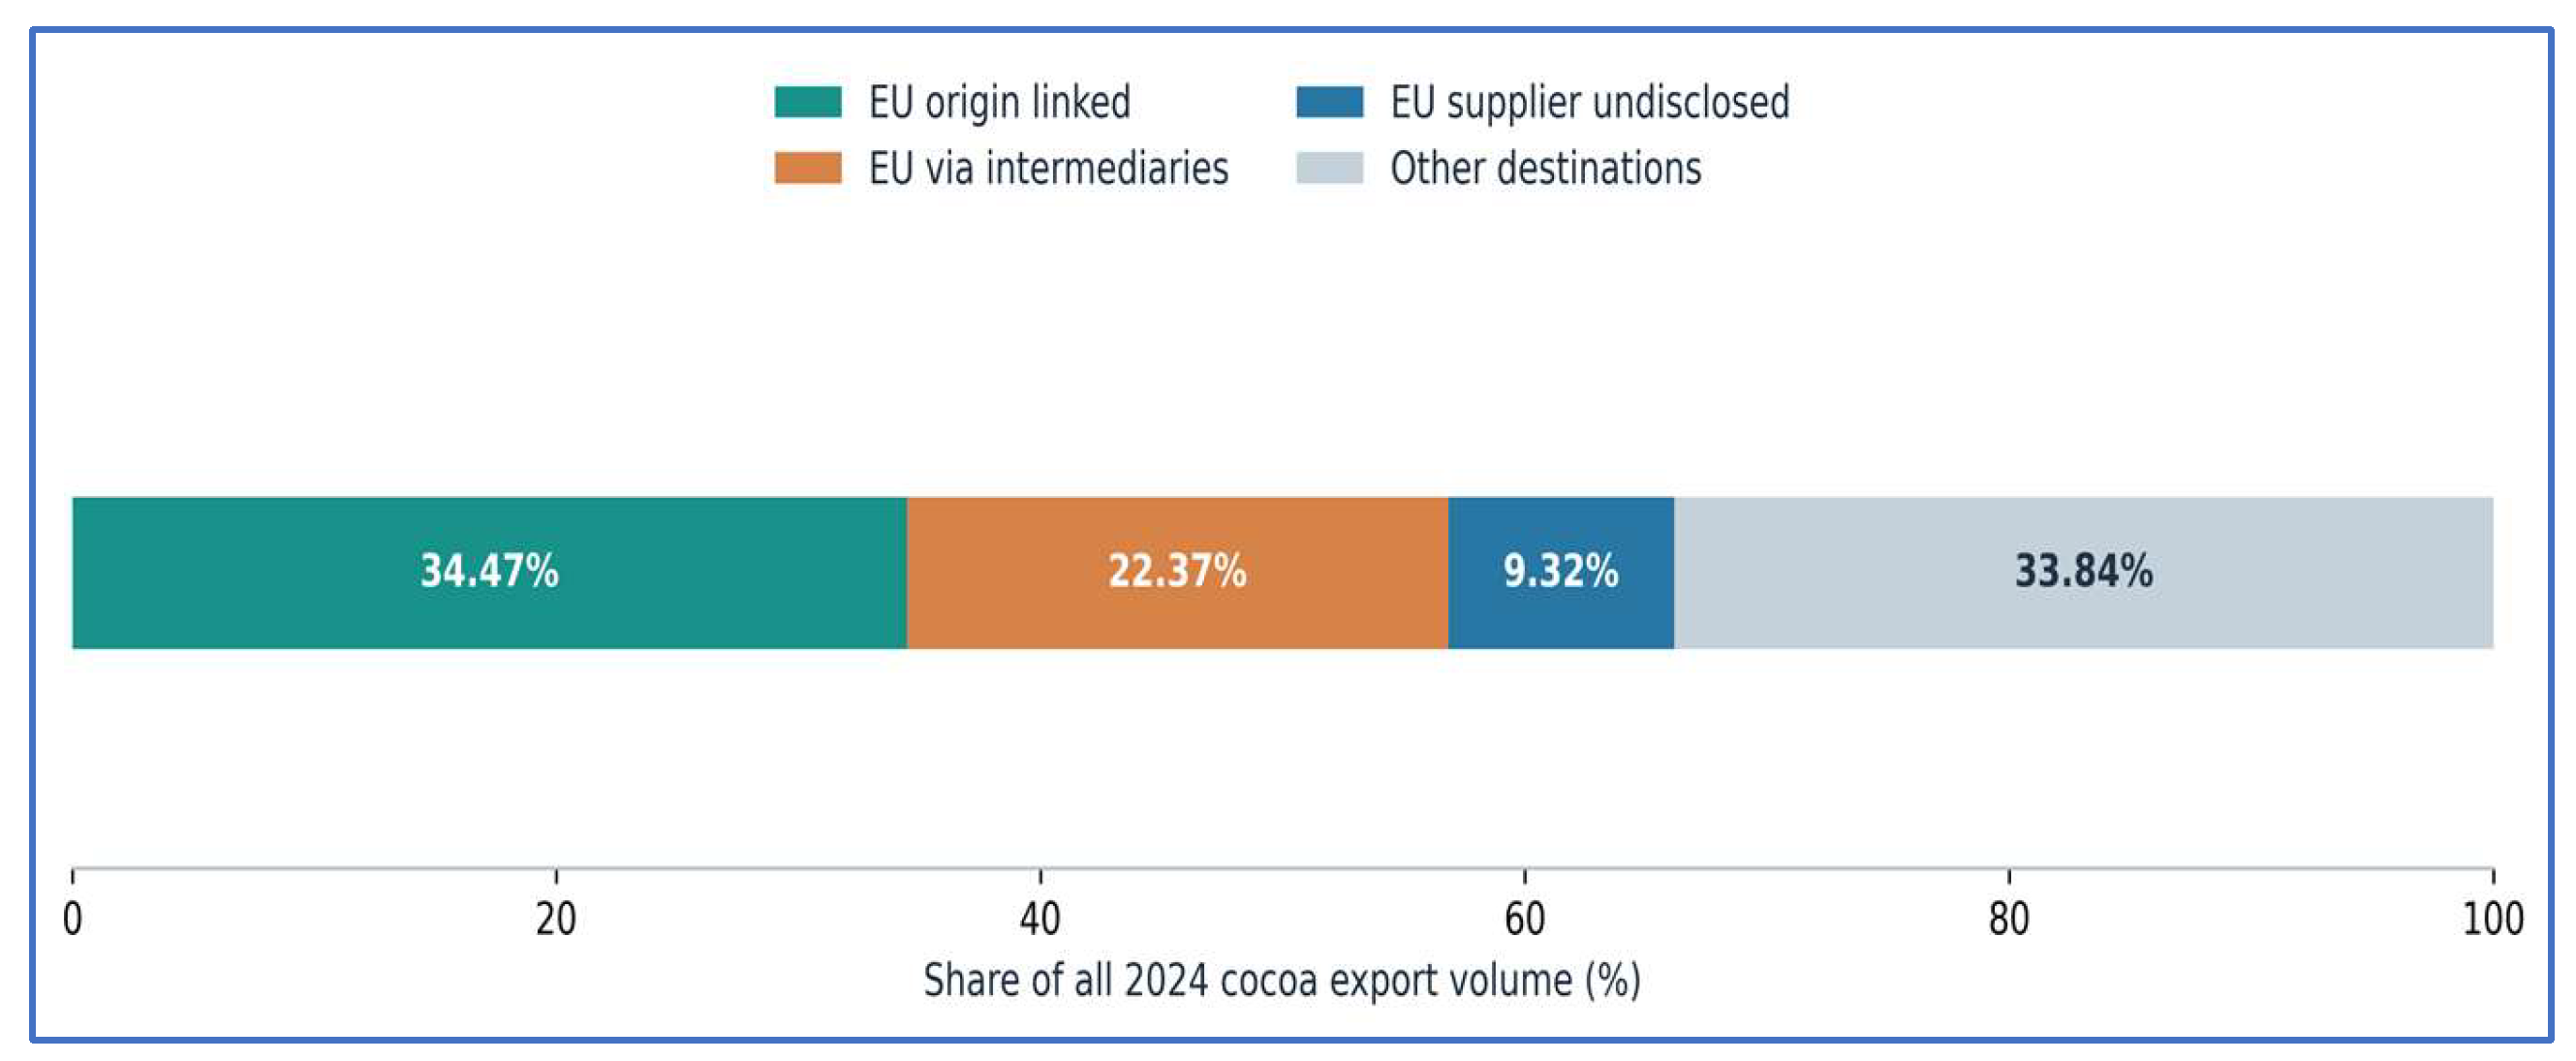
Figure 3.
Identified intervals for EU-directed indirect procurement among six major trading groups. Source: (Trase, 2026), own calculations.
Figure 3.
Identified intervals for EU-directed indirect procurement among six major trading groups. Source: (Trase, 2026), own calculations.
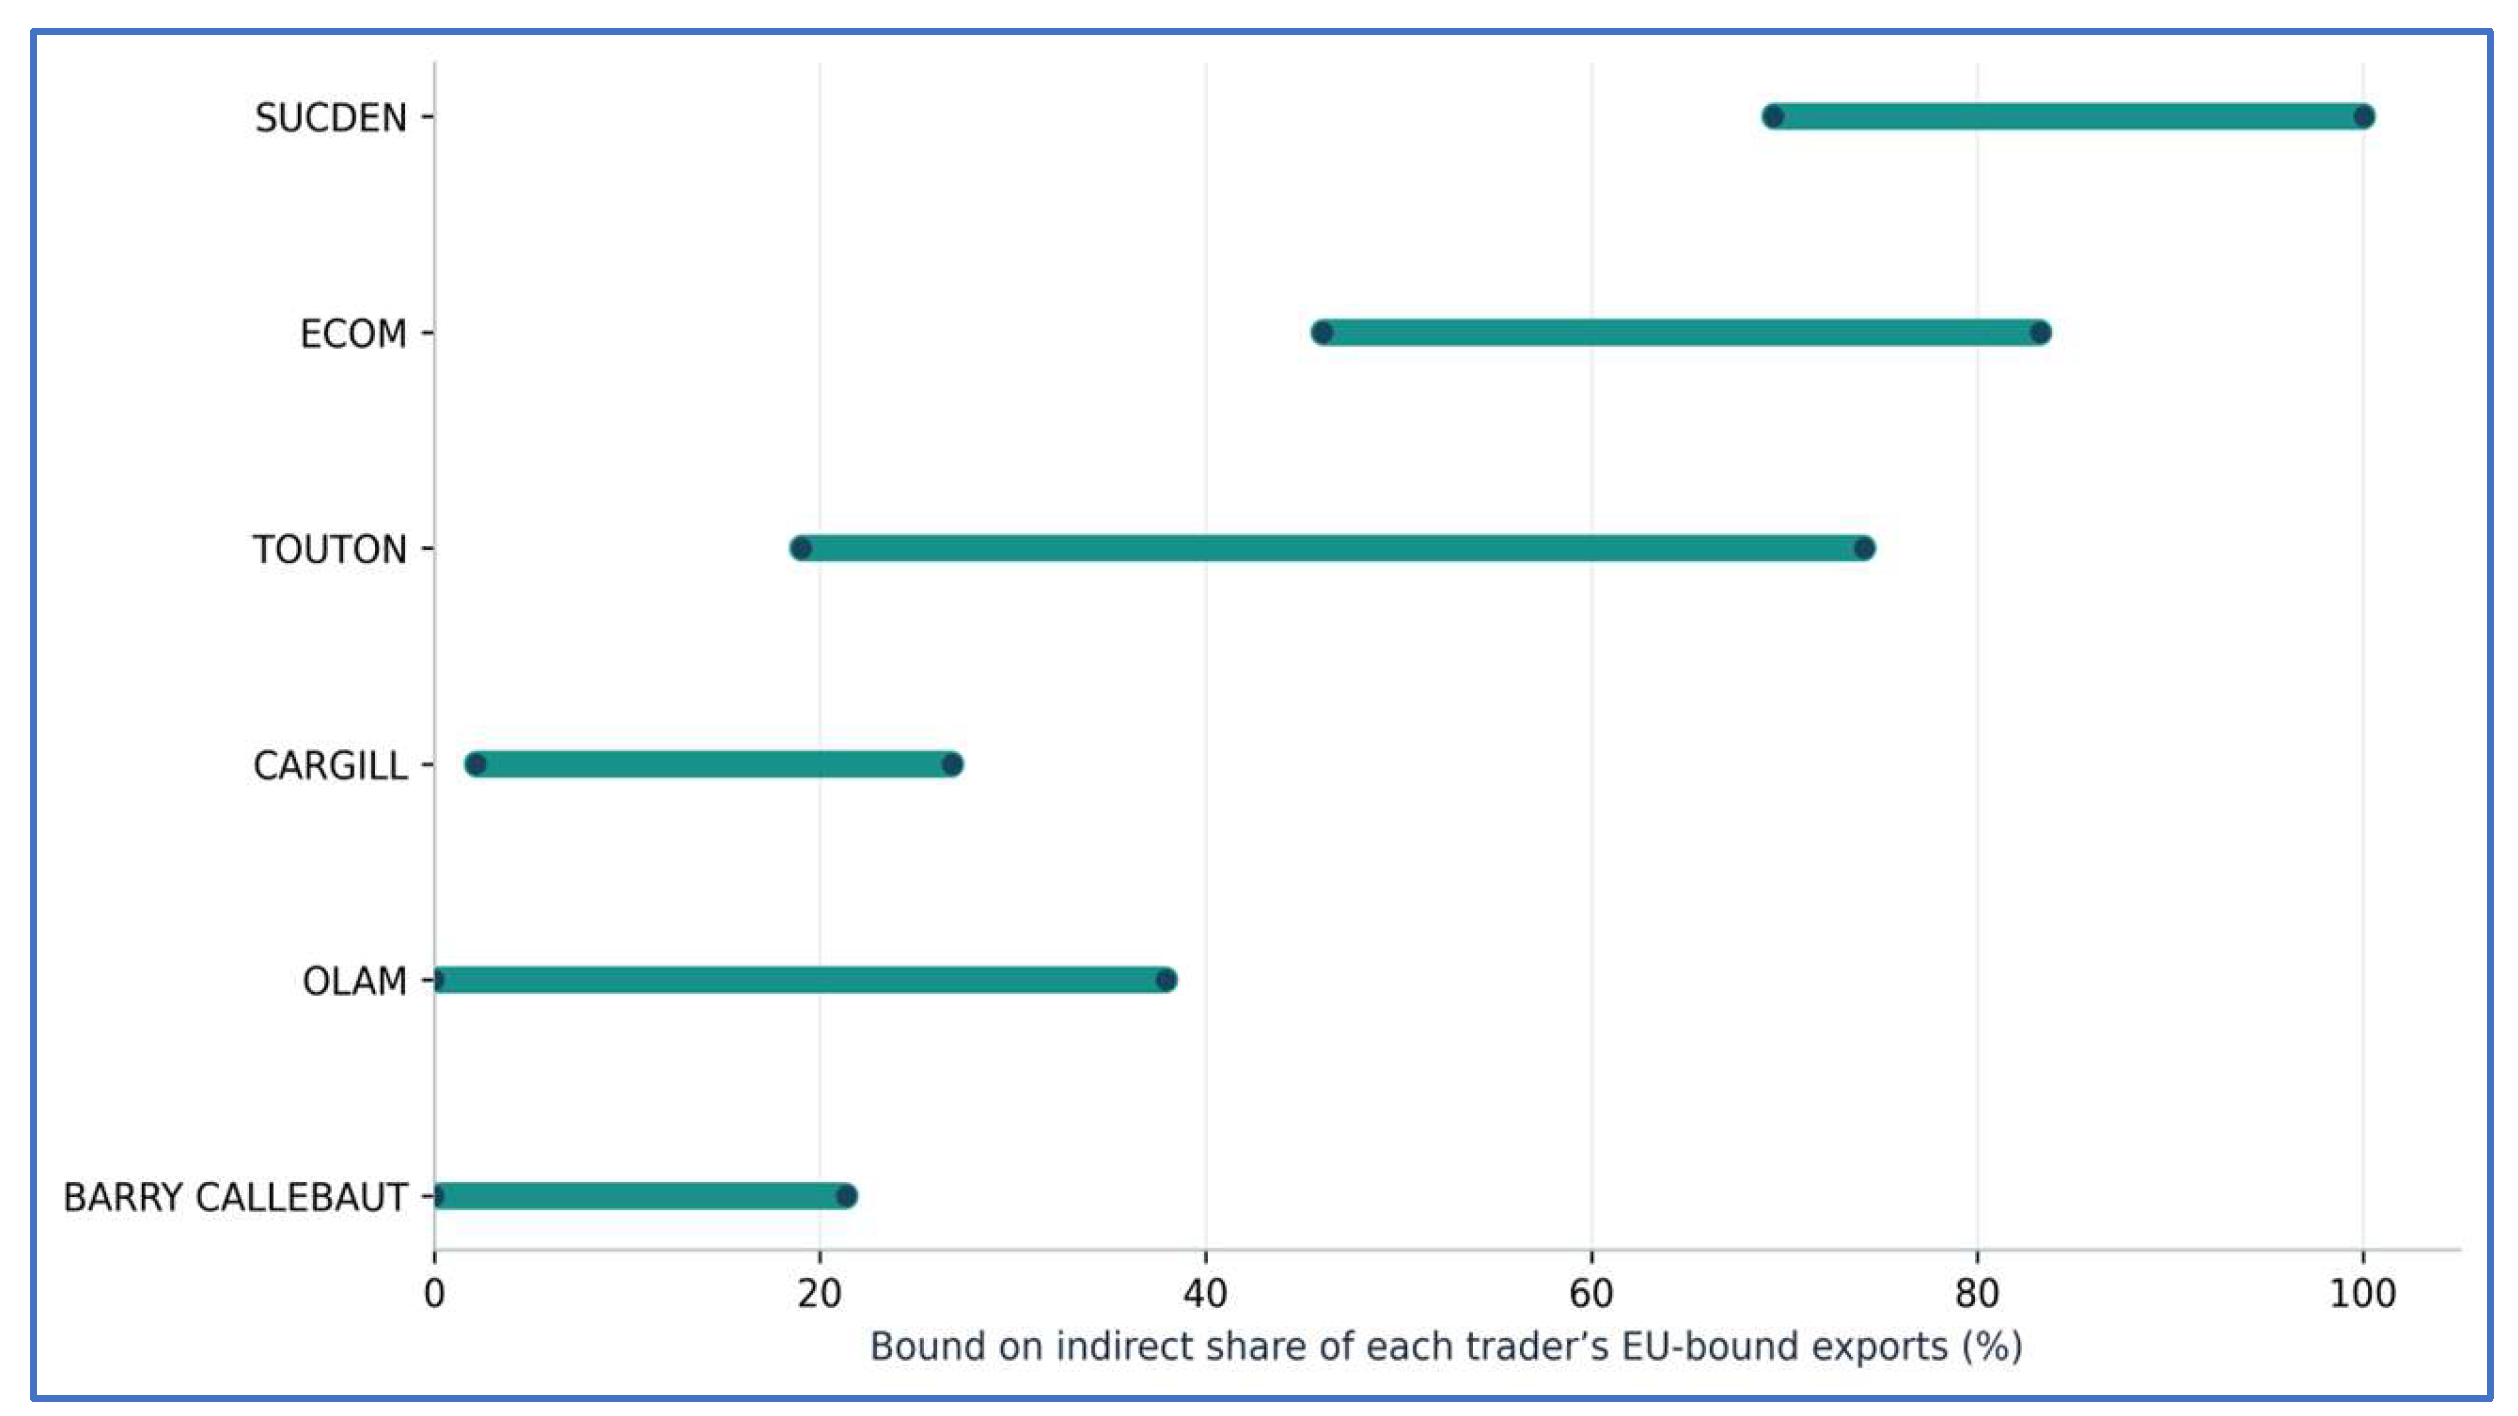
Figure 4.
Robust pairwise dominance of estimated EU-directed indirect cocoa tonnage, six major Ivorian trading groups, 2024.
Figure 4.
Robust pairwise dominance of estimated EU-directed indirect cocoa tonnage, six major Ivorian trading groups, 2024.
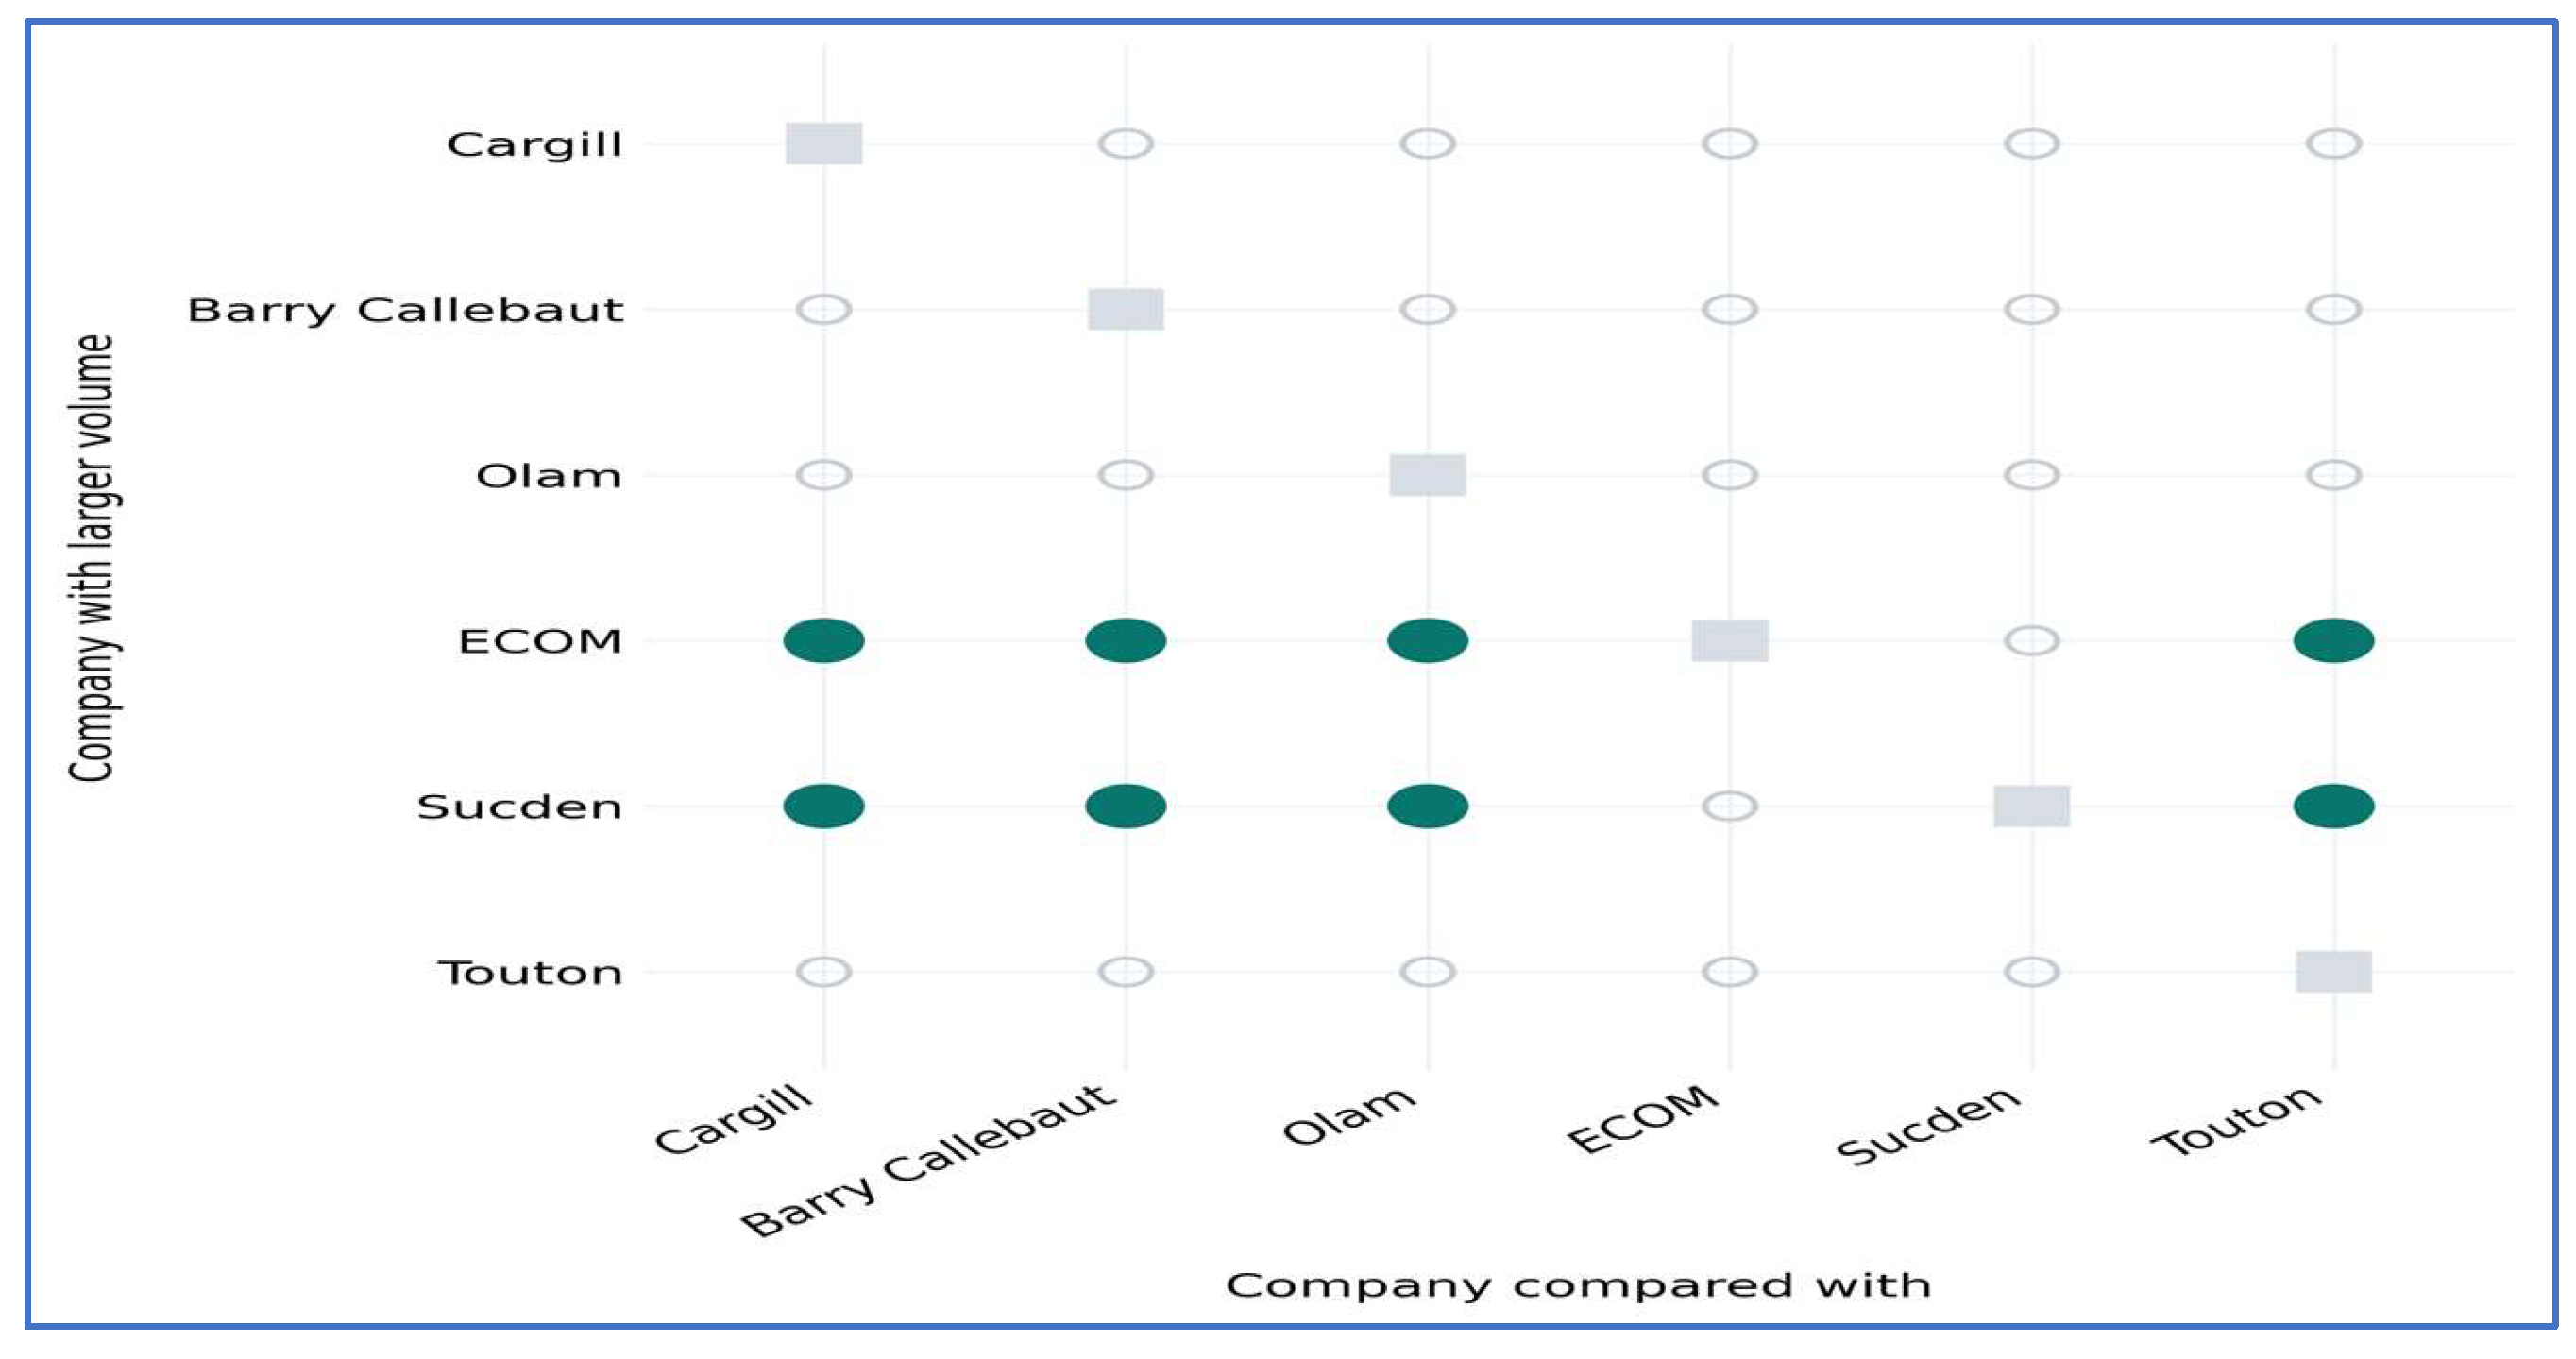
Figure 5.
Cocoa production in Côte d’Ivoire and Ghana, cocoa years 2022/23–2023/24. Source: (ICCO, 2025), own calculations.
Figure 5.
Cocoa production in Côte d’Ivoire and Ghana, cocoa years 2022/23–2023/24. Source: (ICCO, 2025), own calculations.
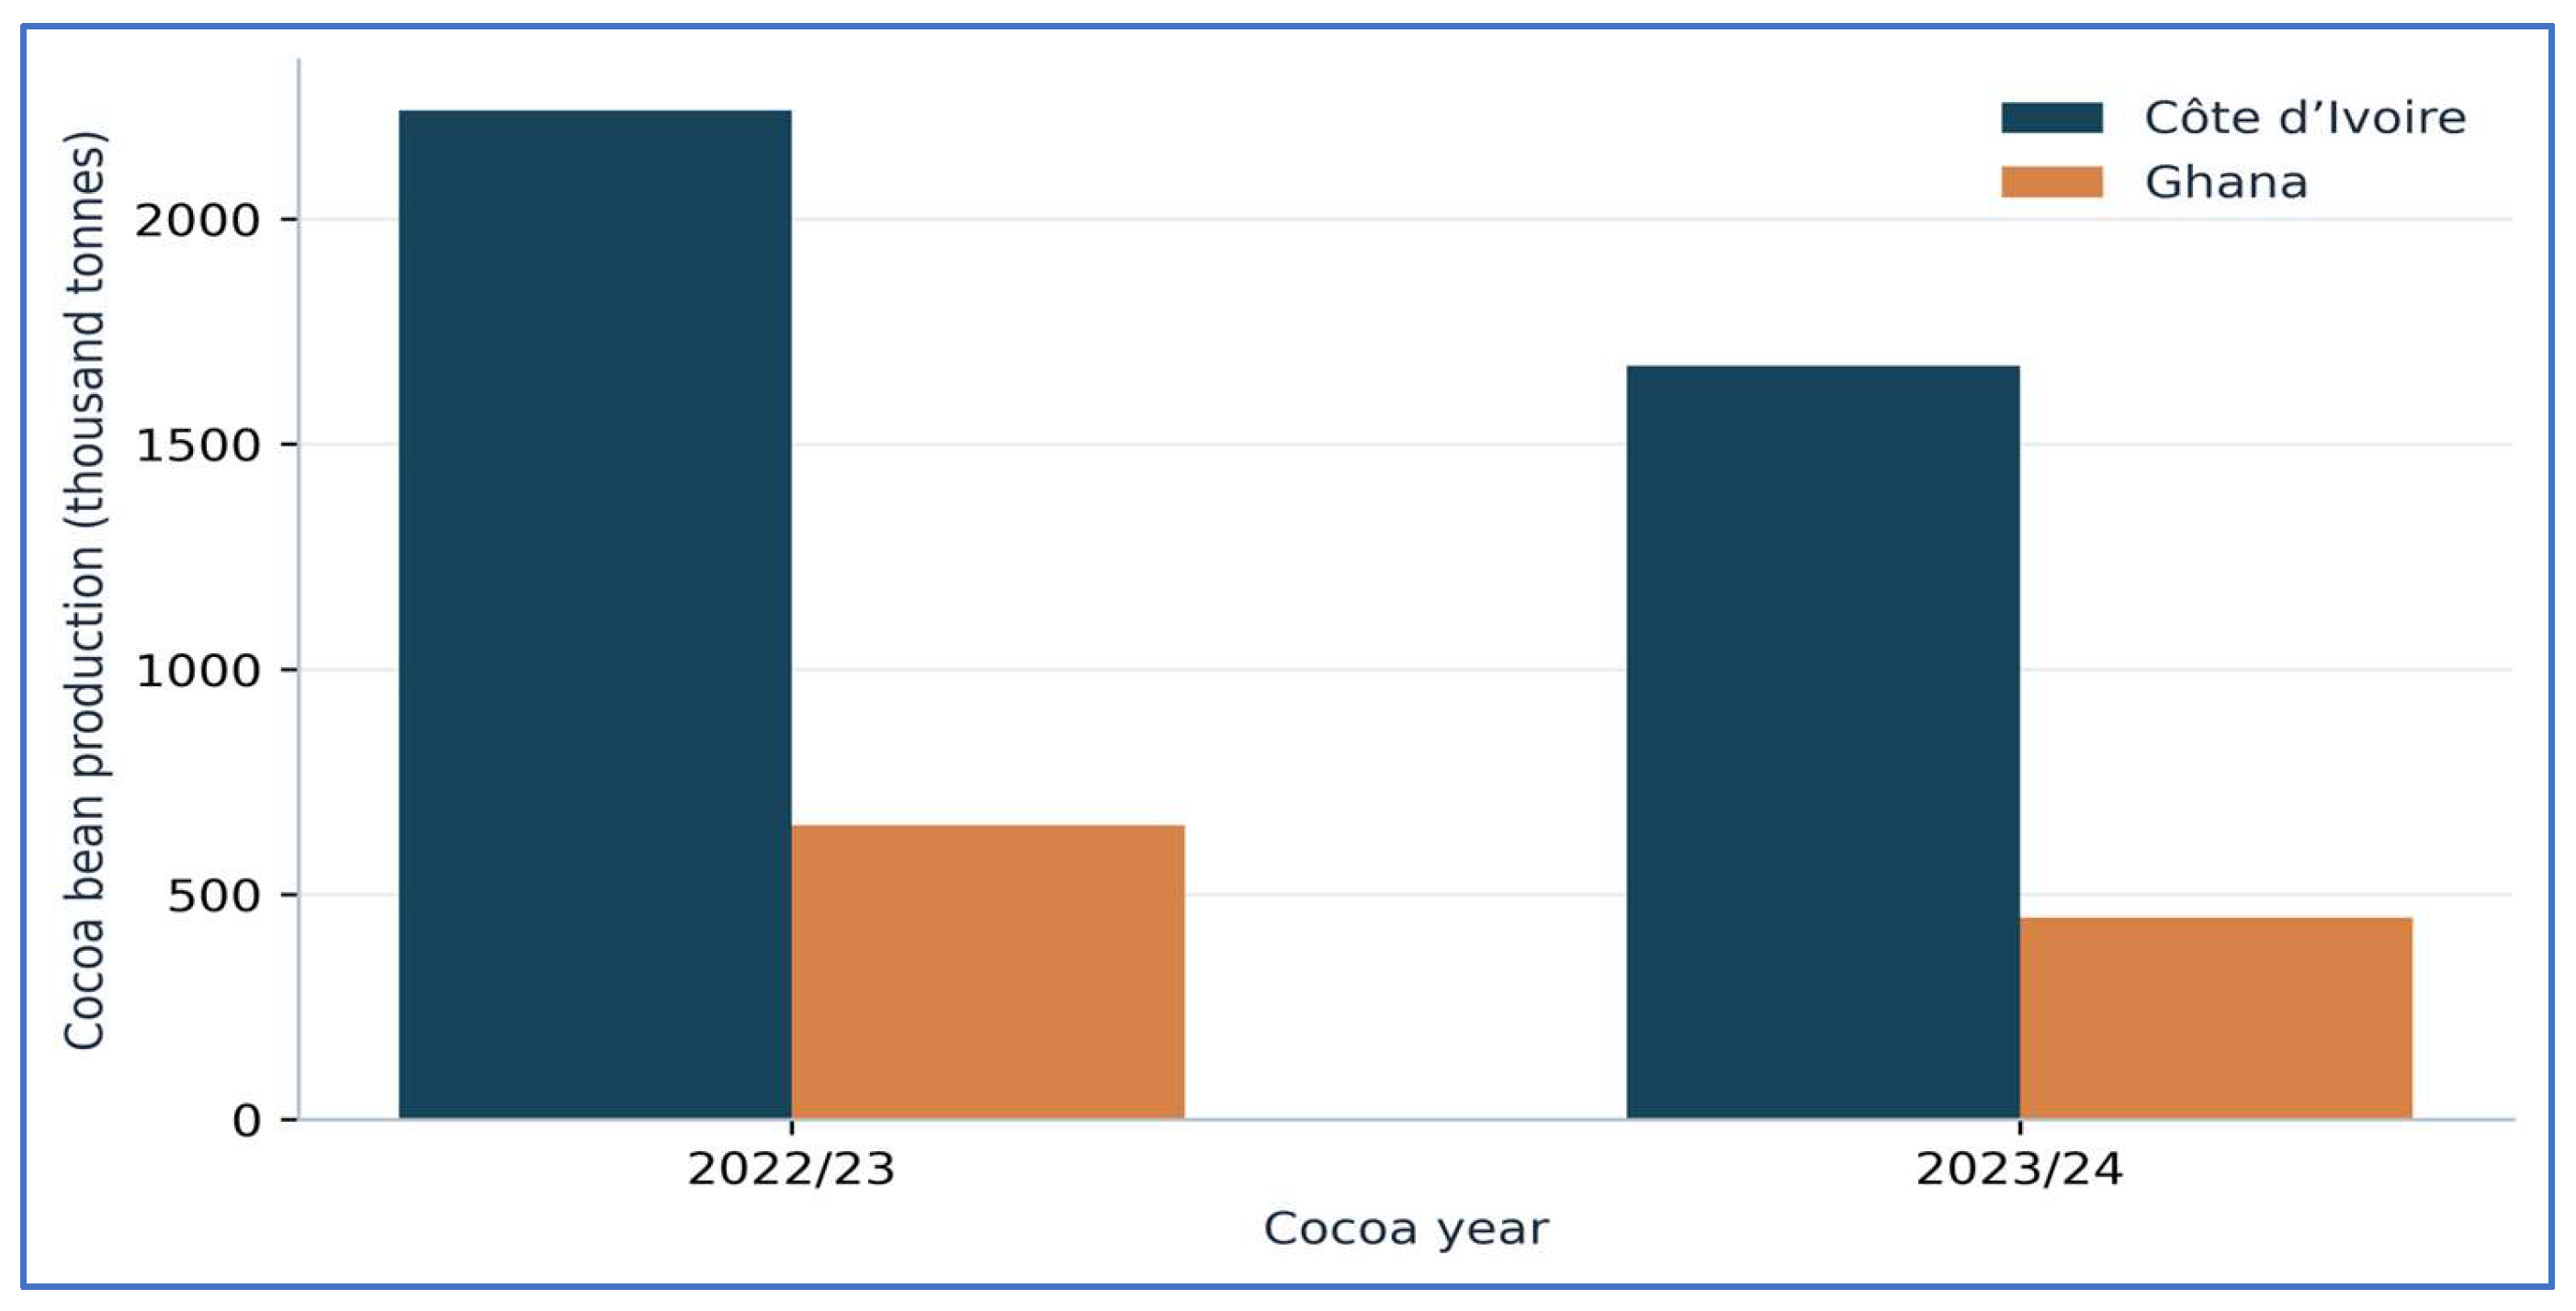
Figure 6.
Cocoa-bean production across seven West African origins, 2024 (logarithmic horizontal axis). Source: (FAO, 2025; Our World in Data, 2026); figure compiled by author.
Figure 6.
Cocoa-bean production across seven West African origins, 2024 (logarithmic horizontal axis). Source: (FAO, 2025; Our World in Data, 2026); figure compiled by author.
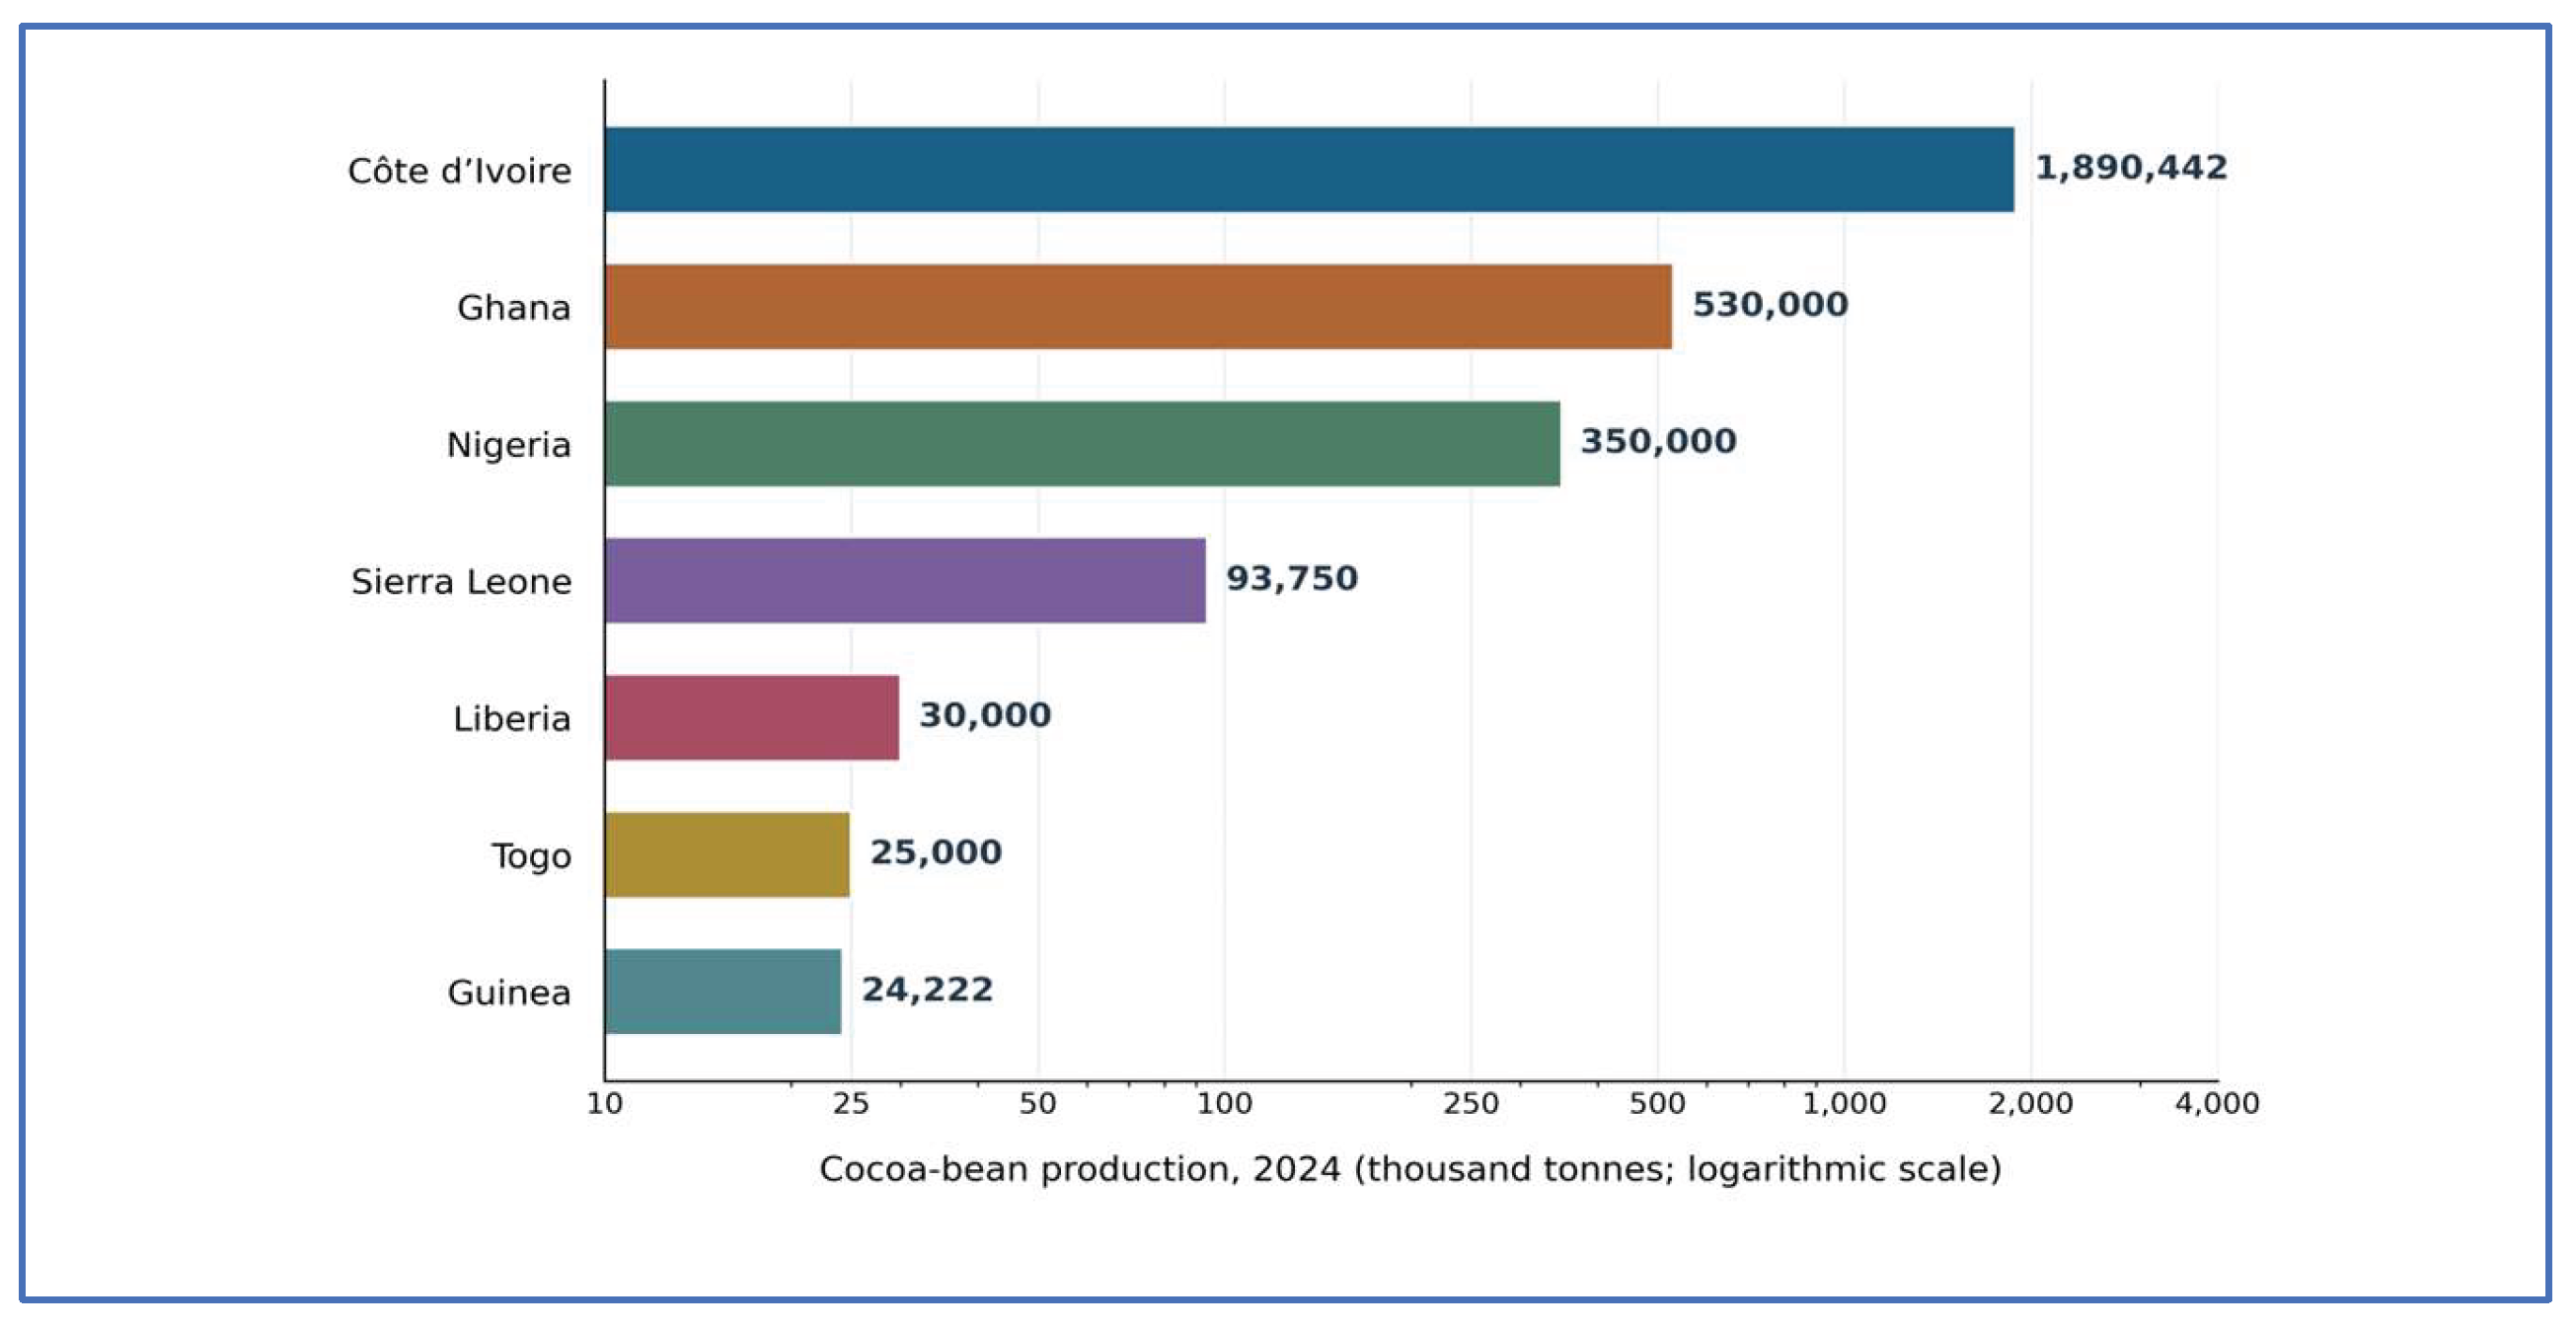

Table 1.
Variable dictionary: definitions, units, transformations and empirical status.
| Variable / symbol | Operational definition | Unit / transformation | Status and source |
| t; d | Calendar year; first destination group | year; categorical | Observed: Trase; 2016–2024 |
| Xdt | Cocoa export tonnage to first destination d in year t | tonnes | Observed: Trase destination series |
| Tt | Total export tonnage across reported destinations in year t | tonnes; sum of Xdt | Derived: Trase destination series |
| Et | EU first-destination share of reported exports |
100 X |
Derived: Trase; Equation (1) |
| IEU | EU-bound cocoa reported as indirectly sourced via intermediaries in 2024 | tonnes | Observed: EU-specific sourcing chart |
| UEU | EU-bound cocoa lacking public supplier-origin attribution in 2024 | tonnes | Observed: EU-specific sourcing chart |
| MEU | EU-bound public-origin information gap relative to all national exports | 100 X | Derived: Trase; Equation (2) |
| CEU | Public-origin information gap conditional on EU-directed exports | 100 X | Derived: Trase; Equation (2) |
| Tj; Ej; Ij | Trader j total exports; EU exports; indirectly sourced volume across destinations | tonnes; common trader-year | Observed: six trader marginals; Trase |
| xj | Jointly EU-destined and indirectly procured tonnage for trader j | tonnes | Unobserved; sharply bounded, not point-estimated |
| Lj; Uj | Fréchet lower and upper feasible values of xj | tonnes | Derived: Equation (3) |
| wj | Width of identification interval: Uj − Lj | tonnes | Derived: disclosure-resolution diagnostic |
| IEU, all | National EU-indirect total for seven-group adding-up identity | tonnes | Observed: Trase; conditional harmonized coverage |
| Pc, 2024 | Cocoa-bean production in calendar year 2024 for country c | tonnes | Observed: FAO; Our World in Data; separate universe |
| Qc,y | Country c cocoa output in October–September cocoa year y | thousand tonnes | Observed: ICCO; contextual only |
|
|
Privately borne annualized documentation and verification expense of producer i | local currency / producer-year | Conceptual; individual observations unavailable |
| , Git | Attributable retained benefits; private cost minus attributable benefit | local currency / producer-year | Conceptual; Equation (5), not estimated |
| Di (a); Yi (a) | Regulated-channel transaction; net cocoa income across all channels under arrangement a | binary; local currency / year | Prospective producer-level tests; not observed |
Source: Compiled by author.
Table 2.
Dataset-level provenance, coverage, access routes and inference boundaries.
| Dataset / vintage | Analytical population and dates | Variables sourced | Provenance / direct access |
| Trase Côte d’Ivoire cocoa supply-chain dataset | National destination series, 2016–2024; six trader group marginals, 2024 | Xdt, Tt, Tj, Ej, Ij; public link fields | French, Trase dataset DOI: 10.48650/E5CN-FH18 |
| Trase explanatory interactive charts | Côte d’Ivoire EU destinations and sourcing classes, 2024 | XEU, IEU, UEU, direct-linked residual | Trase insights |
| FAOSTAT QCL via Our World in Data | Seven West African countries, calendar year 2024 | Pc,2024; regional shares | FAO; Our World in Data; OWID grapher |
| ICCO Quarterly Bulletin of Cocoa Statistics | Côte d’Ivoire, Ghana, world; cocoa years 2022/23 and 2023/24 | Qc,y, separate production-year comparisons | ICCO; bulletin |
| EU legal acts and Commission consolidated guidance | Current rules and transitional timetable as of October 2026 | Institutional timing only; no numerical trade variables | European Union; EU legal texts and Commission guidance |
| Linked producer–buyer microdata | No survey, contract or payment panel included in this study | , , Git, Di (a); Yi (a) | Not observed; proposed future collection, no fabricated estimates |
Note. Indirectly sourced and publicly unknown are distinct Trase disclosure classes, not judicial findings of legal noncompliance. Company, destination and national series must share a common reporting universe before constraints are combined. No 2024 FAOSTAT production quantity is divided by 2024 Trase export tonnage. Source pages verified 25 October 2026. Compiled by author.
Table 3.
EU-specific sourcing categories and the exposure–visibility gap, 2024.
| 2024 category | Metric tonnes | % of national exports | % of EU exports |
| EU: directly publicly linked | 529,418 | 34.47 | 52.09 |
| EU: indirect intermediaries | 343,666 | 22.37 | 33.81 |
| EU: publicly unknown supplier | 143,231 | 9.32 | 14.09 |
| EU unlinked total | 486,896 | 31.70 | 47.91 |
| All destinations | 1,536,045 | 100.00 | — |
Source: (Trase, 2026), own calculations from original volumes.
Table 4.
Company-level EU indirect-sourcing identification bounds, 2024.
| Trading group | Direct sourcing (%) | Lower EU indirect (%) | Upper EU indirect (%) |
| CARGILL | 78.48 | 2.20 | 26.82 |
| BARRY CALLEBAUT | 86.35 | 0.00 | 21.33 |
| OLAM | 75.79 | 0.00 | 37.90 |
| ECOM | 39.32 | 46.08 | 83.22 |
| SUCDEN | 19.11 | 69.45 | 100.00 |
| TOUTON | 52.20 | 19.06 | 74.10 |
Source: (Trase, 2026), own Fréchet-bound calculations.
Table 5.
EU indirect procurement: feasible company-level tonnage and guaranteed pairwise dominance, Côte d’Ivoire, 2024.
Table 5.
EU indirect procurement: feasible company-level tonnage and guaranteed pairwise dominance, Côte d’Ivoire, 2024.
| Trader group | EU-indirect bounds (tonnes) | Guaranteed larger than |
| Cargill | 4,097–49,947 | None identified |
| Barry Callebaut | 0–26,802 | None identified |
| Olam | 0–46,388 | None identified |
| Ecom | 63,555–114,792 | Cargill, Barry Callebaut, Olam, Touton |
| Sucden | 52,229–75,200 | Cargill, Barry Callebaut, Olam, Touton |
| Touton | 12,369–48,080 | None identified |
Source: author calculations from (Trase, 2026) trader and national margins. A dash indicates that no strict ranking is identified.
Table 6.
Company identification widths and priorities for destination-by-sourcing disclosure, 2024.
| Disclosure priority | Trader group | EU indirect interval (tonnes) | Interval width (tonnes) |
| 1 | Ecom | 63,555–114,792 | 51,237 |
| 2 | Olam | 0–46,388 | 46,388 |
| 3 | Cargill | 4,097–49,947 | 45,850 |
| 4 | Touton | 12,369–48,080 | 35,711 |
| 5 | Barry Callebaut | 0–26,802 | 26,802 |
| 6 | Sucden | 52,229–75,200 | 22,971 |
Note. Width = upper bound minus lower bound for the six reported group intervals. This is an informational diagnostic; it does not measure compliance failure, farmer losses or firm responsibility. Source: derived from (Trase, 2026); compiled by author.
Table 7.
Cocoa-bean production in seven West African producing countries, 2024.
| Country | Production (tonnes) | Share of seven-country total (%) |
| Côte d’Ivoire | 1,890,442 | 64.23 |
| Ghana | 530,000 | 18.01 |
| Nigeria | 350,000 | 11.89 |
| Sierra Leone | 93,750 | 3.19 |
| Liberia | 30,000 | 1.02 |
| Togo | 25,000 | 0.85 |
| Guinea | 24,222 | 0.82 |
| Seven-country sum | 2,943,414 | 100.00 |
Source: (FAO, 2025; Our World in Data, 2026), computed by the author. Compiled by author.
Disclaimer/Publisher’s Note: The statements, opinions and data contained in all publications are solely those of the individual author(s) and contributor(s) and not of MDPI and/or the editor(s). MDPI and/or the editor(s) disclaim responsibility for any injury to people or property resulting from any ideas, methods, instructions or products referred to in the content. |
© 2026 by the authors. Licensee MDPI, Basel, Switzerland. This article is an open access article distributed under the terms and conditions of the Creative Commons Attribution (CC BY) license.
Copyright: This open access article is published under a Creative Commons CC BY 4.0 license, which permit the free download, distribution, and reuse, provided that the author and preprint are cited in any reuse.