

Submitted:
02 November 2026
Posted:
05 November 2026
You are already at the latest version
Abstract
Latent world models plan by imagining the result of many action sequences and keeping the one whose predicted features come closest to an encoded goal image. RoboJEPA, the largest such model, needs about a thousand candidates and many rounds of search per step. We measure how much guidance its goal distance gives in an obstacle-reach task, and place an open-world predictive architecture (OWPA) beside the planner: a language model writes the goal and guardrail as facts, a probe reads those facts from the planner's features to form a cost, and a monitor checks that the robot moved as predicted. The image distance guides weakly: it does not fall as the hand approaches the goal, it is dominated by a wrist camera that does not rank outcomes, and it ignores the obstacle the task is about. The language model writes the right goal and guardrail every time, and the monitor catches a robot that does not move. But a linear probe trained on five kitchens reads the facts only in the kitchens it has seen, so it cannot yet steer the planner in a new one. A declared goal states what the task depends on; reading it from a latent world model is the open problem.
Keywords:
latent world models
; model-predictive control
; goal specification
; declared world model
; JEPA
; robot manipulation
; open-world predictive architecture
1. Introduction
A latent world model predicts the future in the feature space of a frozen image encoder, given actions. To plan, it needs a goal and a score of how close a predicted future comes to it. The common choice is a goal image: the planner encodes it once, imagines many action sequences, and keeps the one whose predicted features end nearest to the goal’s features [2,3,4]. This needs no reward, no labels and no policy.
RoboJEPA [2] scaled this approach to an 8-billion-parameter predictor and showed that planning success grows with training compute. It also showed the price: the planner draws about a thousand candidate action sequences per step and refines them over ten to fifteen rounds of the cross-entropy method [6]. Its authors run it compiled, on several GPUs. Run without compilation on one 24 GB GPU, one episode of the 18-step obstacle-reach task at those settings takes about 18 hours with the 300-million-parameter predictor.
A search that large suggests that the goal distance gives the planner little guidance: if most candidates look equally far from the goal, only a large sample finds the few that are closer. This paper measures that guidance in two ways. Along controlled paths from start to goal, it records the distance between encoded frames and the goal image. Among the candidates the planner samples at one step, it measures whether the distance between their predicted features and the goal ranks them in the order of their true progress. As a reference, it computes the same measures for a goal stated as facts about the scene. That reference uses the simulator’s state, which a planner does not have: it shows what a goal stated as facts would give, not what a planner can use today.
The paper then places an open-world predictive architecture (OWPA) beside the planner [10,11,12]. A language model writes the task’s goal and guardrail as facts from a short instruction and the first scene; a cost on those facts, read from the planner’s features by a small probe, replaces the image distance; and a monitor checks after each executed step that the hand moved as the declared model predicted. Each of the three roles is tested on its own: whether the written facts are the right ones, whether the cost ranks candidates better than the image distance, and whether the monitor detects the states in which the robot does not follow its actions. No planner episode is run and no claim is made about planning success.
2. Related Work
- Latent world models used for planning.
PlaNet [5] planned in a learned latent space with the cross-entropy method. DINO-WM [4] and V-JEPA 2-AC [3] predict in the features of a frozen pre-trained encoder and plan toward a goal image. RoboJEPA [2] scales the predictor and relates planning success to compute. All of them score candidates by a distance in feature space to an encoded goal image.
- What a feature space represents.
Balestriero and LeCun [9] show that what a joint-embedding encoder learns is set by the pairs it treats as views of one another. A distance in that space measures what the encoder was trained to keep, which need not be what a task needs: the position of an object relative to a target, for instance, rather than the whole appearance of the scene.
- Shaping the goal signal.
In reinforcement learning, a dense signal that rises toward the goal speeds up learning without changing what is optimal [8]. A goal declared as facts (the hand above the target, clear of the obstacle) gives such a signal by construction.
- Declared world models.
Our earlier papers built an open-world predictive architecture (OWPA): a language model writes the rules of a scene as text, an engine runs them to predict facts, and confirmed mismatches repair the rules [10,11]. Placed beside a vision-language-action policy, the declared model detected most failures but could not make the policy recover [12]; planning in action space, as RoboJEPA does, was the missing level. This paper asks what a declared model could give such a planner.
3. The Planner and Its Budget
- The model.
RoboJEPA predicts the next features of a frozen V-JEPA 2.1 encoder (1.8 billion parameters) from past features and actions. Predictors from 22 million to 8 billion parameters were released; this study uses the 300-million-parameter one, a size for which the RoboJEPA paper reports obstacle-reach results. The encoder and the predictor take 9.3 GB of GPU memory.
- The task.
In obstacle reach, a simulated Franka arm in a RoboCasa kitchen [7] must bring its hand to a goal position on the far side of an obstacle. An episode has 18 steps. The simulator renders the goal image with the hand at the goal position, from the two cameras the planner uses: a side camera beside the arm and a wrist camera.
Figure 1.
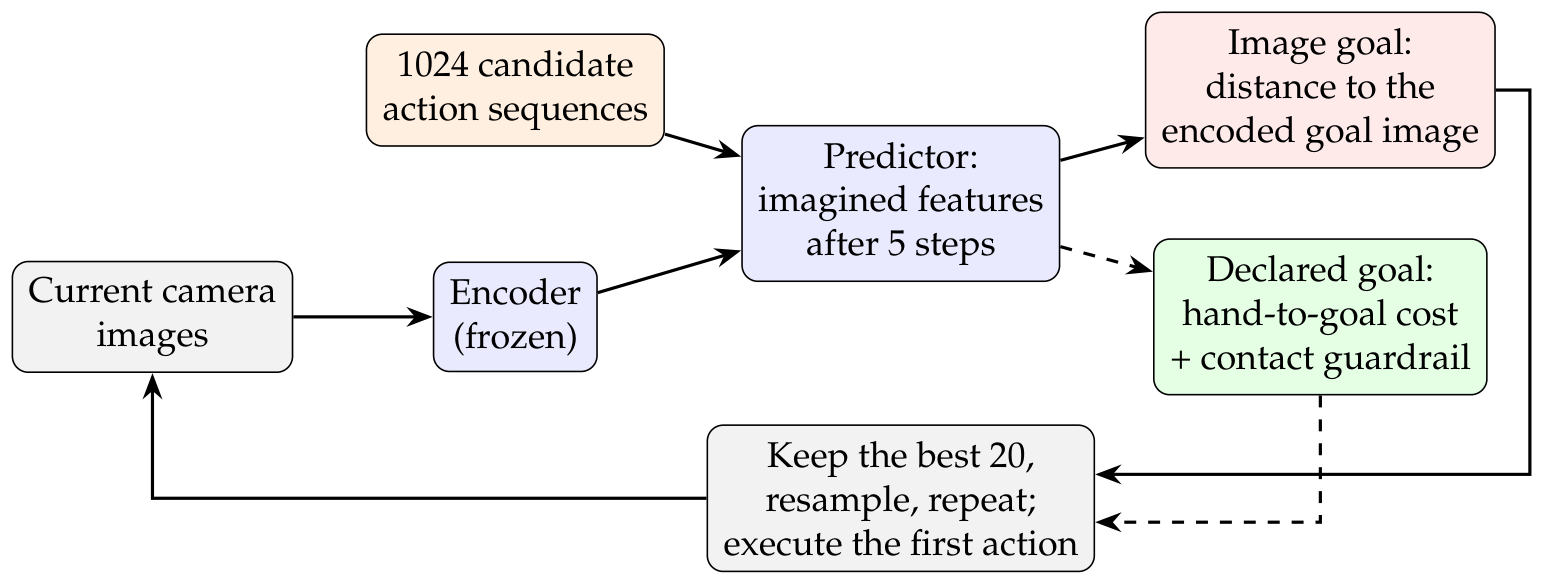
The planner and the two goals compared. RoboJEPA scores each candidate by the distance between its imagined features and the encoded goal image (red). The OWPA’s declared goal scores it by where the hand ends and whether it touches the obstacle (green), read from the predicted features by a probe (dashed).
Figure 1.
The planner and the two goals compared. RoboJEPA scores each candidate by the distance between its imagined features and the encoded goal image (red). The OWPA’s declared goal scores it by where the hand ends and whether it touches the obstacle (green), read from the predicted features by a probe (dashed).
- The planner.
At each step the planner samples 1024 action sequences of 5 steps, predicts the features each one leads to, and scores each by the distance between the predicted final features and the goal’s: the mean absolute difference per feature, averaged over the two cameras with equal weight. The 20 best sequences set the sampling distribution for the next round, for 15 rounds at the first step and 10 after. The first action of the best sequence is executed, and the planner starts again.
- The budget.
Without the compilation and caching the RoboJEPA authors use, on one NVIDIA A10G, one round with the 300M predictor takes about 344 s, and an episode needs 185 rounds: about 17.7 hours. With the 1-billion-parameter predictor the projection is about 34 hours.
4. The OWPA Beside the Planner
Figure 2 shows the arrangement. The latent planner is unchanged; the OWPA supplies its goal and watches its execution.
- Configure.
The language model that writes the declared models of our earlier papers [12] receives a one-line instruction (“bring the hand to the target on the far side of the coffee machine without touching it”) and the facts of the first scene: the hand’s position, the obstacle’s box and the target position. It writes the goal and the guardrail as facts, and a plan. Its output is scored against the task’s own definition: the goal is the hand at the target, and the guardrail is no contact with the obstacle.
- Cost.
The engine turns the written facts into a cost on a candidate’s end state: the distance from the hand to the target, with candidates that break a guardrail ranked last. On the simulator’s state this cost is exact. For the planner it must be read from the predicted features; a probe trained for that purpose is described in Section 6.5.
- Monitor.
Each executed action commands a displacement of the hand. The declared model predicts that the hand moves accordingly; the monitor raises an event when it does not. The rule is fixed before the replay: an event when, over a 5-step sequence, the hand moves less than 20% of the commanded displacement.
5. Method
Figure 3.
The obstacle-reach task and the two driven paths (schematic, side view). The hand must reach the goal on the far side of the obstacle. Distances are recorded at every waypoint of the direct path and of the path through the via point.
Figure 3.
The obstacle-reach task and the two driven paths (schematic, side view). The hand must reach the goal on the far side of the obstacle. Distances are recorded at every waypoint of the direct path and of the path through the via point.
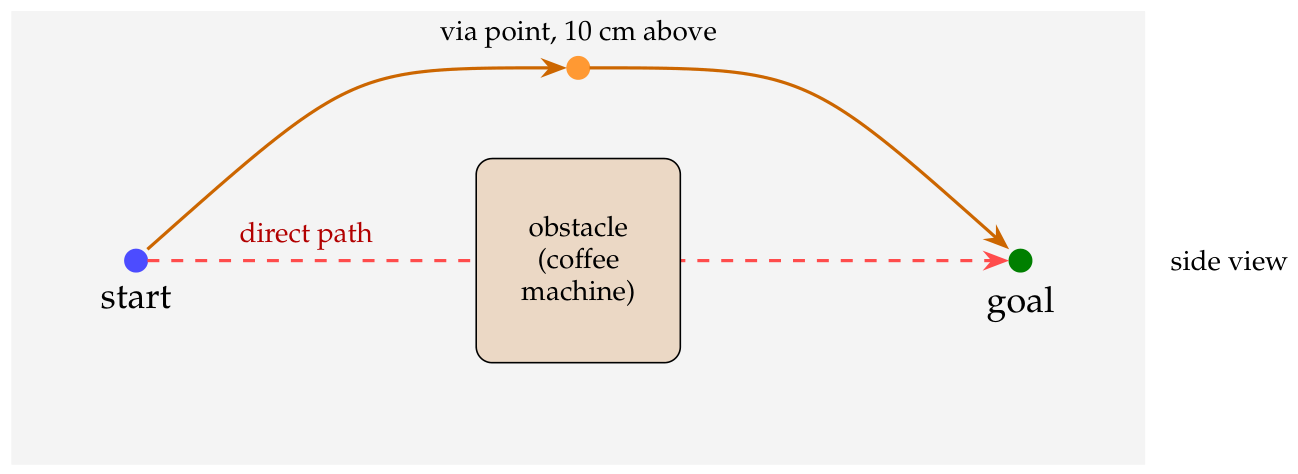
Figure 4.
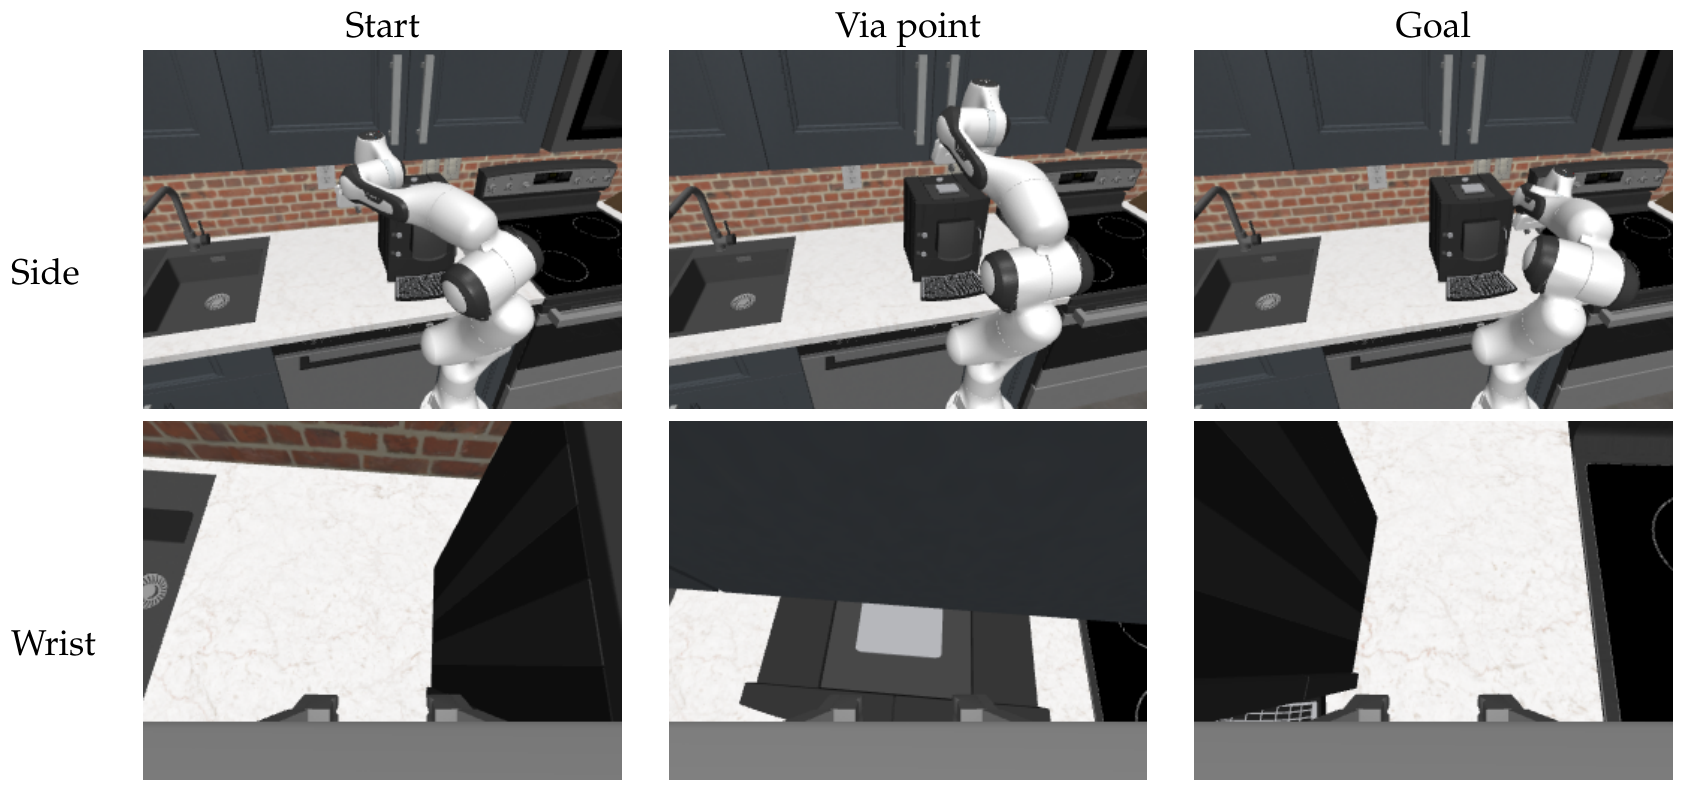
What the planner sees in kitchen 0: the side and wrist cameras at the start, at the via point above the obstacle, and in the goal image. The side view keeps the scene and the hand together; the wrist view changes almost entirely as the hand moves.
Figure 4.
What the planner sees in kitchen 0: the side and wrist cameras at the start, at the via point above the obstacle, and in the goal image. The side view keeps the scene and the hand together; the wrist view changes almost entirely as the hand moves.
- Paths instead of episodes.
Rather than run the planner, the study drives the arm along fixed paths with the simulator’s own controller and encodes the cameras at each waypoint. Each waypoint is a state the planner could reach; the distance there is what the planner would compute if its prediction were perfect. Two paths are used per scene: the direct path from start to goal, and a path through a via point 10 cm above the obstacle.
- Encoded frames and predicted features.
The planner never encodes the frames of a path: it compares the features its predictor imagines with the goal’s. The path measurements describe the encoder and the goal image, and are the same for every predictor size. The ranking measurement below uses the predictor.
- Three goals.
At each waypoint three distances are recorded:
- the planner’s distance to the goal image (both cameras, and each camera alone);
- the planner’s distance to a sub-goal image, rendered at the via point;
- a declared-goal distance computed from the simulator’s facts: the distance from the hand to the goal position, the clearance to the obstacle, and whether any contact occurred.
- Ranking among sampled candidates.
At the start of each scene and at three waypoints of the direct path, the planner’s first-round proposal is sampled (1024 sequences of 5 actions). For each candidate, the predictor’s final features give the planner’s distance to the goal image, and executing the sequence in a copy of the simulator gives its true end position. The measures are the rank correlation (Spearman) between the two, and how many of the true 5, 10 and 20 best candidates are among the planner’s 5, 10 and 20 best. The same is computed with the declared-goal distance on the true end states, as a reference.
- The floor.
At the goal position, the image distance is also measured when the goal is reached by each of the two paths, to separate where the hand is from how the arm got there.
- Scenes.
Of the first ten kitchen seeds, five can be used: in three the environment cannot place a start and a goal around the obstacle, and in two the arm cannot reach the via point. The study uses seeds 0, 1, 4, 5 and 8, chosen from this sweep before any distance was measured. The selection is by geometry; the excluded kitchens may be harder. The obstacle clearance used to draw start and goal is 0.05 m, against 0.12 m in the released environment server, and the start-to-goal distance band is the RoboJEPA paper’s (0.25 to 0.50 m); the released script uses 0.40 to 0.80 m.
- Rules fixed in advance.
Two checks were declared on scene 0 before any measurement, as conditions for a planning pilot. The first required the sub-goal to lie between start and goal in the planner’s distance. The second required each leg of the via-point path to reduce the distance to its target by at least half, while the direct path reduced the distance to the goal by less than half over its first half. Both failed (Section 6.1), and no pilot was run. The measurement on five kitchens is descriptive, with no pass or fail rule.
6. Results
6.1. Scene 0
The planner’s distances between the three images are nearly equal: 0.341 from start to goal, 0.354 from start to sub-goal and 0.342 from sub-goal to goal. The landscape is nearly flat (Table 1).
Over the first half of the direct path the distance to the goal does not fall; it rises. Toward the via point it is flat for the first half and then falls. At the end of the via-point path the hand is 1.8 mm from the goal position, yet the distance to the goal image is still 0.252: a floor that depends on how the arm reached the position, not only on where the hand is. The wrist camera carries most of it: its distances lie between 0.51 and 0.55, against 0.14 to 0.18 for the side camera, so with equal weights the objective is mostly the wrist camera’s.
6.2. Five Kitchens
- The goal distance along the paths.
Values are means and standard deviations over the five kitchens (Table 2); Figure 5 shows one path. On the direct path the hand’s distance to the goal fell by 30% over the first half and by 58% over the whole path. The planner’s distance to the goal image did not follow: it rose by % over the first half and by % over the whole path. On the via-point path the distance to the goal image also rose over the first half (%). The distance to the sub-goal image fell by % as the arm reached the via point, then returned to its starting value as the arm moved on. The direct path touches the obstacle in kitchens 1, 4 and 5; in kitchens 1 and 4 the arm stops 0.24 and 0.39 m short of the goal. In kitchen 0 it keeps 30 mm clear of the obstacle and reaches the goal, and the image distance still rises by 11% over its first half: the rise is not caused by contact.
- The floor at the goal pose.
The goal image is rendered from a stored goal state; renders of that state are identical to the pixel. At the end of each path the image distance to the goal was for the direct path and for the via-point path. Where the hand ended within 2 mm of the goal, it ranged from 0.16 to 0.38. The wrist camera carried most of it (0.46 to 0.52, against 0.08 to 0.15 for the side camera). The arm’s configuration explains it only in part: with nearly the same joint angles, the distance was still 0.15 to 0.18.
- States the controller does not follow.
At 4 of the 12 states used for ranking, every executed candidate ended at the same place, within 1 mm. This is not an artefact of restoring the simulator copy: in the original environment, three different action sequences from those states end at exactly the same place, and the restored copy reproduces the original to within 0.52 mm. At those states the environment’s controller, as configured here, does not follow the commanded actions, so no true ranking exists; they are left out of the ranking measures.
- Ranking among sampled candidates.
At the 8 states where a true ranking exists (kitchens 0, 1 and 4; 128 executed candidates at kitchen 0 and 32 at the others), the planner’s distance ranked the first-round candidates in the order of their true hand-to-goal distance with a Spearman correlation of (Figure 6; bootstrap 95% interval over states, to ). The side camera alone ranked them better (; to ). The wrist camera alone did no better than chance (; to ): the camera that dominates the distance adds noise to the ranking. Among the planner’s 5 best candidates, 1.9 were among the true 5 best, against 0.7 by chance; among its 10 best, 3.8 against 2.8; among its 20 best, 12.5 against 11.3. Only two states, both in kitchen 1, exceed chance at the top 5. Against a ranking that puts collision-free candidates first, the planner’s distance was uncorrelated (). That comparison rests on few states: no candidate collided in kitchen 0, 38 to 100% did in kitchen 1, and in kitchen 4 16% did at the first state and all did at the other three. Only the first round of the search is measured; later rounds sample near the best candidates, where the differences to rank are smaller.
- Predicted features and encoded frames.
At the start of scene 0, the features the predictor imagined for 128 candidates differed from the encoded frames of their true end states by a mean absolute difference of 0.274. Across the candidates, the planner’s distance to the goal varied by only 0.0086. A difference common to all candidates does not change their order, so the gap matters only through the ranking: the same distance computed on the encoded true frames ranked the candidates better () than on the predicted features (). The two distances agree only in part (rank correlation , to ).
- The declared goal.
A goal declared as facts ranks the candidates by their true hand-to-goal distance and their contacts, so on the true end states it reproduces the true ranking by construction: its correlation is 1. It serves as the ceiling the image distance is compared with, not as a result.
6.3. The Written Goal and Guardrail
The language model wrote the goal, the guardrail and a plan for each of the five kitchens, three times each. All 15 outputs passed all three checks: the goal was the hand at the target, the guardrail was no contact with the obstacle, and the plan reached the goal without crossing the obstacle’s box. The test is easy: the first-scene facts give the target and the box, and the written goal copies them to the rounding of the input. It shows that the role can be filled, not that the writer plans well. Two details carry over from our earlier work [12]. Every output wrote a tolerance of 2 cm around the target, ten times the environment’s own 2 mm: the instruction does not state a tolerance, and the written goal is only as precise as the instruction. And the plans kept 4.2 to 5 cm or more from the obstacle’s box, a margin the instruction did not ask for. The three samples for each kitchen were nearly identical.
6.4. The Monitor
The monitor was replayed on the executed sequences at the 12 ranking states, with the rule fixed in advance (an event when the hand moves less than 20% of the commanded displacement; sequences commanded under 5 cm were not evaluated). At the 4 states the controller does not follow, it raised events in 111 of 389 sequences, all at one state: there the hand moves 3.6 cm whatever is commanded. At the other three it raised none. The hand there is not stuck: it moves a fixed 0.15 to 0.41 m whatever the command, so it never falls under 20% of the commanded displacement. At the 8 controllable states it raised false alarms in 30 of 351 sequences (8.5%), at 7 of the 8 states.
The declared rule detects a hand that does not move, not a hand that moves the wrong way. A monitor that predicts the direction of the motion, and compares where the hand ends after different commands, would catch all four states: their defining property is that different commands end at the same place. That rule was not declared before the replay and is not scored here.
6.5. A Cost Read from the Latent State
- The probe.
A linear probe was trained to read the hand’s position and its contact with the obstacle from the encoder’s features (averaged over the image patches, both cameras), on 2,368 frames from random reaches in the five kitchens, and tested on a kitchen it had not seen. Its error on the hand’s position was 13 to 18 cm, barely better than predicting the average position; for contact, its balanced accuracy was at chance in three kitchens and 0.71 and 0.79 in the other two, where positive frames were few.
- The cost on the planner’s candidates.
At the 8 controllable states, the cost read by the probe from the predicted features ranked the candidates with a Spearman correlation of (interval to ), the same as the image distance () and below the side camera alone (). Among its 5 best candidates, about one was among the true 5 best, against 0.7 by chance. The guardrail changed nothing: the probe predicted contact for almost no candidate (at most 0.8%), while up to all of the executed candidates touched the obstacle.
At the start of scene 0, with 128 candidates, the picture differs: the probe’s cost ranked the candidates at on the encoded true end frames and on the predicted features, against for the image distance on the same predicted features. The probe’s own error (about 200 mm on true frames, 256 mm on predicted ones) accounts for most of its loss, more than the imagination does.
- Where the probe fails.
The probe fits its training frames (hand position within 37 to 65 mm, against about 180 mm for guessing the average) and holds on new reaches in kitchens it has seen (78 to 87 mm; contact balanced accuracy 0.67 to 0.79). It fails on kitchens it has not seen (127 to 181 mm; contact at chance in three of them). The facts are in the averaged features; what five kitchens do not give is a readout that carries over to a new kitchen. Averaging over the image patches also discards where in the image the hand is, which a readout of the patches would keep; only averaged features were saved, so that readout was not tested.
- Other distances on the same features.
Two further distances were computed on the saved features. Whitening them (with statistics from the other four kitchens) did not help: it ranked the candidates at , against for the planner’s distance, and kept a floor at the goal. A distance restricted to the three directions that predict the hand’s position did better on the paths: it fell over the first half of the direct path in four of the five kitchens and over the whole path in all five. It ranked the candidates at ( to ), close to the side camera alone and within the same interval as the planner’s distance. None of these distances found the best 5 candidates much more often than chance, and none recovered the contact-aware ranking. At the start of scene 0, whitening ranked the encoded true end frames at but the predicted features at only : there the predictor’s imagination, not the distance, loses the ranking.
7. Discussion
- What the image goal measures.
The image distance guides the planner, but weakly. Along a path that brings the hand halfway to the goal it does not fall, and among sampled candidates it ranks their outcomes with a correlation of about 0.3. Two reasons appear in the measurements. Most of the distance comes from the wrist camera, whose image encodes the hand’s viewpoint and the arm’s pose rather than progress toward the goal, and which ranks outcomes no better than chance. And the planner ranks on predicted features, which order the candidates less well than the real frames would. A planner that must find the right action from such a signal needs many candidates and many rounds; the size of RoboJEPA’s search is consistent with that. The cost is not only compute. A sampling method can make up for a flat, noisy objective by drawing more candidates; a planner that follows the gradient of the cost through the predictor, which would need far fewer evaluations, cannot, because a flat cost has no useful gradient.
- Why the wrist camera dominates.
A camera that moves with the hand sees mostly the hand’s own viewpoint: when the hand moves, the whole wrist image changes, whether or not the hand gets closer to the goal. Its distance is large and varies with the path, but carries little about progress. The side camera sees the hand and the target together, so it ranks outcomes better. The analysis of joint-embedding models by Balestriero and LeCun [9] gives the reason: a representation keeps what its training pairs did not make invariant. A video encoder trained on pairs of clips from the same video is not made invariant to the camera’s own motion, so for a camera that moves with the hand, camera motion dominates the embedding. For a static camera, what changes between frames is the scene, the hand included.
- The floor as missing invariance.
With the hand at the goal, the distance stays between 0.16 and 0.38 because the representation keeps variables the task does not care about, such as the arm’s configuration and the path it took. What an encoder keeps is set by what it was trained to treat as the same [9]; nothing in the training of a general video encoder makes two arm poses with the same hand position equivalent.
- What the image goal does not measure.
The obstacle is the point of the task, yet the image distance is blind to it: it does not prefer candidates that avoid contact. Nothing in a goal image says “do not touch the coffee machine”. A declared goal states it as a fact, alongside the hand’s position.
- The controller.
t a third of the states tested, the controller did not follow the commanded actions. A planner evaluated there spends its whole search on a choice that changes nothing, and its goal distance cannot tell. A declared model that predicts where the hand should move can detect this; the simple rule tested here caught one of the four states, and a rule on the direction of motion is needed for the others.
- Goals as costs on the latent state.
In the architecture proposed by LeCun [1], a planner minimises a cost made of an intrinsic part, which states what is wanted, and guardrail terms, which state what must not happen; both are functions of the latent state. A goal declared as facts has that form: a cost on where the hand is, and a guardrail on what it touches. The measurements here say that an image distance is a poor stand-in for either. The remedy they point to is not to give up planning in a latent space, but to give the planner a cost on the variables the task depends on.
- What a declared goal would need.
The declared goal here was computed from the simulator’s state, which a planner does not have. To plan with it, the planner would need the facts predicted from its features: a small model, trained on the same data, that reads the hand’s position and its contacts from the predicted features. The measurements suggest where to start: the side camera already ranks outcomes better than the wrist, and the encoded frames better than the predicted ones, so the information is partly present. Section 6.5 tests a first version of such a probe. A linear probe on averaged features was not enough: it reads the hand’s position in kitchens it was trained on, but not in a new one, so as a ranker it matched the image distance without beating it, and as a guardrail it saw almost no contact. Distances restricted to the directions that predict the hand fall along the path where the image distance does not, but they do not yet rank the candidates better. More kitchens, and a readout that keeps the image patches, are the next steps.
8. Limitations
- The study measures the goal landscape; it runs no planner episode, so it makes no claim about planning success with any goal.
- One task (obstacle reach), one predictor size (300M) and five kitchens; the ranking covers three kitchens, eight controllable states and 32 to 128 executed candidates per state, not the planner’s 1024.
- The paths are driven by the simulator’s controller; the planner’s own trajectories may visit other states. The ranking measure covers a few states per scene and the first round of the search only.
- The declared-goal distance is computed from the simulator’s state. A planner cannot use it as is: it would need the facts predicted from the latent features, which this study does not build.
- The simulator copy used to execute candidates reproduces the original to within 1 mm at all but one state (2.6 mm, reduced to 0.7 mm by restoring the solver’s warm-start state); the ranking correlations change by at most 0.002 with that correction.
- Only features averaged over the image patches were kept, so readouts that use the patches were not tested.
- Simulation only.
9. Conclusion
A latent planner that plans toward a goal image is guided by a distance that measures appearance. In RoboJEPA’s obstacle-reach task that distance does not fall as the hand moves halfway to the goal, keeps a floor when the hand is at the goal, is dominated by a camera that does not rank outcomes, and does not see the obstacle the task is about. Among the actions the planner samples in its first round, it ranks their outcomes with a correlation of about 0.3. A large search is the price of such a signal.
An open-world predictive architecture beside the planner fills three roles, with mixed results. The language model writes the goal and guardrail as facts correctly in every case tested. A monitor with a simple rule detects a hand that does not move, but not one that moves the same way whatever it is told. And a cost read from the planner’s features by a linear probe works in kitchens it was trained on but not in a new one, so across kitchens it ranks candidates no better than the image distance and misses the contacts. The declared goal states what the task depends on and ranks outcomes perfectly when the facts are known; the open problem is reading those facts from the planner’s features. Until that is solved, a declared goal can describe what a latent planner should do, but cannot yet steer it.
Use of AI Tools
Claude (Anthropic) assisted the author in writing the measurement code, the figures and the text. Claude Opus 5.5 is also a component of the system studied: it writes the declared goal and guardrail. The author designed the study, checked every reported value against the committed results, and is responsible for the content.
Acknowledgments
The RoboJEPA code, checkpoints and planning setup are those released by its authors. The measurements ran on AWS.
Conflicts of Interest
The author is the founder of Cognitive Fab LLC, which develops the declared world model discussed in this work. RoboJEPA is used under its CC BY-NC-SA 4.0 licence; no part of it is included in Cognitive Fab’s software.
References
- Y. LeCun. A path towards autonomous machine intelligence. OpenReview, version 0.9.2, 2022.
- A. Zholus et al. RoboJEPA: scaling robotic latent world models. arXiv:2610.10515, 2026. [CrossRef]
- M. Assran et al. V-JEPA 2: self-supervised video models enable understanding, prediction and planning. arXiv:2506.09985, 2025. [CrossRef]
- G. Zhou, H. Pan, Y. LeCun and L. Pinto. DINO-WM: world models on pre-trained visual features enable zero-shot planning. arXiv:2411.04983, 2024. [CrossRef]
- D. Hafner et al. Learning latent dynamics for planning from pixels. ICML, arXiv:1811.04551, 2019. [CrossRef]
- R. Rubinstein. The cross-entropy method for combinatorial and continuous optimization. Methodology and Computing in Applied Probability 1, 127 to 190, 1999.
- S. Nasiriany et al. RoboCasa: large-scale simulation of everyday tasks for generalist robots. RSS, arXiv:2406.02523, 2024. [CrossRef]
- A. Y. Ng, D. Harada and S. Russell. Policy invariance under reward transformations: theory and application to reward shaping. ICML, 1999.
- R. Balestriero and Y. LeCun. Proving and improving the platonic representation hypothesis with JEPAs. arXiv:2610.39302, 2026.
- J.-J. Dubray. A declared world model: language models write the rules of the scene they are shown. Preprints.org, 2026 . [CrossRef]
- J.-J. Dubray. Terra Incognita II: perception, prediction and repair in an open-world predictive architecture. Preprints.org, 2026. [CrossRef]
- J.-J. Dubray. An open-world predictive architecture beside a vision-language-action model: declared rules, prediction and repair for robot manipulation. Preprints.org, 2026.
Figure 2.
The OWPA beside a latent planner. Blue: the declared layer; orange: the unchanged planner. The language model writes the goal and guardrail as facts; a probe reads those facts from the planner’s predicted features to score candidates; the monitor compares the hand’s motion with the prediction after each step.
Figure 2.
The OWPA beside a latent planner. Blue: the declared layer; orange: the unchanged planner. The language model writes the goal and guardrail as facts; a probe reads those facts from the planner’s predicted features to score candidates; the monitor compares the hand’s motion with the prediction after each step.
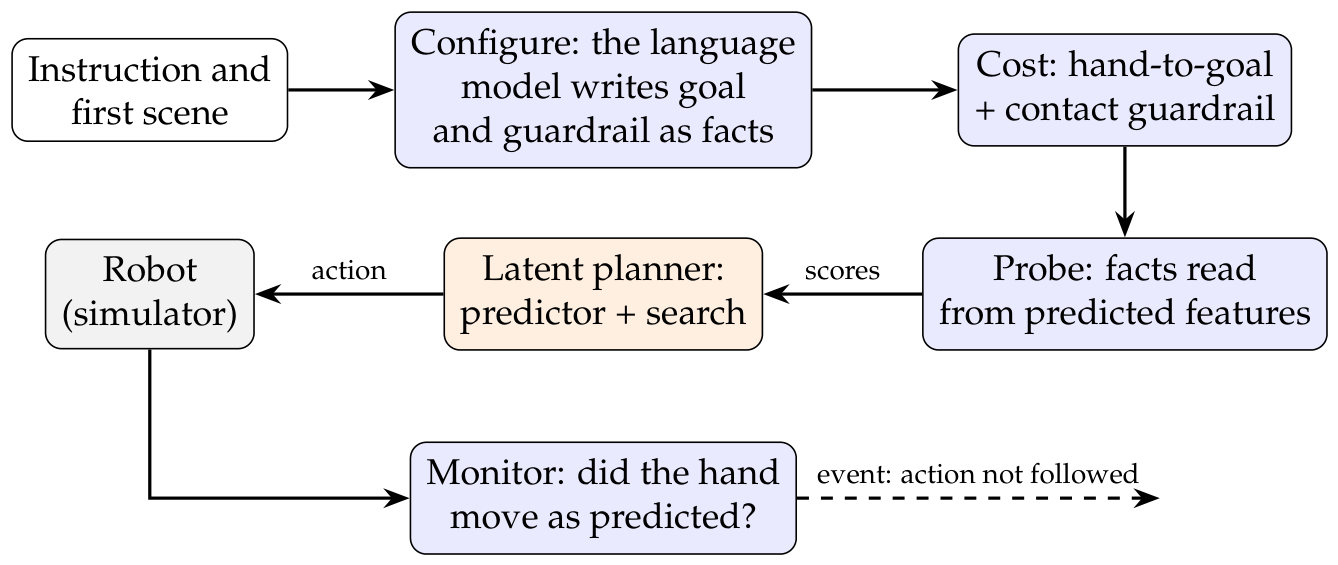
Figure 5.
Kitchen 0, direct path (no contact with the obstacle). The hand’s distance to the goal (dashed, right axis) falls from 0.46 m to 1 mm; the planner’s image distance (blue) rises from 0.34 to 0.38. The wrist camera (orange) carries most of it.
Figure 5.
Kitchen 0, direct path (no contact with the obstacle). The hand’s distance to the goal (dashed, right axis) falls from 0.46 m to 1 mm; the planner’s image distance (blue) rises from 0.34 to 0.38. The wrist camera (orange) carries most of it.
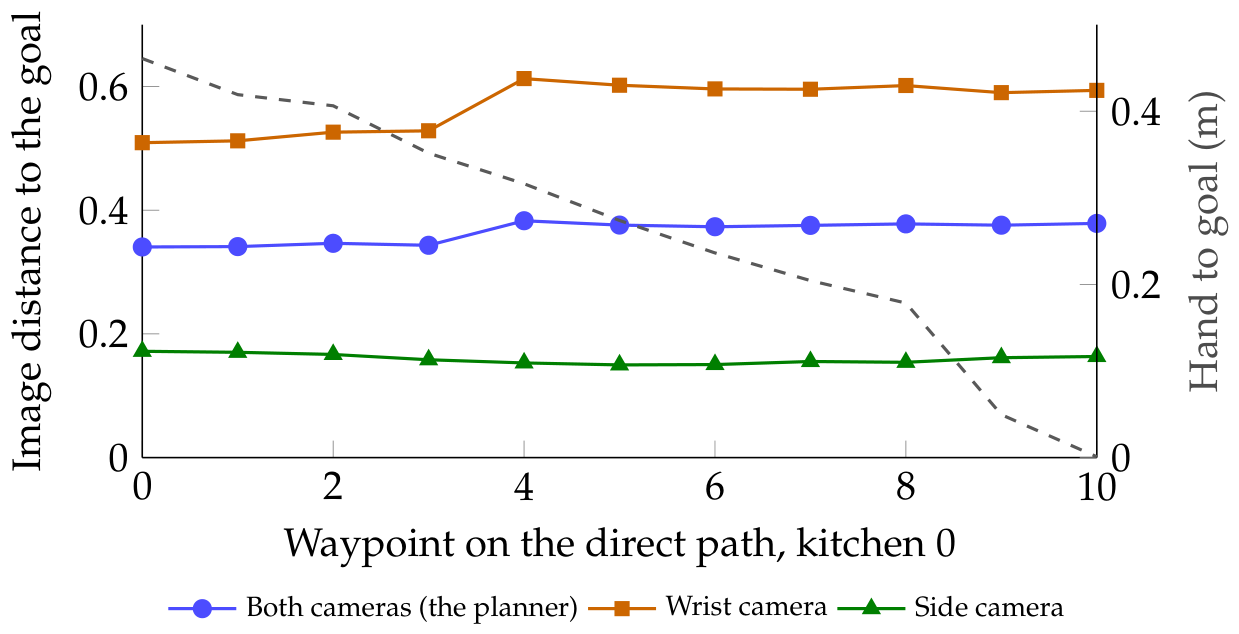
Figure 6.
How well each distance ranks sampled candidates by their true outcome (hand-to-goal distance, except the first bar, which ranks collision-free candidates first). Eight controllable states in kitchens 0, 1 and 4; the last bar is scene 0 only.
Figure 6.
How well each distance ranks sampled candidates by their true outcome (hand-to-goal distance, except the first bar, which ranks collision-free candidates first). Eight controllable states in kitchens 0, 1 and 4; the last bar is scene 0 only.
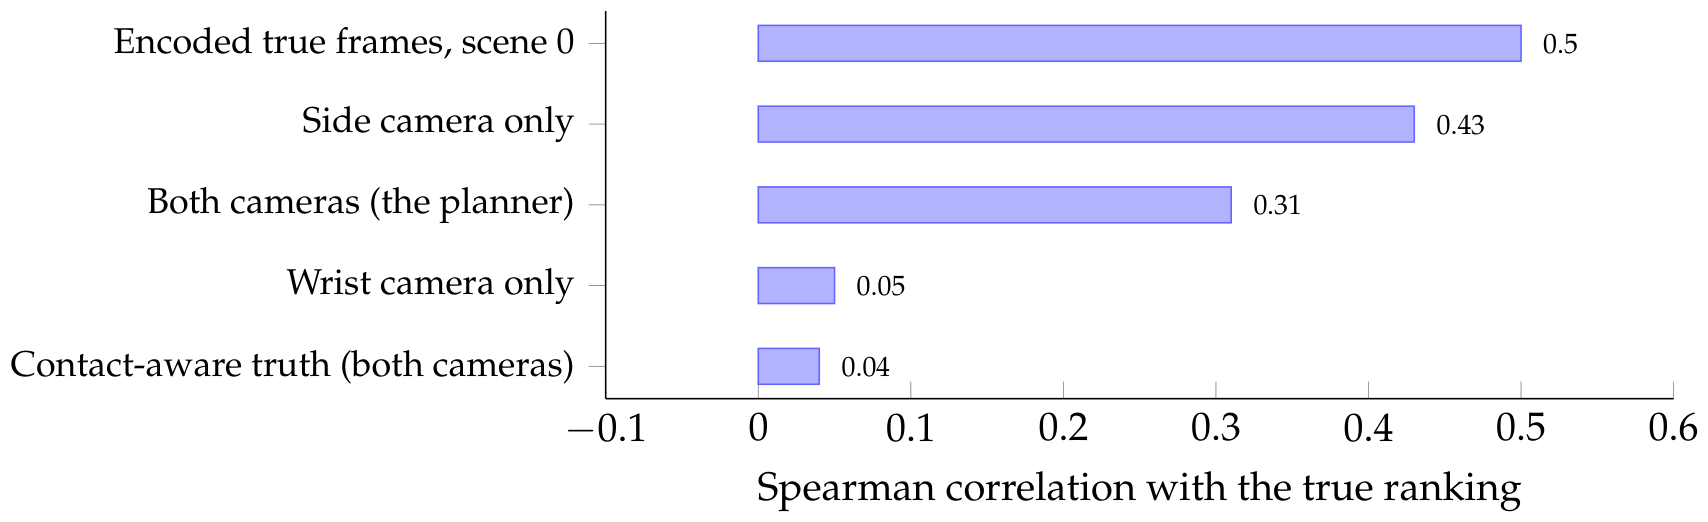

Table 1.
The planner’s distance along the paths of scene 0 (both cameras, equal weight).
| Distance along the path | Start | End | Change |
|---|---|---|---|
| To the goal, first half of the direct path | 0.339 | 0.388 | rises 14.5% |
| To the sub-goal, start to via point | 0.354 | 0.183 | falls 48.3% |
| To the goal, via point to goal | 0.328 | 0.252 | falls 23.1% |
Table 2.
The planner’s image distance and the hand’s distance along the driven paths (mean and standard deviation over kitchens 0, 1, 4, 5 and 8; both cameras, equal weight).
Table 2.
The planner’s image distance and the hand’s distance along the driven paths (mean and standard deviation over kitchens 0, 1, 4, 5 and 8; both cameras, equal weight).
| Change along the path (five kitchens) | First half | Whole path |
|---|---|---|
| Hand to goal, direct path | falls 30% | falls 58% |
| Image distance to goal, direct path | rises % | rises % |
| Image distance to goal, via-point path | rises % | |
| Image distance to sub-goal, start to via point | falls % |
Disclaimer/Publisher’s Note: The statements, opinions and data contained in all publications are solely those of the individual author(s) and contributor(s) and not of MDPI and/or the editor(s). MDPI and/or the editor(s) disclaim responsibility for any injury to people or property resulting from any ideas, methods, instructions or products referred to in the content. |
© 2026 by the authors. Licensee MDPI, Basel, Switzerland. This article is an open access article distributed under the terms and conditions of the Creative Commons Attribution (CC BY) license (http://creativecommons.org/licenses/by/4.0/).
Copyright: This open access article is published under a Creative Commons CC BY 4.0 license, which permit the free download, distribution, and reuse, provided that the author and preprint are cited in any reuse.