

Submitted:
04 November 2026
Posted:
05 November 2026
You are already at the latest version
Abstract
Background. Studies of splicing and age usually count how many events change, and those counts depend heavily on sample size. We asked instead which way each age-linked junction moves — towards use by older or by younger donors — and compared 49 GTEx v8 tissues on that. Version 2.2 adds junctions outside the GENCODE v26 annotation from recount3, classifies junctions against the APPRIS principal junction of their gene, contrasts exonic with intronic per-base coverage, and examines how the circumstances of death shape the age signal. Version 2.4 tests the main findings in independent cohorts.Methods. Annotated junctions were profiled in six decade cohorts (20–79) and classed as older or younger splicing by score tests against null models with sex (FDR < 0.05 within tissue). Junctions were also tested against their gene's principal junction, within each tissue and across tissues with donor-clustered variance, with age-shuffled nulls. recount3 junction counts extended these tests to unannotated junctions in all 49 tissues, with reading-frame and nonsense-mediated decay (NMD) flags. recount3 coverage separated exonic (mature) from intronic (pre-mRNA) signal per gene. The principal-relative, recount3, coverage and brain–body analyses were repeated in donors with a brain sample, who include almost no ventilator cases, and the principal-relative tests also in non-ventilator donors, with Hardy-scale adjustment and in repeated random and age-matched draws; analyses carried forward from version 2.1 use all donors. Version 2.4 adds four independent recount3 cohorts (post-mortem brain; blood, liver and fibroblasts from living donors), splice-motif and uniquely mapped read checks, an aggregate junction burden over every junction read, GC content and qSVA-type degradation covariates.Results. In GTEx, 85% of donors in their 20s but 30% in their 60s died on a ventilator (Hardy scale 0); only 20 of 382 brain donors did. Restricting body tissues to brain donors reduced significant principal-relative associations from 120,523 to 1,612, far more than random or age-matched donor sets of the same size (20,749–27,944 and 8,041–9,895 over three draws). On fixed junction–reference pairs, random and age-matched subsets kept 93–98% of the all-donor age slopes, whereas Hardy-adjusted, ventilator-only, non-ventilator and brain-donor analyses kept 45–55%, mostly with the same sign, and lost the body's majority of increasing alternatives. In brain, testable alternatives decreased relative to their principal reference about twice as often as they increased (31% increasing), and unannotated alternatives more so (12%). In body tissues, alternative splice sites that increased relative to the principal were more often frame-shifting within the coding sequence (all donors 77% vs 47%; brain donors 77% vs 62%, OR 2.0, 95% CI 1.1–3.7, nominal p = 0.018). In brain, frame-preserving exon skips increased and frame-disrupting skips decreased. Gene span, through intron length, was negatively associated with the age slope of an exonic-to-intronic coverage contrast in 12 of 13 brain regions; this persisted without ventilator cases, in 10 of 13 regions with quality and composition adjusted together, and across pseudocount, depth and fixed-gene-set variants, while in body tissues it depended on the donor set. On the same junctions in the same donors, the brain's spread of age effects was 2.0–2.8 times the body's depending on inclusion criteria. Splicing clocks showed weak out-of-fold age correlations (brain median r = 0.21, body 0.04) and no better mean absolute error than a training-fold median. A prospectively specified test linking SLC13 citrate transport to the long-gene association was not supported. In independent cohorts, GTEx brain pairs kept their direction in post-mortem prefrontal cortex (88% of 327; z correlation 0.77), and the long-gene coverage association replicated there (ρ −0.44 against −0.40 in GTEx), whereas in blood, liver and fibroblasts from living donors it was absent or reversed (−0.07 to +0.15). Body-tissue pairs agreed at or below chance in blood, liver and fibroblasts from living donors (33–51%). Counting every junction read, the unannotated share of splicing rose with age in all 13 brain regions (median +2.0% per decade). The brain long-gene association was unaffected by GC content but weakened with degradation components (9 of 13 regions with five, 5 of 13 with ten). SR-gene decay splicing, H2AFY and timing results are carried forward from version 2.1 for all donors only.Conclusions. Two findings lead. First, age-associated splicing differs between brain and body, including within the same donors: in brain, many testable alternatives decrease relative to selected principal references, brain effects on the same junctions are two to three times as variable as body effects and only weakly correlated with them, frame-preserving rather than frame-disrupting forms gain with age, and gene span is negatively associated with an exonic-to-intronic coverage contrast whatever the donor set; the junction directions and the long-gene association replicate in an independent post-mortem brain cohort. Second, age-associated junction use in GTEx body tissues is strongly sensitive to donor selection and procurement-related covariates; about half of the pooled body-tissue age association runs between Hardy categories, and the body-tissue associations do not replicate in samples from living donors. These findings identify reproducible patterns in the analysed outputs but do not isolate ventilation, establish splicing failure or show whether the brain ages faster or slower than the body. SLC13 expression and acetylation-machinery scores do not provide specific support for the proposed metabolic mechanisms.
Keywords:
splicing RNA ageing
1. Background and approach
Our genome-wide analysis of GTEx v8 [1] found that about 12% of splicing events in 49 human tissues were associated with donor age. This paper asks a more specific question about each age-linked junction: is its use higher in older donors (older splicing) or in younger donors (younger splicing)? Tissues are then compared on the make-up of those changes rather than on how many there are.
Why make-up rather than amount. How many junctions reach significance depends on a tissue’s number of donors, read depth and age spread, which in GTEx vary from 85 to 803 donors. Proportions within a tissue are expected to be less sensitive to this, because power applies to older and younger junctions alike. They are not immune: power also differs with a junction’s usual level of use, and the age mix of the donors decides which ages are being contrasted.
A reference within each gene. Version 2.1 asked whether a junction lies in an APPRIS principal transcript. Version 2.2 also compares each junction directly with its gene’s principal junction: does its share against that junction rise or fall with age? APPRIS selects principal isoforms from protein structure, function and conservation, not from abundance in a given tissue [30], so a junction moving towards the principal is not the same as more principal protein.
Beyond annotation. The open-access GTEx junction file contains only GENCODE v26 junctions. Unannotated (cryptic) junctions, whose use rises with age across GTEx tissues including brain [28], were therefore invisible to version 2.1. recount3 [35] realigned every GTEx sample and kept every junction; version 2.2 uses it to test unannotated junctions against the principal junction in all 49 tissues, and its per-base coverage to separate mature mRNA from pre-mRNA [36].
What is being estimated. GTEx donors died in different circumstances, from sudden death to a long terminal illness, and cause and manner of death vary with age. They also drive RNA integrity (RIN) and ischaemic time [2]. The primary estimand is the total age-associated pattern in harvested GTEx tissue, adjusted only for sex. That pattern includes any post-mortem or agonal effects that differ with age. A second estimand adjusts for RIN and ischaemic time, at the cost of removing whatever part of the age signal travels with them.
Donor selection and procurement (new in version 2.2, revised in 2.3). In GTEx, most young donors died on a ventilator (Hardy scale 0), often as organ donors, and most older donors did not. Brain is not collected after prolonged ventilation, and the GTEx procedures distinguish brain and non-brain recovery [43]. Brain donation therefore selects recovery route, collection timing, cause of death and medical context together. A comparison of young with old body tissue thus mixes age with how and where donors died. Version 2.2 repeated analyses in donors who gave a brain sample; version 2.3 adds Hardy-scale adjustment, non-ventilator and ventilator-only donor sets and fixed junction–reference pairs, so that the sensitivity to donor selection can be described more precisely. None of these isolates ventilation itself as a cause.
Candidate explanatory factors.
- Exposure to cerebrospinal fluid (CSF). The pineal gland releases melatonin at night directly into the CSF of the third ventricle [12]. Third-ventricle CSF melatonin is around 20-fold higher than nocturnal plasma melatonin in sheep [13], and higher than plasma in humans [14]; CSF melatonin reaches sheep cerebral tissue [15] and deeper parenchyma through CSF circulation and perivascular spaces [16]. In GTEx, however, the exposure variable is identical to being a CNS tissue, so it cannot separate a melatonin effect from anything else that distinguishes brain from body.
- SLC13 transporters for Krebs-cycle intermediates [6,7]: NaDC1 (SLC13A2), a low-affinity succinate, citrate and α-ketoglutarate transporter in kidney and intestine; NaDC3 (SLC13A3), a high-affinity dicarboxylate transporter in kidney, astrocytes and choroid plexus, whose loss causes α-ketoglutarate accumulation in CSF [10]; and NaCT (SLC13A5), the citrate transporter homologous to Indy, whose reduction extends lifespan in flies and worms [8,9]. Version 2.2 adds J. Hemming’s hypothesis that extra citrate from SLC13 transport makes splicing fail in long genes, leaving transcription without mature mRNA.
The paper also tests J. Hemming’s hypothesis that histone acetylation is lost with age and that this changes splicing decisions, and his suggestion that changes in the splicing of splicing factors alter how the spliceosome tolerates lower acetylation. These tests use expression of the acetylation machinery as a proxy; they cannot measure histone acetylation itself.
2. Methods
2.1. Source Data and Donor Sets
GTEx v8 open-access junction counts, gene TPM and sample annotations [11], with GENCODE v26 annotation and APPRIS principal-isoform tags. Age is given in 10-year bands (20–29 to 70–79), coded at band midpoints. The donor pool is samples with recorded age, RIN and ischaemic time; one sample per donor and tissue.
recount3 [35] GTEx junction counts (32 organ groups; junction coordinates, an annotated flag, sparse junction × sample counts) and per-base coverage files (base_sums bigWigs, 19,214 samples) were read from the AWS open-data bucket and matched to GTEx sample IDs; duplicate runs of a sample were dropped.
Donor sets. All donors is the primary set, as in version 2.1. Brain donors are donors with at least one brain sample (382), whose body tissues are analysed with the same methods; only 20 of them (5%) died on a ventilator (Hardy scale 0). Two controls separate the effect of choosing brain donors from the effect of having fewer donors: random donors, the same number of donors per tissue drawn at random, and age-matched donors, the same number per decade drawn at random from all donors.
2.2. Decade Cohorts and Older and Younger Splicing
Every annotated junction with at least 20 reads in total across GTEx was used, including 31,760 rare junctions left out of the main models. Junctions sharing a donor or acceptor site within a gene form an intron cluster. A junction is analysed in a tissue if at least 40 donors have at least 20 reads in its cluster (eligible donors) and at least 3 of them use it. The GTEx junction file holds only GENCODE v26 junctions, so cluster totals leave out reads at unannotated junctions; a shift of reads to an unannotated junction appears only as changed shares of its annotated neighbours.
- Usage (primary endpoint). The junction’s share of its cluster’s reads in each eligible donor. A null model without age (quasi-binomial, weighted by cluster reads, Pearson dispersion, with sex) gives each donor’s expected share; an efficient score test for a linear age trend gives z_use. For each decade, R = observed ÷ expected reads.
- Presence (secondary). Whether a donor uses the junction at all (≥ 3 reads), against a logistic null on log cluster reads and sex; a score test gives z_pres.
- Classes. Benjamini–Hochberg FDR < 0.05 within each tissue, separately for usage and presence. Older splicing: usage or presence rises with age; younger splicing: it falls. The labels mean only increased or decreased relative use with donor age; they say nothing about transcript age, development or health. The two lists are FDR-controlled separately, so the 5% rate applies to each list, not formally to their union. Presence adds 0.8% of classified profiles (1,570 of 201,765).
- Permutation benchmark. Ages were permuted within each tissue three times and the same procedure applied; this is a benchmark, not an estimate of false discoveries.
- Onsets and losses. An onset is a junction never used below some decade although use was expected there (E ≥ 3), and used from that decade on; a loss is the mirror image. Decade labels were permuted for the null.
2.3. Tissue-Level Measures
| Measure | Definition |
| Older share | Older ÷ (older + younger) junctions |
| Principal share of older (younger) junctions | Share of older (younger) junctions that lie in at least one APPRIS principal transcript |
| Dominant-junction gain share | One count per intron cluster: among clusters with any classified junction whose most-used junction is itself classified, the share in which that junction gains use |
| Drift to the middle | Older share among rarely used junctions (< 20% of cluster reads) minus older share among heavily used ones (> 50%) |
| Absolute change | Junction’s mean usage × (R in the 60s − R in the 20s), in percentage points of cluster reads |
Tissues with fewer than 100 classified junctions (11 of 49) give unstable proportions and are left out of tissue-level tests, which therefore use 38 tissues (9 CNS).
2.4. Robustness, Dependence and Calibration
- Design factors. Each measure was correlated with number of donors, age SD, donors under 40, median cluster reads and the within-tissue correlation of age with ischaemic time; CNS and non-CNS tissues were compared by Mann–Whitney test and by least squares, with and without these factors.
- Equal sample size and age-matched samples. The classification was rerun on random subsets of 140 and 80 donors, and on 140 donors per tissue with the pooled decade mix of CNS samples.
- Cell composition. The first three principal components of cell-type marker genes expressed in each tissue (48 genes; neuronal, glial, endothelial, immune, fibroblast, smooth-muscle, adipocyte, epithelial, erythroid) were added to the null models.
- RIN and ischaemic time were added to the null models in a second run.
- Dependence. Brain regions share donors. CNS profiles were pooled into a single unit and ranked against body tissues; each region was compared on its own; and 95% intervals came from resampling intron clusters within each tissue (200 replicates).
- Calibration. Inflation of the age-permuted usage statistics (λ = median z2 / 0.455), and agreement of our score statistics with statsmodels GLM fits for 400 random junctions in each of four tissues.
2.5. Exposure to Cerebrospinal Fluid
The primary measure is binary and identical to CNS membership (13 exposed, 36 not; pituitary not exposed). A secondary ordinal score, fixed before any analysis, tests for a gradient within the CNS: 4 = forms a ventricular wall; 3 = faces subarachnoid CSF; 2 = deep, no CSF surface; 1 = pituitary; 0 = other tissues.
2.6. SLC13 Transporter Expression
GTEx median TPM of SLC13A2, SLC13A3 and SLC13A5, log2(TPM + 1), and their sum, were correlated with tissue measures with partial correlations controlling for CNS. Within tissues with at least 80 donors, each gene with median ≥ 0.5 TPM was tested for change with age (log2 expression on age and sex, BH-FDR across 68 tests). The long-gene hypothesis tests are in Section 2.14.
2.7. Timing and Brain–Body Comparison
- Decade profiles. For older and younger junctions in each tissue, the median R per decade; the gap log R(older) − log R(younger) measures how far a tissue has moved from young to old splicing.
- Split half. Junctions were classified on a random half of each tissue’s donors and profiled on the other half.
- Same junctions? For junctions classed in at least one CNS and one non-CNS tissue, the majority direction in each group was compared.
2.8. Acetylation and Splicing-Factor Tests
Predictions were written to a timestamped analysis-plan file before each analysis, with later amendments dated and marked as written after earlier results had been seen. The file is not an externally registered pre-registration.
- Cassette exons. A skipping junction plus both inclusion junctions in the same cluster; results are also given for unambiguous events whose skipped interval is an annotated internal exon.
- Test 2, acetylation balance. Per tissue, the mean t for age of acetyltransferase and acetyl-CoA supply genes minus the mean t of deacetylases.
- Acetylation-machinery score and Test 3. Junctions were refitted with usage ~ age + sex + score; lower acetylation mimics age if it moves a junction in its age direction. A post hoc control used 100 random 19-gene scores matched on expression level and breadth.
- Splicing factors. Junctions found only in transcripts annotated as nonsense-mediated decay or retained intron were classed as unproductive, for SR genes and hnRNP/PTB genes.
2.9. Secondary Measures
The earlier versions’ measures are summarised in Section 3.16: the share of events at FDR < 0.05; π1 [3]; τ, the DerSimonian–Laird SD of true age effects [4]; refits on 80 and 140 donors; and slopes before and after 50.
2.10. Junctions Relative to the Principal Junction (New)
Within each tissue and intron cluster containing at least one APPRIS principal junction among the tested junctions, the reference is the principal junction with most reads in that tissue. For every other junction j, the pairwise share r = Y_j / (Y_j + Y_ref) was taken in donors with at least 20 reads in the pair. A quasi-binomial null with sex (closed form, Pearson dispersion) and an efficient score test for age per 10 years give z; at least 40 pair-eligible donors are required. BH-FDR within tissue: older than principal (z > 0, q < 0.05), younger than principal (z < 0), otherwise no clear difference. The pairwise share is unaffected by other junctions in the cluster, annotated or not. It compares an alternative with one selected principal junction, not with a gene-wide principal output: a rise in the reference share can come from less alternative RNA, more reference RNA or both. GTEx intron clusters are connected components (junctions sharing a start or end, joined transitively), so not every tested pair shares a splice site with its reference; results restricted to direct-site pairs are reported (Section 3.5).
Donor-set sensitivity (version 2.3). To separate donor selection from changes in what is tested, the tests were rerun with each tissue’s reference fixed to the one chosen with all donors, so every donor set tests the same junction–reference pairs, and the one-step slope b = U / I and its standard error were kept. Donor sets: all donors; brain donors; non-ventilator donors (Hardy 1–4); ventilator donors (Hardy 0); all donors with the null fitted within sex × Hardy-category cells (Hardy-adjusted); and three draws each of random and age-matched donor sets of the brain-donor size per tissue (the version 2.2 draw plus two more).
2.11. Cross-Tissue Classification (New)
To give each junction one status, one reference per cluster was fixed for all tissues: the principal junction most often chosen as the per-tissue reference. In every tissue where a junction and its reference were tested, per-sample score contributions u = w (r − μ) x_res were computed under the tissue’s null (sex only; age residualised on the null design). The cross-tissue score U sums contributions; its variance is donor-clustered, V = Σ over donors of (that donor’s summed contributions)2, so a donor’s several tissues are not treated as independent and over-dispersion is absorbed. z = U / √V; BH-FDR across junctions.
- Split of no clear difference. For each junction, the observed-over-overall share in each decade was summed across tissues (decades with ≥ 100 pair reads). Its centre age (decade midpoints weighted by that ratio) was compared with the midpoint of the decades used: NCD older if above, NCD younger otherwise.
- Decade counts. A junction counts in a tissue’s decade when present (≥ 3 reads) in ≥ 25% of that decade’s eligible donors, with ≥ 5 eligible donors.
- NMD-only flag. A junction is NMD-only when every GENCODE v26 transcript containing it is of type nonsense_mediated_decay (16,793 of 345,754 junctions).
- Age shuffles. Donor ages were permuted among the analysed donors (each donor keeps one age across all tissues) and the whole procedure rerun: 40 shuffles for brain donors and 20 for all donors.
2.12. recount3 Junctions, Including Unannotated Ones (New)
Candidates were recount3 junctions on the same strand sharing a donor or acceptor site with a principal junction of a protein-coding gene, present with ≥ 3 reads in ≥ 3 of a tissue’s donors. Each was tested against the best-covered principal junction it shares a site with, as in Section 2.10, in all 49 tissues for all donors and in body tissues with at least 40 brain donors. Junctions were labelled GENCODE v26, other annotation (recount3’s annotated flag: present in another catalogue) or unannotated. Counts come from recount3’s realignment, so v26 junctions here have slightly different counts from the GTEx file.
- Three reading-frame measures, kept separate. (1) Annotated NMD-only: every GENCODE v26 transcript containing the junction is of type nonsense_mediated_decay (v26 junctions only). (2) Alternative-site frame shift: for alternative 5′ or 3′ splice sites (no exon skipped; length difference from the reference intron 1–100 nt), a difference not divisible by 3, reported both without and with the requirement that the changed sequence overlaps the principal transcript’s coding sequence (CDS). (3) Structural frame-disruption flag (called “predicted NMD” in version 2.2): the junction replaces its reference intron in the principal transcript, the change in exonic length is computed from that transcript’s exons (including partial intron retention and exon skipping), and the flag is set when the change is not a multiple of 3, overlaps the CDS and lies upstream of the last exon–exon junction. It does not reconstruct the altered sequence or locate the premature stop codon, whose position relative to the last junction decides NMD [37,42]; on annotated junctions it is set for 76% of NMD-only junctions and 48% of others, so it is a structural risk flag, not an NMD prediction. In version 2.3 the flag is evaluated on the junction’s strand in every principal transcript that contains the reference intron (1.7% of principal introns are shared by more than one), and junctions whose transcripts disagree are left unassessed.
- Units. Enrichments are given as junction × tissue cases and, as a sensitivity analysis, as unique junctions (each counted once, its most significant case kept), with odds ratios and 95% confidence intervals. These are secondary, exploratory tests; p-values are not corrected across them.
- Decade tables. Categories were split as in Section 2.11, but within tissue, and counted per decade by the same presence rule. Principal junctions count in a decade when present in ≥ 25% of donors whose principal plus tested partners have ≥ 20 reads.
2.13. Mature mRNA, Pre-mRNA and Gene Length (New)
- Gene length (GTEx TPM). Per gene, log2(TPM + 1) was regressed on age and sex in each tissue, and the age slopes correlated with gene length (Spearman). In versions 2.1–2.3 TPM was stored as float16, so genes exceeding 65,504 TPM in any sample were excluded. Version 2.4 repeated the analysis in float32: 43 genes had been excluded, 10 mitochondrially encoded and the rest highly expressed tissue-specific genes such as albumin, haemoglobins, pancreatic enzymes and pituitary hormones (Section 2.15).
- Exon/intron contrast [36]. From each recount3 coverage file, reads were summed over each gene’s exons not shared with other genes and over its introns outside any gene’s exons. Exonic coverage contains mature mRNA and some precursor; intronic coverage contains nascent and partly processed RNA, retained or detained introns and overlapping transcription, so neither is a pure molecular species. Each sum was normalised to the sample’s total exonic or total intronic signal (relative composition within each compartment, not an absolute molecule ratio), log2-transformed with a pseudocount of 1 per 109, and the age slope of exonic minus intronic taken. The outcome is the Spearman correlation across genes between gene span and that slope: negative means the exonic-to-intronic contrast of long genes falls with age relative to short genes. Genes needed median exonic depth ≥ 100 and intronic ≥ 20 reads, and introns ≥ 1 kb. Coverage sums were stored as log2 float16 (precision about 0.5% of the count); recomputing the published correlations from the stored values reproduces them to within 0.001.
- 3′ bias. log2 of coverage in the last two tenths over the first two tenths of the principal transcript.
- Models. Q: sex + RIN + ischaemic time (primary). QC: Q + three cell-composition components (version 2.2 reported composition with sex only; version 2.3 combines quality and composition). QCH: QC + Hardy-scale categories. Also: ventilator cases excluded; brain donors only.
- Measurement and length sensitivity (new). Pseudocount 10 instead of 1; depth thresholds doubled; a fixed set of genes passing in every tissue; separate correlations with processed (mRNA) length and total intron length; and partial Spearman correlations of the slope with total intron length given mRNA length, intron number and mean exonic expression, and with mRNA length given the others.
2.14. Brain Versus Body, Clocks and SLC13 (New)
- Split test. For each junction against its cross-tissue reference, one-step estimates β = U / I were formed separately for brain (all regions pooled) and body (all tissues pooled), with donor-clustered sandwich standard errors, their covariance from shared donors, and a test of the difference.
- Brain–body magnitude summaries. Method-of-moments estimates across junctions (Section 3.8), reported for junctions contributing in at least 1, 3, 5 or 8 tissues per group, with 95% intervals from 200 intron-cluster bootstrap replicates.
- Splicing clocks. Ridge regression on logit shares of the 3,000 most variable junction-versus-principal pairs per tissue, 130 brain donors per tissue, 10 random draws, outer 5-fold cross-validation. Version 2.3 moves the feature-availability screen (pair readable in ≥ 80% of donors) inside each training fold, names the variants unadjusted and quality-adjusted (features residualised on RIN and ischaemic time; neither variant adjusts for sex), adds an age-permuted variant, and measures error against a training-fold median baseline, with out-of-fold R2 and errors by age band. Draws share donors, so they are not independent validations.
- SLC13 and long genes (Addendum F). Predictions were fixed on 28 October 2026 before analysis, and corrected on 29 October before any test because SLC13 expression by tissue had already been examined. Score = log2(1 + summed median TPM of SLC13A2, A3, A5), with SLC13A5 alone as co-primary. F1: score against the long-gene association across tissues (one-sided permutation, 10,000). F2: score against the exonic and intronic components separately. F3: within tissue, the age decline of a per-sample long-gene index steeper in donors with higher SLC13 expression (age × score interaction; sex, RIN, ischaemic time; pooled by inverse variance).
2.15. Analyses Using Additional Open-Access Downloads (New in Version 2.4)
Version 2.3 held back analyses that needed further downloads. Version 2.4 adds them; every input is open access and was streamed rather than stored.
- Independent cohorts. The 603 recount3 SRA projects with at least 80 samples were scanned for a numeric age attribute. Four full-length RNA-seq cohorts with an adult age spread and a matching GTEx tissue were used, aged 20 and over: post-mortem brain from three regions (SRP073813 [44]: anterior cingulate, dorsolateral prefrontal cortex and nucleus accumbens, 94, 92 and 87 samples; controls and three psychiatric diagnoses), dermal fibroblast lines from healthy donors (SRP144355 [45], 107), PAXgene whole blood (SRP136102, 56 donors with systemic lupus erythematosus or healthy) and liver biopsies from people with obesity across the histological spectrum of fatty liver disease (SRP174668 [46], 192). A skin cohort (SRP082426) was set aside because it is 3′-end sequencing. Runs of the same sample, or for blood the two lanes of each donor, were summed. The principal-relative test of Section 2.12 was applied unchanged, with null groups of sex × diagnosis (brain), sex × phenotype (blood), sex × histological stage (liver) or sex (fibroblasts). Two reference choices: (a) GTEx pairs, the same junction and reference as in the comparator GTEx tissue (frontal cortex BA9, anterior cingulate BA24, nucleus accumbens, cultured fibroblasts, whole blood, liver), and (b) the cohort’s own best-covered principal reference. Agreement is the share of GTEx-significant pairs testable in the cohort whose z has the same sign (binomial test against one half), the correlation of z, and the share expected if the GTEx effect held, from z scaled by the square root of the ratio of pair-eligible donors (a rough benchmark that ignores differences in depth). The coverage analysis of Section 2.13 was repeated from recount3 SRA coverage files with the same gene models, normalisation and depth thresholds (in reads) for the brain DLPFC, fibroblast, blood and liver cohorts, with sex, null-group indicators and, in brain, brain pH and post-mortem interval as covariates.
- Junction evidence. For every tested recount3 junction the splice-site motif (canonical: GT–AG, GC–AG or AT–AC, strand-aware) was read from the recount3 junction annotation, and the reads from uniquely mapped alignments were summed from the recount3 UNIQUE junction files over the same samples as the test. Older and younger counts were recomputed for canonical junctions with at least 80% (or 95%) of reads uniquely mapped. Mappability tracks could not be downloaded here, so the unique-read fraction is the mappability measure.
- Aggregate burden. Every junction read of every analysed sample was assigned to a class: principal junction; another junction sharing a principal splice site (GENCODE v26, other annotation, unannotated canonical, unannotated non-canonical); or any other junction (same split). Per sample: the alternative-to-reference burden (reads of junctions sharing a principal site over those plus principal reads), its unannotated part, the unannotated share of all junction reads, and the non-canonical unannotated share. The logarithm of each was regressed on age per 10 years with sex, RIN and ischaemic time (Q), and with Hardy categories added (QH), per tissue, with all donors and with brain donors, from all reads and from uniquely mapped reads. Unlike the pair tests, this counts every junction read, including junctions too rare to test.
- GC content. Exonic GC (union of the gene’s exons in the coverage model) and intronic GC (gene span outside exons) were computed from the GENCODE v26 GRCh38 primary-assembly genome, excluding N bases. The coverage outcome was correlated with each, and partial Spearman correlations with gene span were computed controlling for exonic and intronic GC and expression, and additionally for mRNA length and intron number.
- Degradation covariates (qSVA-type). The 1,000 transcripts most associated with degradation time in the qsvaR main model [40,47] (derived from a post-mortem brain degradation experiment) were matched to GTEx v8 transcript TPM (996 found). Per tissue, transcripts with mean TPM ≥ 0.5 were log2(TPM + 1) transformed and their first 5 or 10 principal components added to model Q (QD5, QD10) or 5 added to QCH (QCHD5). The number of components was fixed rather than estimated. These components also carry age: in brain, 10 components explain a median 11% of the variance in age (range 6–20%) and 43% of RIN.
- Gene TPM in float32. GTEx gene TPM was streamed again and stored as float32, and the gene-length analysis was rerun with the 43 protein-coding genes that exceed 65,504 TPM in some sample restored.
2.16. Code and Records
The timestamped analysis plan, an analysis log with decisions, deviations and errata, and all code are in the accompanying Zenodo record.
3. Results
3.1. Older and Younger Splicing in Every Tissue
Across 4.0 million junction × tissue profiles (151,029 junctions in 16,781 genes), 104,194 were classed as older splicing and 97,571 as younger. Under age permutation the same procedure classifies about 1,000, a benchmark for the procedure rather than an estimate of false discoveries in the real list. Almost all of the signal is in how much a junction is used rather than whether it is used at all.
How many is a measure of power. The fraction of a tissue’s junctions that are classified correlates with the earlier versions’ crude share of age-associated events at ρ = 0.99. It rises with the number of donors (ρ = 0.58) and with donors under 40 (ρ = 0.65). Counts of older or younger junctions therefore cannot rank tissues, and are not used to compare them.
Which kind depends less on sample size. The older share is unrelated to effect size τ at equal sample size (ρ = −0.15) and splits the tissues (Figure 1). All nine CNS regions with enough junctions have more younger than older splicing (median older share 40%, range 30–45%). In 21 of 29 other tissues older splicing is the majority (median 53%, range 40–57%). Whole blood, breast and tibial artery lean furthest towards older splicing; anterior cingulate, caudate and substantia nigra furthest towards younger. Section 3.2 shows that the body side of this split depends heavily on how young donors died.
3.2. Body-Tissue Results Depend Strongly on Donor Selection (New)
In GTEx, ventilator deaths (Hardy scale 0) fall steeply with age, and brain is not collected after prolonged ventilation:
| Age band | Donors | Ventilator cases | Brain donors | Ventilator cases among brain donors |
| 20s | 81 | 85% | 8 | 0% |
| 30s | 76 | 78% | 10 | 20% |
| 40s | 146 | 72% | 36 | 3% |
| 50s | 304 | 53% | 114 | 3% |
| 60s | 309 | 30% | 193 | 6% |
| 70s | 32 | 28% | 21 | 10% |
So in body tissues a young-versus-old contrast is largely a ventilator-versus-other contrast, while in brain it is not. Ventilator cases also differ in sample quality: across body-tissue samples, median RIN is 7.5 in ventilator cases against 6.7–7.0 in the other Hardy categories, and median ischaemic time 4.0 h against 13–17 h, in every age band (supplementary table body_quality_by_age_hardy.tsv). Brain samples are not of clearly lower RNA quality: median RIN is 6.9 in brain against 7.2 in body tissues, and within brain donors 6.9 against 6.7 for their own body samples; brain ischaemic times are longer (median 13.4 h against 7.9 h).
Counts by donor set. Junctions tested against their principal junction (Section 2.10) give the clearest comparison. With each tissue’s reference fixed to the all-donor choice, every donor set tests the same junction–reference pairs, and the one-step age slope of each pair can be compared directly. Body tissues:
| Donor set (median donors per tissue) | Older than principal | Younger than principal | Older share | All-donor significant pairs: same sign | Their median slope, ratio to all donors | Median SE ratio |
| All donors (391) | 68,239 | 52,284 | 57% | — | 1 | 1 |
| All donors, Hardy-adjusted null | 4,739 | 4,766 | 50% | 98% | 0.51 | 1.07 |
| Ventilator donors only (257) | 3,212 | 3,436 | 48% | 97% | 0.55 | 1.21 |
| Non-ventilator donors (155) | 1,071 | 1,087 | 50% | 83% | 0.49 | 1.95 |
| Brain donors (135) | 815 | 786 | 51% | 70% | 0.45 | 2.15 |
| Random donors, brain-donor size (3 draws) | 11,744–15,032 | 9,005–12,912 | 54–57% | 99% | 0.93–0.98 | 1.65 |
| Age-matched donors, brain-donor size (3 draws) | 4,107–5,280 | 3,934–4,615 | 51–56% | 96% | 0.93–0.96 | 2.12 |
Random draws total 20,749–27,944 classified pairs and age-matched draws 8,041–9,895 (the version 2.2 draws, made with per-set references, gave 22,655 and 9,133). Slope comparisons for the random and age-matched sets come from the two fixed-reference draws. Slope ratios are medians of |slope| among the 112,000–120,000 pairs significant with all donors, so they compare the same pairs.
Three things follow. First, smaller samples and the brain donors’ age mix reduce discoveries mainly by widening standard errors: random and age-matched subsets keep 93–98% of the all-donor slope on the same pairs. Second, the non-ventilator, ventilator-only and Hardy-adjusted analyses all keep about half of the all-donor slope (0.49–0.55), mostly with the same sign (83–98%). About half of the pooled body-tissue age association therefore runs between Hardy categories, which are strongly related to age, and about half persists within them. Third, within every such stratum the body’s older majority disappears (48–50% older), so that majority is a between-stratum feature. Brain-donor restriction goes slightly further (slope ratio 0.45, same sign 70%), consistent with brain donors differing from other donors in more than ventilation.
The body-tissue results of version 2.1 that rest on contrasts with young donors — the body’s majority of older splicing, its drift towards intermediate usage, and part of the timing result — mix age with donor selection and procurement. Version 2.1 already found that they weaken when body tissues are given the brain’s age mix (Section 3.3). The brain results are not affected in the same way, since brain donors are almost all non-ventilator deaths.
3.3. How Robust Is the Brain–Body Contrast?
The CNS pattern — a lower older share and more principal junctions among the older ones — reproduces in every reanalysis that keeps enough brain junctions, but it is not independent of the age mix of the donors, and adjusting for cell composition removes most of the brain’s classified junctions.
Design factors. Across the 38 tissues the older share correlates with the number of donors (ρ = 0.55), age SD (0.60), donors under 40 (0.73) and the within-tissue correlation of age with ischaemic time (0.71). Brain regions have fewer donors, narrower age ranges, few young donors and almost no age–ischaemia coupling, so these factors largely coincide with CNS status. The age–ischaemia coupling in body tissues is itself a sign of the ventilator pattern: young ventilator donors have short ischaemic times.
The same comparison under each reanalysis (medians across tissues with ≥ 100 classified junctions, ≥ 50 in subsets; CNS vs other tissues, Mann–Whitney p):
| Analysis | Tissues (CNS) | Older share | Older junctions principal | Dominant-junction gain share | Tissues drifting to the middle |
| Full samples, sex only | 38 (9) | 40% vs 53% (2 × 10⁻⁵) | 67% vs 33% (2 × 10⁻⁴) | 72% vs 45% (1 × 10⁻⁴) | 0/9 vs 20/29 |
| Usage test only | 38 (9) | 40% vs 53% (2 × 10⁻⁵) | 67% vs 33% (2 × 10⁻⁴) | — | — |
| Random 140 donors (3 replicates) | 30 (8) | 38% vs 50% (2 × 10⁻⁴) | 67% vs 41% (2 × 10⁻⁴) | — | 0/7 vs 9/20 |
| Age-matched 140 donors (2 replicates) | 26 (9) | 37% vs 43% (0.008) | 68% vs 50% (0.003) | 72% vs 66% (0.24) | 0/8 vs 3/17 |
| RIN and ischaemic time added | 29 (8) | 39% vs 52% (0.001) | 63% vs 36% (0.002) | 70% vs 54% (0.011) | 0/8 vs 12/21 |
| Cell-composition PCs added | 17 (2) | 47% vs 52% (0.82) | 57% vs 31% (0.06) | 67% vs 44% (0.06) | 0/1 vs 7/14 |
Age mix. When every body tissue is sampled with the brain’s age mix, body tissues move a long way towards the brain pattern: their drift to the middle largely disappears (3 of 17 tissues) and their dominant junctions gain use as often as in brain. Section 3.2 shows that brain donors’ own body tissues go further still, so donors’ circumstances of death, not only their ages, separate brain from body samples.
Cell composition. Marker scores for neurons fall with age in all 13 CNS regions (within-tissue ρ −0.08 to −0.32). Adding three composition components to the null models removes 93% of the CNS classified junctions (9,806 to 681) and 83% of the others. Composition components also absorb any true age effect that runs through them, so this cannot separate the two; it does show that brain age-associated splicing is closely tied to changes in cell-type marker expression.
Dependence and calibration. Treating all CNS junction profiles as one unit, the pooled CNS older share (42%) is lower than in 27 of 29 body tissues, its principal share of older junctions (62%) higher than in 26, and its dominant-junction gain share (65%) higher than in 26 (rank p ≈ 0.10–0.13). Within tissues, 95% intervals from resampling intron clusters lie entirely below 50% older for all 9 CNS regions. Under age permutation the usage statistics are close to calibrated (median λ = 1.04), and our score statistics agree with statsmodels GLM fits (r = 0.989–1.000).
3.4. What Changes in Brain and Body
In the full samples, annotated junction usage is redistributed differently in brain and body (Figure 2). Outside the CNS, older junctions are mostly minor (non-principal) junctions gaining use and younger junctions mostly principal-transcript junctions losing it. In the CNS older junctions mostly lie in principal transcripts, and the junctions that lose use are mostly minor ones.
| Median across tissues | CNS (9) | Other tissues (29) | Mann–Whitney p | CNS effect, adjusted for design factors (p) |
| Older junctions in a principal transcript | 67% | 33% | 2 × 10⁻⁴ | +0.32 (0.015) |
| Younger junctions in a principal transcript | 41% | 61% | 1 × 10⁻⁴ | −0.45 (0.017) |
| Classified principal junctions losing use | 48% | 62% | 4 × 10⁻⁵ | −0.27 (0.005) |
| Classified minor junctions gaining use | 28% | 66% | 4 × 10⁻⁵ | −0.49 (0.005) |
One count per cluster. Counting each cluster once — does its most-used junction gain or lose use? — gives the same contrast: the dominant junction gained use in a median 72% of CNS cases against 45% in other tissues (p = 1 × 10⁻⁴).
By usual level of use (Figure 3). Outside the CNS, rarely used junctions are mostly older splicing and dominant junctions mostly younger: usage drifts towards the middle, in 20 of 29 tissues and none of the 9 CNS regions. Liver and cultured fibroblasts behave like brain.
Which half is robust. The CNS side holds in every reanalysis. The body side does not: its drift weakens with RIN and ischaemic-time adjustment, splits at 140 random donors and largely disappears with the brain’s age mix, and the body’s classified junctions nearly vanish in brain donors (Section 3.2). The body pattern in Figure 2 should therefore be read as mostly a property of the donor population.
How large the changes are. The median classified junction changes its share of cluster reads between the 20s and the 60s by 2.0 percentage points in body tissues and 5.3 in CNS tissues; the larger CNS changes mostly reflect lower power in the smaller brain samples.
What the pattern does not show. These are changes in the share of junctions. They do not by themselves show that the body loses splicing precision or that the brain protects it: a principal-transcript junction gaining share does not mean more principal protein, and a minor junction losing share may be a functional product being lost.
3.5. Junctions Measured Against the Principal Junction (New)
In brain, junctions mostly lose ground to the principal junction with age; in body tissues they mostly gain on it in all donors, but not in brain donors.
Within each tissue (Section 2.10). Of junctions tested against their tissue’s principal junction, 1,940 in CNS regions were older than the principal and 4,258 younger (31% older). In body tissues with all donors, 68,239 were older and 52,284 younger (57% older); with brain donors 811 and 801 (50%). So in the brain the principal junction gains share with age, and the body’s apparent move away from the principal largely comes from the donor population (Section 3.2).
Direct-site pairs and pipeline concordance (new). Because GTEx clusters are built transitively, 47% of tested pairs do not share a splice site with their reference. Restricted to direct-site pairs, the CNS older share is 33% (1,123 older, 2,273 younger), against 29% for cluster-only pairs; in body tissues with all donors it is 65% (47,265 and 25,119), against 44% for cluster-only pairs. The brain’s lean towards the principal holds for both kinds of pair; the body’s all-donor older majority comes from direct-site pairs. On 905,028 identical junction–reference pairs tested in the same tissue in both the GTEx file and recount3, the z statistics correlate at r = 0.92 (Spearman 0.89). Of the 41,828 pairs significant in both, 99.99% agree in direction, and 64% of GTEx-significant pairs are also significant in recount3. This is technical agreement between two alignments of the same libraries, not independent replication.
One status per junction across tissues (Section 2.11). With donor-clustered variance, which keeps a donor’s several tissues from counting as independent evidence:
| Donor set | Junctions tested | Older than principal | Younger than principal | Older share | NMD-only, older | NMD-only, younger | Odds ratio (p) |
| All donors | 96,465 | 13,209 | 9,395 | 58% | 20.6% | 5.5% | 4.4 (≈ 10−246) |
| Brain donors | 92,895 | 424 | 826 | 34% | 6.8% | 3.6% | 1.95 (0.016) |
In 40 age shuffles of brain donors and 20 of all donors, not one junction was classified, which shows that the procedure does not generate classifications without an age association. It does not show that the lists are free of technical artefact: shuffling removes age-associated technical structure as well as biology, it does not preserve age’s association with Hardy status, RIN or procurement, and with 40 and 20 shuffles the smallest attainable empirical p-values are 0.024 and 0.048 Of junctions classified in both donor sets, 1,038 agreed in direction (347 older, 691 younger) and 8 disagreed. The brain-donor list is thus a small, consistent core of the all-donor list, weighted towards junctions that lose ground to the principal.
Decay-targeted junctions gain with age. In both donor sets, junctions that become more used relative to the principal are enriched for NMD-only junctions: fourfold in all donors and twofold in brain donors (0.024 when each intron cluster counts once). In brain donors, only 5% of whom died on a ventilator, the enrichment is unlikely to come from ventilator deaths, though brain donors differ from other donors in more than ventilation. A rise in NMD-annotated junctions can reflect more production, less decay or both; these data cannot tell which.
No clear difference. Most tested junctions show no clear age trend. Splitting them by whether their use centres above or below the middle of the decades sampled gives 51–52% leaning older, no different from an even split under age shuffling (p = 0.33 all donors, 0.95 brain donors).
Genes. In the brain, 1,576 genes have at least one junction moving towards the principal with age in some region (122 genes in five or more regions); 36 do so consistently, among them LUC7L3, CIRBP, PALM, RTN4, CTNNB1, NRCAM, AGRN, SQSTM1 and LAMP2. Of 533 genes with a cross-tissue brain-donor junction moving towards the principal, 459 are expressed in at least 30 of 36 body tissues and about 40 are brain-restricted; in body tissues 58% of their tests point the same way, mostly without reaching significance.
3.6. Beyond Annotation: recount3 Junctions (New)
Junctions outside GENCODE v26 behave like annotated ones, only more so: in the brain, classified unannotated junctions are mostly younger than the principal, and in body tissues of brain donors those that gain with age are more often frame-shifting.
How many there are. Counting a junction in a tissue when it has ≥ 3 reads in ≥ 10% of donors, unannotated junctions are 4–10% of junctions in most tissues. Testis is the outlier (21%), followed by cerebellum, whole blood and EBV lymphocytes (about 10%); the other brain regions have the lowest shares (4–6%). Counted with ≥ 3 reads in ≥ 3 donors instead, the numbers rise steeply with donor count (ρ = 0.82), because rare junctions accumulate as more donors are sequenced. About half of unannotated junctions share a splice site with a principal junction and so can be tested against it.
Older and younger relative to the principal (Section 2.12; summed over tissues):
| Tissues, donor set | Annotation | Tested | Older | Younger | Older share |
| Body, all donors | GENCODE v26 | 982,170 | 38,270 | 20,914 | 65% |
| Body, all donors | Other annotation | 838,383 | 27,558 | 11,729 | 70% |
| Body, all donors | Unannotated | 1,382,731 | 34,034 | 17,909 | 66% |
| Brain regions | GENCODE v26 | 262,911 | 670 | 1,425 | 32% |
| Brain regions | Other annotation | 186,181 | 102 | 353 | 22% |
| Brain regions | Unannotated | 222,063 | 50 | 355 | 12% |
| Body, brain donors | GENCODE v26 | 604,699 | 474 | 365 | 57% |
| Body, brain donors | Other annotation | 481,041 | 245 | 259 | 49% |
| Body, brain donors | Unannotated | 684,036 | 224 | 511 | 30% |
Adding junctions outside GENCODE v26 roughly doubles what can be classified in body tissues. The brain-donor restriction removes almost all of the body signal for every annotation class, as it does for annotated junctions (Section 3.2). Where the confound is absent — brain regions and body tissues of brain donors — unannotated junctions lean further towards younger than annotated ones: the principal junction gains on them with age. Five body tissues with fewer than 40 brain donors (EBV lymphocytes, pancreas, terminal ileum, spleen, uterus) have no brain-donor analysis.
Reading frame at alternative splice sites. Among alternative 5′/3′ sites whose change falls in the coding sequence (Section 2.12), the share that shifts the reading frame:
| Tissues, donor set | Unit | Older: n, frame-shifting | Younger: n, frame-shifting | Odds ratio (95% CI) | Fisher p |
| Body, all donors | Cases | 14,314, 77% | 5,013, 47% | 3.66 (3.42–3.92) | < 10−300 |
| Body, all donors | Unique junctions | 6,109, 76% | 3,130, 50% | 3.20 (2.92–3.51) | < 10−300 |
| Body, brain donors | Cases | 111, 77% | 129, 62% | 2.00 (1.10–3.69) | 0.018 |
| Body, brain donors | Unique junctions | 107, 76% | 128, 63% | 1.86 (1.02–3.45) | 0.035 |
| Brain regions | Cases | 54, 56% | 125, 50% | 1.23 (0.62–2.46) | 0.63 |
In body tissues, alternative sites that gain on the principal with age are more often frame-shifting within the coding sequence, with all donors and, at nominal significance, with brain donors. In brain the older and younger alternative sites do not differ. Without the CDS requirement the numbers are almost the same (body brain donors 77% vs 61%, p = 0.010). These are exploratory secondary tests.
Decade cohorts and NMD-related flags. Splitting junctions with no clear difference by where their use is centred, and counting each category in each decade (Section 2.12), gives the tables in the supplementary PDF (one table per donor set and decade, by tissue and annotation class). Pooled over tissues at all ages:
| Tissues, donor set | Older | Younger | Older share | Frame-disruption flag %, older vs younger: OR (95% CI) | Annotated NMD-only %, older vs younger (p) |
| Body, all donors | 99,862 | 50,552 | 66% | 66 vs 54: 1.70 (1.66–1.73) | 21.6 vs 11.5 (2 × 10−217) |
| Body, brain donors | 943 | 1,135 | 45% | 63 vs 57: 1.30 (1.08–1.58) | 16.5 vs 10.4 (0.012) |
| Brain regions | 822 | 2,133 | 28% | 43 vs 57: 0.56 (0.47–0.67) | 5.7 vs 6.9 (0.3) |
Counts are junction × tissue cases; counting unique junctions gives the same directions (body brain donors OR 1.30, 1.08–1.58; brain OR 0.63, 0.51–0.78).
The brain result differs in kind from the body result. In brain, alternative 5′/3′ sites show no difference (56% vs 61% flagged, p = 0.07); the difference comes from exon-skipping junctions, of which 20% of those gaining on the principal with age are flagged against 46% of those losing (p = 10−12), and 77% of short skipped segments in brain are multiples of three. So in brain, frame-preserving skips (consistent with neuronal microexons) gain on the principal with age and frame-disrupting ones lose. In body tissues of brain donors the excess of flagged junctions comes from alternative sites (66% vs 57%, p = 0.0008), not from skips (51% vs 56%, p = 0.3).
The shares are stable across decades: in body tissues with all donors, the flag is set for 63–65% of older junctions in every decade from the 20s to the 70s and for 50–51% of younger junctions. The decade counts themselves follow from how the categories are defined, and are descriptive rather than a further test. Of the junctions with no clear age trend, 54–55% lean older in every group, close to an even split.
3.7. Exonic and Intronic Coverage and Gene Length (New)
In 12 of 13 brain regions, gene span is negatively associated with the age slope of the exonic-to-intronic coverage contrast: the exonic signal of long genes falls with age relative to their intronic signal, compared with short genes. The association is carried by intron length, survives quality-plus-composition adjustment in most brain regions, and in body tissues depends on the donor set. It is not explained by GC content, but in brain it weakens with degradation covariates and largely disappears with ten of them (version 2.4).
Exonic against intronic coverage (Section 2.13). Spearman ρ across genes between gene span and the age slope of the exonic-minus-intronic contrast; number of tissues negative and median:
| Model or variant | Brain regions (13) | Body tissues (34) |
| Q: sex + RIN + ischaemic time (primary) | 12 negative; −0.14 | 31 negative; −0.18 |
| QC: Q + composition components | 10; −0.22 | 31; −0.18 |
| QCH: QC + Hardy-scale categories | 9; −0.18 | 25; −0.19 |
| QD5: Q + 5 degradation components (v2.4) | 9; −0.12 | 28; −0.19 |
| QD10: Q + 10 degradation components (v2.4) | 5; +0.02 | 25; −0.15 |
| QCHD5: QCH + 5 degradation components (v2.4) | 8; −0.06 | 26; −0.18 |
| Q, ventilator cases excluded | 12; −0.12 | 23 of 32; −0.14 |
| Q, brain donors only | (same donors) | 17 of 32; −0.01 |
| Q, pseudocount 10 | 12; −0.14 | 31; −0.18 |
| Q, depth thresholds doubled | 12; −0.14 | 33; −0.18 |
| Q, fixed set of 6,910 genes passing in every tissue | 11; −0.13 | 32; −0.18 |
| Q, total intron length instead of span | 12; −0.15 | 32; −0.18 |
| Q, processed mRNA length instead of span | 13; −0.09 | 28; −0.13 |
| Q, intron length given mRNA length, intron number and expression (partial) | 12; −0.24 | 27; −0.13 |
| Q, mRNA length given intron length, intron number and expression (partial) | 8; −0.04 | 22; −0.04 |
| Q, span given exonic and intronic GC and expression (partial, v2.4) | 12; −0.13 | 27; −0.11 |
| Q, span given GC, mRNA length, intron number and expression (partial, v2.4) | 12; −0.18 | 20; −0.06 |
| Q, intron length given GC, mRNA length, intron number and expression (partial, v2.4) | 12; −0.20 | 21; −0.07 |
The association is with total intron length rather than processed transcript length, and it does not depend on the pseudocount, the depth thresholds or expression level. Version 2.2 said 9 of 13 brain regions remained negative with composition components; the correct figure for that model (composition with sex only) is 10 of 13, with cortex, cerebellum and cerebellar hemisphere positive. With quality and composition together it is also 10 of 13 (the same three positive), and 9 of 13 when Hardy categories are added.
GC content and degradation (new in version 2.4). Long genes have AT-rich introns (span against intronic GC, median ρ −0.48), and the coverage slope rises slightly with GC (median ρ +0.10 with intronic GC in brain, +0.16 in body). Controlling for exonic and intronic GC leaves the brain association almost unchanged (12 of 13 negative; with GC, mRNA length, intron number and expression, median partial ρ −0.18; intron length −0.20) but weakens it in body tissues (median −0.11 with GC and expression; −0.06 adding mRNA length and intron number; −0.18 without). Degradation components act the other way. With five, the brain association weakens (9 of 13, median −0.12; frontal cortex −0.40 to −0.18) and with ten it is no longer consistent (5 of 13, median +0.02), while in body tissues it persists (25 of 34, −0.15). The degradation transcripts come from a brain experiment and their components also carry age (10 components explain a median 11% of age variance in brain), so this is a sensitivity to how much age-linked quality variation is removed rather than proof that the brain association is a degradation artefact; but it means the brain long-gene association is not robust to strong degradation adjustment.
Figure 6.
Association of gene span with the age slope of the exonic-to-intronic coverage contrast in each tissue (model Q), with all donors (filled) and with ventilator cases excluded (open). Small intestine and spleen have too few non-ventilator donors.
Figure 6.
Association of gene span with the age slope of the exonic-to-intronic coverage contrast in each tissue (model Q), with all donors (filled) and with ventilator cases excluded (open). Small intestine and spleen have too few non-ventilator donors.
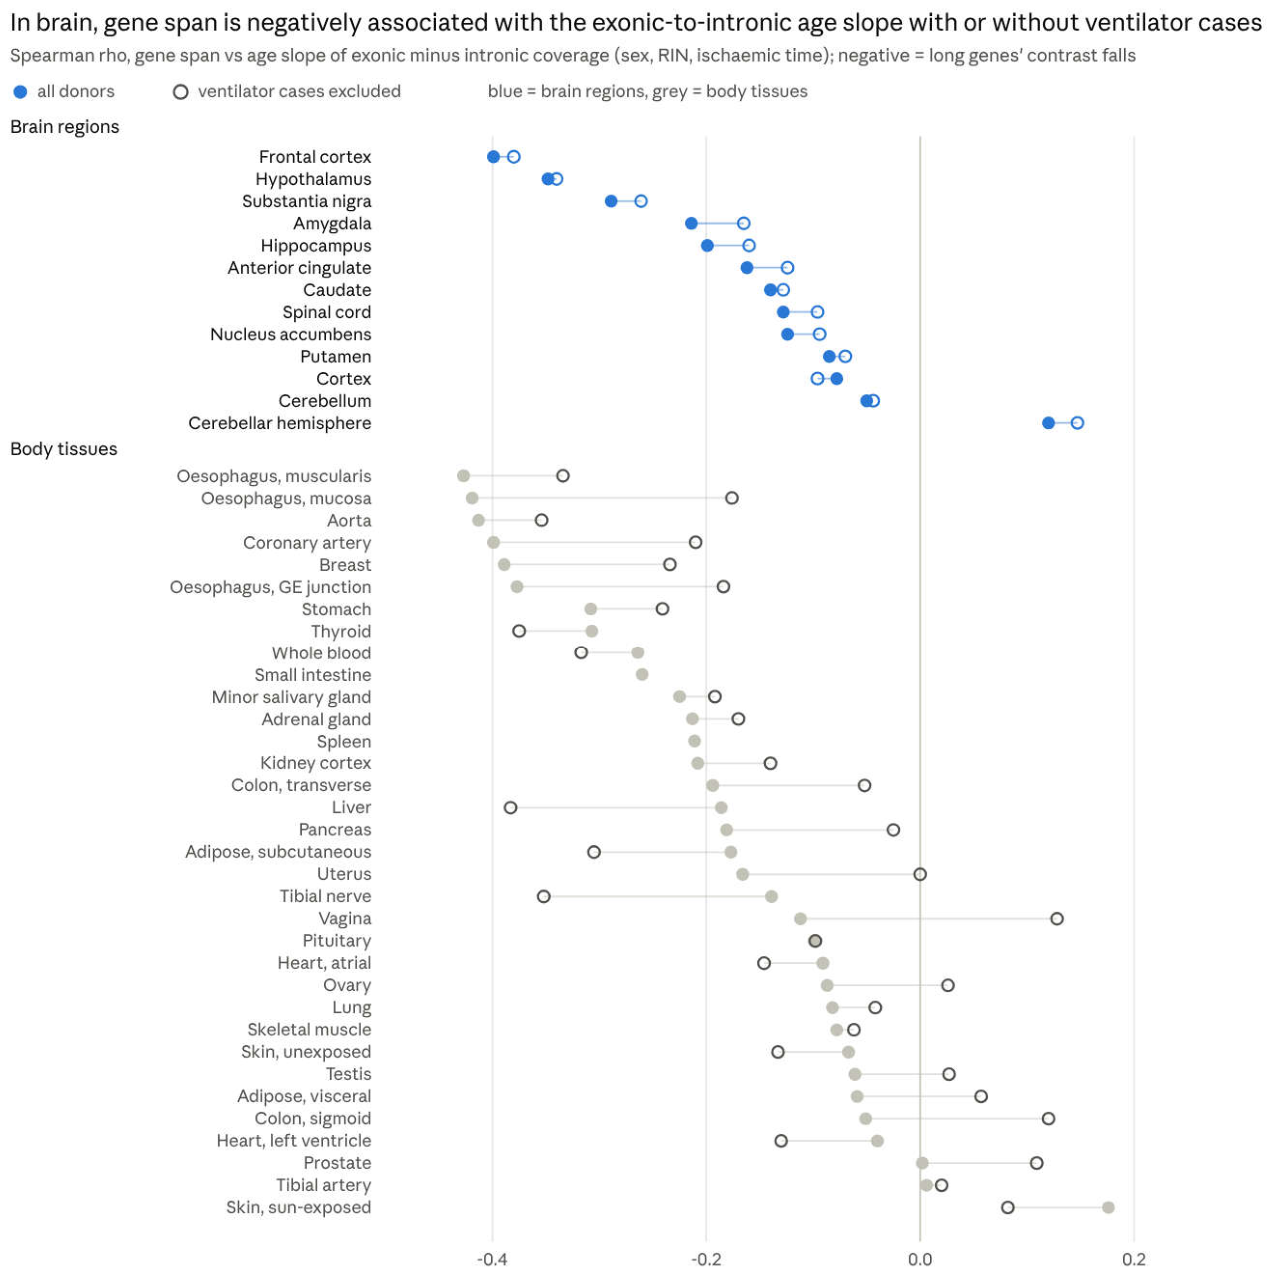
The brain association is strongest in frontal cortex, hypothalamus, substantia nigra, amygdala and hippocampus (ρ −0.20 to −0.40 in model Q). In body tissues it remains clear without ventilator cases (ρ below −0.15) in the oesophagus sites, aorta, coronary artery, breast, stomach, thyroid, whole blood, salivary gland, adrenal, liver, subcutaneous adipose and tibial nerve, and largely disappears in lung, colon, muscle, heart, skin, testis and the reproductive tissues. The all-donor body median is more negative than the brain median, so what distinguishes the brain is persistence across donor sets, not a larger association. The brain-donor result for brain regions is not a replication, since it uses the same brain samples.
Gene expression and length (GTEx TPM). The age slope of expression correlates negatively with gene length in all 13 CNS regions (median ρ −0.18 with sex only; −0.17 with RIN and ischaemic time; 12 of 13 with composition components). In body tissues there is no such pattern (16 of 36 negative, median +0.03). Repeated in float32 with the 43 previously excluded genes restored (version 2.4), every count is unchanged and the largest change in any tissue’s ρ is 0.0022.
3′ bias and intronic share. Coverage shifts towards the 3′ end of transcripts with age in 11 of 13 brain regions and 21 of 34 body tissues with sex only; with RIN and ischaemic time, 8 of 13 brain regions and 7 of 34 body tissues. The intronic share of signal rises with age in 15 of 34 body tissues but only 1 brain region after the same adjustment. A 3′ shift is compatible with residual degradation or capture bias as well as with changes in promoter or last-exon use, so it is a competing explanation, not confirmation of a processing change.
Transcripts that carry age-linked junctions. In the cross-tissue analysis, junctions that gain on the principal lie in shorter transcripts than the principal more often than junctions that lose to it (79% vs 51% with all donors; 73% vs 55% with brain donors), and more often in transcripts without a coding sequence (52% vs 17%; 21% vs 10%).
Reading. These are descriptive correlations across genes, not rates of transcript production, and they have no donor-resampling intervals. A falling exonic-to-intronic contrast in long genes is compatible with slower or incomplete splicing, slower intron removal, nuclear retention, faster decay of spliced mRNA, partial transcription of long genes, or RNA degradation and capture effects that RIN does not fully capture [39,40,41]; bulk steady-state coverage cannot separate them. In single-nucleus data from ageing prefrontal cortex, long neuron-identity genes were preserved while short housekeeping genes declined [38]; that measures a different compartment and endpoint, but it means a general failure of long neuronal genes should not be inferred from these data.
3.8. Brain and Body on the Same Junctions
The brain changes more than the body on the same junctions, mostly in the same direction; whether it ages faster or slower cannot be read from these data.
Direction (version 2.1). Of 3,895 annotated junctions classed in at least one CNS and one other tissue, 65% moved the same way in both. Pairs of brain regions agree in a median 100% of shared junctions, pairs of body tissues 92%, and brain–body pairs 68%. The brain–body difference is less a matter of the same junctions moving in opposite directions than of which junctions move.
Split test in brain donors (new). Estimating each junction’s age effect against its principal separately for brain and body in the same 382 donors, with their shared-donor covariance:
| Measure | Result |
| Junctions significant in brain (pooled regions) | 1,859 towards the principal, 1,322 away |
| Junctions significant in body (pooled tissues) | none in either direction |
| Junctions whose brain and body effects differ significantly | 946 (307 genes towards the principal in brain, 289 away) |
The magnitude summaries below are method-of-moments estimates across junctions: each variance is the observed variance of the one-step estimates minus their mean squared standard error, and the brain–body covariance subtracts the mean shared-donor sampling covariance. Version 2.2 reported them for junctions contributing in at least five brain and five body tissues without stating that filter; version 2.3 shows how they depend on it (95% intervals from 200 intron-cluster bootstrap replicates; donor resampling was not done):
| Junctions included (min. tissues per group) | Junctions | Brain ÷ body SD of true effects | Corrected brain–body correlation | Body-on-brain coefficient | Ordinary correlation |
| ≥ 1 (all with paired estimates) | 57,118 | 2.00 (1.69–2.36) | 0.27 (0.18–0.37) | 0.14 | 0.12 |
| ≥ 3 | 45,674 | 2.35 (2.15–2.61) | 0.30 (0.24–0.37) | 0.13 | 0.23 |
| ≥ 5 (version 2.2) | 40,432 | 2.50 (2.33–2.78) | 0.37 (0.31–0.42) | 0.15 | 0.29 |
| ≥ 8 | 35,488 | 2.76 (2.48–3.17) | 0.38 (0.33–0.43) | 0.14 | 0.32 |
The brain’s spread of age effects is two to three times the body’s under every filter, and the corrected correlation is 0.27–0.38. The value 0.93 quoted in version 2.2 as the “uncorrected” correlation was the deattenuated correlation before subtracting the shared-donor covariance (0.926 for the five-tissue set); the ordinary Pearson correlation of the estimates is 0.29. These numbers describe the spread of pooled age coefficients among eligible junctions, not a tissue ageing rate. Junctions moving in nominally opposite directions are few: 17 move towards the principal in brain and away in body (among them BIN1, MAPT, UBE3A, CALCOCO2), and 19 the reverse (among them DLG4, CACNB1, PRKCB, OGG1, PFKM); none is significant in body on its own.
Splicing clocks (revised in version 2.3). With 130 brain donors per tissue, ridge regression on junction-versus-principal shares and the feature screen inside each training fold, medians across tissues (10 draws per tissue):
| Measure | Brain regions (13) | Body tissues (18) |
| Out-of-fold r, unadjusted features | 0.21 | 0.04 |
| Out-of-fold r, quality-adjusted features | 0.11 | 0.01 |
| Out-of-fold r, ages permuted | −0.15 | −0.14 |
| Mean absolute error, unadjusted (training-fold median baseline) | 7.7 (7.3) years | 7.8 (7.3) years |
| Out-of-fold R2 against the training-fold mean, unadjusted / quality-adjusted | 0.06 / 0.02 | 0.00 / 0.00 |
| Mean absolute error, donors under 50 / 50 and over | 18.1 / 5.9 years | 18.9 / 5.9 years |
The brain–body difference in r is p = 0.002 unadjusted and p = 0.33 with quality-adjusted features (Mann–Whitney across tissues, which ignores shared donors). Out-of-fold correlations are biased downwards under the null (median −0.15 with permuted ages), so both groups carry some age information. But neither clock beats predicting the training median on mean absolute error, R2 is near zero, and predictions shrink strongly towards the average age, so errors for donors under 50 are large. Hippocampus (r = 0.34 unadjusted, 0.28 quality-adjusted), amygdala (0.28 / 0.27) and frontal cortex (0.26 / 0.24) carry most age information; tibial artery and aorta are the best body tissues (0.25 / 0.19 and 0.23 / 0.22). The clocks cannot rank biological ageing speed.
Faster, slower or different? The brain shows larger and more consistent splicing changes with age in the same donors, and its splicing predicts age better. That is evidence that the brain’s splicing changes differently, and by more, than the body’s. It is not evidence that the brain ages faster: counts of significant changes reflect detectability, body tissues carry more noise from death circumstances and tissue heterogeneity, and the brain’s clock advantage depends on RNA-quality adjustment. Nor do these data show that the body ages slower.
Puberty and melatonin. An earlier direct test using age slopes before and after 50 found no time shift between CNS and periphery (noise-corrected r = −0.002), whereas same-age-band changes agreed (r = 0.26 under 50, 0.43 over 50). GTEx begins at 20, so puberty itself is out of view.
3.9. Exposure to Cerebrospinal Fluid
With CNS membership as the exposure, every composition measure separates exposed from non-exposed tissue, and the separation survives adjustment for number of donors, age spread, donors under 40 and age–ischaemic-time coupling:
| Measure | CSF-exposed (9) | Not exposed (29) | CNS effect, unadjusted (p) | CNS effect, adjusted for design factors (p) |
| Older share | 40% | 53% | −0.10 (7 × 10⁻⁵) | −0.12 (0.021) |
| Older junctions in a principal transcript | 67% | 33% | +0.29 (5 × 10⁻⁶) | +0.32 (0.015) |
| Minor junctions gaining use | 28% | 66% | −0.33 (8 × 10⁻⁵) | −0.49 (0.005) |
With RIN and ischaemic time in the null models the unadjusted contrasts remain, but with the design factors added as well they are no longer significant (p = 0.22–0.35).
What the contrast can and cannot say about melatonin. Because exposure is defined as being in the CNS, this contrast cannot distinguish CSF melatonin from anything else that differs between brain and body. Version 2.2 adds a large such difference: how the donors died (Section 3.2). Other findings also weaken a simple CSF explanation: the pattern is shared by liver and cultured fibroblasts, body tissues move towards it with the brain’s age mix, and within the CNS it is not graded by distance from the ventricles (older share flat across the ordinal score, ρ = 0.19, p = 0.53). The data are compatible with a CSF effect but do not provide evidence for one.
3.10. SLC13A2, SLC13A3 and SLC13A5
Splicing composition. The transporters add nothing beyond CNS status. SLC13A3 and SLC13A5 are expressed more in brain than in most other tissues, so across 38 tissues higher expression goes with a lower older share (SLC13A3 ρ = −0.50; SLC13A5 ρ = −0.46) and more principal older junctions. Controlling for CNS removes all of it (partial ρ between −0.12 and +0.16, all p ≥ 0.34), and within the 29 non-CNS tissues there is no association.
Transporter expression with age. Of 68 gene × tissue tests, 19 changed with age after sex adjustment (FDR < 0.05). SLC13A5 decreased in 7 of 19 tissues (adrenal, hippocampus, amygdala, oesophageal mucosa, pituitary, testis, ovary) and not in liver; SLC13A3 mostly increased (11 of 42); SLC13A2 decreased in transverse colon only.
Long-gene hypothesis (new; Addendum F). J. Hemming proposed that where SLC13 transport supplies extra citrate, and so acetyl-CoA, splicing fails with age in long genes, leaving transcription without mature mRNA. The tests and the null were fixed before analysis (Section 2.14). The tissue pattern of SLC13 expression was already known when the hypothesis was stated, which was recorded before any test.
| Test | Prediction | Result |
| F1, across tissues | More SLC13 expression, more long-gene loss | ρ −0.07 to +0.05 for the main outcomes (one-sided p ≥ 0.25); brain-donor outcome ρ −0.22 (p = 0.08); null within body tissues and within brain regions; SLC13A5 alone also null |
| F2, which component | Exonic signal falls, intronic does not | Both fall together across tissues (exonic ρ −0.28, intronic −0.26); not supported |
| F3, within tissues | Donors with more SLC13 expression lose long-gene mRNA faster with age | Body tissues: pooled z = −1.85 (one-sided p = 0.03, uncorrected); brain regions: z = +3.06, the opposite direction; all tissues p = 0.16 |
The hypothesis is not supported as stated. The only result in the predicted direction is the body-tissue F3, and the brain shows the reverse. Median TPM is a coarse measure of transport, SLC13 expression in most body tissues is very low, and a falling exonic-to-intronic contrast cannot be distinguished from nuclear retention or decay.
Three qualifications apply. The F3 pooling treats tissues as independent although donors recur across them, so its standard errors are too small and the nominal body result (p = 0.03) is descriptive. The SLC13A5-alone co-primary was applied to F1 only; F2 and F3 used the composite score. The exploratory genes listed in the plan (SLC25A1, ACLY, ACSS2) were not analysed against the long-gene outcome. The plan was timestamped but not externally registered, and the correction of 29 October records that the tissue pattern of SLC13 expression was known in advance, so these are prospectively specified follow-up tests conditional on earlier observations.
3.11. Timing Across the Decades
In the full samples, most brain regions make most of their move from younger to older splicing between the 20s and 40s, while the body spreads it about evenly from the 20s to the 60s (Figure 4). This result is provisional.
Six of seven CNS regions with enough young donors completed more than half of their 20s-to-60s change by the 40s (median 62%), against 11 of 29 other tissues (median 47%; p = 0.036). Most regions have only 5–9 donors per decade under 40.
Held-out donors. Classifying on one half of each tissue’s donors and profiling on the other, the older–younger divergence replicated in all 24 body tissues that qualified (median 51% of the change by the 40s). No CNS region qualified, so the brain’s early timing cannot be validated within GTEx.
Caveats. With RIN and ischaemic time in the null models, the body is also front-loaded (17 of 21 tissues over 50%) and the brain–body difference disappears (p = 0.44). In body tissues, the young end of every trajectory is dominated by ventilator deaths (85% in the 20s against 30% in the 60s; Section 3.2), so the body’s timing mixes age with circumstances of death. Parts of the brain keep maturing into early adulthood, so early change there may be late development rather than ageing.
3.12. Exon Skipping
Skipping is more often older than younger splicing. Of 40,151 classified cassette skipping junctions, 58% were older, meaning the exon is skipped more with age. Skipping was the majority in 30 of 36 tissues with at least 30 classified events, and the CNS median (55%) did not differ from other tissues (57%; p = 0.24). Restricting to unambiguous events whose skipped interval is an annotated internal exon leaves 22,579 classified events, with the same result (58% older).
| Usual inclusion of the exon | Body, all events | Body, unambiguous annotated | CNS, all events | CNS, unambiguous annotated |
| Under 10% (rarely included) | 39% (6,871) | 39% (4,155) | 70% (287) | 73% (161) |
| 10–90% (alternative) | 59% (21,363) | 59% (11,395) | 54% (1,610) | 57% (939) |
| Over 90% (constitutive-like) | 71% (9,626) | 69% (5,773) | 43% (169) | 56% (88) |
Share of skipping junctions classed older; numbers of events in brackets. In the body, constitutive-like exons are skipped more with age and rarely included exons are included more; with RIN and ischaemic time the body gradient flattens (47%, 57%, 59%). In the CNS, rarely included exons are skipped even more (67% with RIN and ischaemic time). The body figures come from all donors and share the ventilator confound of Section 3.2.
This restates the pre-planned Test 1 in older/younger terms. The first prediction, that loss of acetylation slows RNA polymerase and favours inclusion, is not supported: skipping is the older form. J. Hemming’s later proposal — that compacted chromatin makes nascent RNA less accessible to the spliceosome, so exons are skipped more — fits the body’s constitutive-like exons but not its rarely used ones; because it was proposed after Test 1’s result, Test 1 does not count as support for it. Polymerase speed affects different exons in opposite ways [33], and average elongation speed has been reported to increase with age in several species [34].
3.13. The Histone Acetylation Hypothesis
J. Hemming’s hypothesis is that histone acetylation is lost with age and that this changes splicing decisions. Intragenic histone acetylation can change RNA polymerase II elongation and with it splicing choices [20,21], and nuclear acetyl-CoA comes largely from citrate through ATP-citrate lyase [22]. In human temporal lobe, though, one mark (H4K16ac) rises with normal ageing [23]. These tests use mRNA of the acetylation machinery as a proxy; none measures histone acetylation.
Machinery expression with age (pre-planned Test 2). Of 901 gene × tissue tests, 295 changed with age at FDR < 0.05. Acetyl-CoA supply and most acetyltransferases fell: ACLY in 20 tissues (rising in none), EP300 in 19, KAT5 in 17, PDHA1 in 16, ACSS2 in 14. KAT2A rose in 21, and deacetylases mostly fell too (HDAC2 in 17). The planned balance points towards less acetylation in 29 of 49 tissues, including 12 of 13 CNS regions, and does not differ between CNS and other tissues (p = 0.24).
Lower acetylation looks older (pre-planned Test 3). A lower machinery score raised the use of older junctions and lowered younger ones at 59% of 173,140 classified junctions, against 51% with a permuted score.
But is it acetylation? (post hoc control). On classified cassette skipping junctions, the acetylation score (median 70%) sits inside the distribution of 100 random 19-gene scores matched on expression level and breadth: 39 of 100 reach or exceed it (Figure 5). Allowing for each score’s own drift with age, it lies at a median 66th percentile (above the random median in 25 of 36 tissues; p = 0.03); with RIN and ischaemic time in the models even that disappears (49th percentile).
Reading. Lower acetylation-machinery expression goes with splicing that looks older, but so does lower expression of comparable random gene sets. These data give no specific support to the acetylation hypothesis. The SLC13 long-gene test (Section 3.10), which approaches acetyl-CoA supply from the citrate side, was also negative. A real test needs locus-specific histone acetylation, nascent transcription and splice products measured in the same samples.
3.14. Splicing of the Splicing Factors
Decay-targeted splicing of SR genes is older splicing. Every SR gene has conserved “poison” exons or 3′UTR introns whose use sends the transcript for nonsense-mediated decay; SR proteins use this to regulate their own levels [24]. Of 270 classified unproductive SR junction × tissue profiles, 82% were older, against 41% of 537 productive ones. Counted once each, 21 of the 31 distinct junctions are mostly older, 8 mostly younger and 2 tied (sign test p = 0.024), and all 11 genes lean older (p = 0.001). Productive SR junctions do not lean older (28 of 69). In hnRNP and PTB genes neither kind leaned either way.
| Gene | Unproductive junction × tissue profiles | Older |
| SRSF7 | 65 | 80% |
| SRSF3 | 46 | 93% |
| SRSF4 | 36 | 61% |
| SRSF6 | 23 | 96% |
| SRSF5 | 22 | 100% |
| SRSF2 | 21 | 57% |
| SRSF11 | 16 | 75% |
| TRA2B | 16 | 100% |
| SRSF10 | 15 | 73% |
| SRSF1 | 9 | 100% |
With RIN and ischaemic time the direction remained (74% of 107 profiles; 14 of 23 distinct junctions mostly older, p = 0.19). The brain contributes almost nothing here (5 unproductive SR junctions classified in any CNS region), and the body profiles come from all donors, so part of this signal may reflect circumstances of death. This SR result is carried forward from version 2.1 and was not rerun in brain donors; the genome-wide NMD-annotation enrichment in brain donors (Section 3.5) does not validate it. A higher share of decay-annotated junctions can reflect more production, less decay, or both; these data cannot show less SR protein. Higher inclusion of decay-targeting segments in elderly brain was also reported by Mazin et al. [27].
Donors with more decay-targeted SR splicing showed less skipping elsewhere (47 of 49 tissues), pointing to a donor-wide factor such as decay efficiency. J. Hemming’s suggestion that splicing-factor changes alter how sensitive the spliceosome is to acetylation was supported in direction: with more decay-targeted SR splicing, the link between the acetylation score and skipping was weaker in 34 of 49 tissues. The effect is modest and exploratory.
3.15. New Splice Forms in Later Life, and Genes
Ageing is not the arrival of new splice forms. 7,591 junction × tissue cases were never used in any decade below some band, although use was expected there, and used from that band on; with decade labels shuffled, the same rule found 5,486. The excess (about 2,100) is all in peripheral tissues; CNS tissues showed no excess (1,016 against 980), and losses did not exceed chance. Almost every older junction is already used by young donors, only less. For unannotated junctions the recount3 analysis (Section 3.6) points the same way in the brain, where the principal junction gains on them with age.
Genes. By the version 2.1 rule (older junctions in ≥ 3 tissues and at least twice as many tissues as younger), 753 genes are mainly older splicing and 447 mainly younger.
| Mainly older splicing (tissues older / younger) | Mainly younger splicing (tissues younger / older) |
| PSMB7 (24 / 11) | CLDND1 (20 / 10) |
| H2AFY (22 / 10) | MAP2K2 (19 / 9) |
| SNHG6 (22 / 11) | RRBP1 (19 / 9) |
| TSFM (21 / 9) | ZNF706 (18 / 9) |
| LTBR (21 / 10) | TARS2 (17 / 8) |
| SNRNP70 (20 / 10) | CEP57 (14 / 7) |
| NSUN2 (20 / 9) | CRIP2 (14 / 7) |
| CD40 (20 / 6) | NOL3 (14 / 6) |
| TIE1 (19 / 9) | KCTD17 (13 / 5) |
| UBE2B (19 / 7) | BANF1 (13 / 5) |
These counts include body tissues from all donors and so carry the ventilator confound; the brain-donor gene lists of Section 3.5 do not.
H2AFY (macroH2A1). Both junctions flanking the macroH2A1.2 exon (100 nt, chr5:135,352,946–135,353,045) are younger splicing (7 tissues each), and the junctions flanking the macroH2A1.1 exon (91 nt, chr5:135,350,823–135,350,913) are older splicing (6 and 3 tissues), with no tissue in the opposite direction [32]. Age therefore shifts H2AFY towards macroH2A1.1, the isoform whose macro domain binds NAD+-derived metabolites, including O-acetyl-ADP-ribose from SIRT1 deacetylation [25,26], and which is lost in many proliferating cancers [31]. This is an all-donor result carried forward from version 2.1 and not rerun in brain donors. It is an inference from junction usage; the isoform shift, and any consequence for binding of NAD+-derived metabolites, needs confirming at the transcript and protein level.
Within the brain, in PALM (paralemmin) and DLG1 a minor junction is younger splicing and its principal neighbour older splicing in 8 of 13 CNS regions; RAB6A and PSMA1 show the same swap in 7. PALM and CIRBP are also among the 36 genes that move towards the principal consistently across brain regions (Section 3.5). Lifespan splicing changes in PALM in human brain were described by Mazin et al. [27].
3.16. Secondary Measures: Amount and Size of Age Effects
| Measure | Result |
| Crude share of events at FDR < 0.05 | 33% (whole blood) to 1% (spinal cord), median 8.7%; about half the variation is explained by sample size, age spread and age–ischaemic coupling |
| Sex adjustment | Changes nothing material (ρ ≥ 0.99) |
| τ at 80 donors per tissue | 0.005 (spinal cord, coronary artery) to 0.027 (uterus); hippocampus, cortex and hypothalamus rank 2nd to 4th |
| CNS vs other, τ | CNS 16–28% larger on four τ measures, not significant (p = 0.10–0.41) |
| Slopes before and after 50, calibrated τ | Larger after 50 in 30 of 36 peripheral tissues and 4 of 13 CNS regions (p = 0.002) |
| Older share against τ | Unrelated (ρ = −0.15 across 38 tissues) |
The body tissues with the largest crude shares (whole blood, lung, skin, adipose, artery) have the most donors, including many young donors who mostly died on a ventilator, so these measures carry the same confound as the classification.
3.17. Independent Cohorts (New in Version 2.4)
The GTEx brain age associations replicate in direction in an independent post-mortem brain cohort; the GTEx body-tissue associations do not replicate in blood, liver or fibroblasts from living donors.
Junction–reference pairs significant in GTEx, retested with the same reference (Section 2.15; recount3 counts in both):
| Cohort | GTEx comparator | Donors | GTEx-significant pairs (older share) | Testable in cohort | Same sign (expected if GTEx effect held) | Binomial p | z correlation |
| Brain, dorsolateral prefrontal cortex [44] | Frontal cortex BA9 | 92 | 436 (28%) | 327 | 88% (99%) | 3 × 10−47 | 0.77 |
| Brain, anterior cingulate [44] | Anterior cingulate BA24 | 94 | 49 (14%) | 22 | 82% (100%) | 0.004 | 0.67 |
| Brain, nucleus accumbens [44] | Nucleus accumbens | 87 | 30 (13%) | 12 | 92% (100%) | 0.006 | 0.74 |
| Whole blood (SRP136102) | Whole blood | 56 | 17,670 (82%) | 3,181 | 51% (89%) | 0.12 | −0.02 |
| Liver [46] | Liver | 192 | 126 (21%) | 40 | 33% (100%) | 0.04 | −0.25 |
| Dermal fibroblast lines [45] | Cultured fibroblasts | 107 | 380 (13%) | 79 | 49% (94%) | 1.0 | 0.23 |
Brain. In prefrontal cortex 287 of 327 GTEx-significant pairs move the same way in the independent cohort, including the GTEx majority that loses ground to the principal (33% older among those testable), and all 16 that reach FDR < 0.05 in the cohort agree in direction. Across all pairs tested in both, z correlates at 0.26. The cohort’s own small set of discoveries leans older (39 older, 21 younger in prefrontal cortex), so the brain’s younger majority as a count is not reproduced with 87–94 donors, though the direction of the GTEx findings is. Both brain datasets are post-mortem, so shared post-mortem effects are not excluded; the cohort differs in brain bank, diagnoses (null groups include them), post-mortem interval, library and read length.
Body. In whole blood, where GTEx classifies 17,670 pairs (82% older), sign agreement in the independent cohort is at chance (51%) and no pair reaches FDR < 0.05; the cohort’s own reference choice classifies none of 10,201 tested pairs. Liver agrees less often than chance (33%) and fibroblasts at chance (49%), while expected agreement under the GTEx effect sizes is 89–100%. Agreement is no better with the Hardy-adjusted GTEx estimates: for the 28 blood pairs significant after Hardy adjustment, 39% have the same sign. The body cohorts differ from GTEx in more than the absence of death: the blood donors are mostly women, half with lupus; the liver samples come from people with obesity across the spectrum of fatty liver disease; the fibroblasts are cultured lines. Non-replication therefore cannot be assigned to one cause, but it means that the GTEx body-tissue junction age associations should not be read as general ageing biology.
Long genes in exonic and intronic coverage. The brain association replicates closely; the body associations do not. Spearman ρ between gene span and the age slope of the exonic-minus-intronic contrast (same genes, normalisation and thresholds as Section 2.13):
| Cohort | Samples | Genes | Cohort ρ | GTEx comparator ρ (model Q) | Correlation of gene slopes with GTEx |
| Brain, dorsolateral prefrontal cortex [44] | 91 | 12,530 | −0.44 | −0.40 (frontal cortex BA9) | 0.63 |
| Whole blood (SRP136102) | 60 | 8,768 | +0.15 | −0.26 | −0.04 |
| Liver [46] | 192 | 9,547 | −0.04 | −0.19 | 0.01 |
| Dermal fibroblast lines [45] | 107 | 6,924 | −0.07 | −0.02 (cultured fibroblasts) | 0.00 |
In prefrontal cortex the independent cohort reproduces the GTEx association in size and gene by gene (slopes correlate at 0.63 over 11,614 shared genes). It does so with brain pH, post-mortem interval, sex and diagnosis as covariates, and with intron length in place of span (−0.44). In blood, liver and fibroblasts from living donors the association is absent or reversed, although it is clear in GTEx blood and liver. Liver is sensitive to the disease-stage covariates: with sex only it is +0.10.
3.18. Junction Evidence and Aggregate Burden (New in Version 2.4)
The classified junctions are well supported by uniquely mapped reads. Counted over all junction reads rather than testable pairs, the unannotated share of splicing rises with age in every brain region.
Splice motifs and uniquely mapped reads (Section 2.15). All 5.6 million tested recount3 junction × tissue × donor-set cases (3.9 million with all donors) have a canonical motif (GT–AG, GC–AG or AT–AC): recount3 junctions sharing a principal splice site are essentially all canonical, so the motif check removes nothing. At least 80% of reads come from unique alignments for 97% of GENCODE v26 cases, 95% of other-annotation cases and 87–89% of unannotated cases. Restricting to canonical junctions with at least 80% unique reads leaves the older shares unchanged:
| Tissues, donor set | Annotation | As tested: older, younger (share) | ≥ 80% unique: older, younger (share) |
| Body, all donors | All classes | 99,862, 50,552 (66%) | 95,928, 47,603 (67%) |
| Body, all donors | Unannotated | 34,034, 17,909 (66%) | 31,926, 16,180 (66%) |
| Brain regions | All classes | 822, 2,133 (28%) | 785, 2,034 (28%) |
| Brain regions | Unannotated | 50, 355 (12%) | 42, 286 (13%) |
| Body, brain donors | All classes | 943, 1,135 (45%) | 869, 1,042 (45%) |
| Body, brain donors | Unannotated | 224, 511 (30%) | 185, 433 (30%) |
With a 95% threshold the shares are again within one point. Multi-mapping reads therefore do not explain the direction of the classified junctions, though the unique-read fraction does not test mappability of the reference junction or of reads that were never aligned.
Aggregate burden by age (per sample, all junction reads; percentage change per decade with sex, RIN and ischaemic time; tissues with FDR < 0.05 across tissues):
| Measure | Brain regions (13): rising, FDR-significant up/down, median | Body, all donors (36) | Body, brain donors (31) |
| Unannotated share of all junction reads | 13; 8/0; +2.0% | 24; 10/2; +0.6% | 18; 1/1; +0.2% |
| Unannotated alternative-to-reference burden | 13; 7/0; +1.9% | 23; 12/1; +0.7% | 21; 2/1; +0.6% |
| All alternative-to-reference burden | 8; 0/0; +0.3% | 24; 7/1; +0.3% | 24; 1/0; +0.5% |
| Non-canonical unannotated share | 12; 0/0; +1.2% | 20; 0/0; +0.2% | 9; 0/0; −0.3% |
In brain the unannotated share rises in all 13 regions; with Hardy categories it is still positive in all 13 (median +1.5%, 4 significant), and from uniquely mapped reads alone in all 13 (+1.7%, 1 significant). The unannotated share is small (median 1.4% of junction reads in brain). In body tissues the rise is weaker and largely disappears in brain donors.
Reconciling the two views. In brain, individually testable unannotated alternatives mostly lose ground to the principal with age (12% older), yet the aggregate unannotated share rises. Most unannotated reads (a median 62% in brain regions) come from junctions that were never tested, because they do not share a principal splice site or are too rare, and most tested ones show no clear age trend; the pair tests see only recurrent, measurable alternatives. So the brain shows both a rising aggregate of rare unannotated splicing, in line with the age-related decline of splicing accuracy reported across GTEx [28], and a shift of recurrent alternatives towards the principal junction. These are different quantities, not conflicting results.
4. Discussion
Donor selection. The largest change since version 2.1 is that age-associated junction use in GTEx body tissues is highly sensitive to which donors are analysed. Most donors under 40 died on a ventilator, most older donors did not, ventilator cases have higher RIN and much shorter ischaemic times, and brain is not collected after prolonged ventilation. Restricting body tissues to brain donors reduces significant principal-relative associations from 120,523 to 1,612 junction × tissue cases; this is a fall in thresholded discoveries, not an estimate of how much biological signal was removed. Section 3.2 separates fewer donors, age mix, ventilation status and Hardy-scale adjustment on fixed junction–reference pairs. Ventilation is the most visible difference between the donor sets, but brain donation also selects recovery route, timing, cause of death and medical context [43], so these data do not isolate ventilation as a cause. Any GTEx ageing analysis that contrasts young and old body tissue should report such donor-set sensitivity. Independent cohorts sharpen this (version 2.4, Section 3.17). GTEx body-tissue junction age associations do not replicate in blood, liver or fibroblasts from living donors: sign agreement is at or below chance, including for the 3,181 testable pairs among 17,670 significant in GTEx whole blood. GTEx brain associations, by contrast, keep their direction in an independent post-mortem brain cohort (88% in prefrontal cortex).
What the brain and brain-donor analyses show.
- In brain, many testable alternatives decrease relative to their selected principal reference with age, about twice as often as they increase, for annotated junctions and even more for unannotated ones.
- In body tissues of brain donors, few junctions are classified and they are balanced in direction. Among alternative 5′/3′ sites, those that gain with age are more often frame-shifting within the coding sequence (77% vs 62%, nominal p = 0.018); this is an exploratory result.
- In brain the frame pattern differs: frame-preserving exon skips gain on the principal with age and frame-disrupting skips lose, consistent with neuronal microexon programmes.
- Gene span is negatively associated with the age slope of the exonic-to-intronic coverage contrast in 12 of 13 brain regions, an association carried by intron length that persists without ventilator cases and in most regions after quality-plus-composition adjustment; in body tissues it depends on the donor set.
- On the same junctions in the same donors, the brain’s spread of age effects is two to three times the body’s, and a splicing clock carries a little more age information in brain.
Novelty and prior work. Age-associated splicing, decay-targeted isoforms in old brain and transcript-processing changes are established [27,28]. Mazin et al. described lifespan splicing trajectories in human brain, including enrichment of potential NMD-targeting segments in old age and the PALM change [27]; García-Ruiz et al. found that splicing accuracy declines with age across GTEx [28]. The contribution here is narrower: quantifying how the direction of age-associated junction use, measured against a selected principal reference across 49 tissues, depends on donor selection; extending that to unannotated junctions; and applying an exon–intron contrast [36] to gene length. recount3 reprocesses the same GTEx libraries, so agreement between the GTEx-file and recount3 results is technical corroboration, not independent replication. The apparent difference from García-Ruiz et al. is not a contradiction. Version 2.4 computed the aggregate burden over every junction read (Section 3.18): the unannotated share of splicing rises with age in all 13 brain regions, in line with their finding, while recurrent, individually testable alternatives in brain shift towards the principal junction.
Brain versus body. The brain’s age-associated splicing differs from the body’s and is larger on the same junctions, but these data do not say whether the brain ages faster or slower. Counts of significant changes reflect detectability; brain samples come from a more uniform donor population; the brain’s clock advantage shrinks with quality adjustment; and the magnitude summaries depend on which junctions are included.
Explanations for the brain patterns. Four remain open:
- Donor population. Brain donors are almost all non-ventilator deaths with few donors under 40, so brain and body samples differ in who the donors are as well as in tissue.
- Cell composition. Neuronal marker expression falls with age in every CNS region, and adding composition components removes most of the brain’s classified junctions. Marker components can also capture cell state and RNA quality, so this is neither proof that the signal is cellular mixture nor that adjustment removed only artefact; cell-resolved data are needed.
- Transcript processing. The exonic-to-intronic contrast of long-intron genes falling with age is compatible with slower or incomplete splicing, slower intron removal, nuclear retention or faster decay of spliced mRNA. It is also compatible with RNA degradation and capture effects that a single quality covariate does not remove (in brain the association weakens with qSVA-type degradation components, Section 3.7) [39,40,41]. Single-nucleus data from ageing prefrontal cortex found long neuron-identity genes preserved and short housekeeping genes declining [38], so a general failure of long neuronal genes should not be inferred.
SLC13 and acetylation. SLC13 expression adds nothing beyond CNS status for splicing composition, and the prospectively specified long-gene test (Addendum F) was not supported. The acetylation-machinery score is no more ageing-like than expression-matched random gene sets once quality is adjusted. Machinery mRNA and transporter TPM are indirect proxies, so these results neither establish nor exclude every acetyl-CoA-based mechanism; testing one needs transport flux, nuclear acetyl-CoA, locus-specific acetylation, nascent RNA and splice products measured together, ideally with perturbation. The author’s competing interests in this area are declared below.
What would test these patterns. Version 2.4 is a first, small replication in four public cohorts (Section 3.17). Still needed: replication of a frozen set of junction–reference pairs and coverage endpoints in larger adult cohorts with recorded quality and terminal variables, ideally with living-donor and post-mortem samples of the same tissue; cell-type pseudobulk or sorted-cell data for the brain signature, with nuclear and whole-cell compartments matched; nascent-RNA and pulse-chase measurements to separate synthesis, splicing and decay; and sequence-confirmed targeted long-read and junction-specific assays of PALM, CIRBP, H2AFY and SR poison-exon events against length-matched controls.
Limitations.
- RIN, ischaemic time and cause of death are not adjusted for in the primary analysis, by design; brain donors give a cleaner but much smaller body sample, and they differ from other donors in more than ventilation. Recovery centre, sequencing batch and pathology variables were not modelled.
- Brain regions share donors. The cross-tissue tests and the split test use donor-clustered variance; the version 2.1 tissue-level tests, the SLC13 F3 pooling and the cluster bootstrap intervals do not account for donors, and a donor-level bootstrap of the full selection and modelling was not run.
- Score tests and one-step coefficients computed at the null are screening approximations; fully fitted overdispersed models for representative pairs were not compared.
- Unconditional age shuffles do not preserve age’s association with Hardy status, RIN or procurement, and their small number limits the empirical p-values they can give.
- recount3 counts come from a different alignment from the GTEx file; on identical junction–reference pairs the two agree closely (Section 3.5) but not exactly.
- The structural frame-disruption flag uses the principal transcript without reconstructing the altered sequence; GC content is controlled in version 2.4, but mappability only through the uniquely mapped fraction of junction reads; the qSVA-type degradation components come from a brain experiment and also carry age.
- Age is known only in 10-year bands; GTEx is cross-sectional and post-mortem, with 5–9 donors per decade under 40 in most brain regions.
- APPRIS principal status is a functional annotation, not a measure of abundance in a given tissue.
- The pipeline has been run on one machine, a clean-machine rerun has not been done, and the analysis is exploratory. The replication cohorts are small (56–192 donors), cover four tissues, and differ from GTEx in disease, culture and handling as well as in the circumstances of death.
5. Conclusions
Two conclusions lead. Age-associated splicing differs between brain and body, including within the same donors. In brain, many testable alternative junctions decrease relative to selected principal references with age; on the same junctions in the same donors, brain effects are two to three times as variable as body effects and correlate only weakly with them; frame-preserving forms gain in brain where frame-disrupting forms gain in body; and gene span, through intron length, is negatively associated with an exonic-to-intronic coverage contrast in brain whatever the donor set. In an independent post-mortem brain cohort the GTEx brain junction directions and the long-gene association replicate. Age-associated junction-use patterns in GTEx body tissues are strongly sensitive to donor selection and procurement-related covariates: restricting body analyses to donors contributing brain tissue sharply reduces significant principal-relative associations, and about half of the pooled body-tissue association runs between Hardy categories; in independent blood, liver and fibroblast cohorts from living donors these associations do not replicate. These findings identify reproducible patterns within the analysed outputs but do not isolate ventilation, establish splicing failure or determine whether the brain ages faster or slower than the body. SLC13 expression and acetylation-machinery scores do not provide specific support for the proposed metabolic mechanisms.
- How many junctions change with age in a tissue mostly reflects sample size; which way they change is a better basis for comparing tissues, but it is itself sensitive to the donors’ age mix and to donor selection.
- In GTEx, most young donors died on a ventilator and brain donors almost never did. Body-tissue age associations fall far more under brain-donor restriction than fewer donors or a matched age mix explain; Section 3.2 describes how far Hardy-scale adjustment and non-ventilator donor sets reproduce this. In independent blood, liver and fibroblast cohorts from living donors, GTEx body-tissue junction associations do not replicate (Section 3.17).
- In the brain, testable alternatives decrease relative to the principal with age about twice as often as they increase, and unannotated alternatives more often still. In an independent post-mortem brain cohort, GTEx-significant brain pairs keep their direction (88% in prefrontal cortex), though the cohort’s own few discoveries lean older; the aggregate share of unannotated splicing rises with age in every brain region (Section 3.17 and Section 3.18).
- In body tissues, alternative splice sites that gain on the principal with age are more often frame-shifting within the coding sequence, with all donors and, nominally, with brain donors; in brain, frame-preserving exon skips gain and frame-disrupting ones lose. These are exploratory structural results, not measurements of decay.
- Gene span, through intron length, is negatively associated with the age slope of the exonic-to-intronic coverage contrast in 12 of 13 brain regions; the cause — processing, stability, transcription or measurement — cannot be determined from bulk coverage. The association replicates in an independent prefrontal cortex cohort and is not explained by GC content, but it weakens with degradation covariates.
- On the same junctions in the same donors, the brain’s age effects are two to three times as variable as the body’s. The brain’s splicing changes differently; these data cannot say whether it ages faster or slower.
- SLC13 transporter expression adds nothing beyond CNS status, the prospectively specified SLC13 long-gene test was not supported, and the acetylation-machinery score is no more ageing-like than matched random gene sets.
- Inherited all-donor leads — decay-targeted SR-gene splicing, the H2AFY shift towards macroH2A1.1 — and brain genes such as PALM and CIRBP remain candidates for validation.
Change Log
Version 2.4 (30 October 2026, review items that needed further downloads).
| Area | Change |
| Replication | Four independent recount3 cohorts (post-mortem brain in three regions; whole blood, liver and dermal fibroblasts from living donors); GTEx-significant pairs retested with the same reference; long-gene coverage repeated (Section 2.15 and Section 3.17) |
| Junction evidence | Splice motifs and uniquely mapped read fractions for every tested junction; older/younger counts restricted to well-supported junctions (Section 3.18) |
| Aggregate burden | Per-sample burden over all junction reads by class, from all and from uniquely mapped reads, with and without Hardy categories; the bridge to aggregate mis-splicing (Section 3.18 and Section 4) |
| Coverage | Exonic and intronic GC content; qSVA-type degradation components (Section 3.7) |
| Gene TPM | Float32 rerun with 43 previously excluded genes; their description corrected (Section 2.13) |
| Text | Abstract, discussion, limitations and conclusions updated; data availability; references 44–47 |
Version 2.3 (29 October 2026, after academic review of version 2.2).
| Area | Change |
| Language | Causal wording about ventilation removed; donor selection and procurement described as the sensitivity; reviewer’s central claim adopted; older/younger defined as increased/decreased relative use; exon–intron result stated as an association |
| Donor sets | Fixed-reference reruns with slopes: Hardy-adjusted, ventilator-only, non-ventilator, brain donors, two more random and age-matched draws; quality by age and Hardy category (Section 3.2, Figure 7) |
| Principal-relative tests | Direct-site restriction; GTEx–recount3 concordance on identical pairs; permutation wording corrected (Section 3.5) |
| Reading frame | Three measures separated; alternative-site CDS frame analysis; unique-junction sensitivity; odds ratios with intervals; strand-aware flag; brain result decomposed (Section 2.12 and Section 3.6) |
| Coverage | Combined quality and composition, Hardy, pseudocount, depth, fixed-gene-set and length analyses; 9/13 corrected to 10/13 (Section 2.13 and Section 3.7) |
| Brain–body | Inclusion filter stated, four filters with intervals, 0.93 relabelled (Section 3.8) |
| Clocks | Screen inside folds, renamed variants, permuted ages, training-fold baseline, R2 and age-band errors (Section 3.8) |
| SLC13 | F3 dependence, co-primary scope and unanalysed exploratory genes stated (Section 3.10) |
| Inherited results | SR, H2AFY, exon skipping and timing labelled as all-donor results not rerun in brain donors |
| Back matter | Competing interests, licences, data packages, references 38–43 |
Version 2.2 (29 October 2026). Brain-donor, random and age-matched donor sets and the ventilator confound; principal-relative and cross-tissue tests with NMD annotation and age shuffles; recount3 junctions for all 49 tissues with frame flags and decade tables; exon–intron coverage and gene length; brain–body split test, effect sizes and clocks; SLC13 Addendum F (not supported).
Funding
This work was funded by the author.
Data Availability Statement
All inputs are open access: GTEx v8 junction counts, gene TPM and annotations from the GTEx Portal; recount3 GTEx junction counts and coverage files from the recount3 open-data bucket; and GENCODE v26 from the GENCODE FTP site. No controlled-access data were used. The paper, all analysis code, derived results, the timestamped analysis plan, the analysis log, an ordered workflow (WORKFLOW_followup.md) and a checksum manifest are in two packages: the version 2.1 record and the follow-up package for versions 2.2–2.4. Both are to be deposited on Zenodo; the accession numbers will be added to this section when assigned. The large GTEx-derived count matrices and per-sample coverage arrays are not included; they are rebuilt from the public inputs by the scripts listed in the workflow. Version 2.4 also used recount3 SRA junction counts, coverage files and metadata for projects SRP073813, SRP144355, SRP136102 and SRP174668 (same bucket), recount3 GTEx uniquely mapped junction counts, the GENCODE v26 GRCh38 primary-assembly genome, GTEx v8 transcript TPM and the qsvaR degradation transcript list [47]. All are open access and were streamed rather than stored. Licences. Paper, results and documentation: CC BY 4.0. Code: MIT.
Acknowledgments
The Genotype-Tissue Expression (GTEx) Project was supported by the Common Fund of the Office of the Director of the National Institutes of Health, and by NCI, NHGRI, NHLBI, NIDA, NIMH and NINDS. The data used for the analyses described here were obtained from the GTEx Portal and from recount3. Analyses, code and drafting were carried out with the assistance of an AI system (Claude, Anthropic) under the author’s direction; the author is responsible for the content.
Conflicts of Interest
The author owns Biohacking Team to Improve Everyone’s Health Ltd. and John Hemming Trading Ltd. The former company sells Cytravo, a mixture of citrate salts. The latter company holds patents in connection with the issues discussed here. The author also has a hypothesis that acetylation drives ageing through changes to gene expression; the acetylation and SLC13 citrate-transport analyses in this paper test hypotheses of this kind, and neither was supported by these data.
References
- Hemming, J. Which genes’ splicing changes with age? A genome-wide analysis of 2.8 million junction tests in GTEx v8 Draft Unpublished manuscript. 2026. [Google Scholar] [CrossRef] [PubMed]
- Ferreira, P.G.; Muñoz-Aguirre, M.; Reverter, F.; et al. The effects of death and post-mortem cold ischemia on human tissue transcriptomes. Nat. Commun. 2018, 9(1), 490. [Google Scholar] [CrossRef] [PubMed]
- Storey, J.D.; Tibshirani, R. Statistical significance for genomewide studies. Proc. Natl. Acad. Sci. USA 2003, 100(16), 9440–9445. [Google Scholar] [CrossRef] [PubMed]
- DerSimonian, R.; Laird, N. Meta-analysis in clinical trials. Control Clin. Trials 1986, 7(3), 177–188. [Google Scholar] [CrossRef] [PubMed]
- Iram, T.; Kern, F.; Kaur, A.; et al. Young CSF restores oligodendrogenesis and memory in aged mice via Fgf17. Nature 2022, 605(7910), 509–515. [Google Scholar] [CrossRef] [PubMed]
- Pajor, A.M. Molecular properties of the SLC13 family of dicarboxylate and sulfate transporters. Pflügers Arch. 2006, 451(5), 597–605. [Google Scholar] [CrossRef] [PubMed]
- Pajor, A.M. Sodium-coupled dicarboxylate and citrate transporters from the SLC13 family. Pflügers Arch. 2014, 466(1), 119–130. [Google Scholar] [CrossRef] [PubMed]
- Rogina, B. INDY — a new link to metabolic regulation in animals and humans. Front Genet 2017, 8, 66. [Google Scholar] [CrossRef] [PubMed]
- Mishra, D.; Kannan, K.; Meadows, K.; et al. INDY — from flies to worms, mice, rats, non-human primates, and humans. Front Aging 2021, 2, 782162. [Google Scholar] [CrossRef] [PubMed]
- Dewulf, J.P.; Wiame, E.; Dorboz, I.; et al. SLC13A3 variants cause acute reversible leukoencephalopathy and α-ketoglutarate accumulation. Ann. Neurol. 2019, 85(3), 385–395. [Google Scholar] [CrossRef] [PubMed]
- The GTEx Consortium. The GTEx Consortium atlas of genetic regulatory effects across human tissues. Science 2020, 369(6509), 1318–1330. [Google Scholar] [CrossRef] [PubMed]
- Tricoire, H.; Locatelli, A.; Chemineau, P.; Malpaux, B. Melatonin enters the cerebrospinal fluid through the pineal recess. Endocrinology 2002, 143(1), 84–90. [Google Scholar] [CrossRef] [PubMed]
- Skinner, D.C.; Malpaux, B. High melatonin concentrations in third ventricular cerebrospinal fluid are not due to Galen vein blood recirculating through the choroid plexus. Endocrinology 1999, 140(10), 4399–4405. [Google Scholar] [CrossRef] [PubMed]
- Leston, J.; Harthé, C.; Brun, J.; et al. Melatonin is released in the third ventricle in humans. A study in movement disorders. Neurosci. Lett. 2010, 469(3), 294–297. [Google Scholar] [CrossRef] [PubMed]
- Legros, C.; Chesneau, D.; Boutin, J.A.; Barc, C.; Malpaux, B. Melatonin from cerebrospinal fluid but not from blood reaches sheep cerebral tissues under physiological conditions. J. Neuroendocrinol. 2014, 26(3), 151–163. [Google Scholar] [CrossRef] [PubMed]
- Reiter, R.J.; Tan, D.X.; Kim, S.J.; Cruz, M.H. Delivery of pineal melatonin to the brain and SCN: role of canaliculi, cerebrospinal fluid, tanycytes and Virchow-Robin perivascular spaces. Brain Struct. Funct. 2014, 219(6), 1873–1887. [Google Scholar] [CrossRef] [PubMed]
- Liu, R.Y.; Zhou, J.N.; van Heerikhuize, J.; Hofman, M.A.; Swaab, D.F. Decreased melatonin levels in postmortem cerebrospinal fluid in relation to aging, Alzheimer’s disease, and apolipoprotein E-ε4/4 genotype. J. Clin. Endocrinol. Metab. 1999, 84(1), 323–327. [Google Scholar] [CrossRef] [PubMed]
- Langer, M.; Hartmann, J.; Turkof, H.; Waldhauser, F. Melatonin in the human — an overview [in German]. Wien. Klin. Wochenschr. 1997, 109(18), 707–713. [Google Scholar] [PubMed]
- Waldhauser, F.; Boepple, P.A.; Schemper, M.; Mansfield, M.J.; Crowley, W.F. Serum melatonin in central precocious puberty is lower than in age-matched prepubertal children. J. Clin. Endocrinol. Metab. 1991, 73(4), 793–796. [Google Scholar] [CrossRef] [PubMed]
- Schor, I.E.; Kornblihtt, A.R. Playing inside the genes: intragenic histone acetylation after membrane depolarization of neural cells opens a path for alternative splicing regulation. Commun. Integr. Biol. 2009, 2(4), 341–343. [Google Scholar] [CrossRef] [PubMed]
- Hnilicová, J.; Hozeifi, S.; Dušková, E.; et al. Histone deacetylase activity modulates alternative splicing. PLoS ONE 2011, 6(2), e16727. [Google Scholar] [CrossRef] [PubMed]
- Wellen, K.E.; Hatzivassiliou, G.; Sachdeva, U.M.; et al. ATP-citrate lyase links cellular metabolism to histone acetylation. Science 2009, 324(5930), 1076–1080. [Google Scholar] [CrossRef] [PubMed]
- Nativio, R.; Donahue, G.; Berson, A.; et al. Dysregulation of the epigenetic landscape of normal aging in Alzheimer’s disease. Nat. Neurosci. 2018, 21(4), 497–505. [Google Scholar] [CrossRef] [PubMed]
- Lareau, L.F.; Inada, M.; Green, R.E.; Wengrod, J.C.; Brenner, S.E. Unproductive splicing of SR genes associated with highly conserved and ultraconserved DNA elements. Nature 2007, 446(7138), 926–929. [Google Scholar] [CrossRef] [PubMed]
- Lo Re, O.; Vinciguerra, M. Histone macroH2A1: a chromatin point of intersection between fasting, senescence and cellular regeneration. Genes 2017, 8(12), 367. [Google Scholar] [CrossRef] [PubMed]
- Pazienza, V.; Borghesan, M.; Mazza, T.; et al. SIRT1-metabolite binding histone macroH2A1.1 protects hepatocytes against lipid accumulation. Aging 2014, 6(1), 35–47. [Google Scholar] [CrossRef] [PubMed]
- Mazin, P.; Xiong, J.; Liu, X.; et al. Widespread splicing changes in human brain development and aging. Mol. Syst. Biol. 2013, 9, 633. [Google Scholar] [CrossRef] [PubMed]
- García-Ruiz, S.; Zhang, D.; Gustavsson, E.K.; et al. Splicing accuracy varies across human introns, tissues, age and disease. Nat. Commun. 2025, 16(1), 1068. [Google Scholar] [CrossRef] [PubMed]
- Li, Y.I.; Knowles, D.A.; Humphrey, J.; et al. Annotation-free quantification of RNA splicing using LeafCutter. Nat. Genet 2018, 50(1), 151–158. [Google Scholar] [CrossRef] [PubMed]
- Rodriguez, J.M.; Pozo, F.; Cerdán-Vélez, D.; Di Domenico, T.; Vázquez, J.; Tress, M.L. APPRIS: selecting functionally important isoforms. Nucleic Acids Res. 2022, 50(D1), D54–D59. [Google Scholar] [CrossRef] [PubMed]
- Novikov, L.; Park, J.W.; Chen, H.; et al. QKI-mediated alternative splicing of the histone variant macroH2A1 regulates cancer cell proliferation. Mol. Cell Biol. 2011, 31(20), 4244–4255. [Google Scholar] [CrossRef] [PubMed]
- Lee, Y.H.; Hong, M.H.; Kim, J.W.; et al. Isolation of cDNA clones encoding human histone macroH2A1 subtypes. Biochim Biophys. Acta 1998, 1399(1), 73–77. [Google Scholar] [CrossRef] [PubMed]
- Fong, N.; Kim, H.; Zhou, Y.; et al. Pre-mRNA splicing is facilitated by an optimal RNA polymerase II elongation rate. Genes Dev. 2014, 28(23), 2663–2676. [Google Scholar] [CrossRef] [PubMed]
- Debès, C.; Papadakis, A.; Grönke, S.; et al. Ageing-associated changes in transcriptional elongation influence longevity. Nature 2023, 616(7958), 814–821. [Google Scholar] [CrossRef] [PubMed]
- Wilks, C.; Zheng, S.C.; Chen, F.Y.; et al. recount3: summaries and queries for large-scale RNA-seq expression and splicing. Genome Biol. 2021, 22(1), 323. [Google Scholar] [CrossRef] [PubMed]
- Gaidatzis, D.; Burger, L.; Florescu, M.; Stadler, M.B. Analysis of intronic and exonic reads in RNA-seq data characterizes transcriptional and post-transcriptional regulation. Nat. Biotechnol. 2015, 33(7), 722–729. [Google Scholar] [CrossRef] [PubMed]
- Nagy, E.; Maquat, L.E. A rule for termination-codon position within intron-containing genes: when nonsense affects RNA abundance. Trends Biochem Sci. 1998, 23(6), 198–199. [Google Scholar] [CrossRef] [PubMed]
- Jeffries, A.M.; Yu, T.; Ziegenfuss, J.S.; et al. Single-cell transcriptomic and genomic changes in the ageing human brain. Nature 2025, 646(8085), 657–666. [Google Scholar] [CrossRef] [PubMed]
- Gallego Romero, I.; Pai, A.A.; Tung, J.; Gilad, Y. RNA-seq: impact of RNA degradation on transcript quantification. BMC Biol. 2014, 12, 42. [Google Scholar] [CrossRef] [PubMed]
- Jaffe, A.E.; Tao, R.; Norris, A.L.; et al. qSVA framework for RNA quality correction in differential expression analysis. Proc. Natl. Acad. Sci. USA 2017, 114(27), 7130–7135. [Google Scholar] [CrossRef] [PubMed]
- Mandelboum, S.; Manber, Z.; Elroy-Stein, O.; Elkon, R. Recurrent functional misinterpretation of RNA-seq data caused by sample-specific gene length bias. PLoS Biol. 2019, 17(11), e3000481. [Google Scholar] [CrossRef] [PubMed]
- Thermann, R.; Neu-Yilik, G.; Deters, A.; et al. Binary specification of nonsense codons by splicing and cytoplasmic translation. EMBO J. 1998, 17(12), 3484–3494. [Google Scholar] [CrossRef] [PubMed]
- Carithers, L.J.; Ardlie, K.; Barcus, M.; et al. A novel approach to high-quality postmortem tissue procurement: the GTEx project. Biopreserv Biobank 2015, 13(5), 311–319. [Google Scholar] [CrossRef] [PubMed]
- Ramaker, R.C.; Bowling, K.M.; Lasseigne, B.N.; et al. Post-mortem molecular profiling of three psychiatric disorders. Genome Med. 2017, 9(1), 72. [Google Scholar] [CrossRef] [PubMed]
- Fleischer, J.G.; Schulte, R.; Tsai, H.H.; et al. Predicting age from the transcriptome of human dermal fibroblasts. Genome Biol. 2018, 19(1), 221. [Google Scholar] [CrossRef] [PubMed]
- Gerhard, G.S.; Legendre, C.; Still, C.D.; Chu, X.; Petrick, A.; DiStefano, J.K. Transcriptomic profiling of obesity-related nonalcoholic steatohepatitis reveals a core set of fibrosis-specific genes. J. Endocr. Soc. 2018, 2(7), 710–726. [Google Scholar] [CrossRef] [PubMed]
- LieberInstitute. qsvaR: generate quality surrogate variable analysis for degradation correction (R package; transcript lists used: main model). GitHub repository.
Figure 1.
Older share of classified junctions per tissue (all donors, sex-only null models, 38 tissues with ≥ 100 classified junctions). Version 2.1 all-donor result; body tissues are subject to the donor-selection sensitivity of Section 3.2 and Figure 7.
Figure 1.
Older share of classified junctions per tissue (all donors, sex-only null models, 38 tissues with ≥ 100 classified junctions). Version 2.1 all-donor result; body tissues are subject to the donor-selection sensitivity of Section 3.2 and Figure 7.
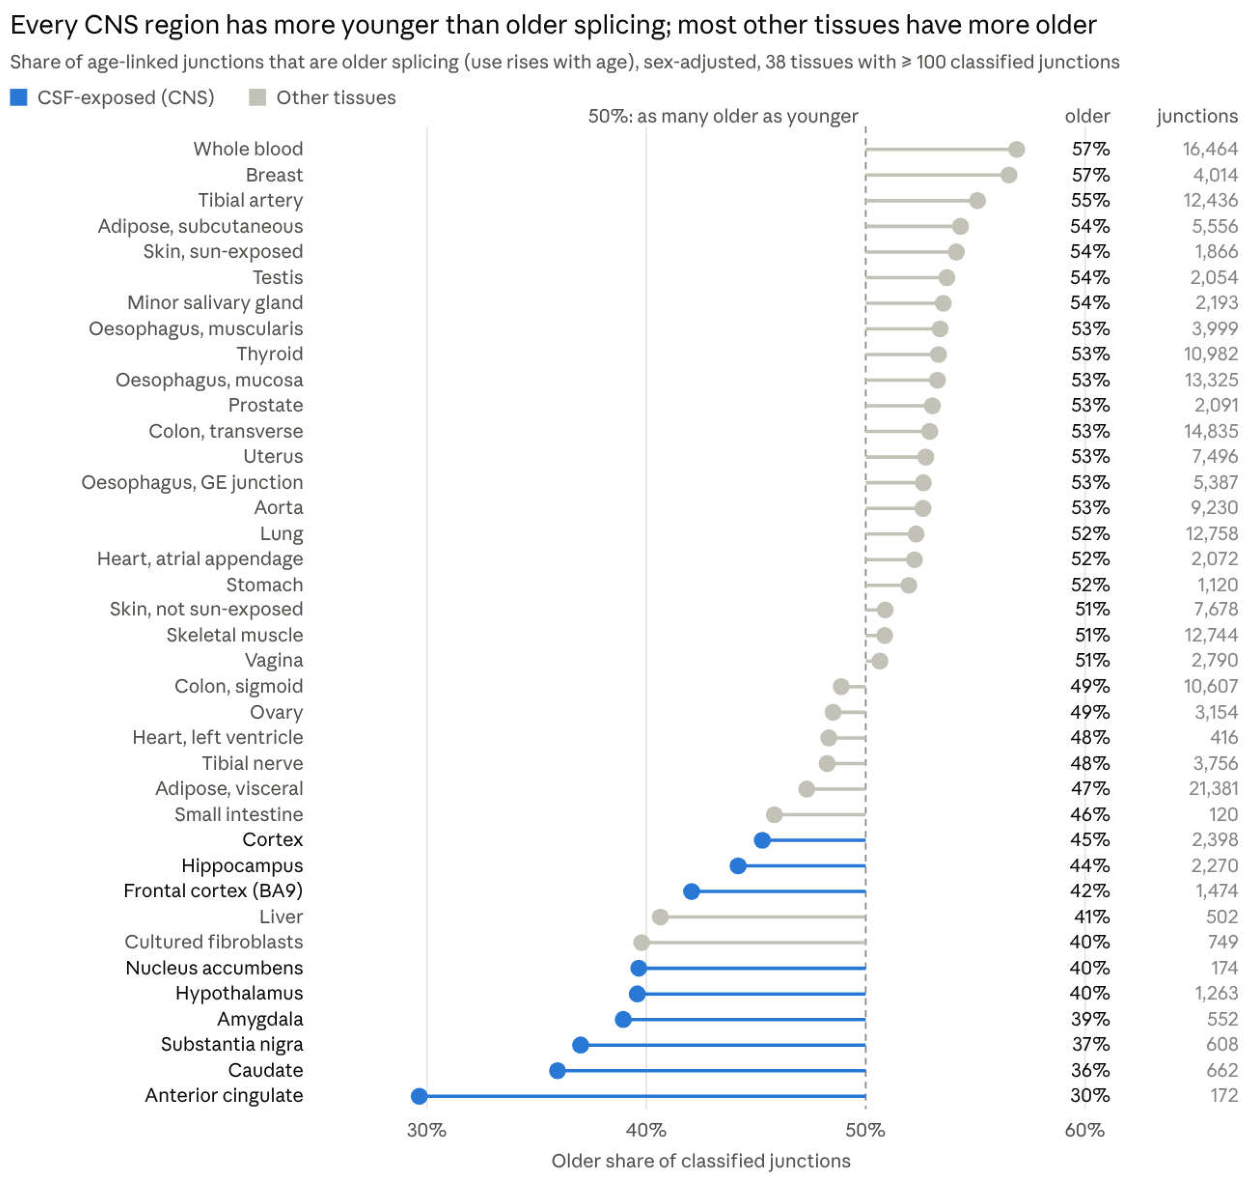
Figure 7.
Body-tissue principal-relative associations by donor set, on fixed junction–reference pairs. Left: classified pairs (older plus younger). Right: median absolute slope of the pairs significant with all donors, as a share of their all-donor slope. Grey: all donors and size or age-matched controls; blue: Hardy-adjusted, ventilation-stratified and brain-donor sets.
Figure 7.
Body-tissue principal-relative associations by donor set, on fixed junction–reference pairs. Left: classified pairs (older plus younger). Right: median absolute slope of the pairs significant with all donors, as a share of their all-donor slope. Grey: all donors and size or age-matched controls; blue: Hardy-adjusted, ventilation-stratified and brain-donor sets.
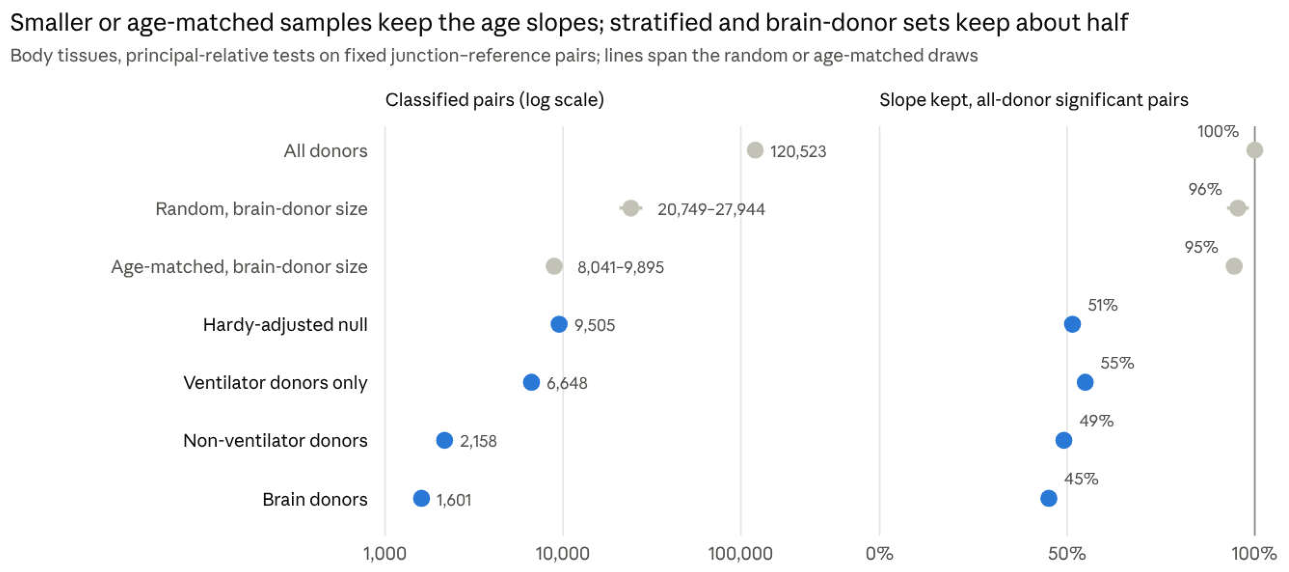
Figure 2.
Share of each tissue’s older (filled) and younger (open) junctions that lie in an APPRIS principal transcript (all donors, sex-only null models, 38 tissues). Version 2.1 all-donor result; see Section 3.2.
Figure 2.
Share of each tissue’s older (filled) and younger (open) junctions that lie in an APPRIS principal transcript (all donors, sex-only null models, 38 tissues). Version 2.1 all-donor result; see Section 3.2.
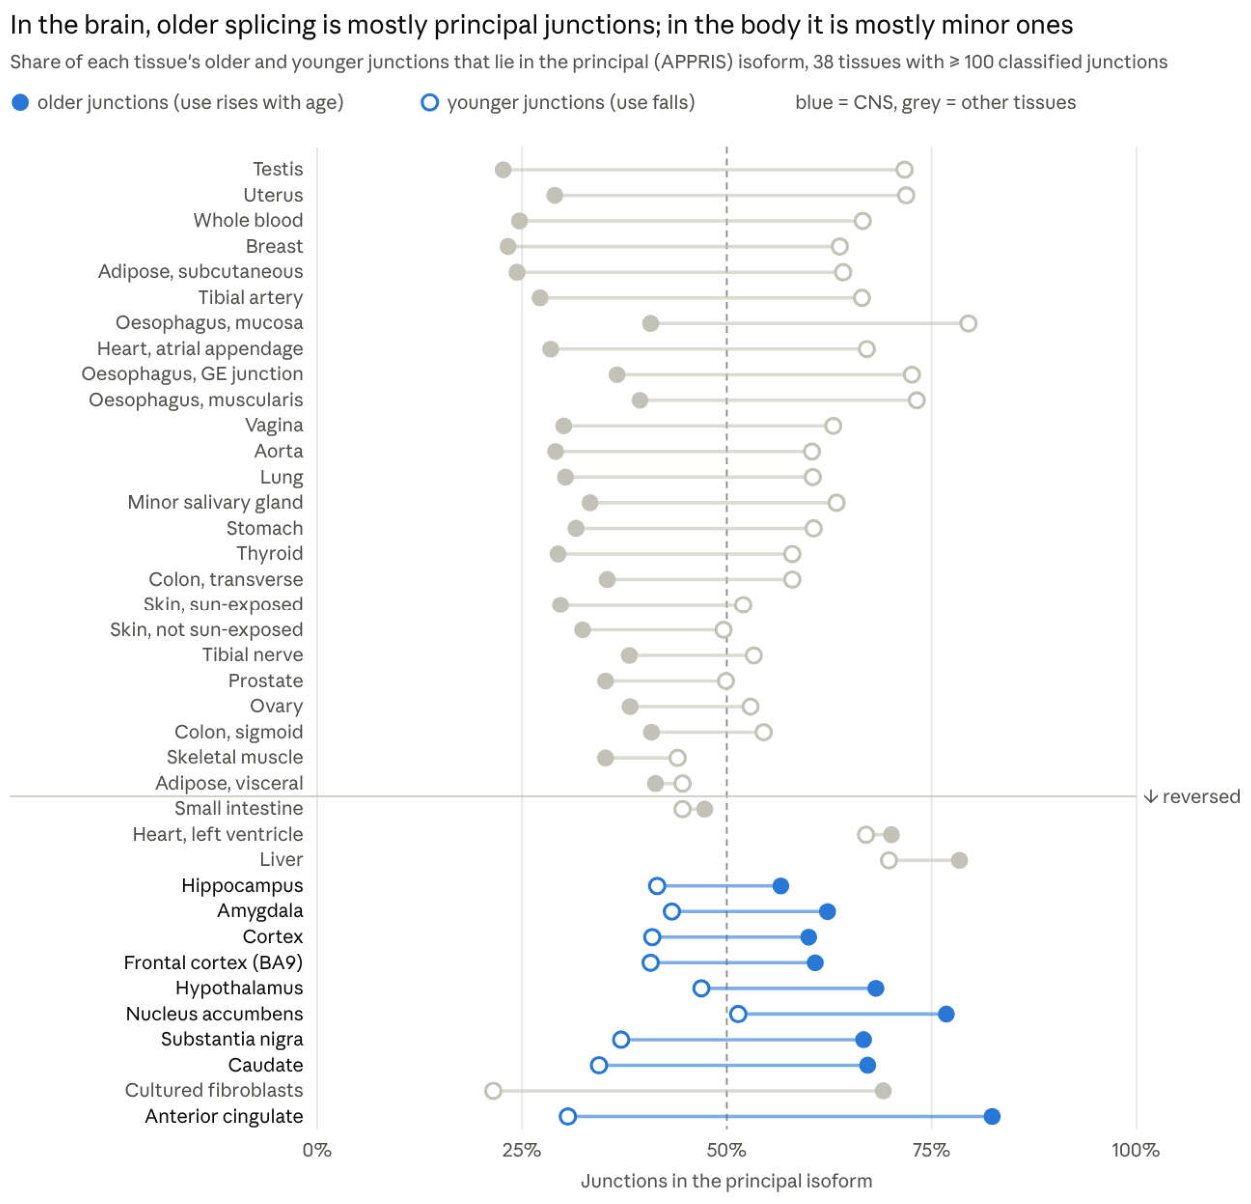
Figure 3.
Older share of classified junctions grouped by their mean share of the cluster’s reads (all donors, sex-only null models). Version 2.1 all-donor result; see Section 3.2.
Figure 3.
Older share of classified junctions grouped by their mean share of the cluster’s reads (all donors, sex-only null models). Version 2.1 all-donor result; see Section 3.2.
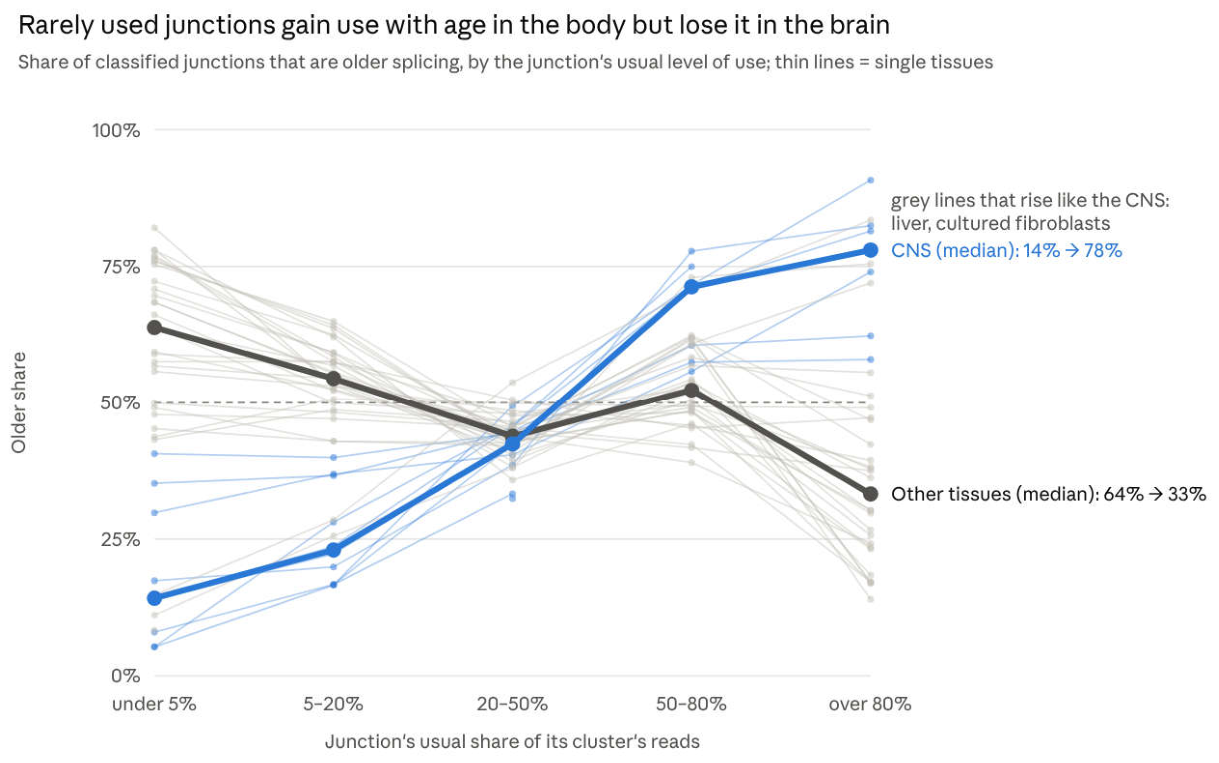
Figure 4.
Share of each tissue’s 20s-to-60s change in older versus younger junction usage completed by the 40s (all donors, sex-only null models; junctions classified and profiled in the same donors). Version 2.1 all-donor result; see Section 3.2.
Figure 4.
Share of each tissue’s 20s-to-60s change in older versus younger junction usage completed by the 40s (all donors, sex-only null models; junctions classified and profiled in the same donors). Version 2.1 all-donor result; see Section 3.2.
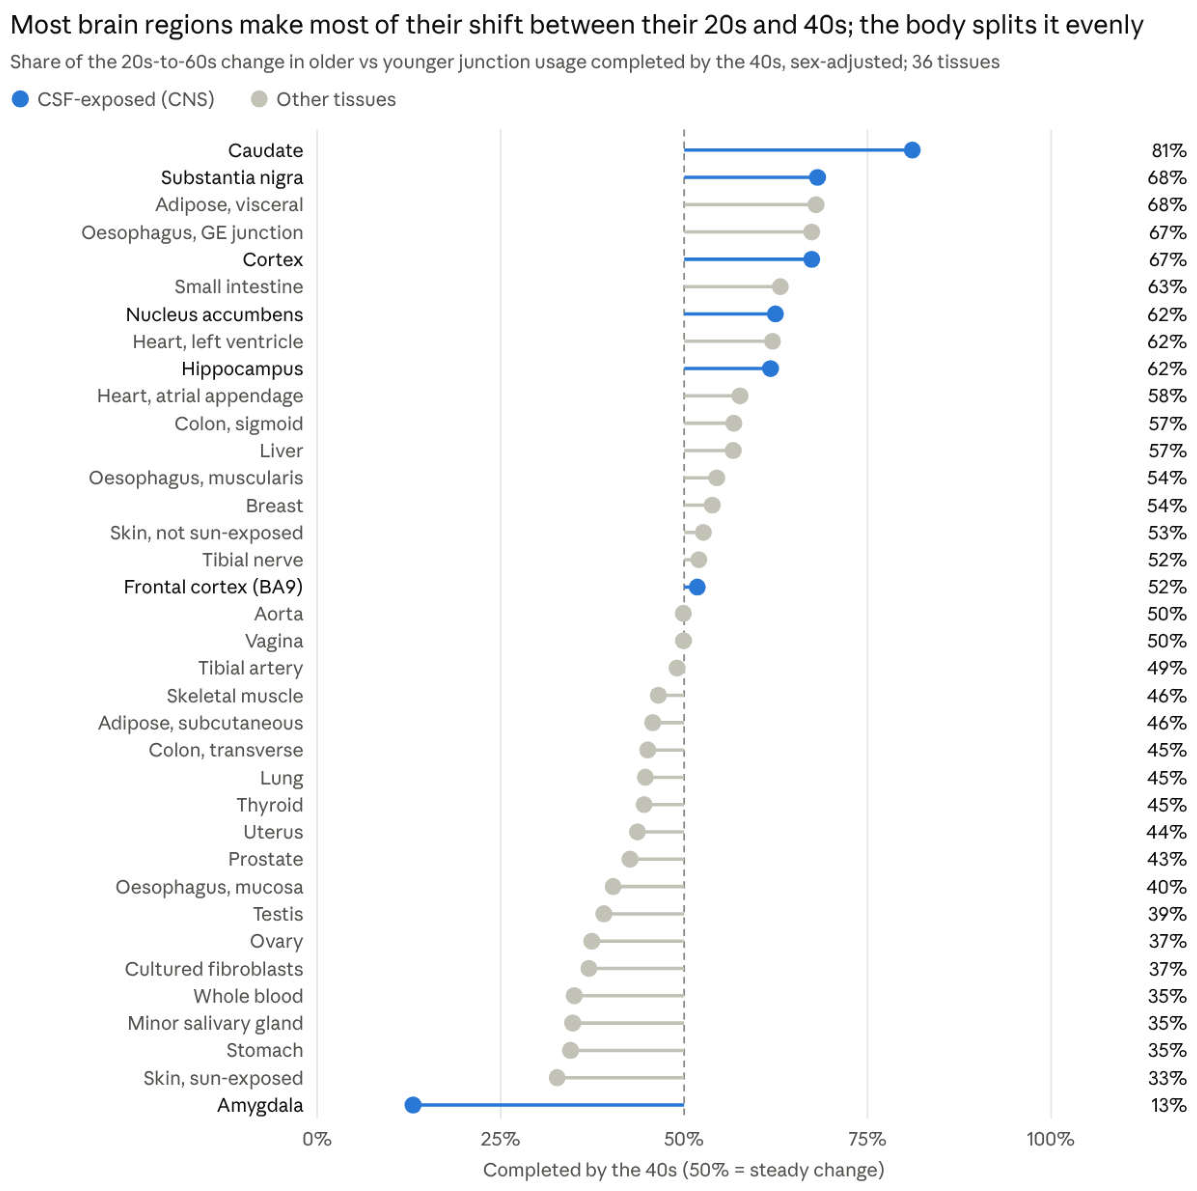
Figure 5.
Share of classified skipping junctions moved towards their older direction by a lower score: acetylation score against 100 expression-matched random gene sets (post hoc control).
Figure 5.
Share of classified skipping junctions moved towards their older direction by a lower score: acetylation score against 100 expression-matched random gene sets (post hoc control).
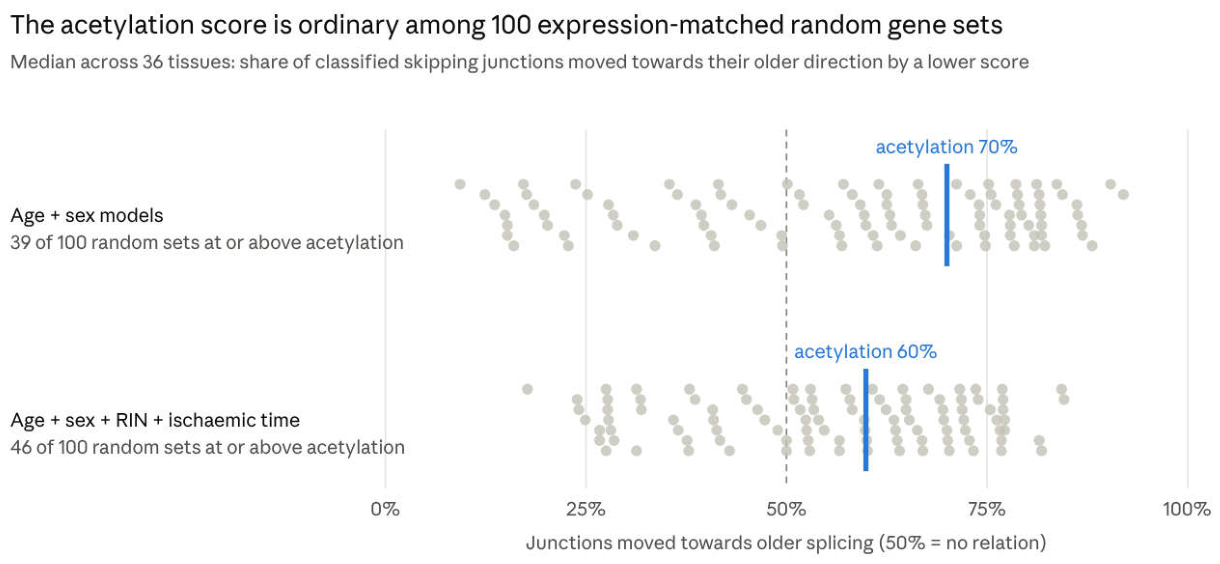
Disclaimer/Publisher’s Note: The statements, opinions and data contained in all publications are solely those of the individual author(s) and contributor(s) and not of MDPI and/or the editor(s). MDPI and/or the editor(s) disclaim responsibility for any injury to people or property resulting from any ideas, methods, instructions or products referred to in the content. |
© 2026 by the authors. Licensee MDPI, Basel, Switzerland. This article is an open access article distributed under the terms and conditions of the Creative Commons Attribution (CC BY) license (http://creativecommons.org/licenses/by/4.0/).
Copyright: This open access article is published under a Creative Commons CC BY 4.0 license, which permit the free download, distribution, and reuse, provided that the author and preprint are cited in any reuse.