

Submitted:
02 November 2026
Posted:
05 November 2026
You are already at the latest version
Abstract
Land degradation is a major constraint on agricultural productivity and livelihoods in the Sahel, where erosion, declining soil fertility, and climate variability threaten the sustainability of production systems. This study assesses the effects of land reclamation projects on soil quality at 50 resilience sites supported by the World Food Program in Burkina Faso, Mali, Niger, Senegal, and Chad. Soil samples were collected from treated and control plots at depths of 0–20 and 20–40 cm and then analyzed for their key physicochemical properties, organic matter, and organic carbon. Forty-three sites also provided usable agronomic, agroecological, and socio-organizational data. The results show a significant improvement in soil fertility in the managed plots, with increases in organic matter from 24.2% to 77%, total nitrogen from 15.7% to 52.9%, available phosphorus from 36.5% to 176%, and exchangeable potassium from 39% to 47%. The pH generally increases by 0.40 to 0.52 units, while bulk density decreases by 2.0 to 8.4%. The magnitude of the responses varies depending on soil texture and pedoclimatic conditions. These results confirm the role of water and soil conservation/soil defense and restoration structures as a lever for restoring the quality and fertility of Sahelian soils.
Keywords:
soil
; conservation
; restoration
; soil physicochemical properties
; Sahel
1. Introduction
Most Sahelian countries’ economy is based primarily on the exploitation of natural resources, particularly through agriculture, livestock raising, and the use of forest resources. However, natural resources are increasingly being depleted and threatened by processes of degradation. The severe droughts of 1972–1973 and 1984–1985 triggered land degradation processes, notably through increased water and wind erosion, declining soil fertility, and a reduction in vegetation cover [1,2,3]. Furthermore, population pressure which has increased the strain on natural resources, particularly through deforestation to expand cultivated land coupled with climate variability, has accelerated the nearly widespread decline of vegetation cover in the Sahel [4,5,6,7].
Several initiatives have already been undertaken in previous years to combat desertification [8,9,10,11]. It should be noted that most of these initiatives took place in the absence of an appropriate strategic and institutional framework to ensure overall coherence and local population up taking. The first initiatives in the area of water and soil conservation/Soil defense and restoration (WSC / SDR) began around the 1960s with interventions by the CTFT/ORSTOM, the European Development Fund (EDF), Swiss Cooperation, the NGO CARE International, CWS, German Cooperation, the FAO, USAID and the World Food Program (WFP) since 2017 [5,12]. Various techniques have been promoted due to their ease of implementation and adaptability, depending on whether the land is used for agriculture or sylvopastoral purposes. Mechanical structures (half-moons, stone lines, small dikes (Bund), and water-spreading weir), biological structures (Zaï, mulching, Farmer Managed Natural Regeneration), mixed structures, and the application of organic manure as WSC / SDR techniques have been used individually or in combination as techniques for restoring and/or maintaining the physical and chemical properties of the soil [13]. Since 2017, new models and variants of half-moons have been proposed by the local partners responsible for their implementation. Among these variants, the so-called “multifunctional” half-moon predominates, although scientific knowledge of it remains very limited at this time. It is undeniable that the proper functioning of these structures, as well as their durability, are closely linked to the application of technical standards while taking into account the characteristics of the geomorphological environment and the soil type. Adapting practices to soil types ensures better soil recovery and is one of the key factors for the success of sustainable land management (SLM) practices. Therefore, it is good to know what is the effect of those promoted structures in the Sahelian’s countries by WFP and their partners and we hypotheses that communal scale land restoration technologies implementation sustainably improves soil physicochemical properties While previous studies developed effective technologies on WSC / SDR, its large-scale implementation efficiency remains unknown. To address this gap, this study aimed to investigate the communal scale land restoration technologies implementation effects on soil physicochemical properties within the five Sahelian countries supported by the by the WFP.
2. Materials and Methods
2.1. Overview of the Study Area
The baseline study was conducted at a total of fifty (50) sites (list in the appendix) spread across the five Sahel Universities Network for Resilience (REUNIR) countries (Niger: 15 sites; Burkina Faso: 10 sites; Chad: 10 sites; Mali: 8 sites; and Senegal: 7 sites). These sites were selected by the country offices and the WFP’s RAM team. Figure 1 shows the location of these sites within the Sahel region. The study areas belong mainly to the Sahel–Sahara belt, characterized by an arid to semi-arid tropical climate, a long dry season and mean annual rainfall ranging approximately from 200 to 850 mm. Mean annual temperatures range from 28 to 30 °C. Landscapes include gen-tly sloping peneplains, valleys, plateaus and hilly areas. The soils described include raw mineral soils, weakly developed erosion soils, leached ferruginous soils and hydromorphic soils in low-lands and valleys. Vegetation is dominated by shrub and tree formations, with stands associated with watercourses and developed areas
2.2. Experimental Design and Soil Sampling Methods
Soil sampling was conducted at fifty (50) sites, each comprising a plot that had undergone WSC/SDR improvements and an untreated control plot. This design allowed for a comparison of the physicochemical characteristics of the soils between the treated plots and the control plots. Most of the plots were located on the middle and lower slopes of glacis. The previous crops consisted mainly of the most widely grown crops in the area. Soil samples were collected prior to planting for the 2025–2026 growing season. At each of the five sampling points, two depths were considered: 0–20 cm, corresponding to the surface horizon, and 20–40 cm, corresponding to the underlying horizon. For each depth, the five individual samples from the same plot were carefully homogenized to form a composite sample representative of the horizon in question. Thus, at each site, sampling was conducted along a diagonal path across the plot. Two to three soil samples were collected at depths of 0–20 cm and 20–40 cm, respectively, to determine the soil’s main chemical characteristics. On each of the two plots, five (5) sampling profiles were selected to ensure a representative sample of the plot. The sampling points were distributed evenly, with four points located toward the edges of the plot and one point in the center, to account for spatial variability in the soil. For each site, a composite sample was prepared from 5 to 9 sampling points taken at the center of the plot as well as at points located along the diagonals in both the lengthwise and widthwise directions. If the plot is non-homogeneous, it must be divided according to the presence of heterogeneity and the same procedure followed. For plots with zaï, samples were taken from within the zaï holes (pit) and between them, and then mixed to obtain composite samples. In total, the sampling yielded 100 composite samples from the treated plots (50 sites × 2 horizons) and 100 composite samples from the control plots (50 sites × 2 horizons), for a total of 200 composite samples across all fifty sites. The composite samples were then packaged in a collection bag made of paper and clearly label it with the site, plot number or farmer’s name, date, depth, and GPS coordinates and then transported to the lab.
2.3. Laboratory Analyses
Soil samples were air-dried at room temperature, and then gently crushed and passed through 2-mm sieve for physicochemical analyses immediately after collection. Pieces for organic carbon and total nitrogen analyses were then homogenized to keep analytical homogeneity.
Physical: texture, bulk density, moisture content, etc.
The collected samples were analyzed at the National Bureau of Soils [14] laboratory using the particle size analysis method and the hydrometric method. The particle size analysis aimed to determine clays (Ø ˂ 2 µ), silts (2 µ ˂ Ø ˂ 50 µ), and sands (Ø ˃ 50 µ). The textural diagram (textural triangle) (Figure 2), was used to interpret the analysis results [14,15].
Chemical parameters: MO, N, P, K, pH, CEC
- Analytical methods for each parameter
The soil samples collected were air-dried in the shade before being sieved to 2 mm to obtain the fine fraction. The analyses included water pH and KCl pH total carbon ([16]), total nitrogen ([17]), total phosphorus and total potassium ([18]), and available phosphorus using the Bray I method (Bray and Kurtz). As for available potassium, it was extracted using the ammonium acetate method.
Determination of Carbon Stock
Soil carbon stock was determined using the method described by ([19]). To this end, soil cores collected using a cylinder of known volume were dried in an oven at 105 °C for 24 hours, followed by the determination of bulk density using formula (I)
- where ρ = bulk density (in g·cm⁻³),
M = mass of the oven-dried soil sample (in g), and
V = its volume in cm³.
The carbon stock is calculated by multiplying the carbon concentration (%) of the fine soil fraction (particles with a diameter < 2 mm) by the bulk density (ρ), the depth of the soil sample (D), and the proportion of the fine soil fraction (as follows:
The carbon stock over the 0–20 cm depth was expressed in t ha⁻¹ by converting grams (g) to metric tons (t) and cm⁻² to ha⁻¹; this amounts to multiplying Equation (1) by 100.
The coarse fraction (frag) was obtained by sieving the soil samples used to determine bulk density through a 2-mm sieve. The residue with particle sizes greater than or equal to 2 mm, which constituted the coarse fraction, was then weighed. The weight of the fine fraction was calculated from that of the coarse fraction using the formula: fine fraction = (1 - frag).
The coarse material content (CM) was calculated by dividing the weight of the coarse fraction by the weight of the soil core dried in an oven at 105 °C.
CoF (%) = frag / Soil core weight * 100
(Soil texture (three-fraction particle size distribution), organic carbon and organic matter, bulk density, soil pH, total major nutrients (N, P, K), cation exchange capacity (CEC), total carbon, total nitrogen)
2.4. Data Processing and Analysis
The collected data were entered into an Excel spreadsheet. Excel was used to calculate the mean, frequency, and standard deviation, and to create tables. Data analysis was performed using the R version 4.6.0 software. The variables studied were subjected to one-way and two-way analysis of variance (ANOVA) to assess the existence of significant differences between treatments with a significance level set at 5% (P < 0.05). The dataset was screened for missing values, inconsistencies and extreme observations prior to analysis. We excluded one outlying sample from the analyses, which had undue influence on the multi-variate structure of the dataset.
We evaluated differences in soil physicochemical properties of managed compared to control sites with linear models using management category as the primary predictor variable and country as a fixed effect included in the model to account for geographical variation. The following model was fitted for each soil property:
where Y is the soil physicochemical variable, Management indicates managed and control sites, Country accounts for country-specific differences in response to fertilization and, the residual error term. The emmeans package was used to estimate adjusted margin-al means and perform pairwise comparison.
Y_ij=β_0+β_1 〖”Management”〗_i+β_2 〖”Country”〗_j+ε_ij
For the multivariate structure of soil physicochemical variables measured at both time-points, Principal Component Analysis (PCA) with standardized variables (mean = 0; standard deviation = 1) were performed. We standardized the data so that every component had an identical influence in the ordination irrespective of measurement unit. The first principal components were interpreted based on the eigenvalues and variable loadings.
Afterwards, hierarchical clustering on principal components (HCPC) was performed to cluster different soils with similar physicochemical properties. Ward’s minimum variance method was used for clustering on the PCA coordinates, with subsequent k-means consolidation to improve cluster stability. Afterwards, clustering was performed on specific physicochemical properties which were then used to characterize the clusters by their respective mean physiochemical characteristics.
Lastly, Pearson’s chi-square test (x2) was performed based on the contingency table of countries and HCPC clusters to evaluate the association between soil clusters and coun-tries. P < 0.05 was considered statistically significant.
3. Results
3.1. Soil Physicochemical Properties
Of the 50 WFP resilience sites studied in five Sahel countries (Mali, Burkina Faso, Ni-ger, Chad, and Senegal), the analysis reveals significant heterogeneity in topography, cli-mate, and production systems. Ultimately, 43 sites provided usable data that can be in-cluded in the study. The final data set consisted of 218 soil samples (135 managed + other, and 83 controls). Country sampled Distribution of mirror boards (Table 1) varied across countries along a scale for both the spatial extent and accessibility of restoration activities. Niger submitted the highest number of samples (n = 95), with Burkina Faso (n = 48), Mali (n = 31), Senegal (n = 28) and Chad (n = 16) following behind (Figure 3).
Soil pH varied from 3.43 to 8.65, with an overall mean of 5.82 ± 1.03, demonstrating considerable variation in soil acidity across the sampling sites. Average contents of organic carbon and organic matter were 0.53 ± 0.24% (mean ± s.d.) and 0.91 ± 0.40%, respectively, while total nitrogen content averaged only at low levels of 0.065 ± 0.047%. Available phosphorus varied widely (0.32–492 mg/kg) with an average of 63.9 ± 96.5 mg/kg, while available potassium averaged 23.1 ± 42.0 mg/kg. For cation exchange capacity (CEC) which ranges from 1.6 to 10.8 cmol (+) kg⁻¹, the mean is measured at (10.8 ± 7.2 cmol (+) kg⁻¹).
Sand was the most abundant soil textural fraction (68.9% ± 20.6%), followed by clay (17.4% ± 14.3%) and silt (13.7% ± 12.8%). Bulk density varied from 1.03 to 1.75 g cm⁻³, averaging 1.41±0.14 g cm⁻³ overall and indicative of soil structural differences between the sites sampled in this study.
3.2. Topography
Nearly half of the sites are located in plains, which account for 19 sites, or 44.2% of the observations, followed by those located in plateaus, with 6 sites (14.0%), and valleys, with 5 sites (11.6%). The remaining configurations consist of combinations of plains, valleys, plateaus, and hills. Hills alone accounted for only 2.3% of the studied sites. Observations show that 20 sites (46.5%) have gentle sloping terrain, while 10 sites (23.3%) are characterized by flat terrain and 4 sites (9.3%) by steep slopes. The remaining sites feature combinations of gentle slopes, steep slopes, and flat terrain.
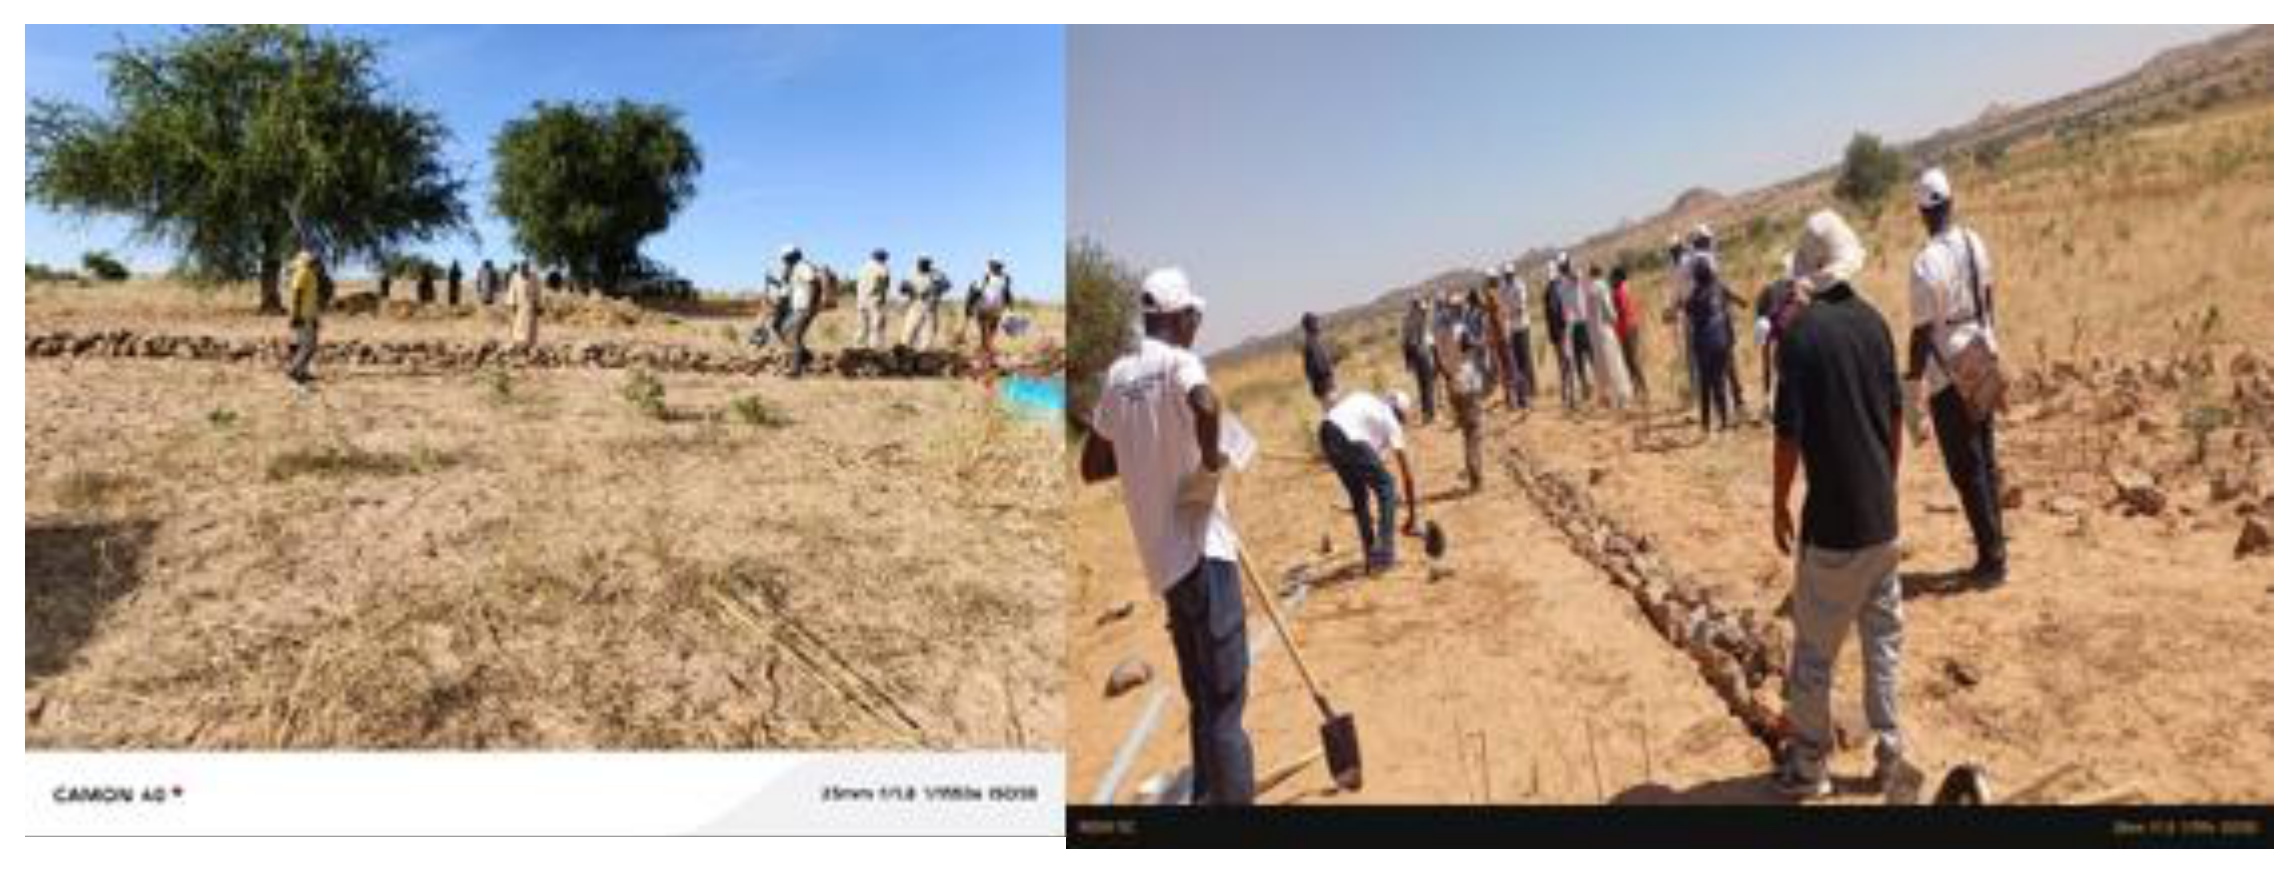
Figure 4.
Installation of water and soil conservation structures for the rehabilitation of degraded land in a moderately sloped area, Tandou Valley, Ouaddaï Province, Chad.
Figure 4.
Installation of water and soil conservation structures for the rehabilitation of degraded land in a moderately sloped area, Tandou Valley, Ouaddaï Province, Chad.
3.3. Climate Period and Production Season
The data collected show that land restoration and rehabilitation activities take place during both the dry and rainy seasons. Thus, 21 sites (48.8%) operate during both the dry and rainy seasons. Seventeen sites (39.5%) carry out production activities exclusively during the dry season, while five sites (11.6%) produce only during the rainy season. This ability to produce during both seasons reflects the importance of vegetable farming and water availability in the agricultural systems studied. Furthermore, the duration of the rainy season varies from 3 to 6 months depending on the site.
3.4. Agricultural Production Systems
The agricultural production systems observed at the study sites are primarily characterized by a combination of market gardening and rain-fed farming, which was identified at 22 sites (51.2%). Rain-fed farming alone is practiced at 14 sites (32.6%), while forage production alone is practiced at 4 sites (9.3%). Finally, three (03) sites (7.0%) combined vegetable farming, rain-fed farming, and forage production.
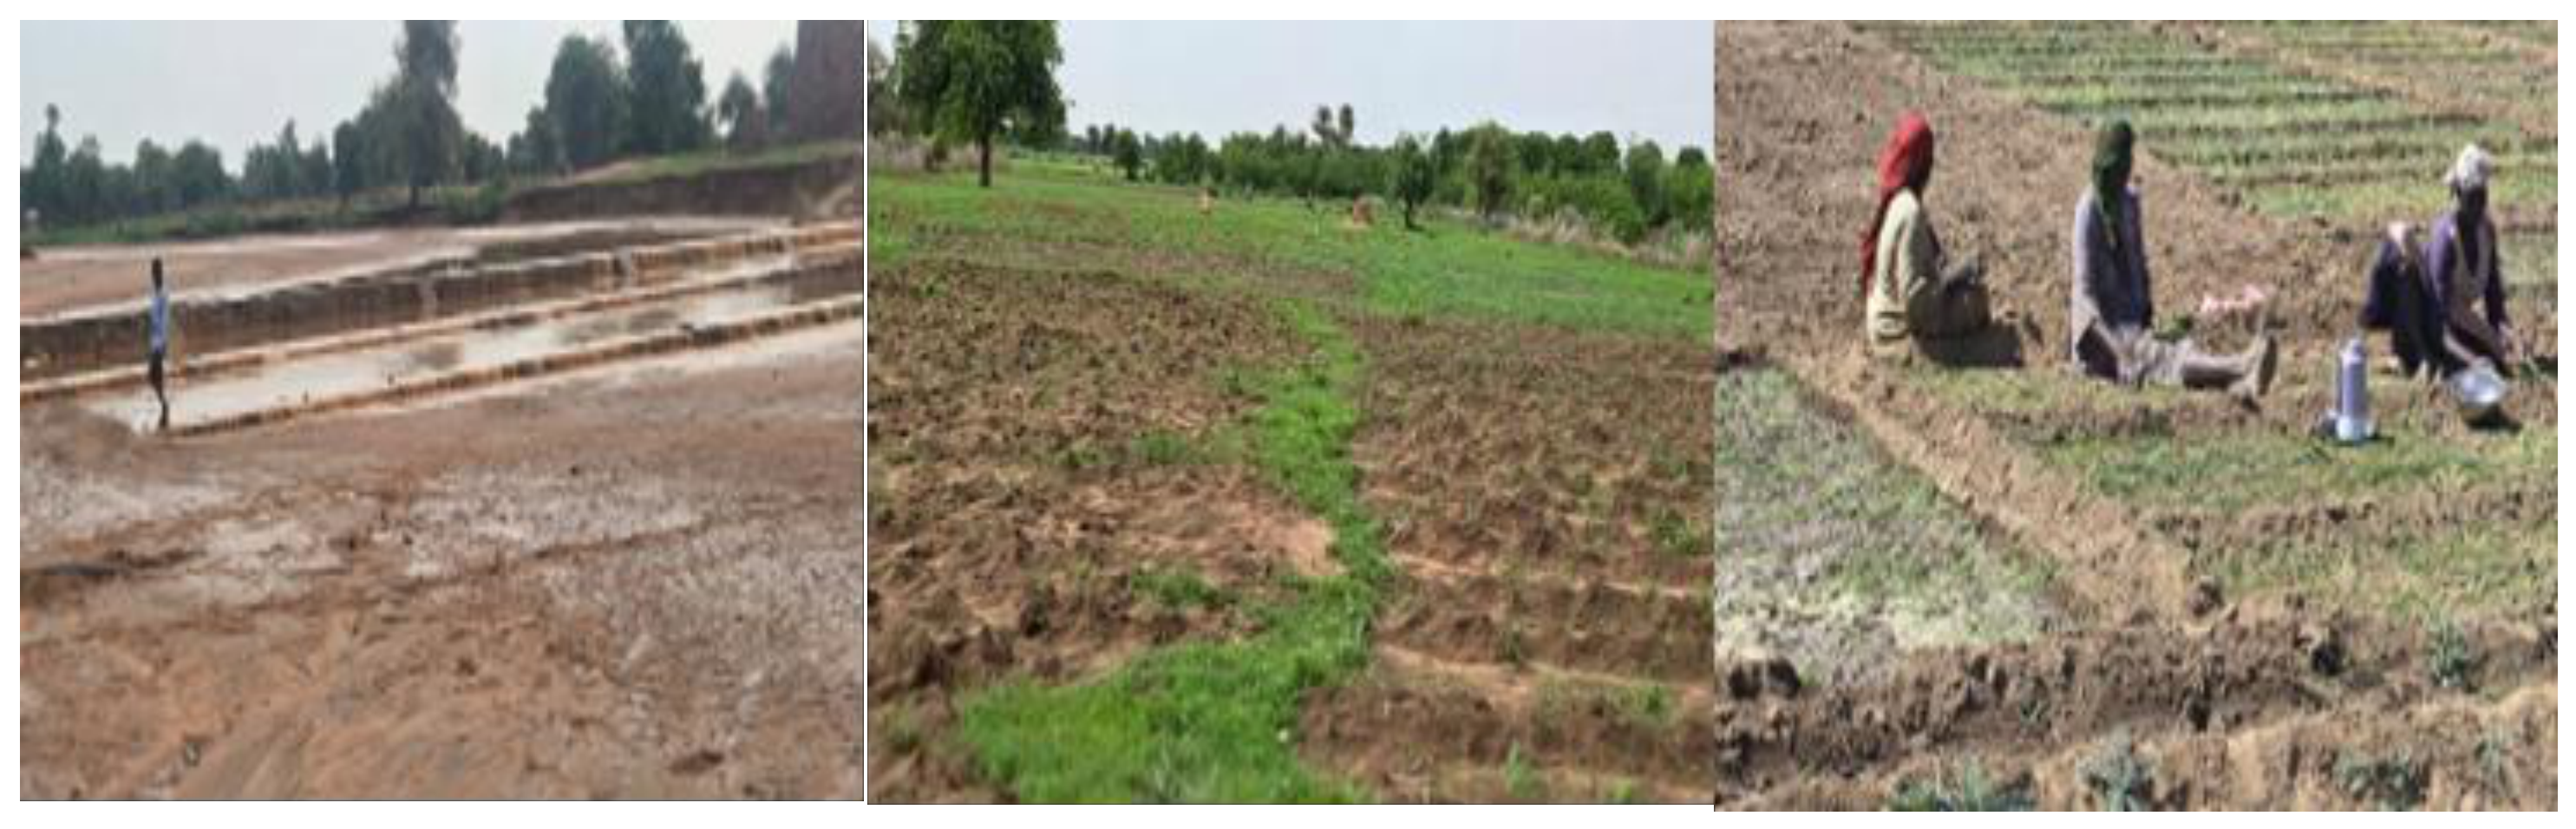
Figure 5.
Utilization of restored land through rain-fed and off-season crops at developed sites in the Metché Valley, Chad.
Figure 5.
Utilization of restored land through rain-fed and off-season crops at developed sites in the Metché Valley, Chad.
3.5. Fertilization Practices and Organic Matter Inputs
Among the sites that provided usable data for the study, a variety of fertilization practices were observed (Table 2). Table 1 shows that the combination of raw organic matter (OM) and mineral fertilizer remains the most common practice, with 16 sites (37.2%). Following is the application of raw OM, with 14 sites (32.6%). The application of raw OM plus compost was observed at 12 sites (27.9%). The application of raw OM alone remains marginal, with only one site in Chad (2.3%) (Figure 6).
However, there are differences in practices between countries. The application of raw OM plus mineral fertilizer clearly dominates in Mali, with 80.0% of sites, followed by Burkina Faso with 75.0%. Conversely, the application of raw organic matter is the most common practice in Niger and Senegal, at 57.1% each. In Chad, the most common practice is the application of raw organic matter plus compost, accounting for 55.6% of sites.
3.6. Water Sources
A variety of water sources was observed at the sites surveyed. This diversity reflects the communities’ adaptation strategies to high seasonal variability and the uneven availability of water resources across countries. According to Table 3, the combination of direct rainwater, groundwater, and ponds is the primary source of water identified, with 20 sites (22.7%), followed by direct rainwater alone, observed at 15 sites (17.0%), and boreholes, present at 13 sites (14.8%). Other sources, combining groundwater, water reservoirs, and traditional water structures, also account for a significant portion of the observations. The combination of traditional wells and boreholes is found at 9 sites (10.2%).
3.7. Farmers’ Organizations and Legal Status
Of the 43 resilience sites surveyed, the majority (22 sites; 51.2% of the observations) remain organized as cooperatives, followed by associations with 15 sites (34.9%). Management Committees and farmers’ organizations were found at 3 sites (7%), while associations were observed at only 2 sites (4.7%). One site had no data available.
This collective structure is a factor that supports the maintenance of SWC/SDR infrastructure and resource management. It is observed that community dynamics rely primarily on cooperatives, a sign of a desire for community and economic integration, and access to markets. Groups provide an important social fabric for agricultural and food service activities.
From a legal standpoint, Simplified Cooperative Societies (SCOPS) compliant with the OHADA Uniform Act predominate, with 26 sites (60.5%/43). Non-compliant SCOPS account for 11 sites (25.6%). Other legal forms remain in the minority, with 3 sites (7.0%).
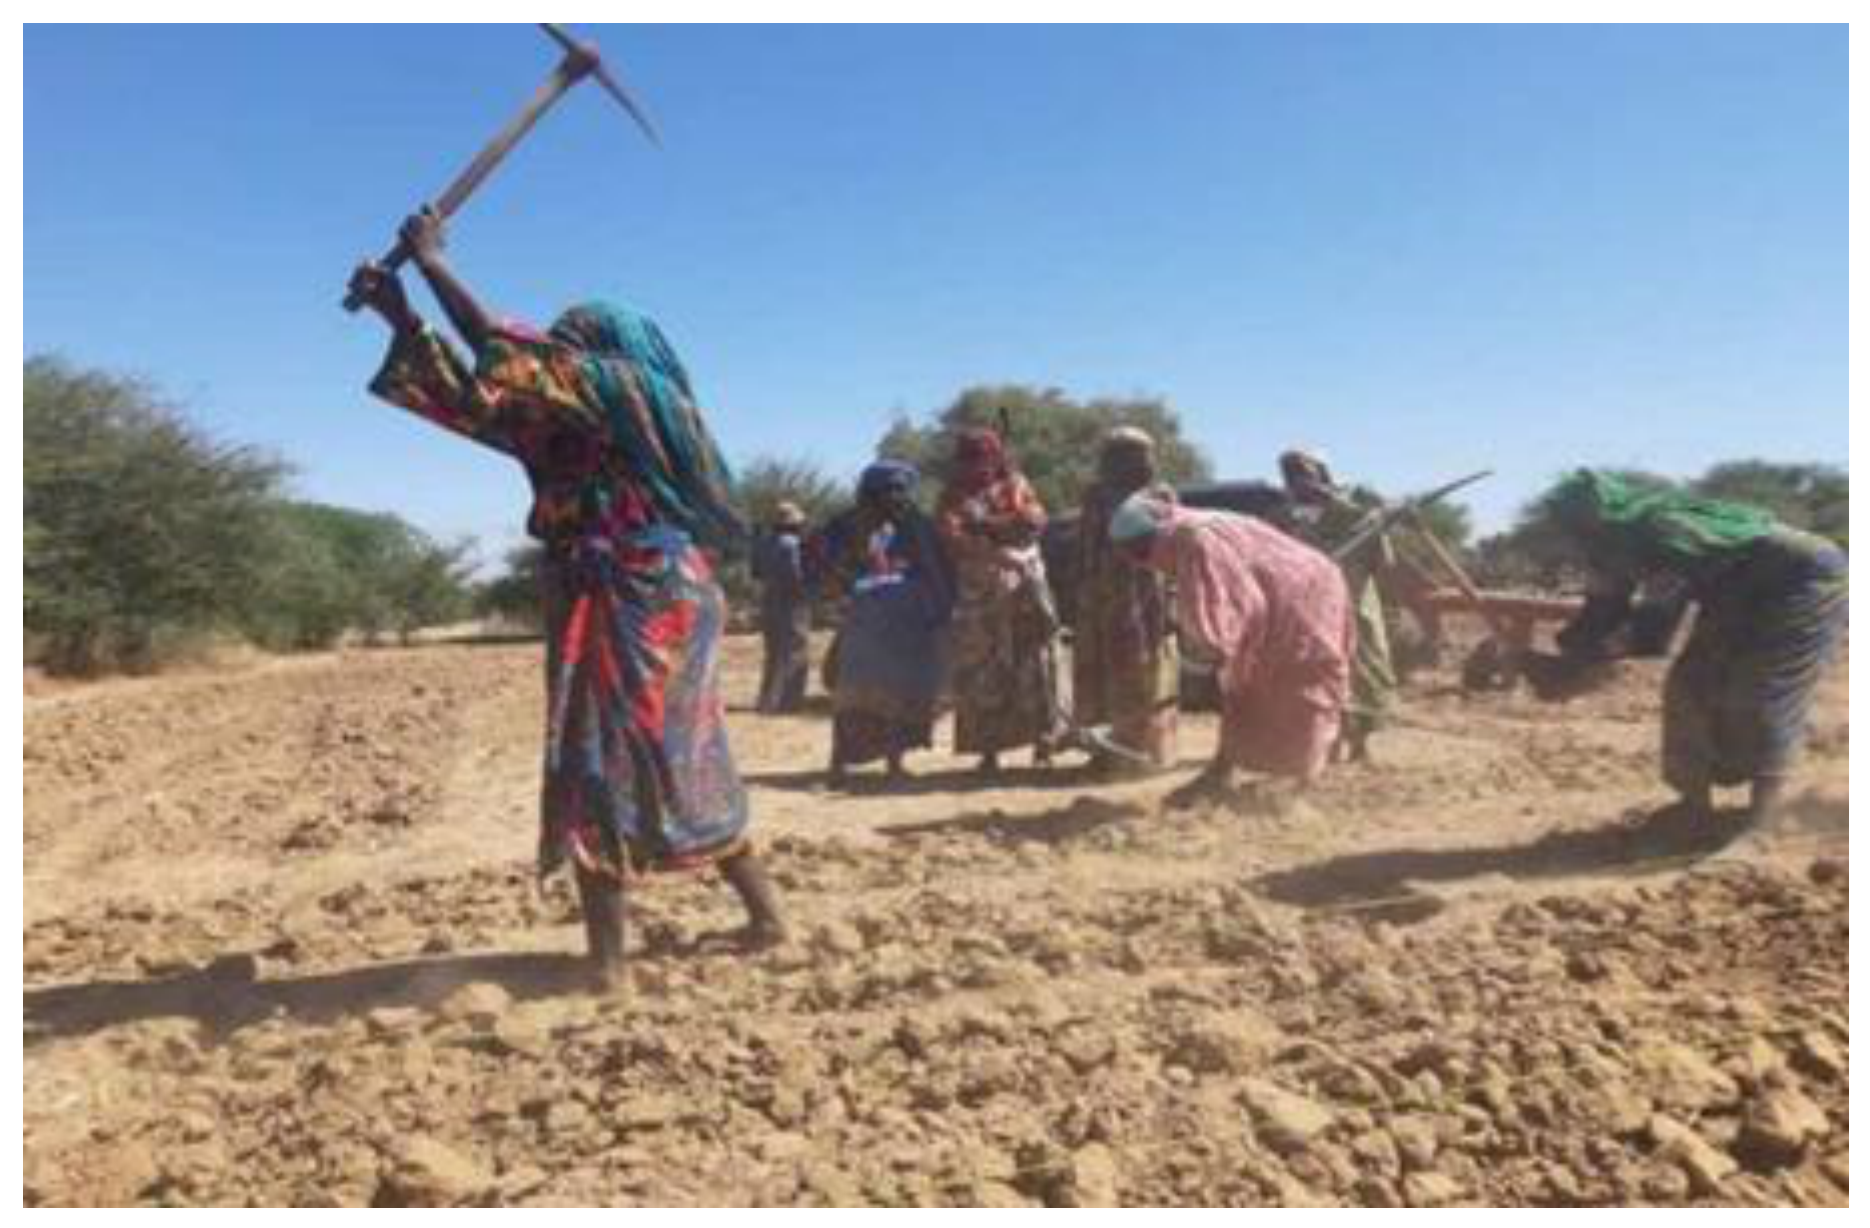
Figure 7.
Members of the workers group during community work at the Malanga resilience site in Chad.
Figure 7.
Members of the workers group during community work at the Malanga resilience site in Chad.
3.8. Effects of SWC/SDR Management Practices on the Physicochemical Properties of Soils by Country
The average results for the 0–20 cm and 20–40 cm depth ranges are presented in Table 4, Table 5, Table 6, Table 7, and Table 8. SWC/SDR infrastructures (stone barriers, zaï, half-moons) implemented at the WFP resilience sites in Burkina Faso, Mali, Niger, Senegal, and Chad have led to a significant improvement (p<0.05) in soil fertility.
In fact, after 3 to more than 5 years of land management in Burkina Faso, surface chemical fertility is significantly restored (Table 4), along with an overall restoration of the clay-humus complex, which results in the trapping of fine particles (clay +15%, p<0.05), an increase in organic matter (OM +24.2%**, p < 0.01), a correction in acidity (soil pH +0.50 units, +9.1%, p < 0.05), an improvement in soil structure (bulk density –3.5%, p < 0.05), and an increase in nitrogen (total N +15.7%, p < 0.05).

Table 4.
Effects of SWC/SDR land management practices on the physicochemical properties of soils—Burkina Faso (n=10).
Table 4.
Effects of SWC/SDR land management practices on the physicochemical properties of soils—Burkina Faso (n=10).
| Parameters (unit) | Control horizon 0-20 cm | managed horizon 0-20 cm | Δ% 0-20 | Control 20-40 cm | managed 20-40 cm | Δ% 20-40 |
|---|---|---|---|---|---|---|
| pH water (-) | 5,52±0,68 | 6,02±0,71* | +9,1% | 5,58±0,64 | 5,89±0,78* | +5,5% |
| C organique (%) | 0,58±0,12 | 0,62±0,22 | +6,9% | 0,46±0,10 | 0,52±0,22 | +13% |
| M.O (%) | 0,95±0,21 | 1,18±0,34** | +24,2% | 0,78±0,18 | 0,98±0,38* | +25,6% |
| N total (%) | 0,070±0,01 | 0,081±0,02* | +15,7% | 0,051±0,01 | 0,056±0,02 | +9,8% |
| Available P (mg/kg) | 2,48±3,5 | 6,85±15** | +176% | 1,15±1,0 | 4,92±15* | +327% |
| Exchangeable K (cmol+/kg) | 0,17±0,05 | 0,25±0,12** | +47,8% | 0,12±0,03 | 0,18±0,08** | +43,3% |
| Apparent density (g/cm³) | 1,43±0,10 | 1,38±0,11* | -3,5% | 1,45±0,12 | 1,43±0,13 | ns |
| Clay (%) | 30,5±12 | 35,1±15* | +15% | 29,8±11 | 32,4±13 | +8,7% |
The SWC/SDR activities significantly restored the chemical fertility of the soils in Mali (Table 5), with an overall restoration of the organo-mineral complex, resulting in a very marked increase in organic matter (OM +77%, p<0.001)—rising from 0.65% to 1.15%—and in organic car-bon (organic C +77%), a clear correction of acidity (soil pH +0.52 units, +9%, p<0.01), a significant improvement in structure (bulk density –8.4%, p<0.01), and an increase in available phosphorus (available P +161%, p<0.01), exchangeable potassium (exchangeable K +41%**, p<0.01), and total nitrogen (total N +23%, p<0.05).
Table 5.
Effects of SWC/SDR management practices on the physicochemical properties of soils—MALI (n=10).
Table 5.
Effects of SWC/SDR management practices on the physicochemical properties of soils—MALI (n=10).
| Parameters (unit) | Control horizon 0-20 cm | managed horizon 0-20 cm | Δ% 0-20 | Control 20-40 cm | managed 20-40 cm | Δ% 20-40 |
|---|---|---|---|---|---|---|
| Water pH (-) | 5,80±0,72 | 6,32±0,96** | +9% | 5,65±0,85 | 6,18±0,88* | +9,3% |
| C organique (%) | 0,38±0,17 | 0,67±0,34 | +77% | 0,26±0,10 | 0,49±0,29 | +88% |
| M.O (%) | 0,65±0,30 | 1,15±0,58*** | +77% | 0,45±0,18 | 0,85±0,50** | +88% |
| N total (%) | 0,047±0,01 | 0,058±0,02* | +23% | 0,042±0,01 | 0,047±0,01 | +12% |
| Available P (mg/kg) | 1,55±0,95 | 4,05±3,0** | +161% | 0,95±0,35 | 1,55±1,0* | +63% |
| Exchangeable K (cmol+/kg) | 0,018±0,003 | 0,026±0,008** | +41% | 0,016±0,003 | 0,020±0,004* | +21% |
| Apparent density (g/cm³) | 1,55±0,14 | 1,42±0,12** | -8,4% | 1,60±0,12 | 1,53±0,08* | -4,3% |
| Sand (%) | 52,1±15 | 48,5±16 | ns | 45,2±18 | 44,8±17 | ns |
Significance.
A significant overall restoration of the soil’s organo-mineral complex (Table 5) was also observed at the developed sites in Niger, as evidenced by a significant increase in organic matter (OM +31.5%, p<0.01)—rising from 0.95% to 1.25%—and in organic carbon (organic C +31.5%), an increase in total nitrogen (total N +25%, p<0.01), exchangeable potassium (exchangeable K +44%, p<0.01), and available phosphorus (available P +36.5%, p<0.01), an increase in pH (water pH +0.40 units, +7.7%, p<0.05), and an improvement in structure (bulk density -2.0%, p<0.05), with no significant change in sandy texture (sand 82.5%)..
Table 6.
Effects of SWC/SDR land management practices on the physicochemical properties of soils—Niger (n=15).
Table 6.
Effects of SWC/SDR land management practices on the physicochemical properties of soils—Niger (n=15).
| Parameters (unit) | Control horizon 0-20 cm | managed horizon 0-20 cm | Δ% 0-20 | Control 20-40 cm | managed 20-40 cm | Δ% 20-40 |
|---|---|---|---|---|---|---|
| Water pH (-) | 5,20±0,95 | 5,60±1,1* | +7,7% | 5,15±0,88 | 5,45±0,92 | +5,8% |
| C organique (%) | 0,55±0,19 | 0,73±0,24 | +31,5% | 0,53±0,17 | 0,65±0,22 | +21,7% |
| NIGER+A29:G37 | 0,95±0,32 | 1,25±0,42** | +31,5% | 0,92±0,30 | 1,12±0,38* | +21,7% |
| N total (%) | 0,052±0,02 | 0,065±0,02** | +25% | 0,048±0,02 | 0,055±0,02 | +14% |
| Available P (mg/kg) | 145±110 | 198±125** | +36,5% | 142±95 | 175±110* | +23% |
| Exchangeable K (cmol+/kg) | 0,045±0,02 | 0,065±0,02** | +44% | 0,042±0,02 | 0,055±0,02* | +31% |
| Apparent density (g/cm³) | 1,45±0,08 | 1,42±0,09* | -2,0% | 1,47±0,10 | 1,45±0,11 | ns |
| Sand (%) | 82,5±6 | 81,2±6 | ns | 81,8±7 | 80,5±8 | ns |
The sites in Senegal also exhibit significantly improved soil chemical fertility (Table 7), with an overall restoration of the clay-humus complex, resulting in very significant retention of fine particles (clay +61%, p<0.01), a very marked increase in organic matter (OM +54.5%, p<0.01)—rising from 0.55% to 0.85%—and in organic carbon (organic C +50%, p<0.01), a major increase in total nitrogen (total N +52.9%, p<0.01), and a significant improvement in soil structure (bulk density –5.6%, p<0.01), without any significant change in acidity (water pH ns) or the C/N ratio (C/N ns).
Table 7.
Effects of SWC/SDR land management practices on the physicochemical properties of soils—Senegal (n=7).
Table 7.
Effects of SWC/SDR land management practices on the physicochemical properties of soils—Senegal (n=7).
| Parameters (unit) | Control horizon 0-20 cm | Managed horizon 0-20 cm | Δ% 0-20 | Control 20-40 cm | Managed 20-40 cm | Δ% 20-40 |
|---|---|---|---|---|---|---|
| Water pH (-) | 6,20±0,85 | 6,31±0,92 | ns | 6,35±1,1 | 6,42±1,0 | ns |
| C organique (%) | 0,32±0,20 | 0,48±0,22** | +50% | 0,25±0,18 | 0,35±0,20* | +40% |
| M.O (%) | 0,55±0,28 | 0,85±0,35** | +54,5% | 0,42±0,22 | 0,58±0,30* | +38% |
| N total (%) | 0,034±0,02 | 0,052±0,02** | +52,9% | 0,031±0,02 | 0,042±0,02* | +35% |
| C/N (-) | 9,1±3,2 | 9,5±2,8 | ns | 7,8±2,5 | 8,2±2,1 | ns |
| Available P (mg/kg) | 2,85±2,0 | 5,42±3,1** | +90% | 1,85±1,0 | 3,25±2,2* | +75% |
| Apparent density (g/cm³) | 1,25±0,10 | 1,18±0,08** | -5,6% | 1,21±0,12 | 1,17±0,10* | -3,3% |
| Clay (%) | 12,5±8 | 20,2±10** | +61% | 15,2±9 | 18,5±8 | +21% |
Following the management interventions, the sites in Chad showed a significant restoration of soil chemical fertility (Table 8). This restoration is reflected in a significant increase in organic matter (+39.7%, p<0.01), rising from 0.68% to 0.95%, as well as in organic carbon (+34.8%, p<0.01). It was accompanied by a marked increase in total nitrogen (+46%, p<0.01) and exchangeable potassium (+39%, p<0.01), as well as a clear correction of soil acidity, with a rise in soil pH of 0.52 units (+8.1%, p<0.01). Soil structure also improves, as indicated by a 4.3% decrease in bulk density at the surface and a 4.9% decrease at depth (p<0.05). In contrast, no significant changes were observed for available phosphorus, which was already at a high level, nor for clay content, which remained stable.
Table 8.
Effects of SWC/SDR land management practices on the physicochemical properties of soils—Chad (n=10).
Table 8.
Effects of SWC/SDR land management practices on the physicochemical properties of soils—Chad (n=10).
| Parameters (unit) | Control horizon 0-20 cm | Managed horizon 0-20 cm | Δ% 0-20 | Control 20-40 cm | Managed 20-40 cm | Δ% 20-40 |
|---|---|---|---|---|---|---|
| Water pH (-) | 6,40±0,28 | 6,92±0,58** | +8,1% | 6,55±0,32 | 6,72±0,55* | +2,6% |
| C organique (%) | 0,43±0,22 | 0,58±0,15** | +34,8% | 0,30±0,12 | 0,45±0,15* | +50% |
| M.O (%) | 0,68±0,22 | 0,95±0,28** | +39,7% | 0,52±0,15 | 0,71±0,24* | +36,5% |
| N total (%) | 0,13±0,05 | 0,19±0,05** | +46% | 0,11±0,03 | 0,15±0,04* | +36% |
| Available P (mg/kg) | 25,2±4,5 | 25,8±7,2 | ns | 27,5±4,8 | 26,8±6,5 | ns |
| Exchangeable K (cmol+/kg) | 0,11±0,04 | 0,15±0,05** | +39% | 0,12±0,04 | 0,14±0,04* | +17% |
| Apparent density (g/cm³) | 1,38±0,18 | 1,32±0,15* | -4,3% | 1,42±0,15 | 1,35±0,14* | -4,9% |
| Clay (%) | 38,5±14 | 39,5±18 | ns | 31,2±16 | 32,5±18 | ns |
3.9. Effects of SWC/SDR Management Practices on the Physicochemical Properties of Soils for the Five Sahelian Countries
A comparative analysis of the five countries shows that SWC/SDR management practices significantly improve soil fertility in the 0–20 cm layer, with the extent of improvement varying according to soil and climate conditions and initial texture (Table 9). After 3 to more than 5 years of management, this restoration is primarily reflected in an increase in organic matter, a decrease in bulk density, and an improvement in pH. Thus, organic matter increases by 24.2% in Burkina Faso to 77% in Mali, while bulk density decreases by 2.0% in Niger to 8.4% in Mali. The pH increases by 0.40 to 0.52 units in most countries, with the exception of Senegal, where this change remains insignificant.
The improvements also help increase the availability of the most deficient mineral elements. Available phosphorus shows the greatest increases, reaching 176% in Burkina Faso and 161% in Mali, compared to 36.5% in Niger and 90% in Senegal. In Chad, this change remains insignificant, likely due to an already high initial phosphorus level. Exchangeable potassium, meanwhile, increased from 39% to 47%. These changes can be explained by reduced erosion, the retention of fine particles, the mineralization of organic matter, and the gradual improvement of soil chemical conditions.
However, the effectiveness of SWC/SDR interventions vary depending on the initial soil texture. In the sandy soils of Niger and Senegal, these interventions primarily promote the accumulation of fine particles and organic matter, with a particularly marked effect on the clay fraction in Senegal (+61%). In the silty-clay-sandy soils of Burkina Faso and Mali, restoration appears more complete, with the greatest increases in organic matter and the most significant decreases in bulk density. In Chad, where silty-clay soils predominate, the main gains relate to organic matter, total nitrogen, and potassium.
Overall, the average magnitude of the gains follows this order: available phosphorus (+113%) > organic matter (+45%) > exchangeable potassium (+43%) > total nitrogen (+32%) > pH (+0.41 units).
3.8. Effect of Land Management on Soil Physicochemical Properties
To account for potential differences among countries, linear models that included country as a covariate were fitted for each soil physicochemical property. The adjusted means for managed and control sites are presented in Table 2.
Managed sites exhibited significantly higher concentrations of organic carbon (0.56% vs. 0.40%, P < 0.001), organic matter (0.95% vs. 0.66%, P < 0.001), available phosphorus (40.98 mg/kg vs. 27.74 mg/kg, P < 0.001), and cation exchange capacity (11.15 cmol/kg vs. 7.39 cmol/kg, P < 0.001) than control sites. Clay content was also slightly higher in managed soils (22.94% vs. 20.79%, P = 0.021). However, no significant differences were detected for soil pH, total nitrogen, available potassium, sand content, silt content, or bulk density after adjusting for country effects (P > 0.05).
Figure 8 shows the distributions of the soil properties that exhibited significant differences between managed and control sites.
The boxplots show the median (horizontal line), the interquartile range (box), and 1.5 times the interquartile range (whiskers). Points represent individual soil samples. Asterisks indicate statistically significant differences between management types, adjusted for country effects (P < 0.05; **P < 0.001).
As shown in Figure 3, managed sites consistently exhibited higher levels of organic carbon, organic matter, available phosphorus, and cation exchange capacity than control sites. Although the clay content was significantly greater in the managed soils, the distributions of the two groups overlapped considerably, indicating substantial variability among the sampling sites. Overall, these findings suggest that land management primarily improved properties related to soil fertility, whereas soil texture remained comparatively stable.
3.9. Principal Component Analysis of Soil Physicochemical Properties
We performed a principal component analysis (PCA) to determine the primary gradients driving variability in soil physicochemical properties among study sites. The loadings of each variable on the first two principal components are described in Table 10.
PC1 (horizontal axis) and PC2 (vertical axis) explained 49.2% of the total variance, with relative contributions of 26.0% (PC1) and 23.2% (PC2). PC1 mainly described a soil fertility–texture gradient, with positive associations to available phosphorus (0.808) and cation exchange capacity (0.663), and negative associations to clay (−0.733), available potassium (−0.536), and soil pH (−0.478). Conversely, organic carbon (0.447), organic matter (0.460) and sand (0.534) exhibited positive contributions to this axis as well.
PC2 was primarily correlated with organic matter, accounting for 28.52% of the variance, with highest positive loadings for organic carbon (0.796) and organic matter (0.783). Clay, silt, available potassium and total nitrogen were also responsible for a positive contribution to PC1, whereas sand was associated with a strong negative loading (−0.670), showing opposition of sandy soils versus those with higher concentrations of finer particles and organic matter.
The correlation matrix of soil variables is represented in Figure 9, where physicochemical properties and their relative contributions to the first two principal components (PC1 and PC2) are exhibited.
The PCA correlation circle showed high positive correlations among organic carbon and organic matter which indicated the common origin and accumulation processes of those variables. Likewise, both available phosphorus and cation exchange capacity were significantly correlated with each other, confirming that nutrient availability would tend to increase with soil exchange capacity. Conversely, along the second principal component clay was negatively related with sand, highlighting the contrasting texture of sampled soils.
Soil samples projected onto the PCA factorial plane (Figure 10) indicated some aspect of separation between the managed and control sites. Managed soils were mainly restricted to the positive side of PC1 where fertility-related variables such as organic carbon, organic matter, available phosphorus and cation exchange capacity contributed most strongly. By contrast, control sites were more broadly distributed and tended to represent areas characterized by drier greener development classes, lower fertility levels and coarser soil texture. However, there remained a strong overlap between both groups showing that soil physicochemical properties were also affected by local natural conditions and country-specific variability.
In total, the PCA summarized soil fertility and soil texture as the two broadest sources of variation among sampled soils, while indicating that land management positively influenced several fertility-related soil properties.
3.10. Soil Physicochemical Profiles Identified by Hierarchical Clustering
Six clusters revealing contrasting combinations of soil fertility and texture were characterized by HCPC on 217 soil samples. The levels of clusters presented on the PCA factorial plane (Figure 11) show a clean separation between six soil physicochemical profiles.
Cluster 1 included data for 38 samples, high on potassium (4622 mg/kg), clay (41.8%), and relatively high in organic carbon, organic matter and total nitrogen contents too [with averages of 15.0 g/kg;] On the other hand, this cluster had relatively low available phosphorus, cation exchange capacity (CEC), sand and silt contents.
Cluster 2 (n = 37) showed highest bulk density and relatively high soil pH, but low content of organic carbon, organic matter, available phosphorus and CEC which shows comparatively lowest soil fertility.
Cluster 3 (n = 12) involved fine-textured soils with extremely high silt and clay contents, and very low plant-available phosphorus.
Cluster 4 (n = 38) had relatively high soil pH, while all the other variables were low in concentration (organic carbon, organic matter, total nitrogen, available phosphorus and potassium and CEC).
Cluster 5 (n = 52) represents very high sand content and low fine clay content coarse-textured sandy soils. These soils had relatively high levels of available phosphorus and CEC, however they exhibited patterns the indicated low levels of organic carbon, organic matter, total nitrogen and available potassium.
Cluster 6 (n = 40) was the most fertile soil profile, both in absolute terms and compared to other clusters, displayed the highest available phosphorus, organic carbon content, organic matter and CEC, as well as having relatively low clay.
Mean of standardized soil physicochemical properties by six clusters are presented in Figure 12.
The heatmap reflected stark differences between clusters. Cluster 6 had the highest standardized values regarding organic carbon, organic matter, available phosphorus and CEC while cluster 1 was characterized by high levels of available potassium and clay content. Cluster 3 presented high silt and clay, whereas Cluster 5 exhibited the highest sand. Clusters 2 and 4 showed mostly lower values (standardized) for most variables that are related to fertility, confirming an evident physicochemical heterogeneity among the soil profiles identified here.
The location of six clusters is shown in Figure 13
Visualizations of the analluvial diagram indicated a close association between geographic region and soil physicochemical profile. Burkina Faso was reserved for Cluster 1, Mali mainly for Clusters 2 and 3, Niger as Cluster 5 and a little portion for Cluster 6, whereas Chad showed an intermediate pattern between clusters 1 and cluster two no region was found to be exclusively associated with one cluster except Senegal was mostly related to cluster four. This visual pattern was statistically verified with a significant association between country and cluster membership (Pearson’s χ² = 456.17, df = 20, P < 0.001).
In sum, the HCPC results revealed six soil physicochemical profiles that not only differed strongly among themselves for fertility-related characteristics and texture. The predominance of geographical origin as a source of variation in soil physicochemical characteristics across the five countries further illustrated this finding.
4. Discussion
4.1. Agronomic and Agroecological Profile of the Sites
The distribution of sites based on topography shows a predominance of plains (44.2%) and gently sloping terrain (46.5%). This configuration is particularly conducive to the implementation of water and soil conservation measures, as the reduction in flow velocity promotes infiltration and the retention of transported particles. [19] also emphasize that the effectiveness of land restoration techniques in the Sahel depends heavily on biophysical conditions and the site context, particularly its position within the landscape, soil texture, and water constraints. Stone barriers, zaï, and half-moons are specifically used to reduce runoff, increase water availability, and restore the functions of degraded soils.
This relationship between topography, runoff, and the effectiveness of these structures is also illustrated in Niger. [19] demonstrate, on the Sokorbé Plateaus, that half-moons significantly alter the water and soil conditions in the treated areas. These results support the hypothesis that gently sloping sites are particularly well-suited for structures designed to slow runoff and promote infiltration.
5.2. Saisonnalité, Disponibilité de L’eau et Diversification des Systèmes de Production
The ability to produce crops during both seasons at 48.8% of the sites, as well as the predominance of systems combining vegetable farming and rain-fed crops (51.2%), reflect a significant diversification of agricultural activities. This diversification appears to be a response to the highly seasonal nature of the Sahelian climate and the need to make the most of available water resources beyond the rainy season alone.
The results obtained in Mali by [20] support this conclusion and show that contour farming techniques and grass strips improve moisture retention and sorghum yields in southern Mali. The authors thus demonstrate that improved water management is a key lever for maintaining agricultural production in the face of rainfall variability.
The diversification observed in our study is also consistent with the work of [21] in Mali, which shows that farmers employ several agroecological practices, including contour farming techniques, organic fertilizers, crop rotations, and integrated crop management.
In Niger, [22] also show that half-moons significantly improve infiltration and soil properties. In their experiment in Sokorbé, the amount of water that infiltrated increased sharply in the treated plots, while pH and organic matter improved. These results suggest that CES/DRS structures can be viewed as a means of securing production, but not as the sole determinant of off-season production. Off-season production also depends on the presence of boreholes, wells, ponds, or water reservoirs, as well as the equipment needed to access them.
5.3. Diversity of Water Sources and System Resilience
The diversity of water sources identified at the 43 sites—with a total of 88 occurrences—reflects the variety of strategies for accessing water. The combination of rainwater, groundwater, and ponds is the most common method (22.7%), followed by direct rainwater collection (17.0%) and boreholes (14.8%). This diversity underscores that production systems rely on the complementary use of multiple water resources, the availability of which varies according to the seasons and local conditions.
This observation aligns with that of [23], who show that water constraints and soil degradation are interdependent limitations in Sahelian agricultural systems and that the most effective practices are those that address multiple constraints simultaneously. The authors particularly emphasize the benefits of combining water and soil conservation, organic amendments, fertilization, and diversification rather than considering these practices in isolation. Furthermore, Dembele et al. [24] in Mali show that moisture-conservation techniques help reduce crop vulnerability to water deficits. In Niger, the work of [25] shows that improved infiltration is one of the most visible effects of excavated structures. Thus, the data from our study suggest that the resilience of these sites relies on the complementary nature of runoff collection, groundwater mobilization, and surface water use
5.4. Fertilization Practices and the Role of Organic Matter
Organic matter plays a central role in the fertilization practices observed: the combination of raw organic matter and mineral fertilizer accounts for 37.2% of sites, the application of raw organic matter alone accounts for 32.6%, and the combination of raw organic matter and compost accounts for 27.9%. In total, more than 95% of the sites therefore use some form of organic matter in combination with or as a standalone application. This prevalence confirms that farmers seek to simultaneously address nutrient supply and the improvement of soil physical properties.
This observation is strongly consistent with the review by [23], which shows that organic amendments and mineral fertilizers are among the most studied and widely used practices for restoring the fertility of Sahelian soils. The authors emphasize, however, that the best prospects lie in combining several practices that simultaneously address nutrient deficiencies, low water retention, and physical soil degradation.
In Burkina Faso, [26] show that the zaï and stone ridges, combined with organic amendments, are effective strategies for restoring degraded land. The authors note that stone ridges slow runoff and reduce erosion, while the zaï concentrates water and soil amendments in the pits. This complementary approach improves soil fertility and sorghum yields.
In our study, this pattern is particularly evident in Burkina Faso and Mali, where the combination of organic matter and mineral fertilizer accounts for 75% and 80% of the sites, respectively. This situation can be interpreted as a strategy of rational intensification, aimed at combining the relatively rapid effect of mineral fertilizers with the more gradual effects of organic matter on soil structure, water-holding capacity, and nutrient storage. In Mali, [21] specifically show that the use of organic fertilizers is influenced by expected benefits and by conditions that facilitate their use, which aligns with the practices observed at the study sites. In Chad, the combination of organic matter and compost accounts for 55.6% of the sites. This finding corroborates the work of [27] in the rice-growing plains of southern Chad. The authors show that fallowing, manure application, and the use of rice bran improve the physicochemical characteristics of the soil, with organic matter contents reaching 2.77%, 2.78%, and 3%, respectively.
They also highlight a strong correlation between the fine soil fraction and organic matter. These results are particularly useful in the context of sites in Chad where soils are initially low in organic matter; the regular addition of biomass and compost can be an essential mechanism for restoring fertility.
5.5. Collective Organization and Sustainable Management of Development Projects
The predominance of cooperatives (51.2%) and associations (34.9%) shows that the development of these sites relies heavily on forms of collective organization. This aspect is important for the sustainability of CES/DRS structures, for which installation is only the first step: their maintenance, water management, mobilization of labor, and distribution of benefits determine their long-term viability.
In Mali, [21] show that social factors significantly influence the adoption of agroecological practices. Their study highlights the role of social influence, enabling conditions, and expected net benefits in the use of land conservation techniques and organic fertilizers.
In this context, the high proportion of SCOOPS compliant with OHADA (60.5%) may constitute an institutional advantage for the collective management of activities. However, the mere existence of a legal organization does not guarantee its functionality. It would therefore be appropriate, in subsequent analyses, to examine the actual level of member participation, infrastructure maintenance mechanisms, revenue management, access to inputs, and water governance.
5.6. Effects of CES/DRS Management Practices on the Physicochemical Properties of Soils by Country
The results of the project activities carried out in the five countries generally confirm the effectiveness of CES/DRS techniques in restoring Sahelian soils, while revealing varying responses depending on soil and climate conditions and the initial characteristics of the soils. This trend is consistent with recent reviews on land restoration in the Sahel, which show that zais, stone cordons, half-moons, and manure swaths help reduce runoff, promote infiltration, and gradually restore soil functions.
In Burkina Faso, the increase in organic matter, phosphorus, and potassium observed at the study sites is consistent with recent work by [28,29] and [33,34,35] which highlight an improvement in the chemical properties of soils under stone ridges, zaï, and combinations of these with organic inputs. These practices notably promote the accumulation of organic carbon and improve pH and cation exchange capacity (CEC).
In Mali, the significant decrease in bulk density and the sharp increase in organic matter may be associated with improved infiltration and reduced particle transport via runoff. Research conducted in the southern part of the country by Dembélé et al. [30]) in the southern part of the country show that contour structures improve water conservation and reduce soil loss, while their combination with vegetation enhances infiltration.
In Niger, the increase in organic matter and pH observed in the treated plots is particularly similar to the results recently obtained in Sokorbé by [31] and [32] have shown that half-moon structures increase organic matter and bring the pH closer to neutrality, while significantly improving water infiltration. These results confirm the role of water collection structures in the restoration of sandy and degraded soils.
In Senegal, the sharp increase in organic matter and organic carbon observed in cultivated soils appears particularly significant given the predominant sandy texture. Research conducted in the peanut-growing region by [33] in the peanut-growing region show that these soils are naturally low in organic carbon and that the accumulation of organic inputs is a key driver for restoring their fertility. The contribution of agroforestry systems to carbon sequestration also confirms the importance of biomass inputs and root development in rebuilding soil carbon stocks.
In Chad, the increase in organic matter, total nitrogen, and potassium—combined with stable levels of the clay fraction and available phosphorus—suggests that restoration primarily involves organo-mineral processes rather than changes in soil texture. This interpretation aligns with observations made in Abéché by [34] and [35], where low organic matter content is one of the main constraints on agricultural soil fertility.
5. Conclusions
This study highlights an overall improvement in soil quality following several years of implementing land reclamation projects in the five Sahelian countries studied. The results show that WSC / SDR projects are associated with improvements in key physicochemical soil properties, including increases in organic matter, total nitrogen, available phosphorus, and exchangeable potassium, as well as a rise in pH and a decrease in bulk density. However, the extent of these effects varies depending on soil-climate conditions and the initial soil texture.
The results also show that land restoration does not rely solely on physical structures. It is enhanced by combining these structures with the addition of organic matter, fertilization, water availability, crop diversification, and collective organization among farmers. The differences observed between countries thus underscore the importance of adapting land reclamation techniques to soil characteristics and local conditions.
Overall, CES/DRS structures are a key driver for restoring soil fertility and quality in the Sahel. Their sustainability and their contribution to land productivity depend, however, on their maintenance, the availability of organic and water resources, and the communities’ ability to ensure collective and appropriate management of the infrastructure.6. Patents
Author Contributions
“Conceptualization, K.M, A.H and L.M.A.; methodology, A.H. H.M.B.; formal analysis, K.M and A.H.; investigation, A.H; data curation, M.K and L.M.A; writing—original draft preparation, A.H.; writing—review and editing, K.M and L.M.A. All authors have read and agreed to the published version of the manuscript.
Data Availability Statement
The data supporting the findings of this study are available from the corresponding author upon reasonable request.
Acknowledgments
Authors kindly express their acknowledgments to Livelihoods Assets Resilience Academy (LARA) imitative of World Food Program (WFP) for funding this research through the Sahel Universities’ Network for Resilience (REUNIR).
Conflicts of Interest
“Authors formally declare absence of any conflict of interests between them linked with this research.”.
References
- Lal, R (2001). Soil degradation by erosion. Land Degradation & Development, 12(6), 519–539. [CrossRef]
- Oumarou B, 2012. Capital Sol et arrangements institutionnels dans les agrosystèmes du Nord-Cameroun Thèse de Doctorat, Montpellier SupAgro, p. 204.
- IPCC (2022). Climate change: Adaptation and Vulnerability. Chapter 9: Africa. Cambridge University Press.
- Baragé, M., Baragé, M., & Comby, J. (2018). Climate change perception and adaptation strategy associated with farming techniques in Tamou district wester Niger” farmers. African Journal of Agricultural Research. Vol. 13(30), pp. 1496-1507, 26 July, 2018. [CrossRef]
- Nord, A., Snapp, S., & Traore, B. (2022). Current knowledge on practices targeting soil fertility and agricultural land rehabilitation in the Sahel. A review. Agronomy for Sustainable Development, 42, 79. [CrossRef]
- CNEDD (2011). Quarterly review on climate change and sustainable development. National Council for the Environment for Sustainable Development (CNEDD). Niamey (Niger) 43 p.
- Mirzabaev, A., Sacande, M., Motlagh, F., Shyrokaya, A., & Martucci, A. (2022). Economic efficiency and targeting of the African Great Green Wall. Nature Sustainability, 5, 17–25. [CrossRef]
- Gnissie, M; Coulibaly, K, Traore, M., Mipro, H., Bertrand, M., & Hassan, N.B. (2021). Effets des pratiques agro-écologiques sur les caractéristiques chimiques majeures et le stock de carbone du sol à l’Est du Burkina Faso. Tropicultura, 2021, v. 39, n. 3, p. 1. [CrossRef]
- Ouédraogo, H. A., & Ouoba, Y. (2025). Adoption intensity of soil and water conservation techniques in Burkina Faso is influenced by farmers’ preferences for their attributes. Scientific Reports, 15, 2884. [CrossRef] [PubMed]
- Sidibé, M.Z., Saliou, I.O., Sacko, I., Aoudji A.K.N., Assogbadjo, A.E., Coulibaly, H., & Kone, B. (2024). Determining Factors Affecting Agroecological Practices’ Acceptance and Use in Mali, West Africa. Sustainability, 16, 11002. [CrossRef]
- Dembele, S., Bengaly, A., Samake, O., & Traore, K. (2025). Effects of contour ridge tillage and grass strip technologies on moisture conservation and sorghum yields in the Southern Mali. International Journal of Innovation and Scientific Research, 81(1), 59–70.
- FAO. (2022). FAIR Sahel: surutilisation et dégradation rapide des ressources naturelles (sols, eau, biodiversité) dans le Sahel.
- BUNASOLS. (1990). Méthodologie d’évaluation des terres pour l’agriculture pluviale non mécanisée. Bulletin technique n°6, Ouagadougou, Burkina Faso.
- AFNOR. (1981). Qualité des sols: Recueil de normes françaises. Agence Française de Normalisation, Paris, France.
- Davis, R. O. E., & Bennett H.H. Grouping of Soils on the Basis of Mechanical Analysis. Washington, US: United States Department of Agriculture, 1927.
- Bremner, J. M. (1996). Nitrogen—Total. In D. L. Sparks (Ed.), Methods of Soil Analysis. Part 3—Chemical Methods (No. 5 in the SSSA Book Series, pp. 1085–1121).
- Peck, T. R. (2012). Standard soil scoop. In M. V. Nathan & R. Gelderman (Eds.), Recommended chemical soil test procedures for the North Central Region (pp. 2.1–2.3). Missouri Agricultural Experiment Station SB 1001.
- Bray R.H & Kurtz L.T. (1945). determination of total, organic, and available forms of phosphorus in soils. Soil science 59 (1): 39-45. [CrossRef]
- Seidou Ousmane, I., Tidjani Adamou, D., & Ambouta, K. J.-M. (2024). Effects of half-moons (multifunctional and classic) on improving the physicochemical characteristics of the excavated parts of upland soils in western Niger: The case of Sokorbé (Loga). International Journal of Innovation and Applied Studies, 44(1), 194–206.
- Dembele, S.&, Traoré, K., (2025). Fonctionnement hydrique et productivité des sols aménagés en CES/DRS dans la zone sahélienne du Mali: effets sur la densité apparente et la réserve utile. Arid Land Research and Management, 39(1), 12-29.
- Sidibé, M.; Aoudji, A.K.N.; Moumouni, Y.I.; Sacko, I.; Saliou, I.; Koné, B.; Assogbadjo, A.E.; & Zannou, A.E. (2024). A. Spatio-Temporal Dynamics of Land Use in Cotton and Cereal Production Zones, Mali Dynamiques Spatio-Temporelles de l’Occupation des Terres dans les Zones de Production Cotonnière et Céréalière au Mali. Rev. Int. Géomatique, 33, 51–76.
- Seidou Ousmane, A., & Moussa, A. B.. (2024). Demi-lunes et restauration des sols sableux encroûtés au Niger: collecte du ruissellement, accumulation de sédiments et amélioration de la fertilité. Catena, 234, 107632.
- Ousseini, A., & Ambouta, K. J. M.,. (2025). Restauration écologique des terres dégradées par les ouvrages CES/DRS au Niger: revue et perspectives. Land Degradation & Development, 36(2), 450-468.
- Coulibaly, A., Zongo, F., Zouré, C. O., Bazongo, P., Ouédraogo, I., Hien, E., & Motellica, M. (2025). Effects of Agroecological Practices (Zaï and Stone-Rows) on Soil Fertility and Sorghum Yield in Response to Effects of Climate Change to Achieve Food Security. International Journal of Agronomy. [CrossRef]
- ABN. (2021). Multinational - Autorité du Bassin du Niger: aridification du climat et pression foncière contribuant à la dégradation généralisée et à l’érosion hydrique et éolienne. BAD.
- Siegwart, M., & Diome, F. (2023). Soil organic carbon dynamics under agroecological practices in sandy soils of Senegalese Sahel. Agriculture, Ecosystems & Environment, 345, 108324.
- Zakaria, M. N., Ambouta, J. M. K., Arka, B., Mbaikoubou, M., & Gongnet, E. E. (2024). Effets des pratiques de gestion de la fertilité sur les caractéristiques physico-chimiques des sols dans les plaines rizicoles du sud du Tchad. Revue Africaine d’Environnement et d’Agriculture, 7(3), 44–51. [CrossRef]
- Siegwart, L., Bertrand, I., & Roupsard, O. (2023). Contribution of tree and crop roots to soil carbon stocks in a Sub-Sahelian agroforestry parkland in Senegal. Agriculture, Ecosystems & Environment, 352, 108524. [CrossRef]
- Gnissien, M., & Some, D. (2021). Effets des pratiques agroécologiques intégrant les cordons pierreux sur les propriétés chimiques et le stock de carbone des sols ferrugineux tropicaux au Burkina Faso. Cahiers Agricultures, 30, 45. [CrossRef]
- Coulibaly, A., Sawadogo, H., & Zoungrana, B. (2025). Effets du zaï et des cordons pierreux sur la fertilité des sols en zone nord soudano-sahélienne du Burkina Faso: cas du carbone organique, du pH et des éléments nutritifs. Journal of Arid Environments, 221, 105123.
- Ky-Dembele, C., Bayala, J. (2024). Water harvesting and soil conservation structures enhance infiltration, soil moisture conservation and crop productivity in Sahelian Mali. Geoderma Regional, 36, e00745.
- Richer de Forges, A., Feller, C., Jamagne, M., Arrouays, D., Perdus dans le triangle des textures. Étude et Gestion des Sols (2008) 15(2), 97-111.
- Malou, O. P., & Faye, G.. (2020). Apports organiques, végétation et stock de carbone dans les sols sableux du Sahel sénégalais. Etude et Gestion des Sols, 27(3), 215-229.
- Abdou, H., & Abderamane, H.. (2022). Caractérisation physico-chimique des sols hydromorphes et ferrugineux de l’Est du Tchad (Abéché): contrainte organique et fertilité. Journal of Applied Biosciences, 175, 18120-18135.
- Dona, A., Lamy Lamy, G. M., Anguessin, B., Fawa, G., & Mapongmetsem, P. M. (2023). Agricultural production systems and climate change ductility enhancement in the Fitri Watershed in Chad. American Journal of Agriculture and Forestry, 11(4), 119–127. [CrossRef]
Figure 1.
Geolocation of the various study sites.
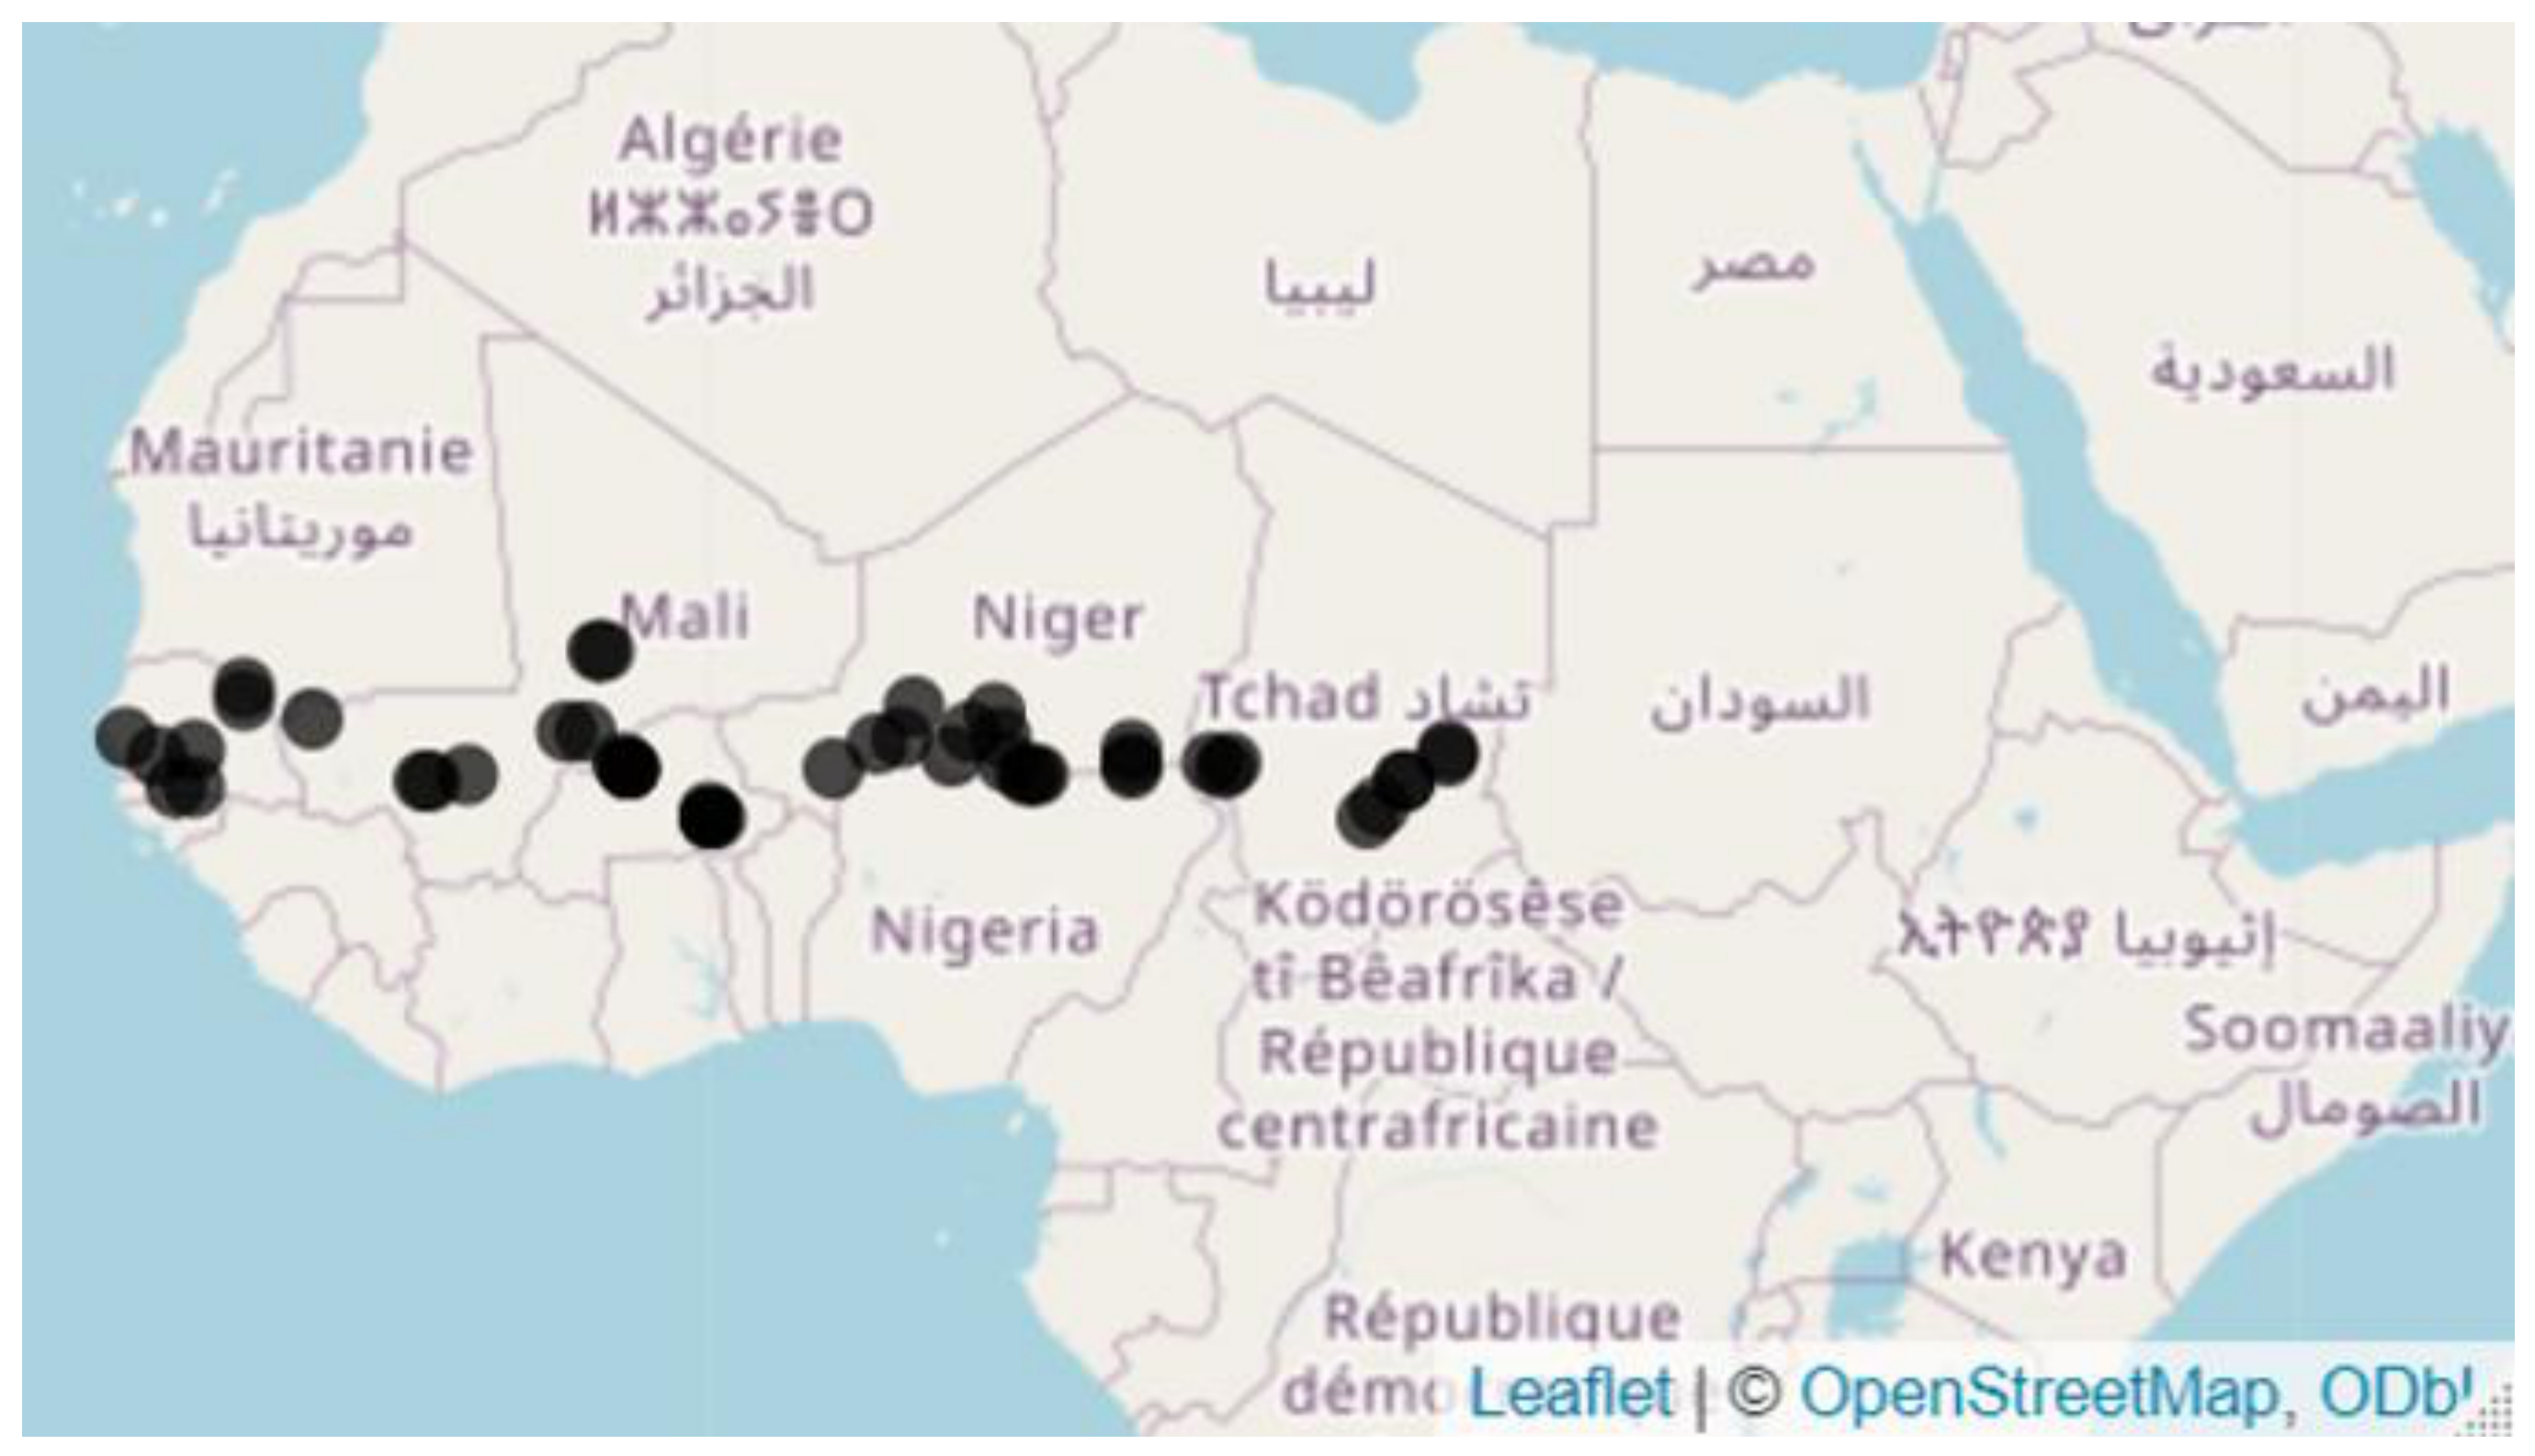
Figure 2.
Soil textural triangle and textural classes. https://passel2.unl.edu/view/lesson/0cff7943f577/2 [14].
Figure 2.
Soil textural triangle and textural classes. https://passel2.unl.edu/view/lesson/0cff7943f577/2 [14].
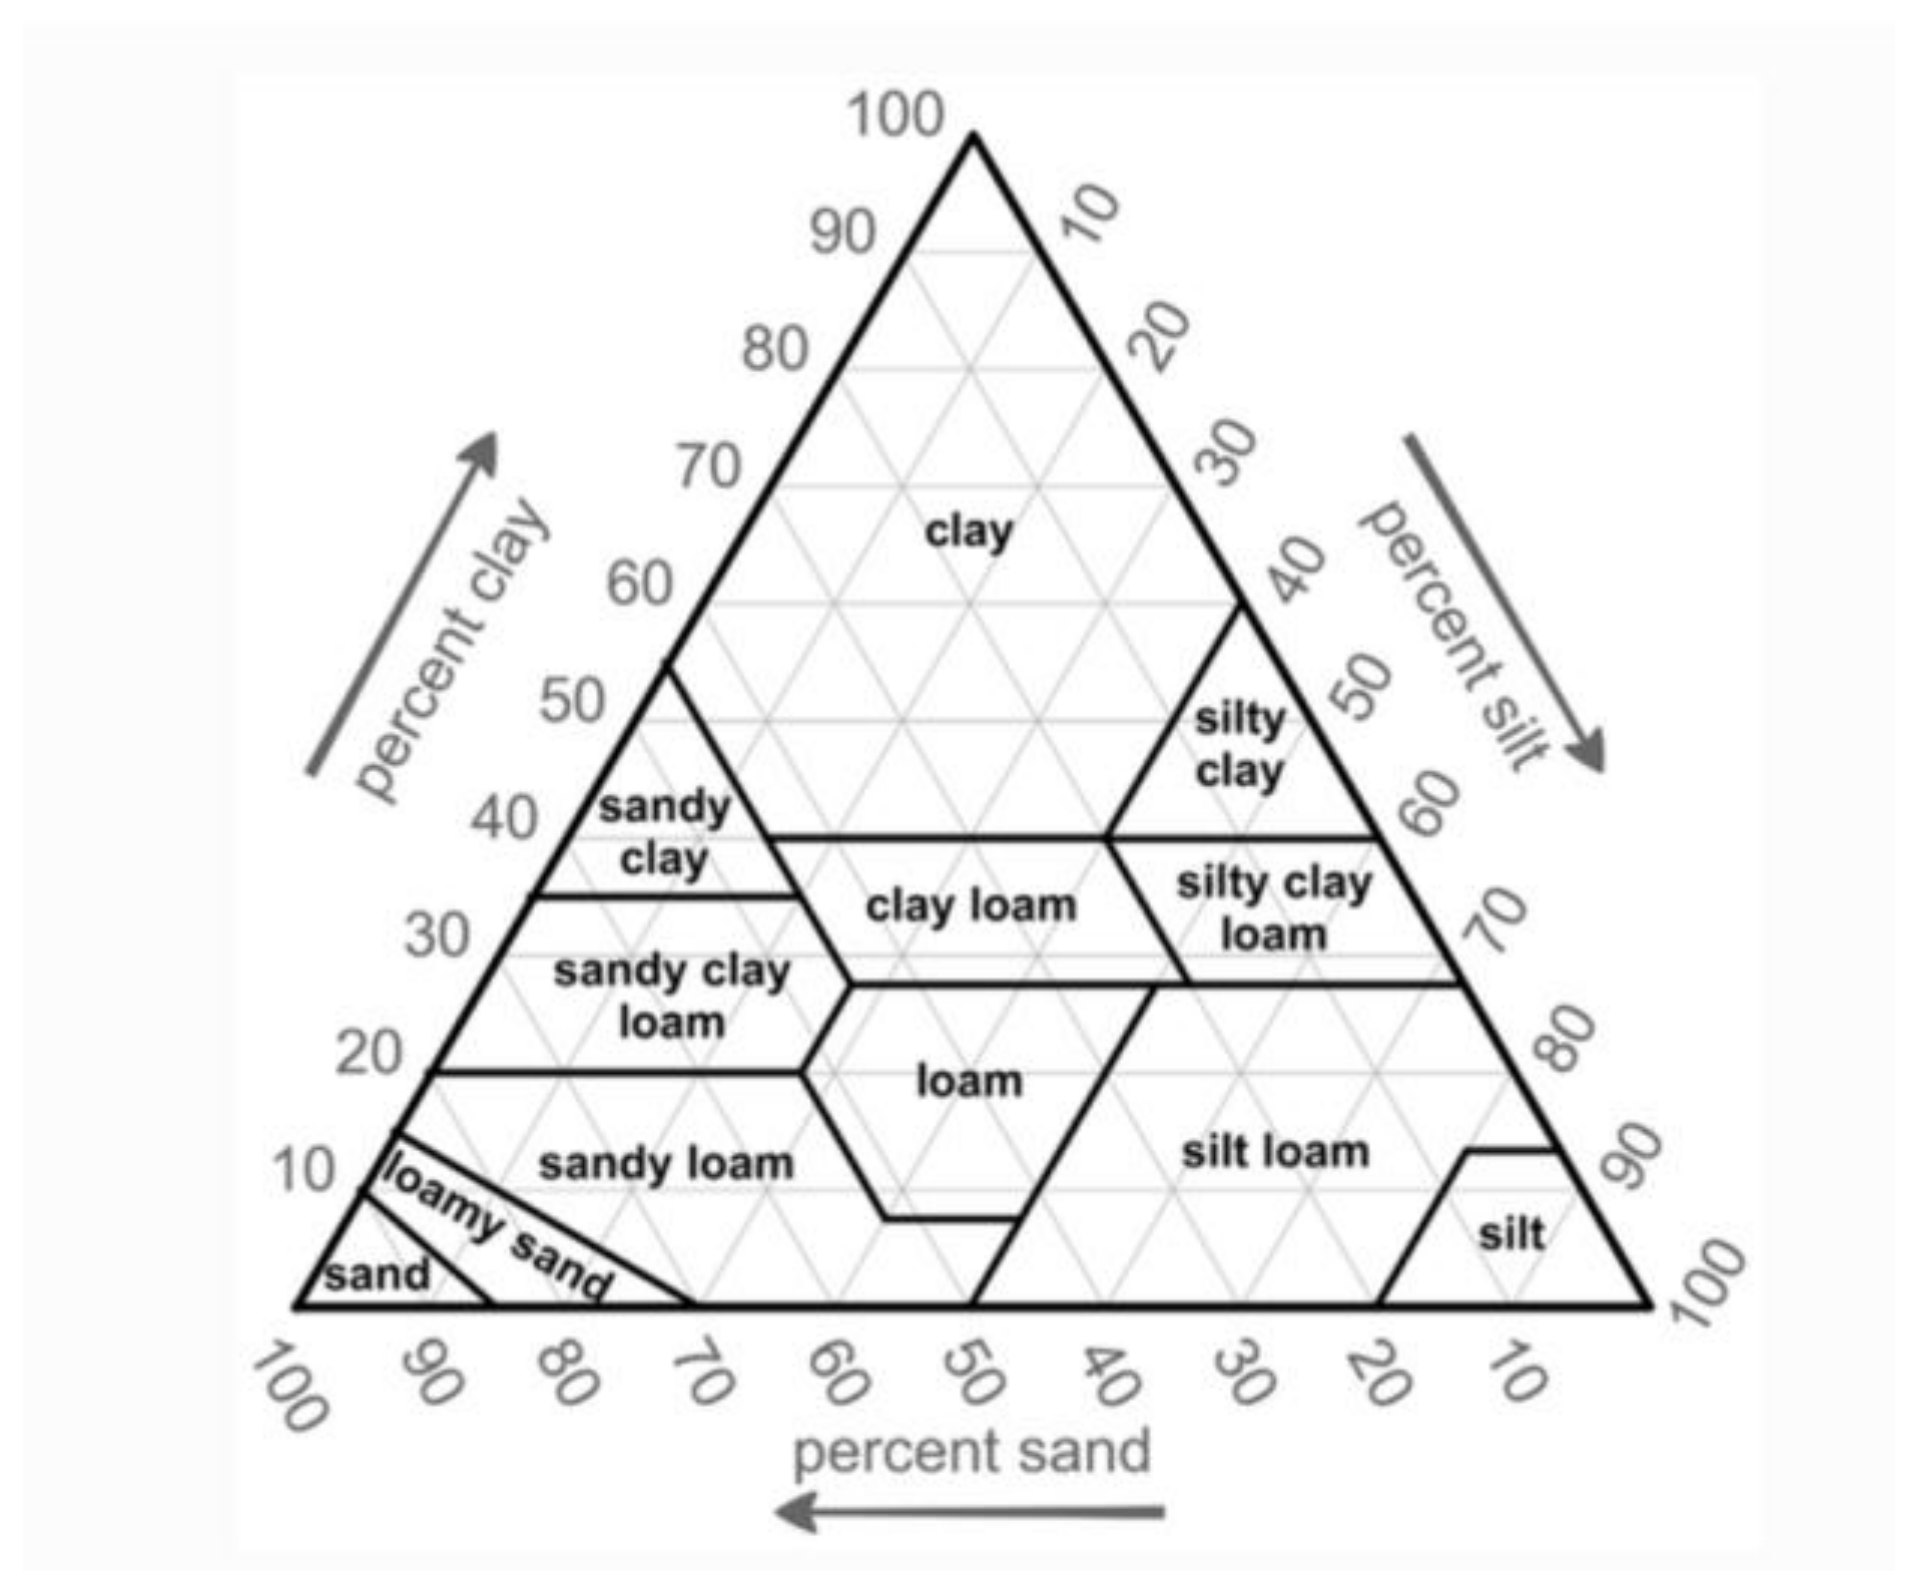
Figure 3.
The study area with map indicating our managed and control soil sampling sites in Burkina Faso, Chad, Mali Niger, and Senegal.
Figure 3.
The study area with map indicating our managed and control soil sampling sites in Burkina Faso, Chad, Mali Niger, and Senegal.
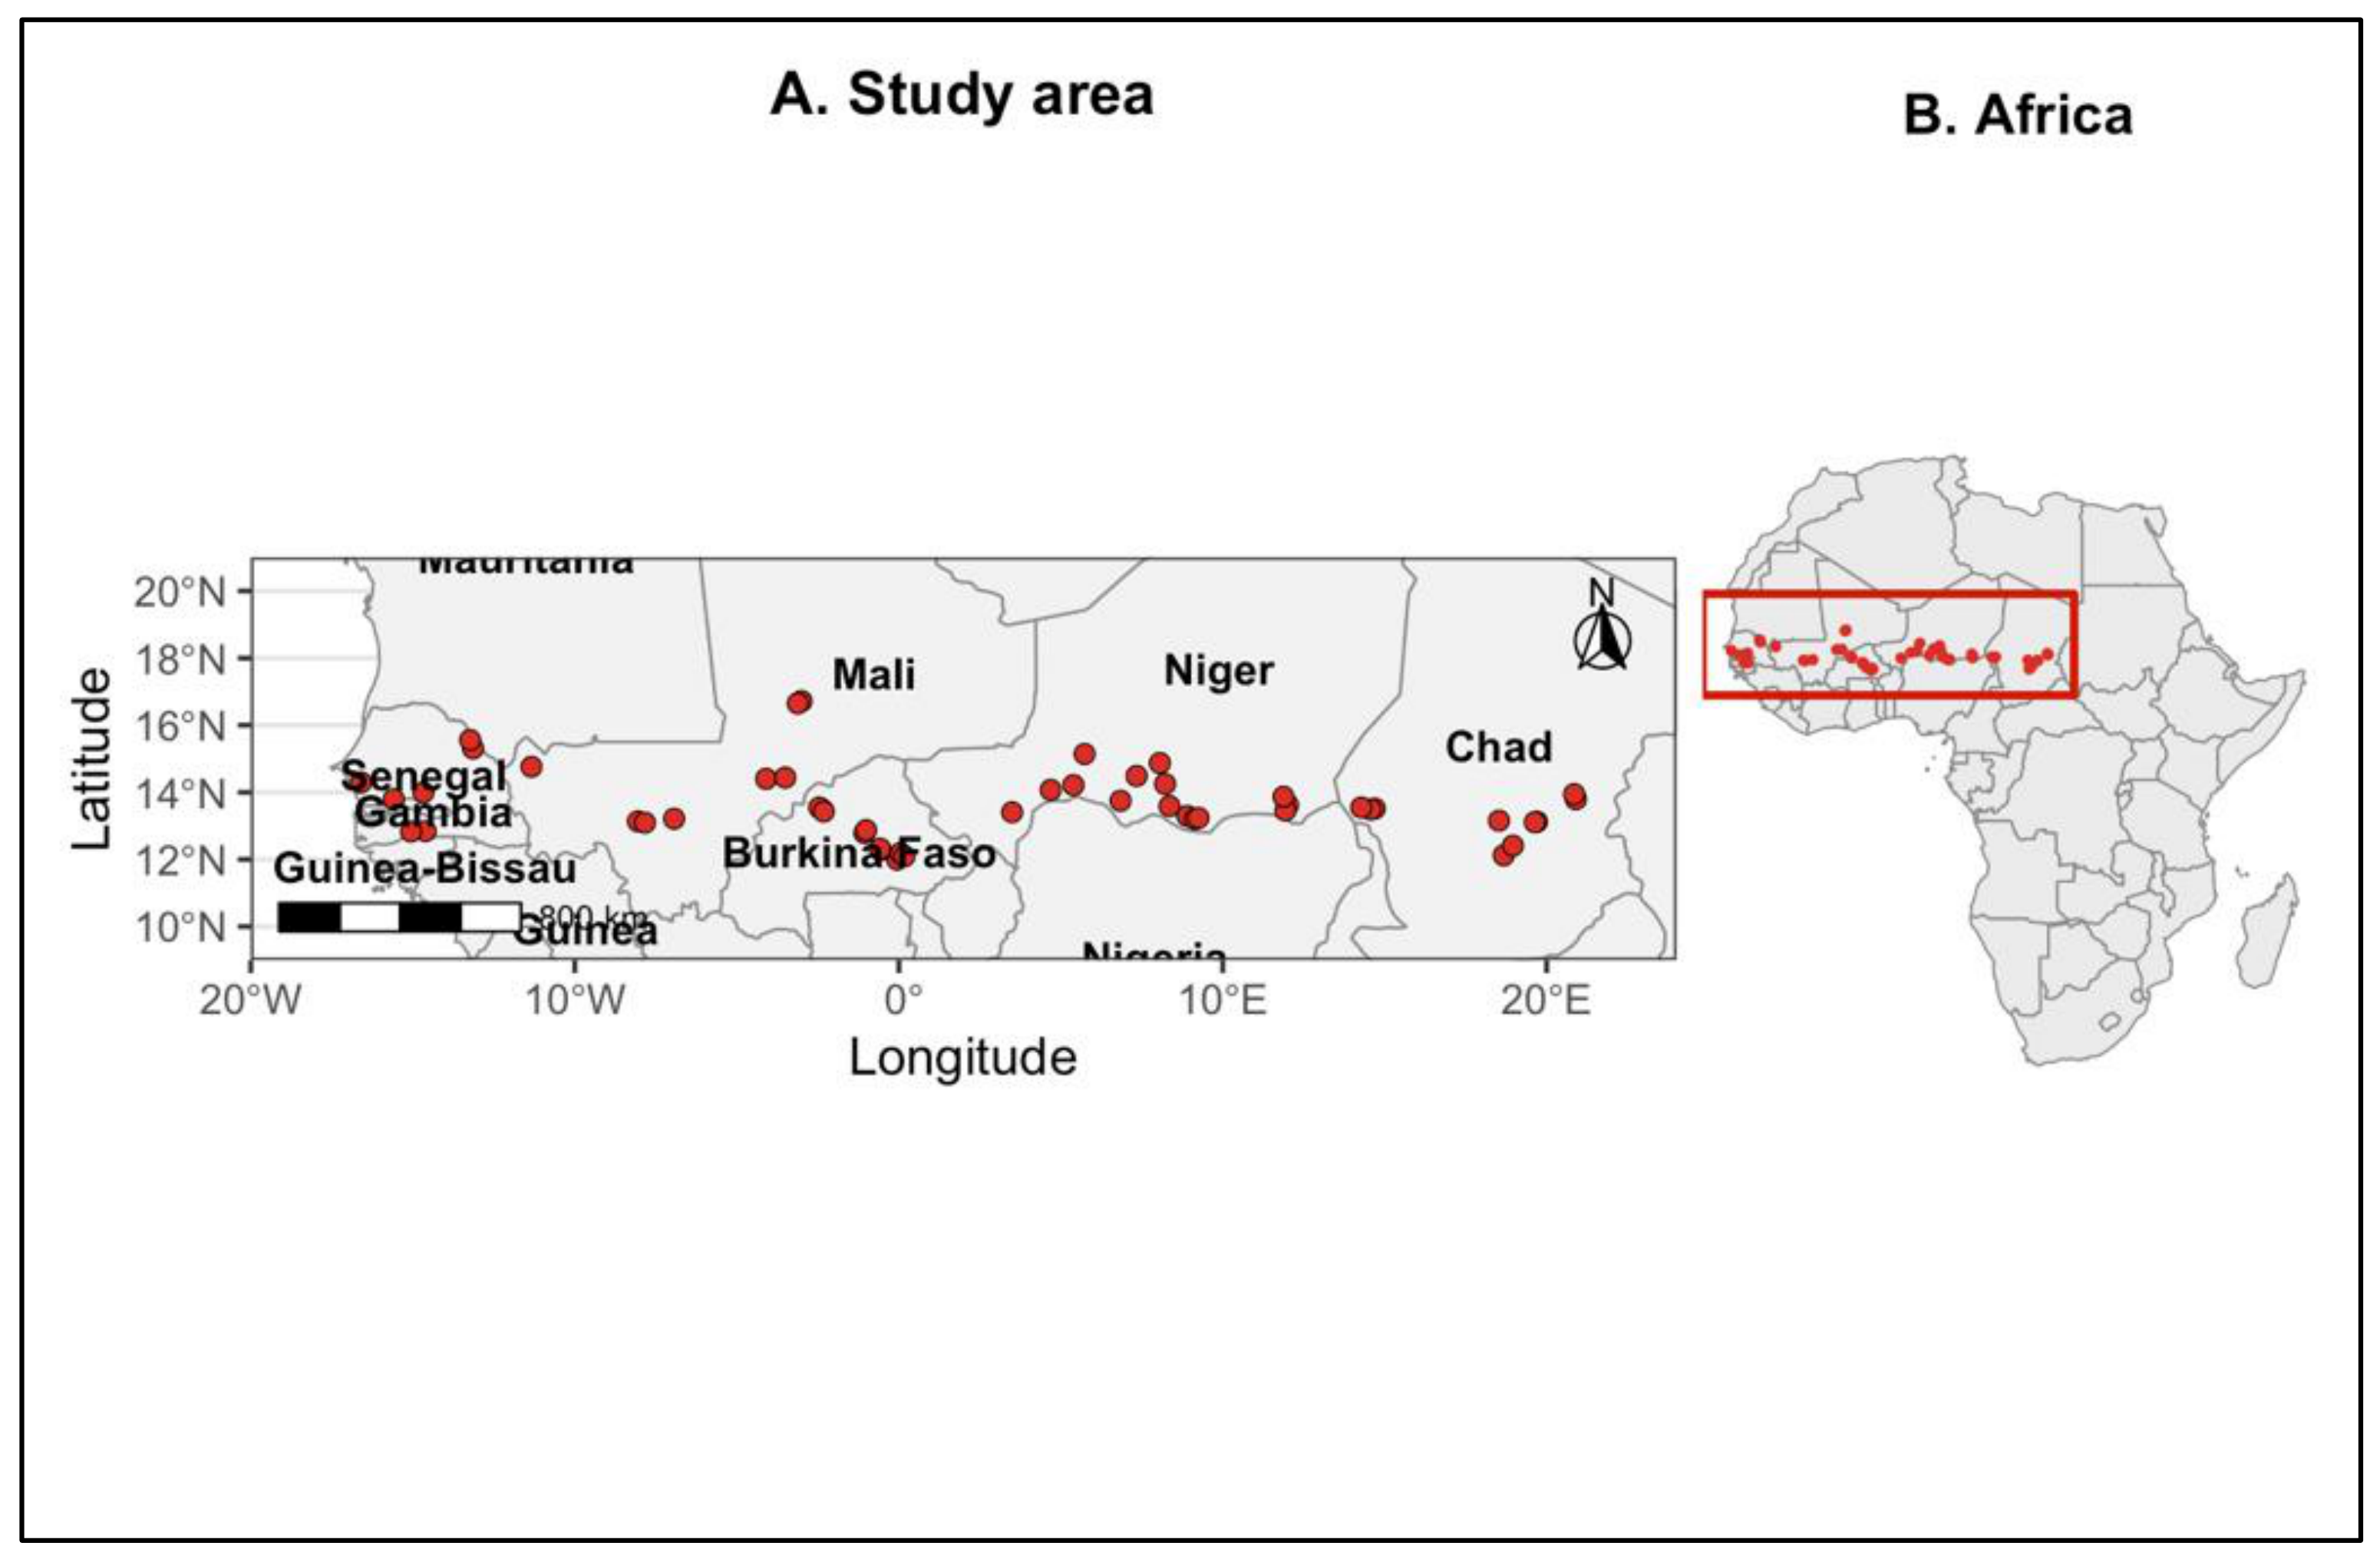
Figure 6.
Improved compost pile (compost only) used at a resilience site in Chad.
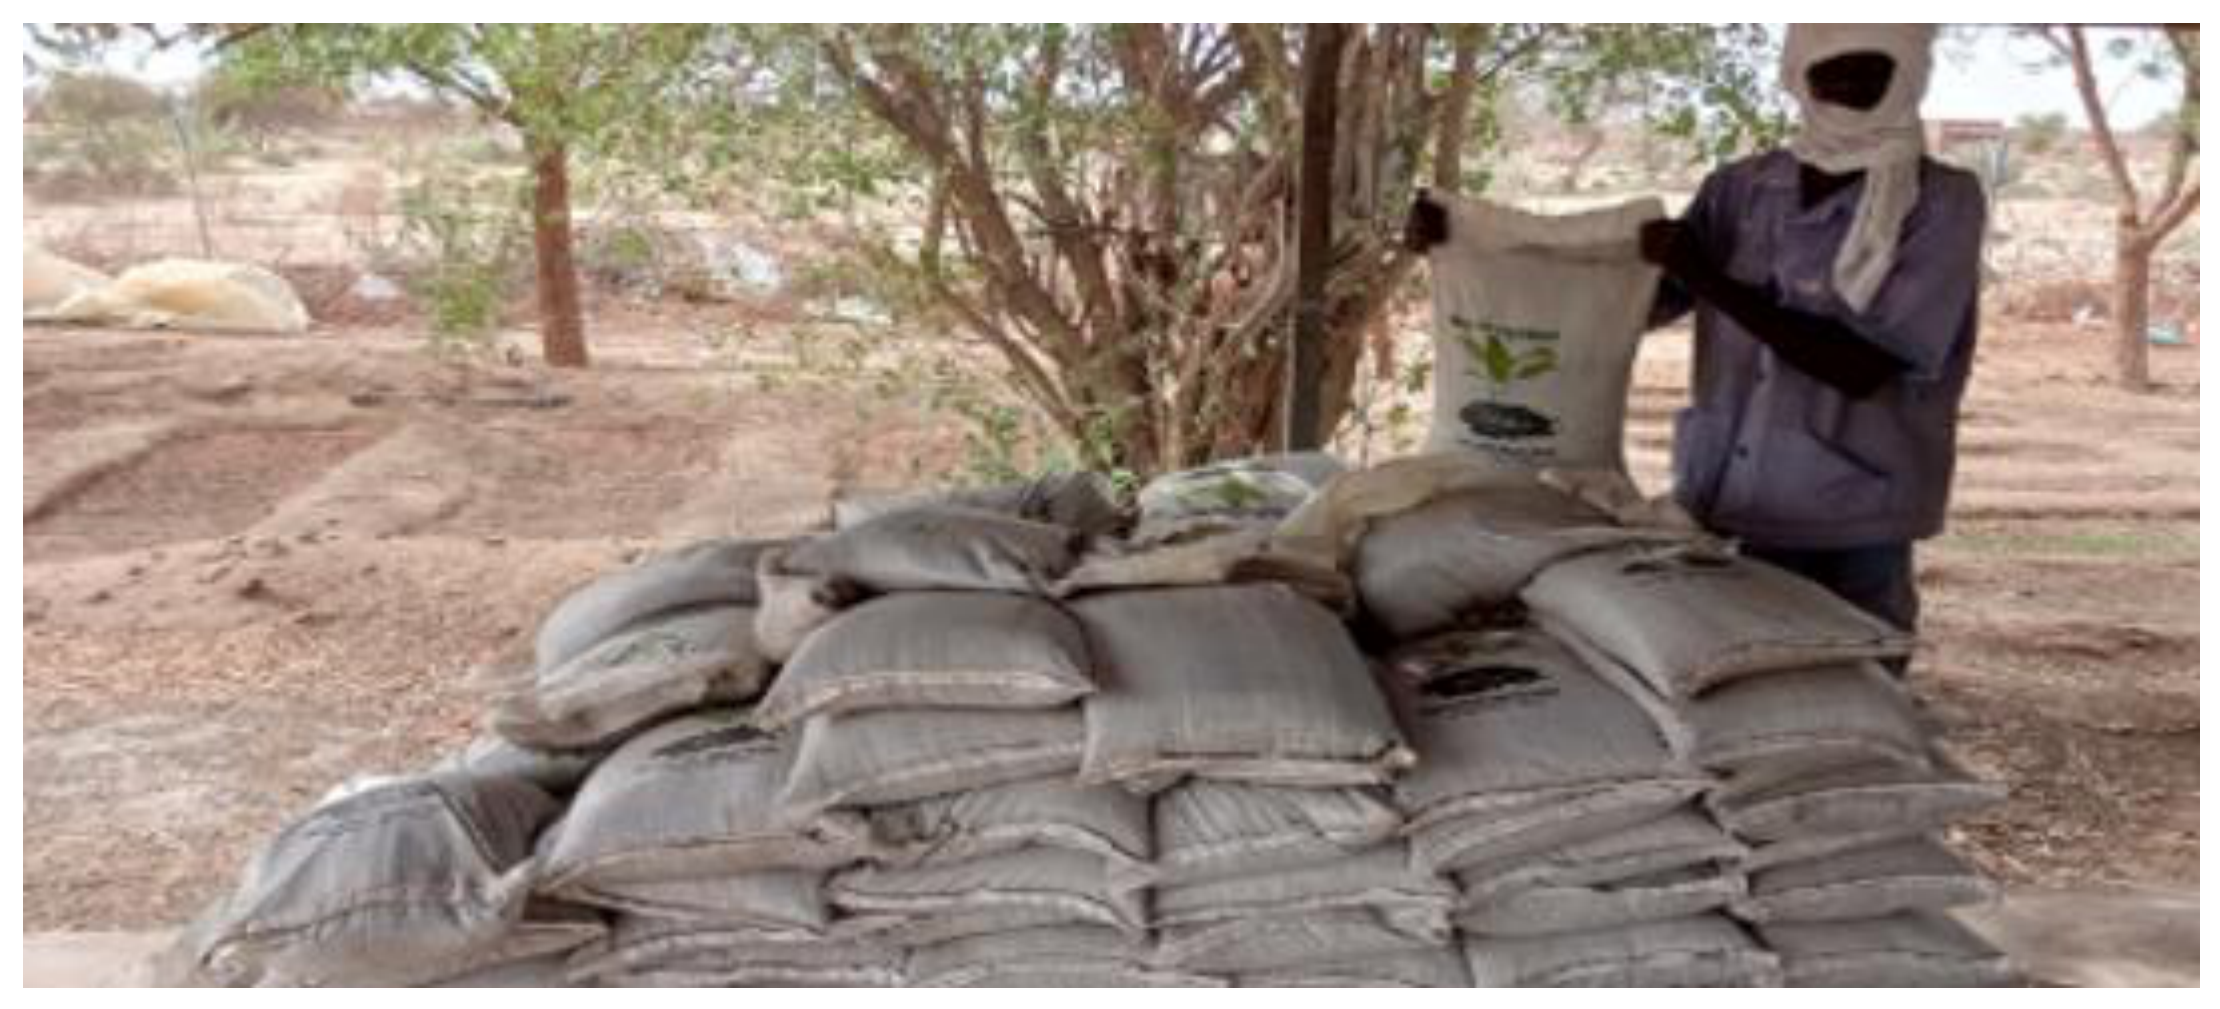
Figure 8.
Comparison of Key Soil Physicochemical Properties Between Managed and Control Sites.
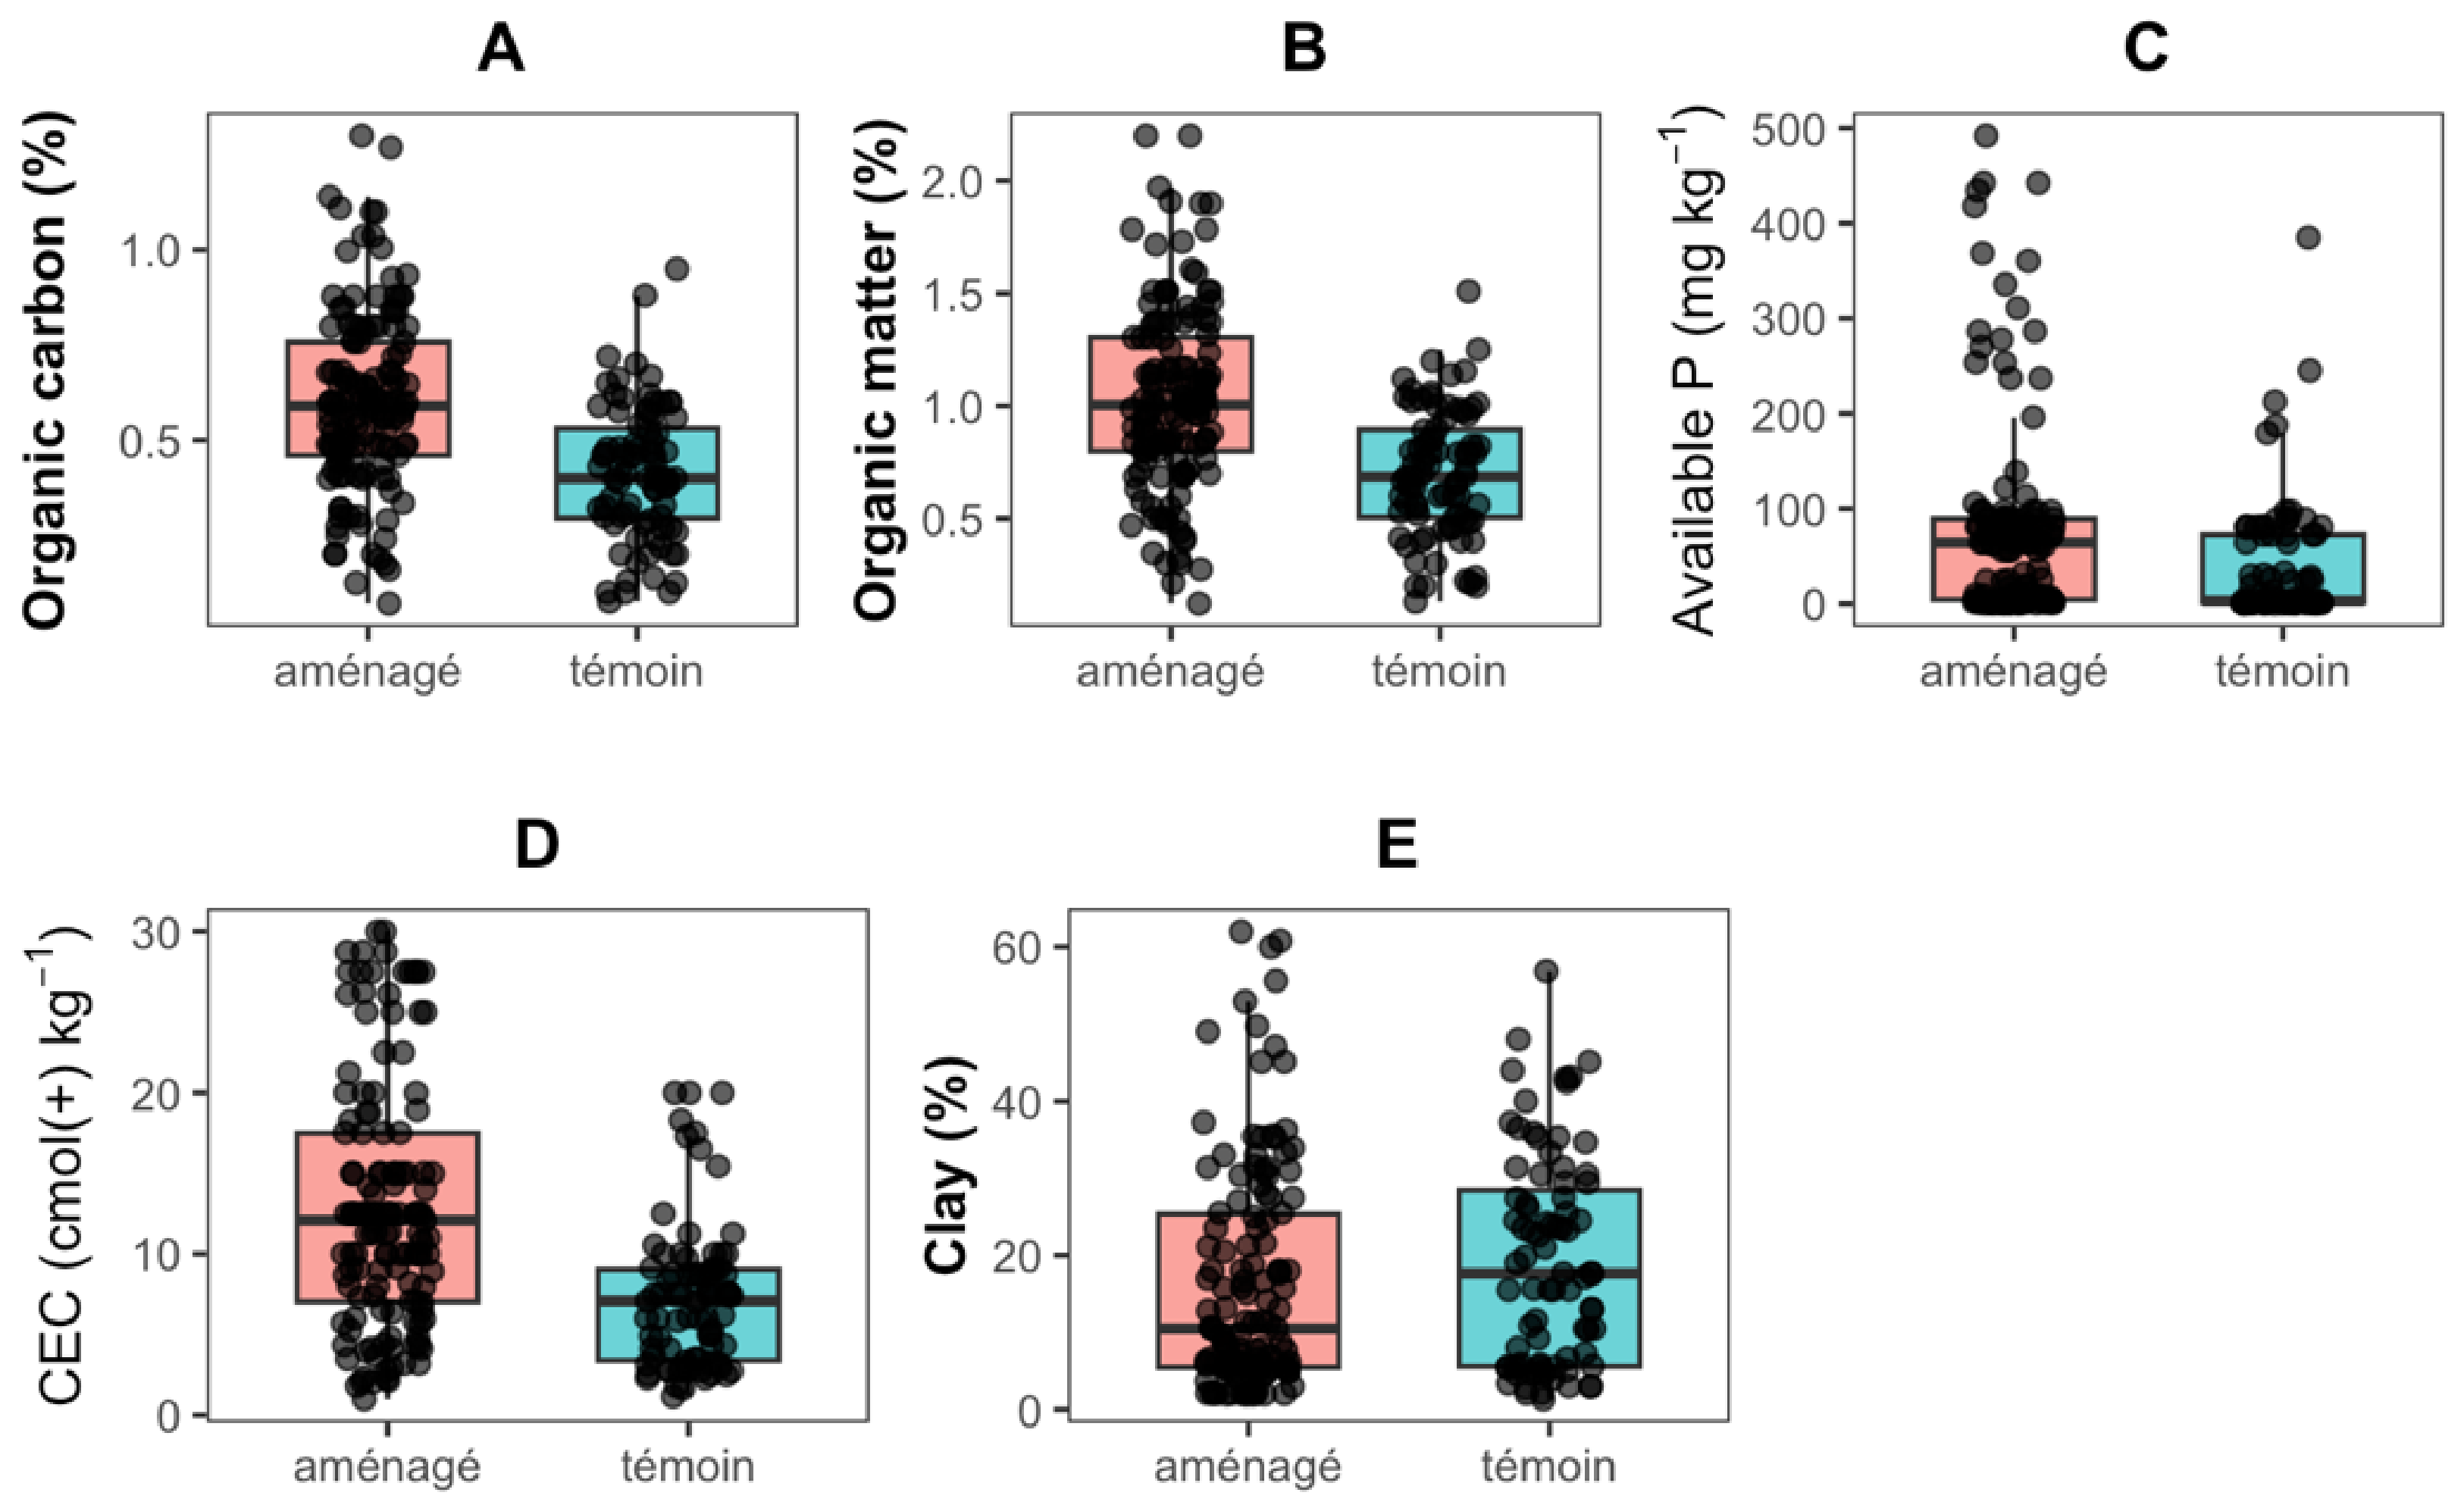
Figure 9.
Correlation circle of soil physicochemical variables based on principal component analysis (PCA). The first two principal components explained 49.2% of the total variance (PC1 = 26.0% and PC2 = 23.2%). Arrow length indicates the strength of the correlation between each variable and the principal components, whereas arrow direction reflects the relationships among soil properties. Warmer colors indicate variables with greater contributions to the PCA.
Figure 9.
Correlation circle of soil physicochemical variables based on principal component analysis (PCA). The first two principal components explained 49.2% of the total variance (PC1 = 26.0% and PC2 = 23.2%). Arrow length indicates the strength of the correlation between each variable and the principal components, whereas arrow direction reflects the relationships among soil properties. Warmer colors indicate variables with greater contributions to the PCA.
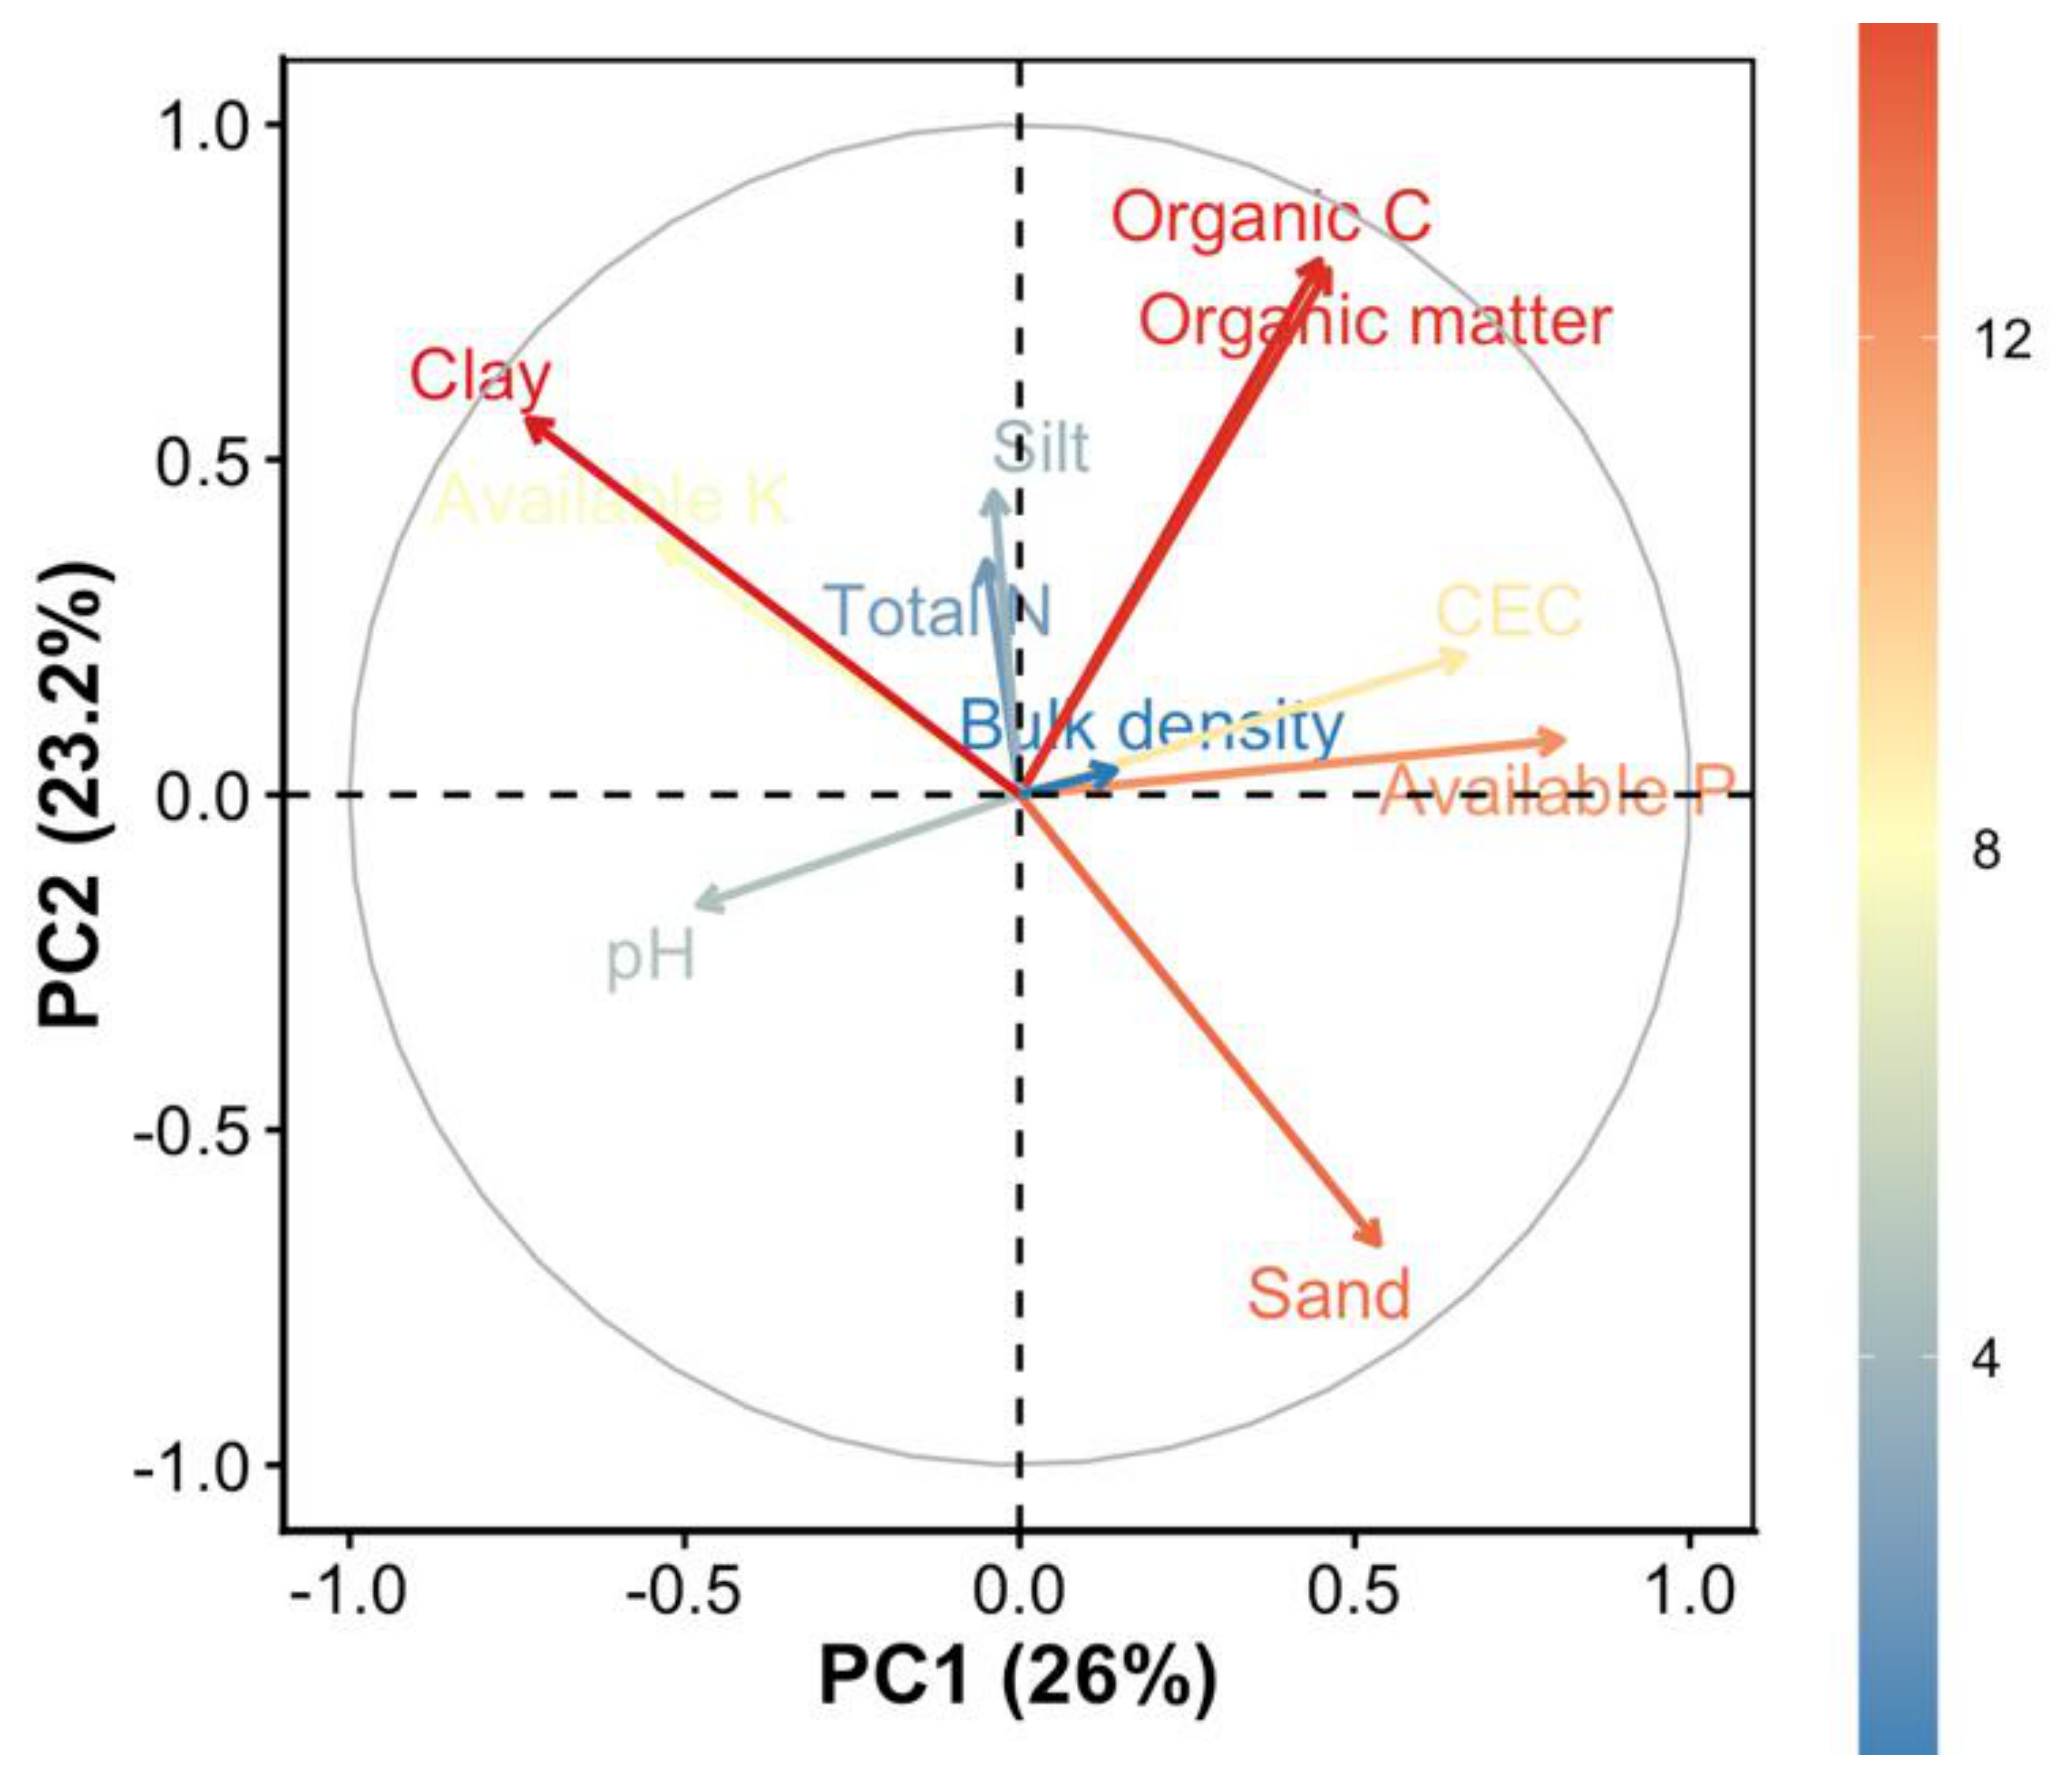
Figure 10.
PCA biplot of soil samples and physicochemical variables according to land management. Soil samples from managed and control sites are projected onto the first two principal components. Arrows represent the loadings of soil physicochemical variables, while ellipses indicate the 95% confidence intervals around the group centroids.
Figure 10.
PCA biplot of soil samples and physicochemical variables according to land management. Soil samples from managed and control sites are projected onto the first two principal components. Arrows represent the loadings of soil physicochemical variables, while ellipses indicate the 95% confidence intervals around the group centroids.
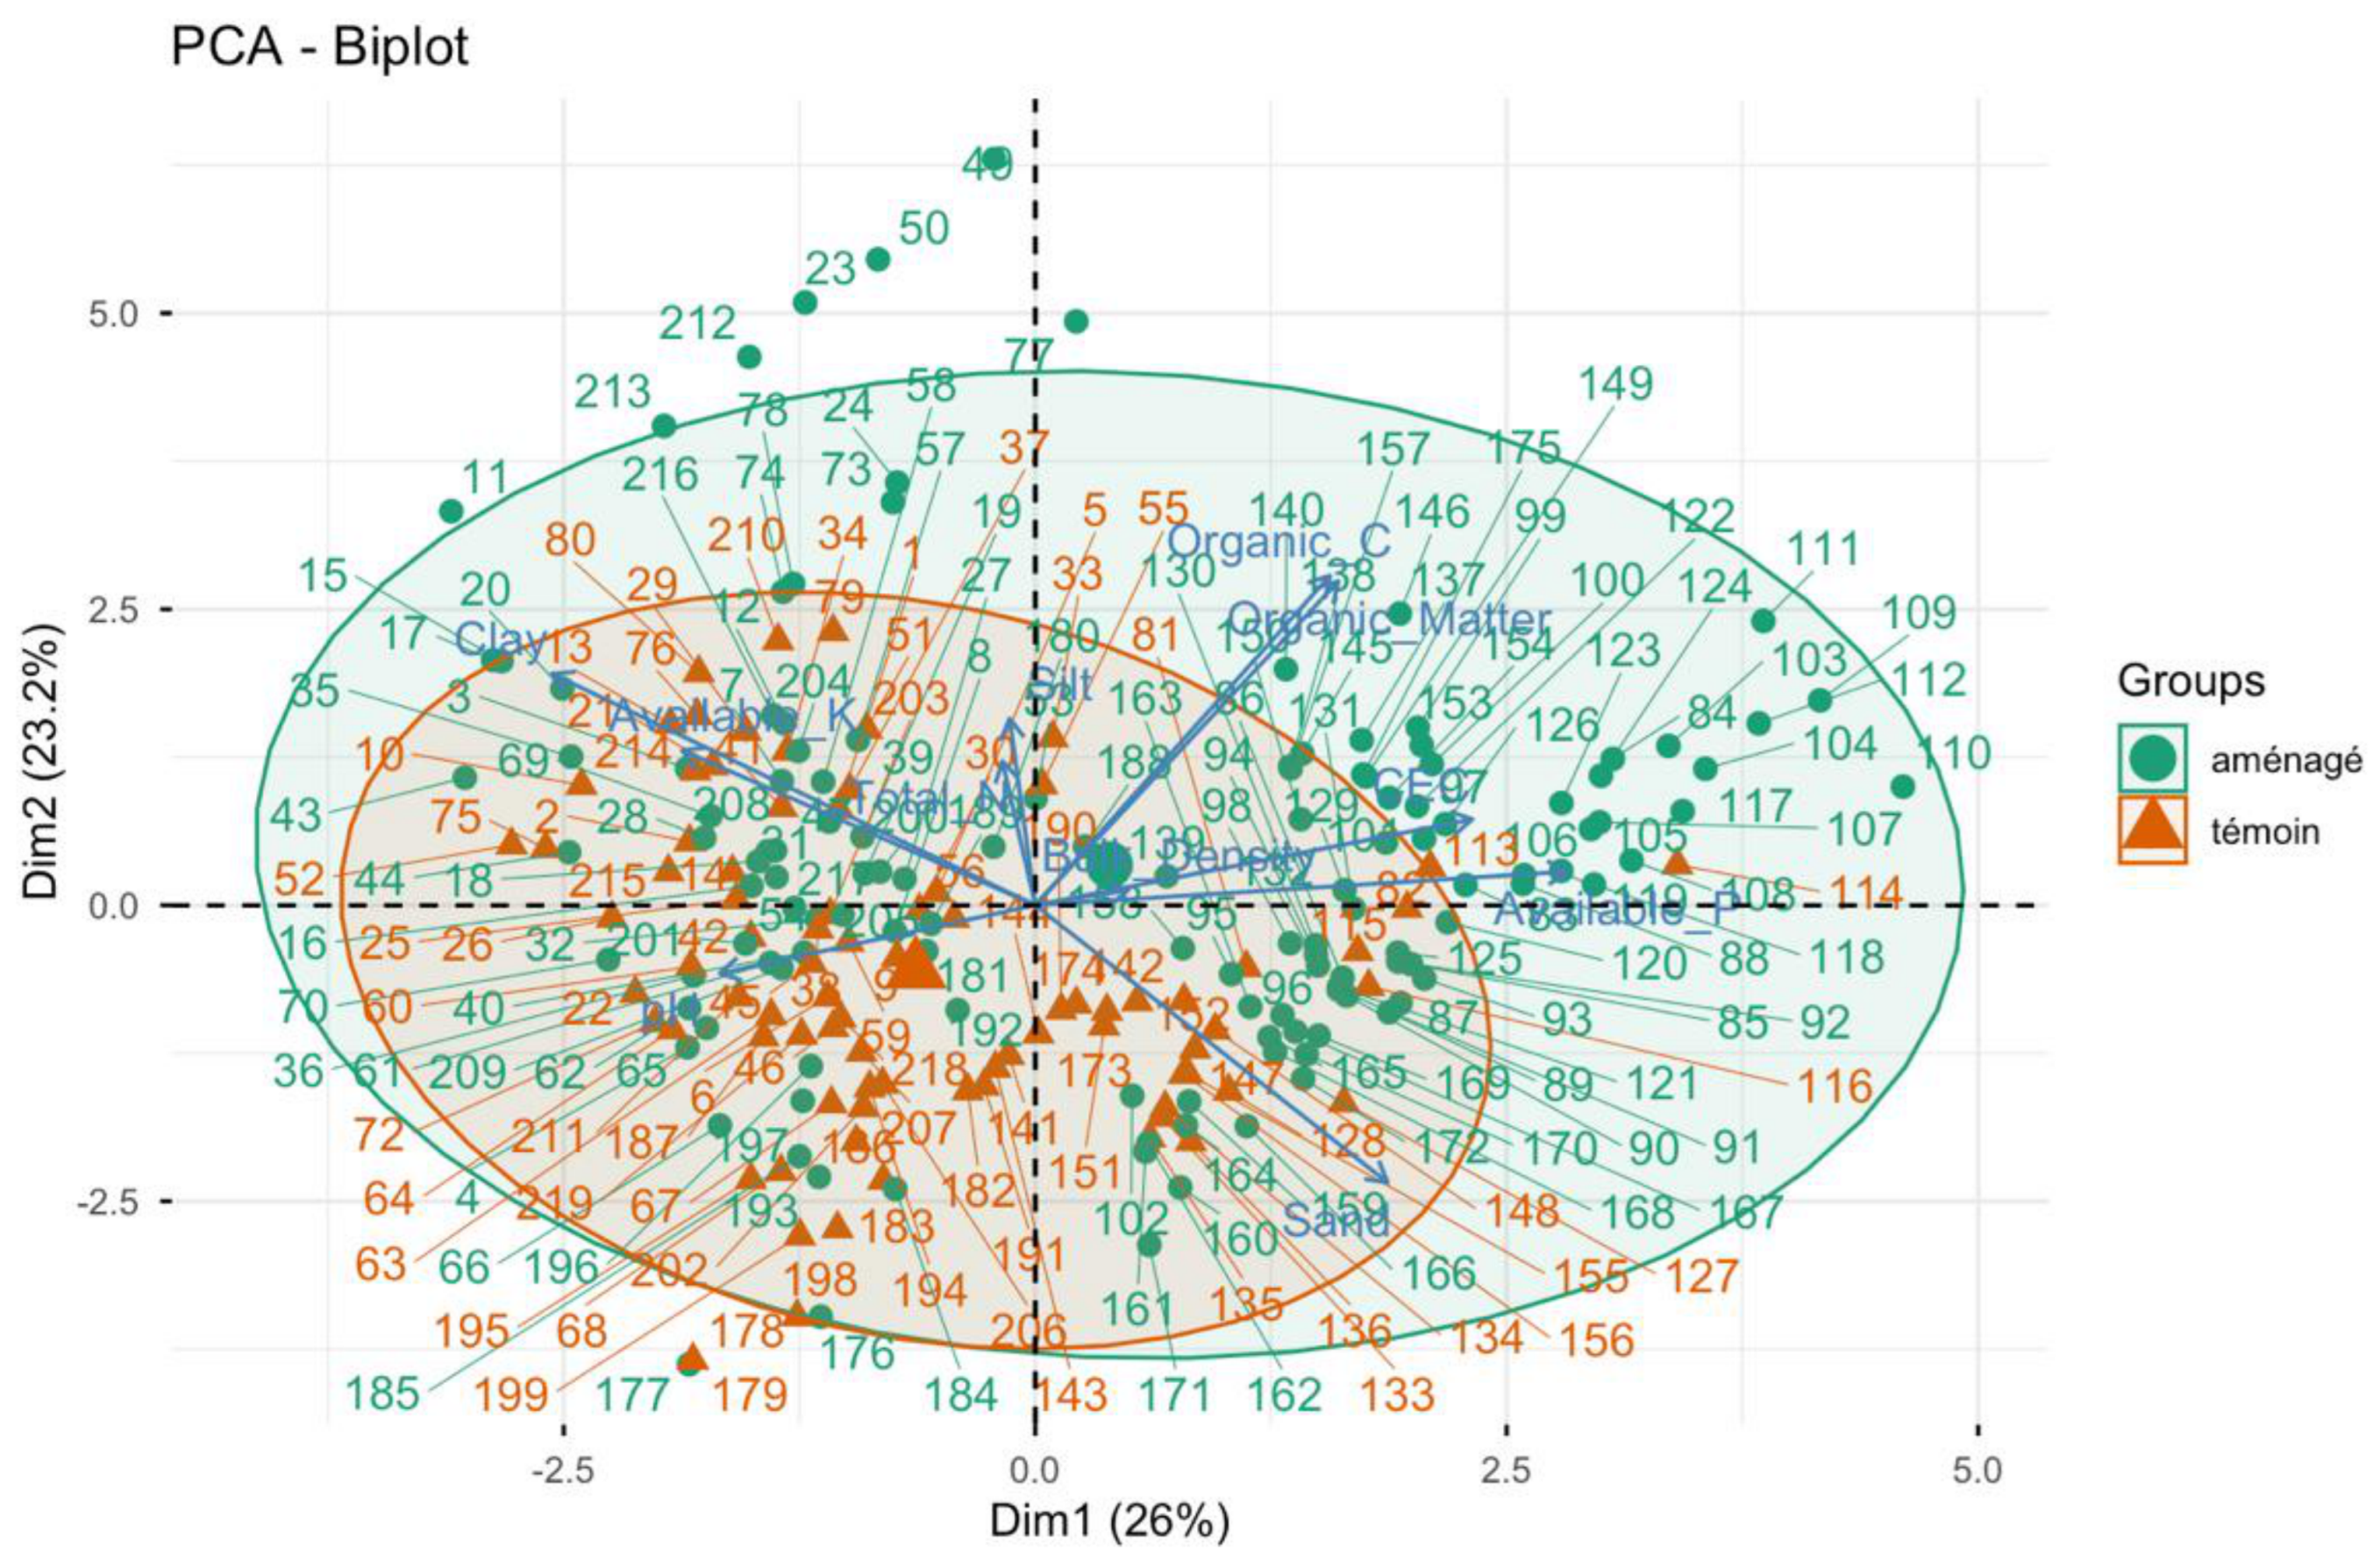
Figure 11.
Hierarchical clustering of soil samples projected onto the PCA factorial plane. Soil samples were grouped into six clusters using hierarchical clustering on principal components (HCPC). Colours represent the six clusters, and polygons delimit the distribution of samples within each cluster in the PCA space defined by the first two principal components (PC1 = 26.0% and PC2 = 23.2%).
Figure 11.
Hierarchical clustering of soil samples projected onto the PCA factorial plane. Soil samples were grouped into six clusters using hierarchical clustering on principal components (HCPC). Colours represent the six clusters, and polygons delimit the distribution of samples within each cluster in the PCA space defined by the first two principal components (PC1 = 26.0% and PC2 = 23.2%).
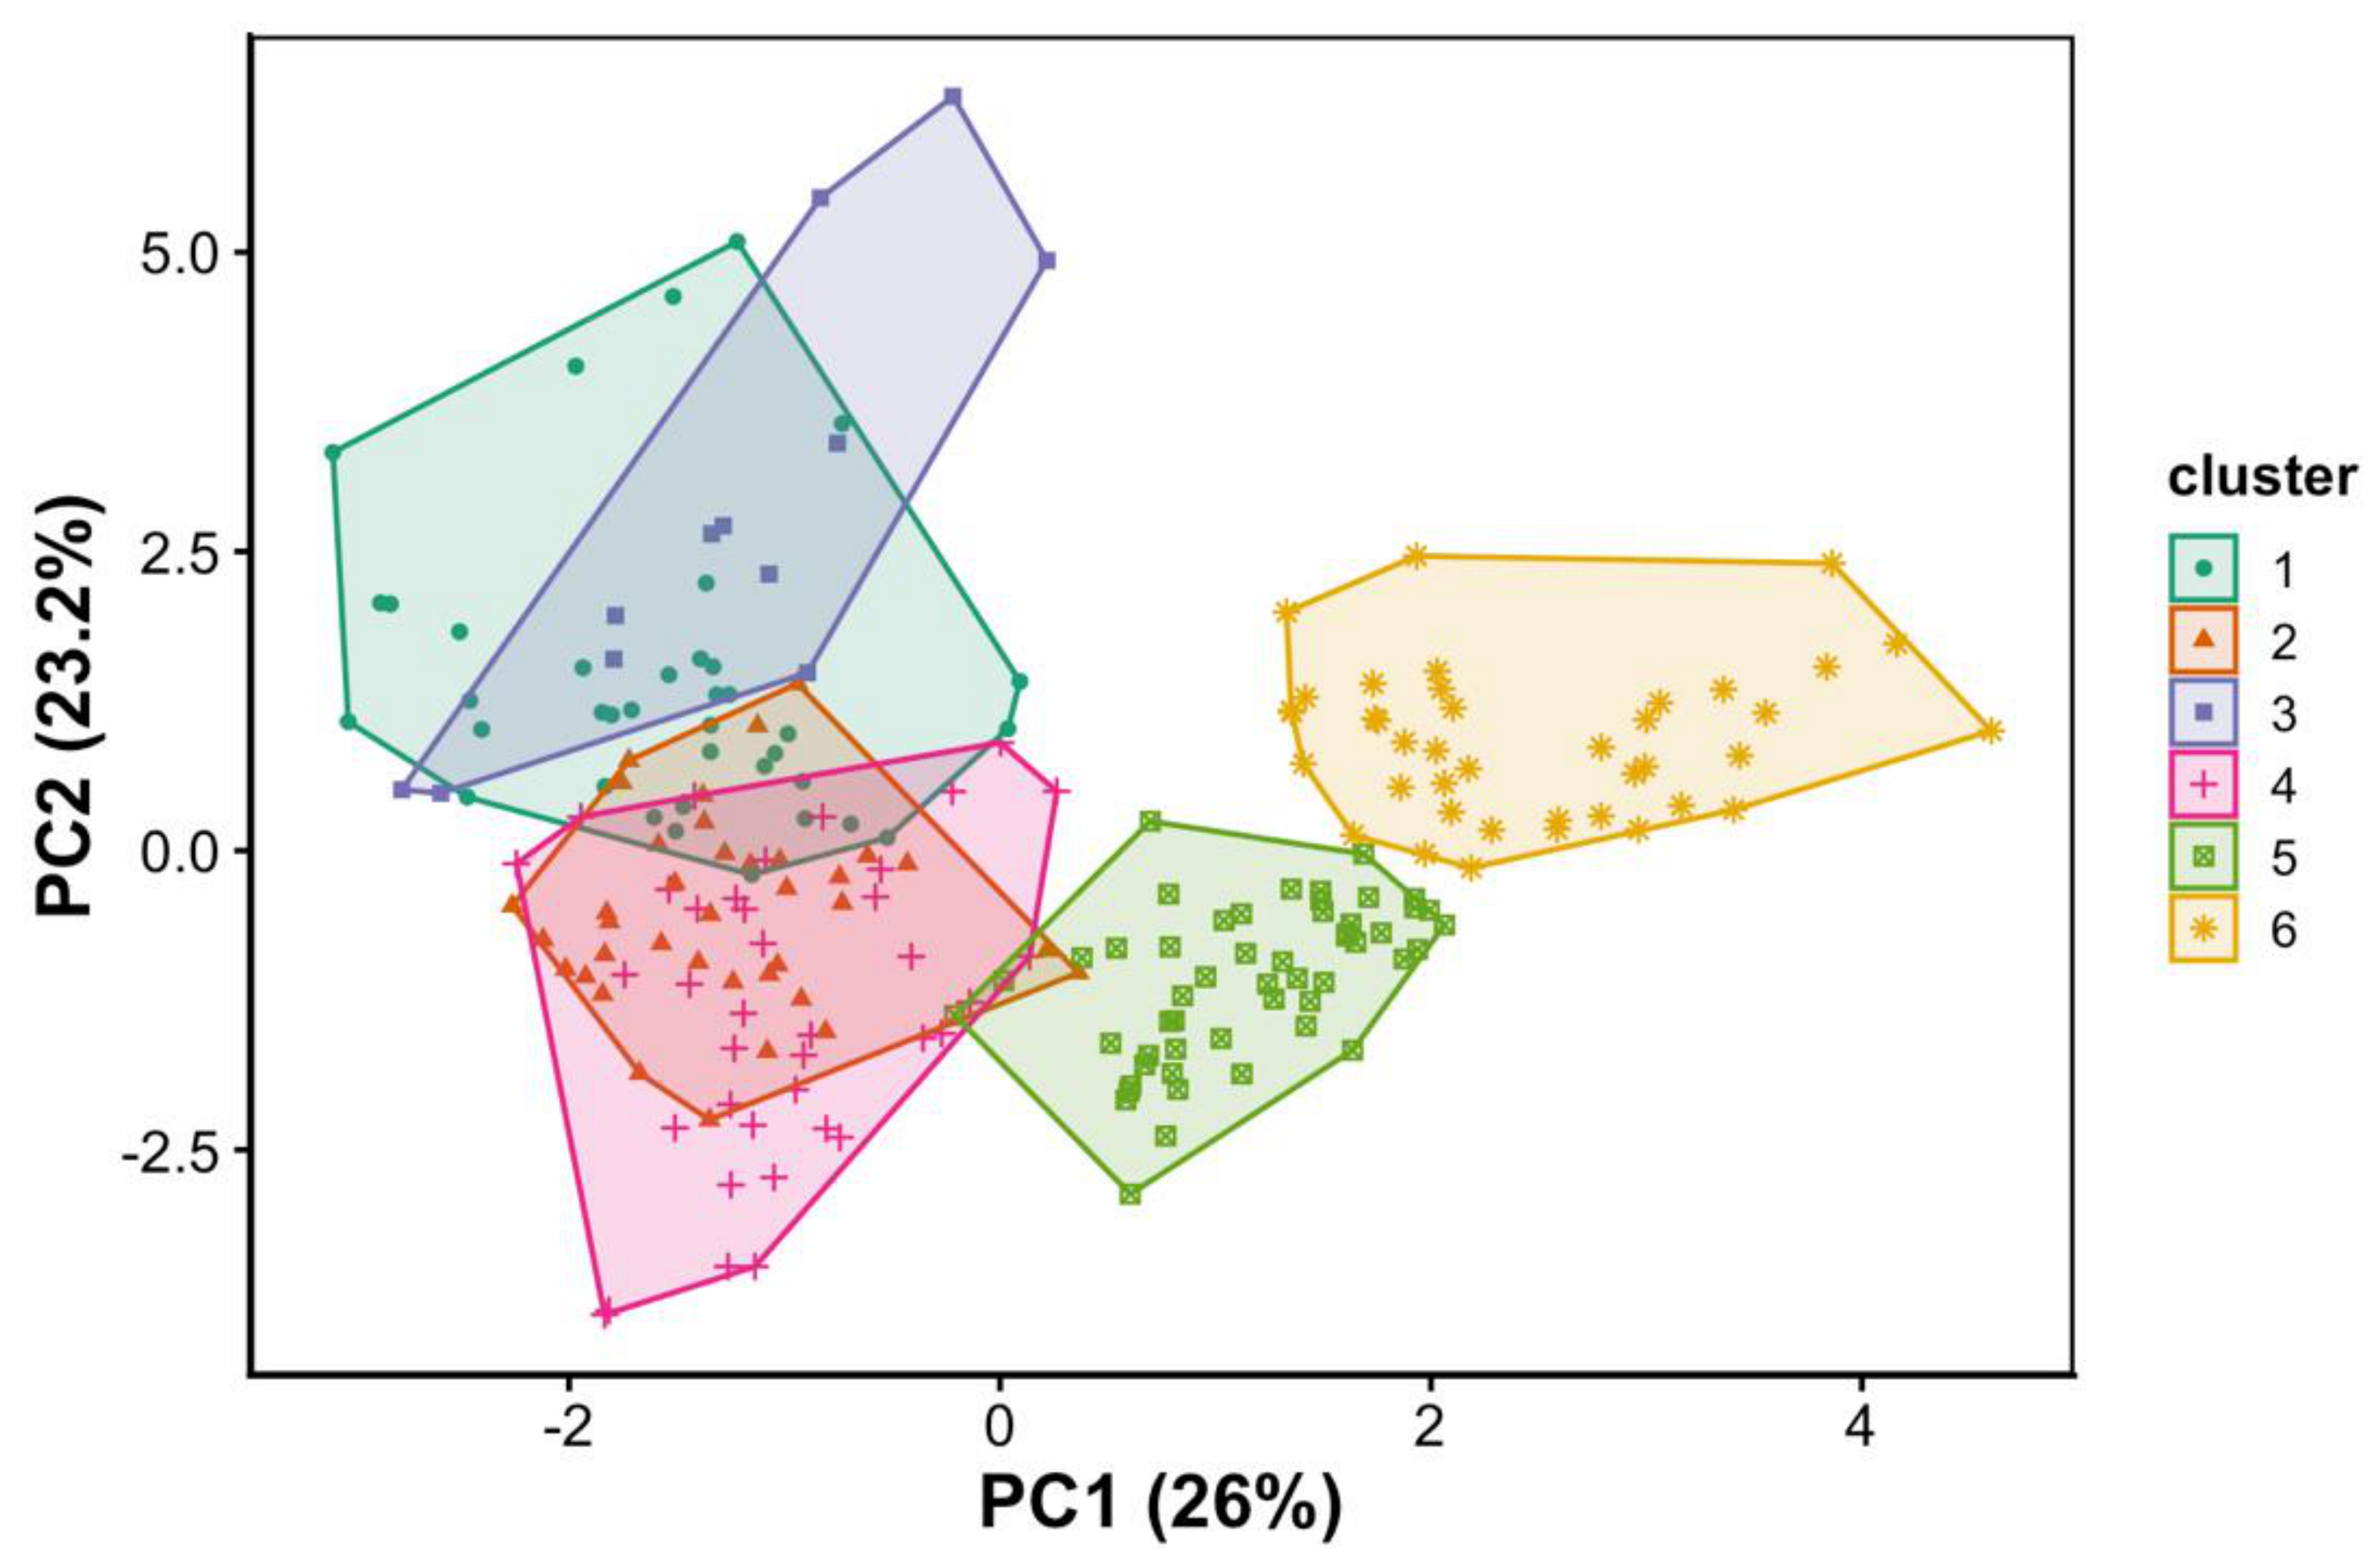
Figure 12.
Heatmap of standardized soil physicochemical properties across the six HCPC clusters. Colors represent standardized mean values (Z-scores) of each soil property within each cluster. Red indicates values above the overall mean, whereas blue indicates values below the overall mean.
Figure 12.
Heatmap of standardized soil physicochemical properties across the six HCPC clusters. Colors represent standardized mean values (Z-scores) of each soil property within each cluster. Red indicates values above the overall mean, whereas blue indicates values below the overall mean.
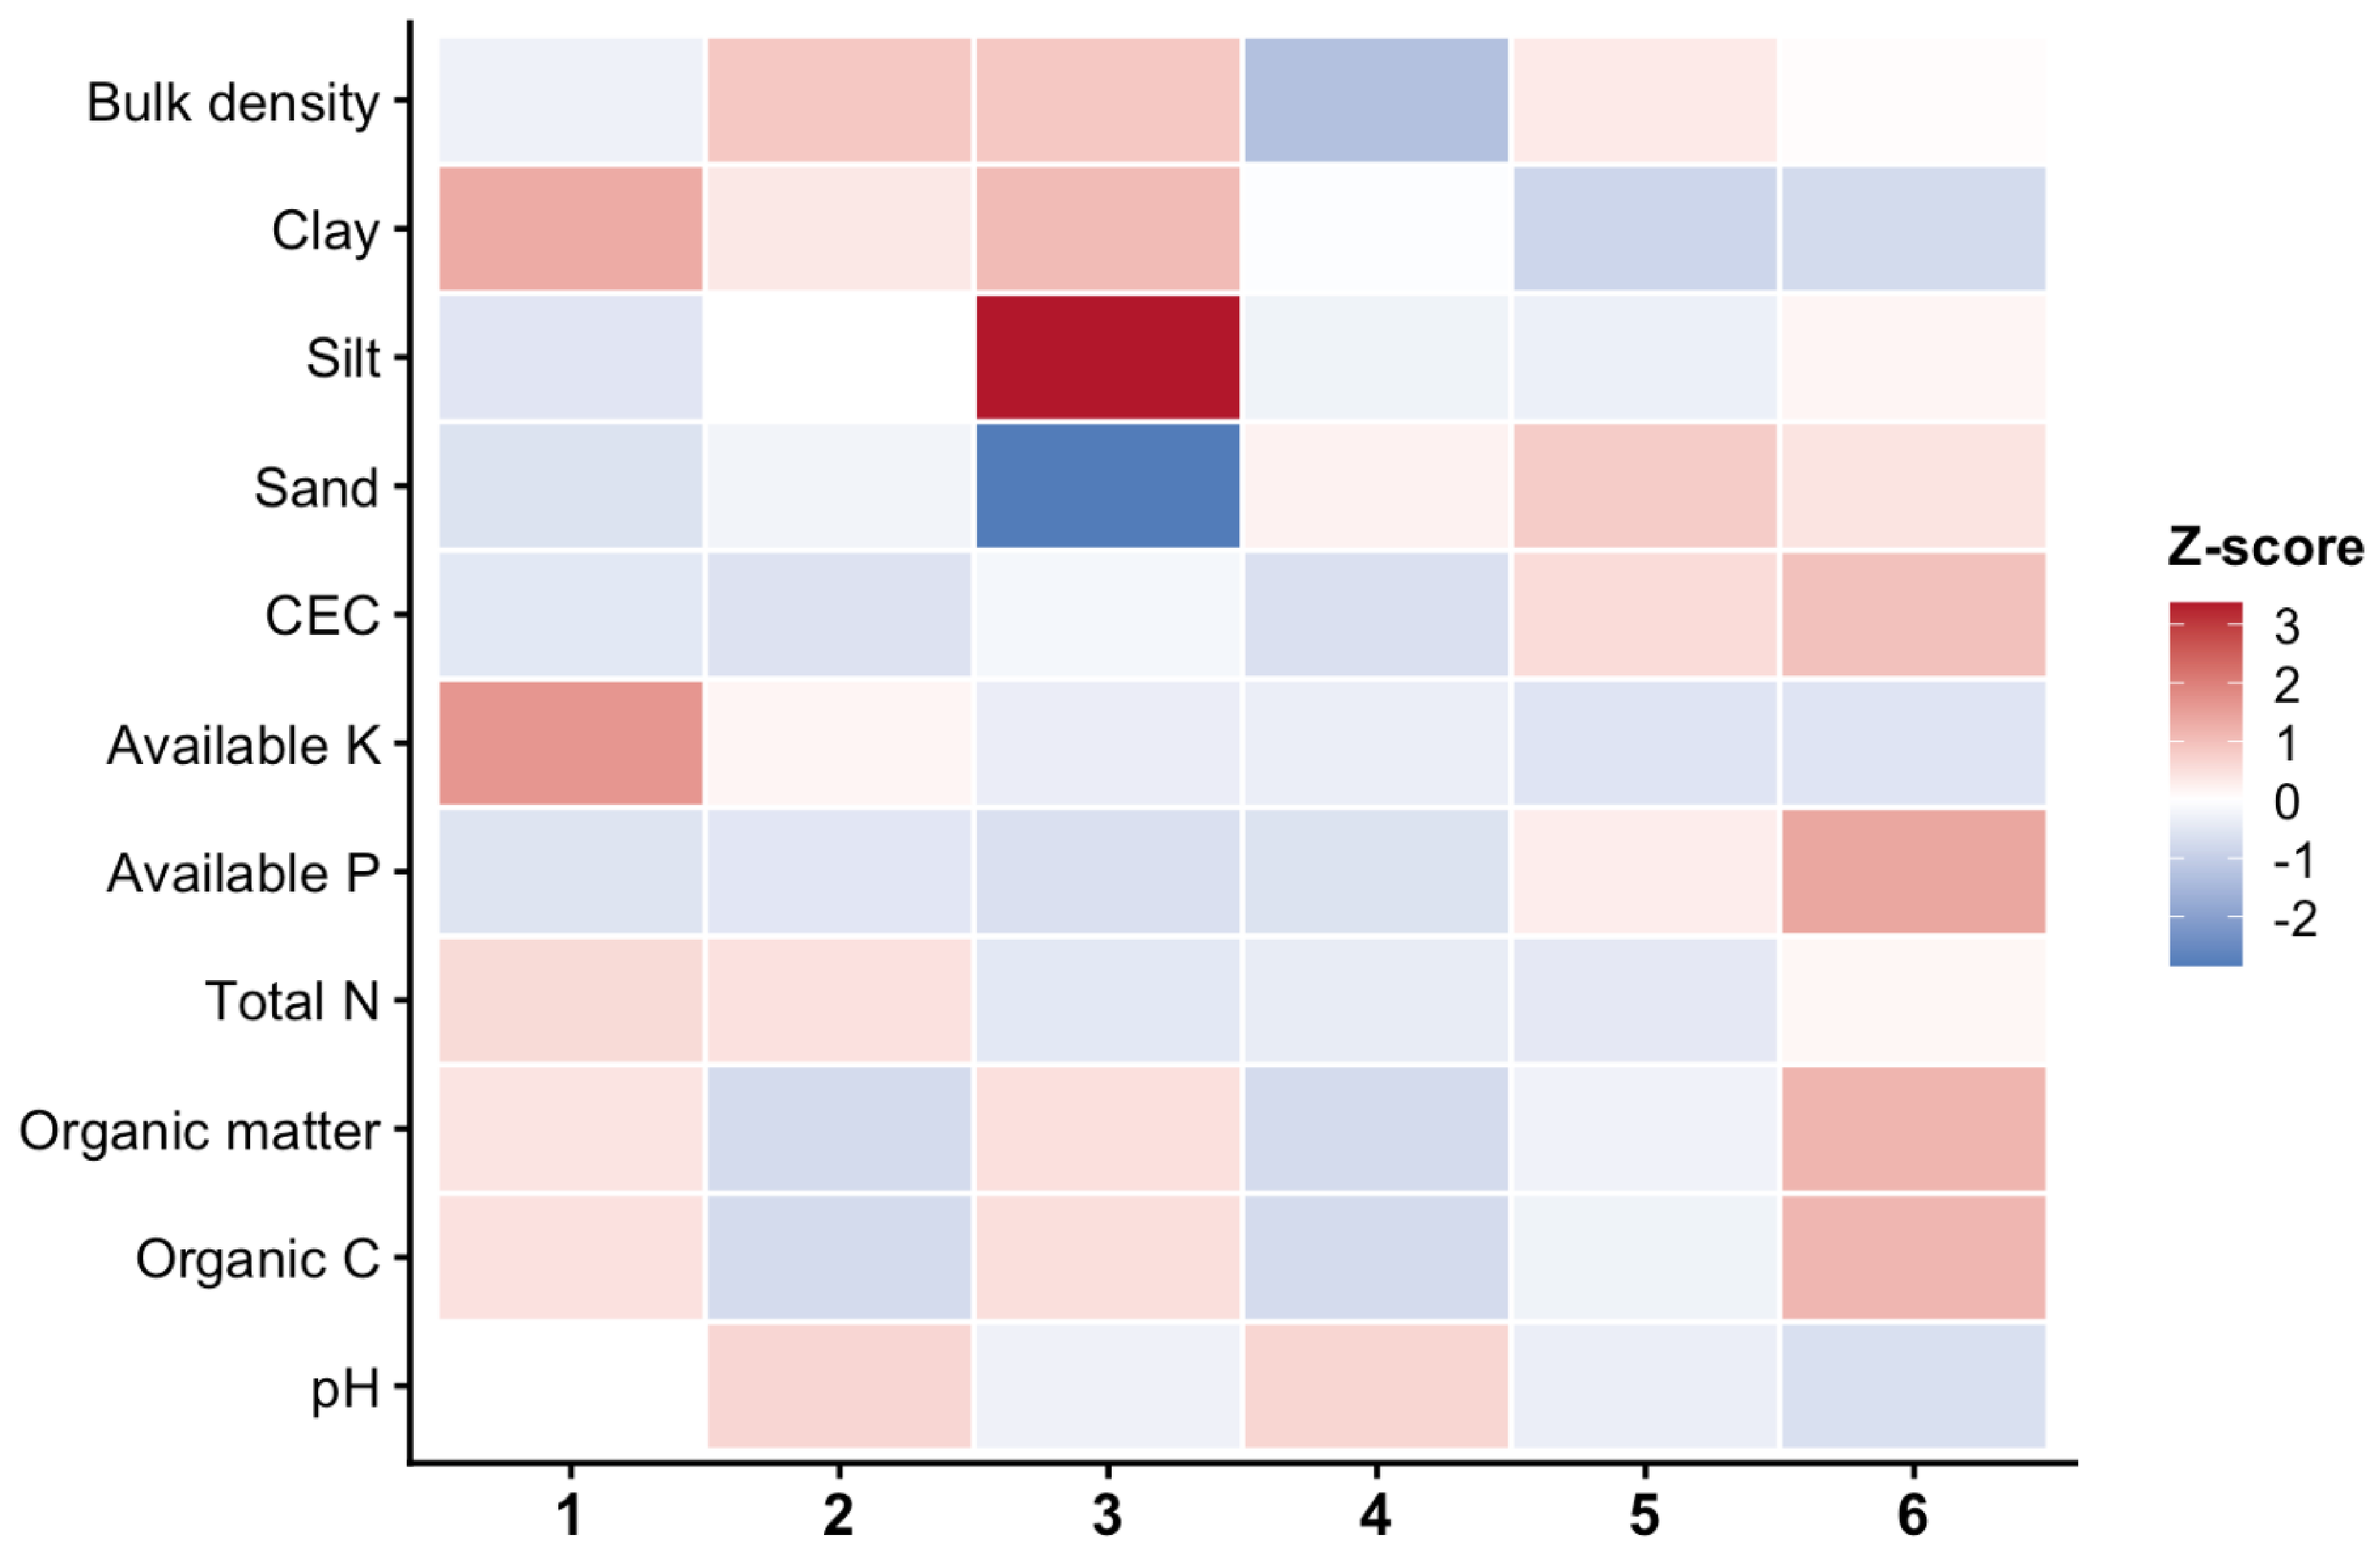
Figure 13.
Relationship between country and soil physicochemical clusters identified by hierarchical clustering on principal components (HCPC). The width of each flow is proportional to the number of soil samples assigned to each cluster. The Figure 7 highlights the strong geographical structuring of the six soil physicochemical profiles across the five Sahelian countries.
Figure 13.
Relationship between country and soil physicochemical clusters identified by hierarchical clustering on principal components (HCPC). The width of each flow is proportional to the number of soil samples assigned to each cluster. The Figure 7 highlights the strong geographical structuring of the six soil physicochemical profiles across the five Sahelian countries.
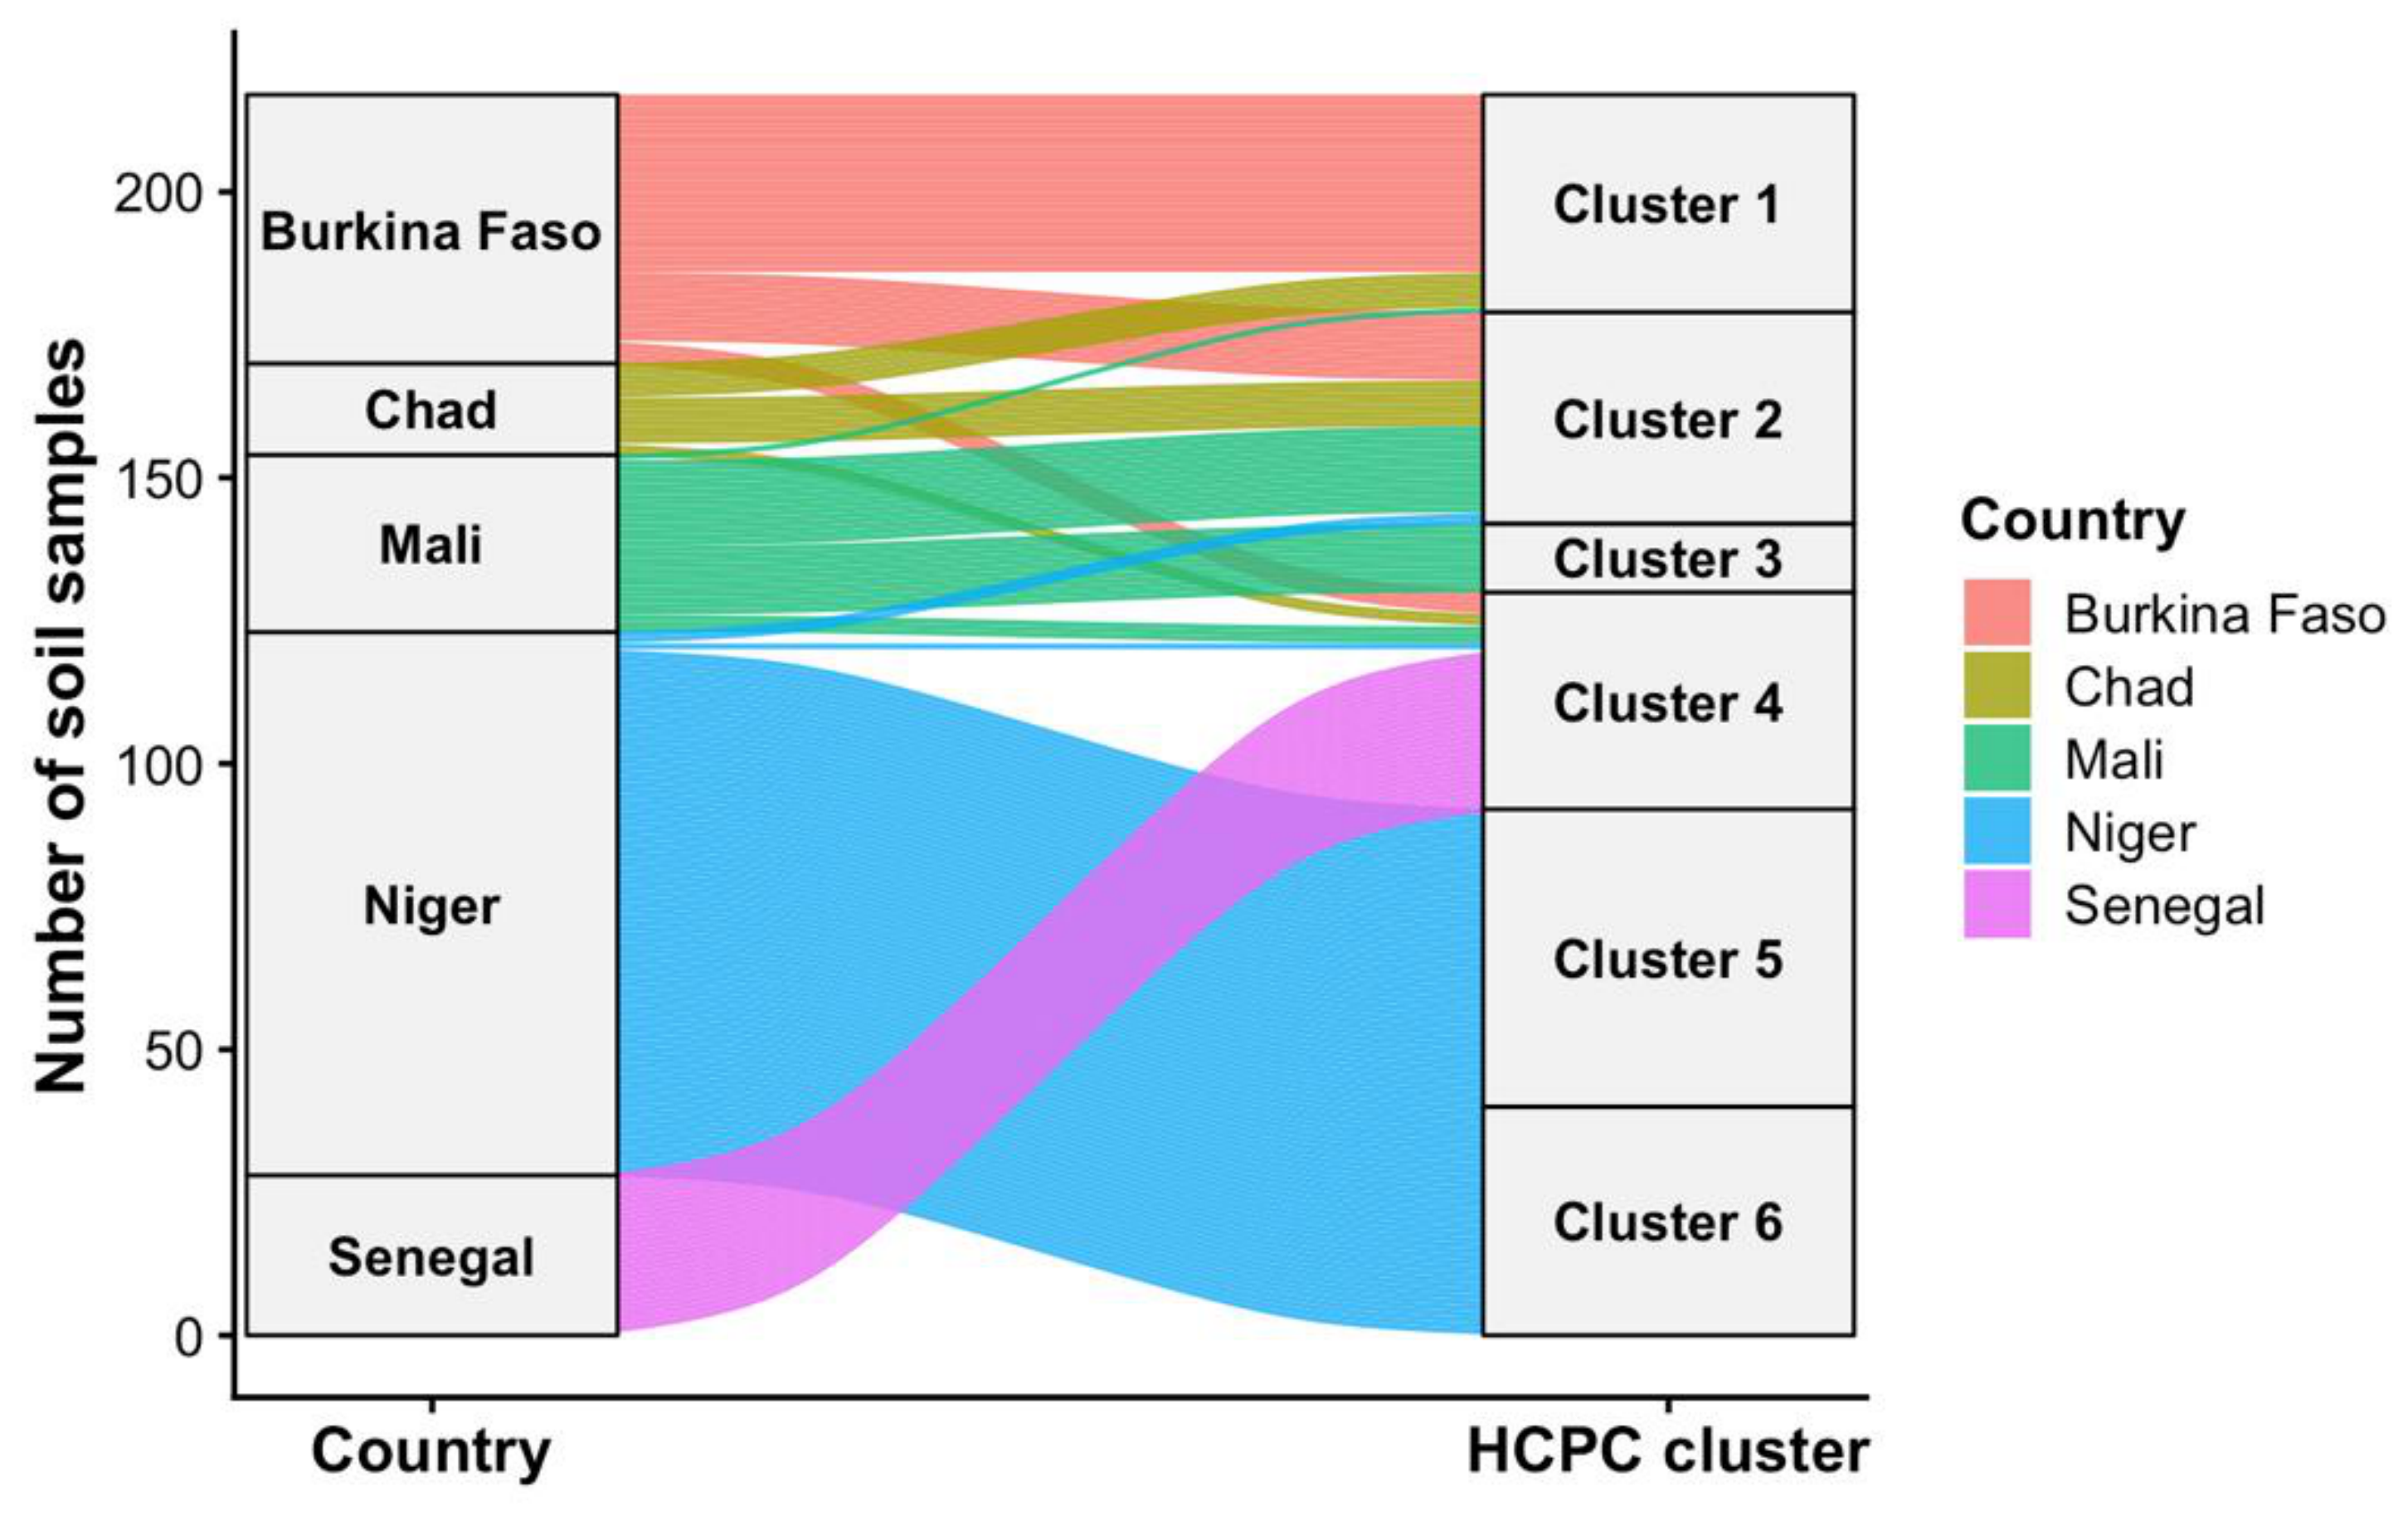
Table 1.
Soil sample distribution by country and management category.
| Country | Managed | Control | Total |
|---|---|---|---|
| Burkina Faso | 26 | 22 | 48 |
| Chad | 8 | 8 | 16 |
| Mali | 16 | 15 | 31 |
| Niger | 71 | 24 | 95 |
| Senegal | 14 | 14 | 28 |
| Total | 135 | 83 | 218 |
Table 2.
Répartition des pratiques de fertilisation par pays.
| Country | Solely OM | Raw OM | Raw OM + mineral fertilizer | Raw OM + compost | Total |
|---|---|---|---|---|---|
| Burkina Faso | 0 (0,0%) | 0 (0,0%) | 6 (75,0%) | 2 (25,0%) | 8 (100%) |
| Mali | 0 (0,0%) | 0 (0,0%) | 4 (80,0%) | 1 (20,0%) | 5 (100%) |
| Niger | 0 (0,0%) | 8 (57,1%) | 3 (21,4%) | 3 (21,4%) | 14 (100%) |
| Sénégal | 0 (0,0%) | 4 (57,1%) | 2 (28,6%) | 1 (14,3%) | 7 (100%) |
| Tchad | 1 (11,1%) | 2 (22,2%) | 1 (11,1%) | 5 (55,6%) | 9 (100%) |
| Total | 1 (2,3%) | 14 (32,6%) | 16 (37,2%) | 12 (27,9%) | 43 (100%) |
Table 3.
Water sources used at the study sites.
| Water sources | Frequency (n) | Proportion (%) |
|---|---|---|
| Direct rainwater + groundwater + pond | 20 | 22,7 |
| Direct rainwater | 15 | 17 |
| boreholes | 13 | 14,8 |
| Groundwater + other water reservoirs | 11 | 12,5 |
| Traditional wells + boreholes | 9 | 10,2 |
| Traditional wells | 6 | 6,8 |
| boreholes +Traditional wells | 3 | 3,4 |
| PMC | 3 | 3,4 |
| Dams | 2 | 2,3 |
| Boulis | 2 | 2,3 |
| Traditional wells + boulis | 2 | 2,3 |
| Dams + boreholes | 1 | 1,1 |
| Dams + traditional wells + boreholes | 1 | 1,1 |
| Total | 88 | 100 |
Table 9.
Cross-country summary of the effects of SWC/SDR management practices on the physicochemical properties of soil by horizon.
Table 9.
Cross-country summary of the effects of SWC/SDR management practices on the physicochemical properties of soil by horizon.
| Country | Gain MO (%) 0-20 | Gain C.org (%) 0-20 | Gain water pH | Gain N total (%) | Gain P Av. (%) | Gain K Ex. (%) | Gain CEC (%) | Low Da (%) | Dominant texture |
|---|---|---|---|---|---|---|---|---|---|
| Burkina Faso (n=10) | +24,2%** | +6,9% | +0,50* | +15,7%* | +176%** | +47%** | +37,2%** | -3,5%* | Sandy clay loan |
| Mali (n=8) | +77%*** | +76% | +0,52** | +23%* | +161%** | +41%** | nd | -8,4%** | Loan / silty clay |
| Niger (n=15) | +31,5%** | +31,5% | +0,40* | +25%** | +36,5%** | +44%** | nd | -2,0%* | Sand 80-93% |
| Sénégal (n=7) | +54,5%** | +50%** | +0,11 ns | +52,9%** | +90%** | nd | nd | -5,6%** | Sandy / sandy loan |
| Tchad (n=10) | +39,7%** | +34,8%** | +0,52** | +46%** | ns | +39%** | nd | -4,3%* | Silty clay 40-60% |
Table 10.
Loadings of soil physicochemical variables on the first two principal components (PCA).
| Variable | PC1 | PC2 |
|---|---|---|
| pH | -0.478 | -0.165 |
| Organic carbon | 0.447 | 0.796 |
| Organic matter | 0.460 | 0.783 |
| Total nitrogen | -0.05 | 0.348 |
| Available phosphorus | 0.808 | 0.081 |
| Cation exchange | 0.663 | 0.208 |
| Available potassium | -0.536 | 0.374 |
| Sand | 0.534 | -0.670 |
| Silt | -0.039 | 0.451 |
| Clay | -0.733 | 0.559 |
| Bulk density | 0.141 | 0.036 |
Disclaimer/Publisher’s Note: The statements, opinions and data contained in all publications are solely those of the individual author(s) and contributor(s) and not of MDPI and/or the editor(s). MDPI and/or the editor(s) disclaim responsibility for any injury to people or property resulting from any ideas, methods, instructions or products referred to in the content. |
© 2026 by the authors. Licensee MDPI, Basel, Switzerland. This article is an open access article distributed under the terms and conditions of the Creative Commons Attribution (CC BY) license (http://creativecommons.org/licenses/by/4.0/).
Copyright: This open access article is published under a Creative Commons CC BY 4.0 license, which permit the free download, distribution, and reuse, provided that the author and preprint are cited in any reuse.