

Submitted:
03 November 2026
Posted:
05 November 2026
You are already at the latest version
Abstract
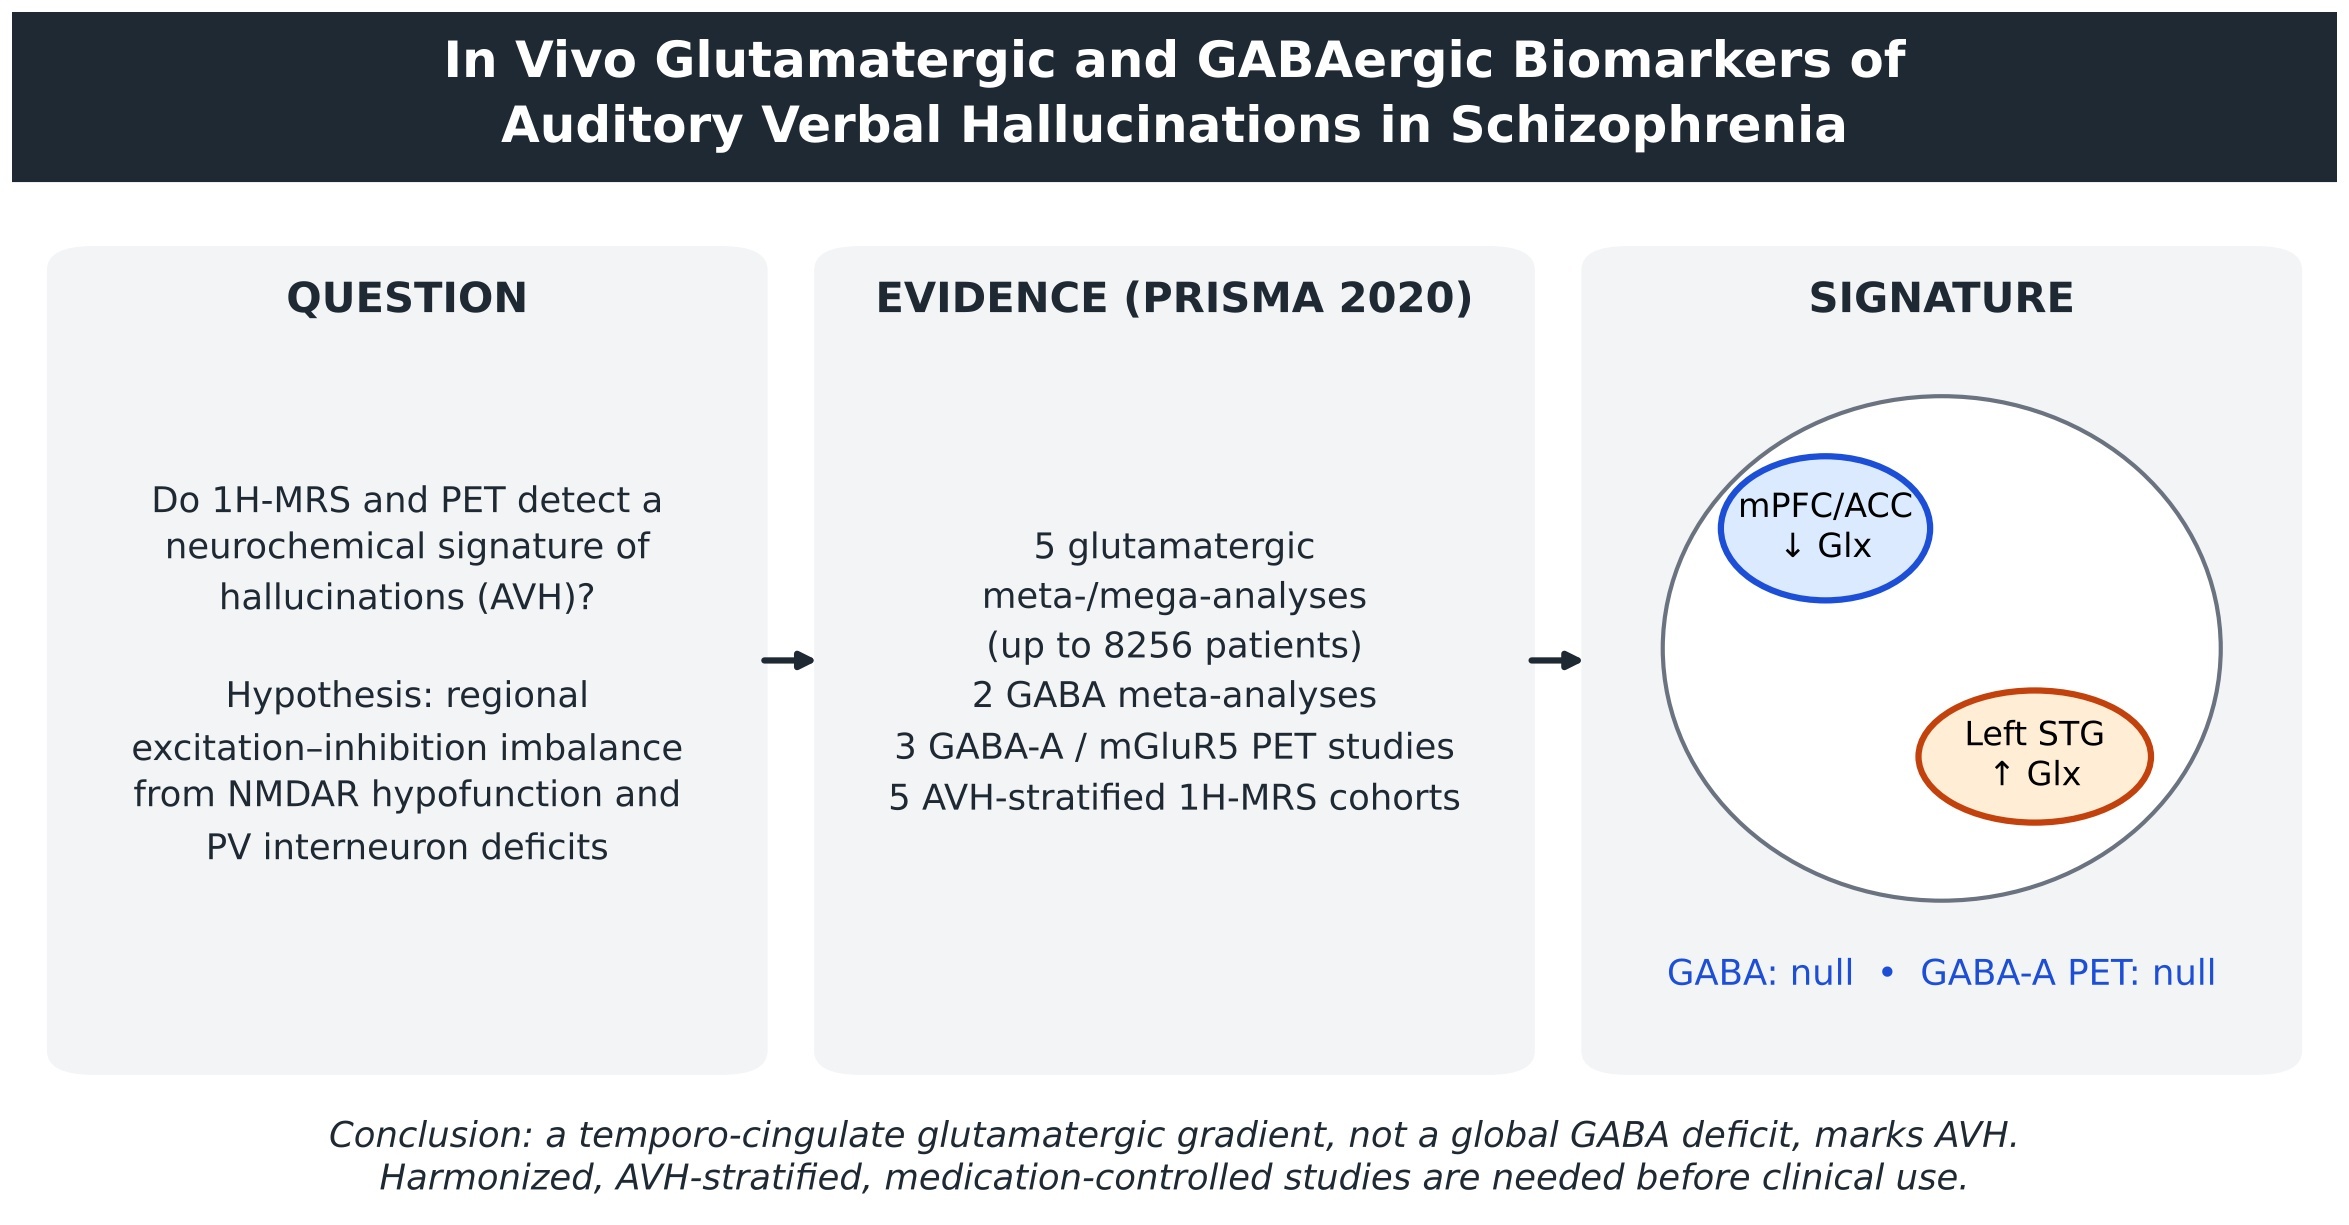
Auditory verbal hallucinations (AVH) are among the most distressing and treatment-refractory symptoms of schizophrenia. N-methyl-D-aspartate receptor hypofunction and parvalbumin interneuron deficits predict a regional excitation–inhibition imbalance in speech-processing cortex, but whether in vivo neurochemical imaging captures this imbalance in people who hallucinate is unclear. Following PRISMA 2020, we searched MEDLINE, Embase, PsycINFO, and Web of Science for proton magnetic resonance spectroscopy (1H-MRS) and positron emission tomography or single-photon emission computed tomography studies of glutamatergic or GABAergic markers in schizophrenia-spectrum disorders. Regional case–control estimates from published meta-analyses and mega-analyses were synthesized; AVH-stratified studies were synthesized narratively because voxel placement, metabolite composites, and hallucination metrics precluded valid pooling. Glutamatergic abnormalities were regionally patterned: thalamic glutamine (Hedges g = 0.53) and basal ganglia glutamate plus glutamine (Glx; g = 0.28–0.39) were elevated, medial frontal glutamate was reduced, and patient variability exceeded control variability. Pooled γ-aminobutyric acid (GABA) effects were nonsignificant (g = −0.004 to −0.30), and GABA-A receptor imaging showed no replicable differences. Across 5 AVH-stratified 1H-MRS cohorts, left superior temporal Glx or glutamate rose with hallucination severity, whereas medial prefrontal and anterior cingulate Glx fell (r = −0.30); GABA effects were null. In vivo evidence therefore favors a regionally dissociated temporo-cingulate glutamatergic gradient, rather than a global GABA deficit, as the neurochemical signature of AVH. Harmonized, medication-controlled, AVH-stratified multimodal studies are required before these measures can serve as clinical biomarkers.
Keywords:
auditory hallucination
; glutamate
; GABA
; magnetic resonance spectroscopy
; schizophrenia
; excitation–inhibition balance
Introduction
Auditory verbal hallucinations (AVH) - hearing speech in the absence of an external source—affect a large proportion of people with schizophrenia and are closely associated with distress, functional impairment, and treatment resistance. The dominant neurochemical account has been dopaminergic: presynaptic striatal dopamine synthesis capacity is elevated before psychosis onset, is localized to the associative striatum, and tracks symptom severity [1,2]. Yet dopamine explains positive symptoms better than the full syndrome; amphetamine induces only positive symptoms, whereas N-methyl-D-aspartate receptor (NMDAR) antagonists such as ketamine reproduce positive, negative, and cognitive features [3].
This dissociation motivated the glutamatergic model. Convergent pharmacological, genetic, and molecular evidence supports NMDAR hypofunction [4,5], and NMDAR hypofunction can explain connectional and oscillatory abnormalities through weakened excitation of γ-aminobutyric acid (GABA)-releasing interneurons and consequent disinhibition of principal cells [5]. Postmortem neuropathology anchors the inhibitory arm: in dorsolateral prefrontal cortex, 67-kDa glutamic acid decarboxylase (GAD67) messenger RNA is undetectable in approximately 30% of GABA neurons, including fast-spiking parvalbumin interneurons [6], parvalbumin messenger RNA is reduced in layers 3 and 4 without neuron loss [7,8], and excitatory synaptic input onto parvalbumin cells is selectively reduced [9]. Because gamma oscillations depend on parvalbumin interneuron activity, these lesions offer a substrate for oscillatory and perceptual abnormalities [9,10]. The International Consortium on Hallucinations Research has formalized this as an excitation–inhibition (E/I) imbalance model of hallucinations, linking them to impaired GABA transmission, altered NMDAR plasticity, reduced gamma oscillations, sensory cortical hyperactivity, and deficient cognitive inhibition, while cautioning that the path from cellular E/I dysfunction to symptoms remains unclear [11], and computational work shows that failure to maintain E/I balance in a hierarchical generative model causes priors to be misread as sensory evidence [12]. An extended account of this framework is given in Supplementary Text S1.
The clinical question is whether in vivo neurochemical imaging can translate this framework into a measurable biomarker of AVH. If hallucinations arise from a regional E/I disturbance, excitatory and inhibitory transmitter pools sampled by proton magnetic resonance spectroscopy (1H-MRS), or receptor systems indexed by positron emission tomography (PET), should differ between patients who do and do not hallucinate and should scale with hallucination severity. Existing meta-analyses address patients versus controls but not hallucination status. We therefore conducted a systematic review that (1) synthesized regional meta-analytic estimates for glutamatergic and GABAergic markers, (2) appraised receptor-imaging evidence, and (3) synthesized studies that stratified patients by AVH status or severity, situating these findings within dopaminergic PET and neurophysiological evidence.
Methods
Reporting Standard
The review was conducted and reported in accordance with the PRISMA 2020 statement [13]. The completed PRISMA 2020 checklist is provided as Supplementary Table S2. The protocol, specifying population, index measures, comparators, and outcomes, was defined a priori but was not prospectively registered.
Eligibility Criteria
Studies were eligible if they (1) recruited adults with schizophrenia or a schizophrenia-spectrum disorder, or individuals at clinical or genetic high risk for psychosis; (2) used 1H-MRS at 1.5 T or higher, including single-voxel, spectroscopic imaging, and J-difference–edited sequences such as Mescher-Garwood point-resolved spectroscopy (MEGA-PRESS), or PET or single-photon emission computed tomography (SPECT) with tracers indexing glutamatergic or GABAergic targets; (3) reported glutamate, glutamine, glutamate plus glutamine (Glx), GABA or GABA plus macromolecules (GABA+), N-acetylaspartate, or receptor availability; and (4) for the AVH-specific synthesis, reported AVH status or severity or permitted stratification by hallucination status. Studies reporting only composite positive-symptom scores were retained for contextual synthesis but not treated as AVH-specific evidence. Case reports, studies in nonpsychiatric populations, and conference abstracts without extractable data were excluded from the AVH-specific synthesis; in line with journal policy, meeting abstracts are cited parenthetically rather than in the reference list.
Information Sources and Search
MEDLINE, Embase, PsycINFO, and Web of Science were searched from inception, combining population terms (schizophrenia, psychosis, schizoaffective, ultra-high risk, clinical high risk, prodrome), index-measure terms (magnetic resonance spectroscopy, MRS, 1H-MRS, MEGA-PRESS, spectral editing, glutamate, glutamine, Glx, GABA, positron emission tomography, PET, SPECT, metabotropic glutamate receptor, mGluR5, flumazenil, Ro15-4513, iomazenil), and outcome terms (auditory verbal hallucination, auditory hallucination, voices, hallucination severity, PANSS P3, Auditory Hallucination Rating Scale). Reference lists of retrieved reviews and meta-analyses were hand-searched. Full search strings are given in Supplementary Table S1.
Data Extraction and Appraisal
Extracted variables comprised field strength, sequence, echo time, voxel placement, tissue-correction approach, quantification strategy (absolute or water-referenced concentrations vs creatine ratios), tracer and kinetic model, sample size, medication status and dose, illness stage, hallucination metric, and all effect estimates with CIs and P values. Because methodological heterogeneity is a dominant source of between-study variance in MRS, acquisition was appraised against consensus and evidence-based guidance for GABA-edited MEGA-PRESS [14,15], which comprises 23 recommendations spanning acquisition parameters, practicalities, confounders, quality and reporting, and postprocessing [15]. J-difference editing has been validated against chromatographic GABA measurement and offers the highest signal-to-noise ratio for GABA detection [16,17].
Synthesis
Two complementary strategies were used (Figure 1). First, for patients versus healthy controls, regional pooled estimates from published meta-analyses and mega-analyses of 1H-MRS data and pooled estimates for receptor imaging were synthesized, retaining original effect metrics (Hedges g, standardized mean difference [SMD], coefficient of variation ratio [CVR]) and CIs. Overlapping estimates for the same region were presented side by side rather than re-pooled, because their constituent studies overlap. Second, studies stratifying patients by AVH status or correlating metabolites with hallucination severity were synthesized narratively with original statistics. A de novo pooled AVH estimate was not computed because eligible studies differed in voxel placement, metabolite composite, field strength, referencing, and hallucination metric to a degree that would render a single estimate uninterpretable. Possible sample overlap between cohorts from the same center was recorded.
Results
Evidence Base
Five meta-analyses or mega-analyses of glutamatergic 1H-MRS [18,19,20,21,22], 2 meta-analyses of GABA 1H-MRS [23,24], receptor PET and SPECT studies of GABA-A and metabotropic glutamate receptor 5 (mGluR5) targets [25,26,27], and 5 AVH-stratified 1H-MRS cohorts formed the core evidence (Figure 1; Table 1). Primary case–control 1H-MRS studies, dopaminergic PET meta-analyses, and functional and electrophysiological studies informed contextual synthesis.
Glutamatergic Metabolites in Schizophrenia
Glutamatergic abnormalities were regionally patterned rather than global (Figure 2). In a meta-analysis and mega-analysis of 123 1H-MRS studies (8256 patients, 7532 controls), patients showed greater variability than controls in medial frontal glutamate (CVR = 0.15; P < .001), glutamine (CVR = 0.15; P = .003), and Glx (CVR = 0.11; P = .002), in dorsolateral prefrontal Glx (CVR = 0.25; P < .001), and in thalamic glutamate (CVR = 0.16; P = .008) and Glx (CVR = 0.19; P = .008) [18]. Thalamic glutamine (g = 0.53; 95% CI, 0.30-0.75; 6 studies) and basal ganglia Glx (g = 0.28; 95% CI, 0.12-0.44; 18 studies) were higher in patients, whereas dorsolateral prefrontal, frontal white matter, and temporal lobe levels did not differ; no significant differences emerged when analyses were restricted to antipsychotic-naive patients [18]. An independent meta-analysis of 59 studies (1686 patients, 1451 controls) reported elevated basal ganglia glutamate (g = 0.63; 95% CI, 0.15-1.11), thalamic glutamine (g = 0.56; 95% CI, 0.02-1.09), and Glx in basal ganglia (g = 0.39; 95% CI, 0.09-0.70) and medial temporal lobe (g = 0.32; 95% CI, 0.12-0.52), with no region showing reduced glutamatergic metabolites [21]. A focused meta-analysis of 28 studies (647 patients, 608 controls) found decreased medial frontal glutamate and increased medial frontal glutamine, with faster age-related decline in both in patients [20].
Individual participant mega-analysis (1251 patients, 1197 controls; 42 studies) showed that medial frontal glutamatergic metabolites were lower in patients and negatively associated with antipsychotic dose, whereas higher medial frontal and medial temporal glutamate was associated with more severe symptoms [19]. Two processes therefore appear superimposed: a medication- or duration-linked reduction and a symptom-linked elevation. Primary studies broadly concur. Glx was elevated in gray matter (P < .001) and white matter (P = .01) in 104 patients and 97 controls [28]. In never-treated patients, glutamine was higher in left anterior cingulate cortex (ACC) and thalamus [29], and increased hippocampal Glx in unmedicated patients correlated negatively with hippocampal volume [30]. In first-episode psychosis, glutamate was elevated in associative striatum [31] and in left dorsolateral prefrontal cortex, where it correlated with symptom ratings [32]. Hippocampal N-acetylaspartate–Glx coupling present in controls (r = 0.40) was absent in patients (r = −0.06; z = 2.22; P = .02) [33], and N-acetylaspartate declines with age and illness duration [34]. At 7 T, age modified ACC glutamate in schizophrenia without changes in glutamine, N-acetylaspartate, GABA, or glutathione [35]. In medication-free samples most studies report increased glutamatergic metabolites, although Glx-to-creatine ratios did not differ among first-episode, antipsychotic-naive, and chronic participants in at least 1 cohort [36]. Heterogeneity across this literature is attributable to differences in region, MRS method, illness stage, and medication [22,37].
GABAergic Metabolites in Schizophrenia
The GABAergic literature was markedly less consistent (Figure 2). A meta-analysis found no significant group differences in medial frontal (g = −0.3; 95% CI, −0.6 to 0.1; 409 patients, 495 controls), parieto-occipital (g = −0.3; 95% CI, −0.9 to 0.3; 139 patients, 111 controls), or striatal GABA (g = −0.004; 95% CI, −0.7 to 0.7; 123 patients, 95 controls), with high heterogeneity (I [2] > 50%) unexplained by moderators [23]. A transdiagnostic meta-analysis of 40 studies (N = 1591) found lower GABA in autism spectrum disorder (SMD = −0.74; P = .001) and in currently depressed patients (SMD = −0.52; P = .005), but not in schizophrenia (SMD = −0.23; P = .089) [24]. Primary findings diverge in direction: GABA has been reported as elevated in chronic schizophrenia [38], elevated together with Glx in medial prefrontal but not dorsolateral prefrontal cortex of unmedicated patients only [39], and examined in never-medicated chronic patients [40], whereas visual cortex GABA was reduced and correlated with orientation-specific surround suppression [41], a finding replicated in a recent-onset sample whose authors nevertheless questioned the reliability of current in vivo GABA measurement [42]. Medication status is a plausible moderator, and single-voxel acquisition times keep regional sampling sparse [43].
Receptor Imaging with PET and SPECT
All GABA-A PET and SPECT tracers available for human use bind the benzodiazepine site; flumazenil and iomazenil bind α1-, α2-, α3-, and α5-containing receptors with limited selectivity, whereas [11C]Ro15-4513 is relatively selective for α1 and α5 [23]. Pooled PET and SPECT data showed no replicable case–control differences in GABA-A/benzodiazepine receptor availability [23,43]. [11C]Ro15-4513 binds α5 subunits with approximately 10-fold higher affinity than other subunits; α5-containing receptors constitute approximately 25% of hippocampal GABA-A receptors, and postmortem studies show reduced α5 messenger RNA and protein in schizophrenia [25]. Nonetheless, flumazenil findings in early psychosis are inconsistent, Ro15-4513 studies report unchanged or decreased hippocampal binding, and the only clinical high-risk study found no change in hippocampal flumazenil binding [26].
For the glutamatergic system, mGluR5 is the principal PET target, although tracer development has faced obstacles such as in vivo defluorination [44,45]. Combined mGluR5 PET and glutamate MRS is feasible [46]. In chronic schizophrenia, lower [11C]ABP688 binding in left temporal cortex and caudate was associated with more general symptoms, poorer functioning, and worse cognition, without case–control differences; binding was strongly reduced in smokers (F1,27 = 15.5; P = .001) [27]. No identified receptor-imaging study stratified participants by hallucination status.
Dopaminergic PET as a Reference Standard
Dopaminergic PET constrains any glutamatergic account of AVH. Meta-analytic evidence localizes the dopaminergic abnormality to presynaptic synthesis and release capacity, with small or nonsignificant differences in D2/3 receptor and dopamine transporter availability [47,48,49]. Dopamine synthesis capacity is elevated with an effect size of approximately 0.8, and all 6 challenge studies found increased release [50]. In ultra-high-risk individuals who transitioned to psychosis, striatal synthesis capacity exceeded that of controls (effect size, 1.18) and correlated with symptom severity [2,51], and capacity at first presentation predicted subsequent antipsychotic response [52]. Elevated glutamate in associative striatum during first-episode psychosis decreases with antipsychotic treatment [31], but glutamate–dopamine convergence has been demonstrated across separate samples and modalities rather than within combined measurements, and dopamine abnormalities index psychosis liability rather than hallucination status per se [53].
1H-MRS Findings Stratified by AVH Status and Severity
Five 1H-MRS cohorts provided AVH-specific data (Table 1). In 77 patients and 77 controls scanned at 3 T, high-hallucinating patients showed higher left superior temporal gyrus (STG) Glx and lower ACC Glx than low-hallucinating patients, with controls intermediate; left STG Glx correlated marginally with AVH severity (P = .054), ACC Glx correlated negatively (P = .04), and GABA+ was unrelated to AVH [54]. The authors proposed an inter-regional glutamate–glutamate imbalance in place of an intra-regional glutamate–GABA imbalance [54]. In a separate cohort of 61 patients with persistent AVH, 53 patients without AVH, and 59 controls, medial prefrontal total N-acetylaspartate (tNAA) and Glx were lower in the persistent AVH group than in patients without AVH (tNAA P = .022; Glx P = .012) and controls (both P = .001), and correlated negatively with persistent AVH severity (tNAA r = −0.24, P = .014; Glx r = −0.30, P = .002); patients without AVH did not differ from controls [55]. In a preliminary bilateral STG study of 23 patients (18 hallucinating, 5 nonhallucinating) and 53 controls, GABA showed no effects (all P > .1), right STG glutamate was elevated in patients (P = .005), and left STG glutamate correlated with hallucination severity at trend level (β = 0.36; P = .05) (Hjelmervik et al, meeting abstract, Schizophr Bull. 2018;44 [suppl 1]; doi:10.1093/schbul/sby017.715).
Two multimodal studies extend these observations. In 81 patients with psychosis, ACC glutamate was positively associated with interhemispheric STG connectivity in high-hallucinating patients only, whereas ACC GABA was negatively associated with that connectivity in low-hallucinating patients only, supporting an interhemispheric miscommunication model with prefrontal neurochemical modulation [56]. In 51 patients with hallucinatory traits (PANSS P3 score ≥3) and 51 controls, functional MEGA-PRESS of the ACC during a flanker task showed lower baseline Glx in patients and a positive Glx–blood oxygenation level–dependent association, opposite to the negative association in controls; task-related Glx increases did not differ between groups, and GABA+ effects were absent [57]. Reviews of related work report higher left lateral prefrontal Glx in patients with AVH and positive frontal and temporal correlations with severity [58,59], and NMDAR dysfunction in left STG has been proposed to cause neuronal hyperactivity with elevated glutamate and Glx [60].
Collectively, (1) glutamatergic, not GABAergic, measures differentiated hallucinating from nonhallucinating patients; (2) the direction of difference depended on region—elevated in left STG and lateral prefrontal cortex, reduced in medial prefrontal cortex and ACC; and (3) associations were modest (|r| ≤ 0.30) and often marginal. No adequately powered study found GABA+ to differ by hallucination status [54,57].
Functional and Neurophysiological Convergence
A coordinate-based meta-analysis of symptom-capture studies found AVH-related activation in fronto-temporal speech generation and perception regions and medial temporal lobe [61]. Symptom-capture studies show increased coupling among auditory, language, and striatal regions [62], resting-state connectivity of left STG is disrupted in AVH [63], and connectivity in left ACC and left STG correlates with AVH severity [64]. In 46 patients (28 with AVH) and 20 controls, AVH were associated with reduced whole-brain connectivity of medial prefrontal and posterior cingulate cortex within a 25-node network overlapping default mode and language networks [65]. This topography is congruent with the neurochemical gradient: medial prefrontal cortex and ACC show reduced Glx and reduced connectivity, whereas left STG shows increased Glx and aberrant coupling.
Corollary discharge failure offers a mechanistic bridge [66,67,68]. In 75 patients, suppression of the auditory N1 during talking was deficient, but prespeech neural synchrony, rather than N1 suppression, related to AVH, implicating failed self-tagging of inner speech [69,70]. Temporal beta and gamma activity is increased in patients with AVH [71,72], and gamma phase-locking correlates with hallucinations [73]. The link between MRS-measured GABA and gamma oscillations, however, is fragile: positive associations in small samples [74,75,76] were not replicated in 50 healthy volunteers, in whom Bayes factors strongly favored the null [77].
Discussion
Principal Findings
This review tested whether in vivo glutamatergic and GABAergic imaging provides a reproducible biomarker of AVH. Three findings emerged. First, glutamatergic abnormalities in schizophrenia are reproducible, regionally specific, and directionally consistent across independent syntheses [18,20,21], whereas pooled GABA 1H-MRS and GABA-A receptor estimates are null [23,24]. Second, when patients are stratified by hallucination status, the most consistent signal is a temporo-cingulate glutamatergic gradient—higher Glx or glutamate in left STG scaling with hallucination severity and lower Glx in medial prefrontal cortex and ACC [54,55,57]. Third, no AVH-stratified receptor-imaging study exists, leaving the receptor-level biomarker question untested.
Why GABA Findings Are Null
The null GABA results contrast with an unequivocal postmortem literature [6,7,78,79]. The discrepancy is best explained by what edited 1H-MRS measures: a total tissue GABA pool that cannot separate synaptic from metabolic compartments or index the activity of a molecularly defined interneuron subpopulation. A deficit confined to approximately 30% of GABA neurons, with normal transcript levels elsewhere and preserved parvalbumin neuron density [6,8], is unlikely to shift bulk tissue concentration detectably. The failed replication of the GABA–gamma relationship [77] reinforces that MRS GABA is a weak proxy for inhibitory tone. Null 1H-MRS findings therefore indicate an underpowered instrument for this lesion rather than evidence against the GABAergic hypothesis, and current benzodiazepine-site tracers lack the subunit selectivity needed to detect subtype-specific changes [25,26].
A Temporo-Cingulate Gradient
The AVH-stratified evidence supports an inter-regional rather than intra-regional E/I model (Figure 3). If NMDAR hypofunction weakens excitatory drive onto parvalbumin interneurons and disinhibits pyramidal cells [5,9], auditory cortex engaged during inner speech would be expected to show net hyperactivity and relative glutamatergic excess [60], consistent with elevated left STG Glx [54]. Concurrently, reduced medial prefrontal and ACC Glx [55,57] and reduced medial prefrontal connectivity [64,65] suggest diminished capacity for cognitive inhibition of voices. Corollary discharge failure would allow self-generated activity to be experienced as external [66,69], while impaired cingulate control would prevent its suppression. That baseline rather than task-evoked Glx distinguished patients [57] suggests a tonic, regionally distributed abnormality rather than a dynamic failure of inhibition. This model is compatible with the mega-analytic observation that higher medial frontal and temporal glutamate tracks symptom severity while lower medial frontal levels track antipsychotic dose [19], which implies that medication exposure, insufficiently controlled in AVH studies, may contribute to medial reductions.
Illness Stage and the Dopamine Interface
Any biomarker claim must accommodate nonlinearity across illness stages. In ultra-high-risk individuals, thalamic glutamate has been reported as lower and dorsal caudate glutamate as higher than in controls, particularly in those who later transitioned to psychosis [80]. A dual-voxel ACC study suggested that reduced glutamatergic tone in high-risk individuals gives way to higher glutamate once psychotic symptoms become prominent, with a relationship to symptom burden that ceases to be simply linear in established illness [81]. Glutamatergic elevations are most evident in antipsychotic-naive or minimally treated patients and during exacerbations, whereas medicated patients show similar or lower levels [31]. Integrated models propose that cortical NMDAR hypofunction disinhibits hippocampal and cortical projections that drive striatal dopamine release [3,50,53], so glutamatergic and dopaminergic markers may index sequential stages of a single cascade; AVH-stratified designs measuring both systems within the same participants are needed to test this.
Clinical and Translational Implications
Two treatment literatures provide indirect convergent validity. Low-frequency repetitive transcranial magnetic stimulation over left temporoparietal cortex reduced medication-resistant hallucinations in early meta-analyses (mean weighted effect size, 0.93; 95% CI, 0.17-1.69) [82,83], although a later meta-analysis of 11 randomized trials found a smaller, unstable effect (SMD = −0.27; 95% CI, −0.51 to −0.03) [84]. Glutamatergic pharmacotherapy aimed at NMDAR co-agonism has yielded small, inconsistent benefits, and glycine transporter 1 inhibition failed in phase 3 trials [85,86,87]. Brain glutamate shows greater promise as a stratification marker: ACC glutamate is elevated in treatment-resistant schizophrenia [88], and caudate glutamate reduction during clozapine treatment correlated with improvement (r = .42; P = .04) [89,90]. Whether temporo-cingulate Glx predicts AVH-specific treatment response has not been tested and represents a tractable target for trials.
Limitations
Limitations of the evidence and of this review are summarized in Table 2. MEGA-PRESS operates at low signal-to-noise ratio and is vulnerable to subtraction artifacts; [15,16] creatine referencing, voxel tissue composition, and acquisition parameters vary across studies; [22,91] medication [19,39], age [20,35], and illness stage modify metabolite levels nonlinearly; [80,81] AVH cohorts are small and unbalanced; hallucination metrics are not harmonized; and 4 of 5 AVH cohorts derive from 1 center, so sample overlap cannot be excluded. Methodologically, this review synthesized published pooled estimates rather than re-pooling primary data, did not compute a de novo AVH-specific meta-analytic estimate, did not formally assess risk of bias with a standardized tool, and was not prospectively registered. Selection weighted toward foundational, highly cited literature may underrepresent recent small studies, and publication bias could not be assessed.
Future Directions and Conclusions
Four priorities follow. AVH-stratified 1H-MRS studies should be powered for associations of r = 0.24 to 0.30 (approximately 85-135 patients for 80% power; Table 2), recruit balanced hallucinating and nonhallucinating groups, and use continuous validated AVH scales. Acquisition should follow consensus guidance [14,15], reporting tissue-corrected concentrations and fit-quality metrics. Subtype-selective ligands and combined PET-MRS designs [27,46] should be applied to hallucination-stratified samples, with longitudinal designs separating medication from illness effects. Finally, functional MRS combined with corollary discharge paradigms and circuit-targeted neuromodulation [69,84] would test causal involvement. In conclusion, in vivo evidence supports a regionally dissociated temporo-cingulate glutamatergic gradient, rather than a global GABA deficit, as the neurochemical signature of AVH. It is not yet a clinical biomarker; progress requires harmonized, adequately powered, medication-controlled multimodal studies that treat AVH as a specific, measurable target.
Ethics Statement
This study is a systematic review of previously published data and did not involve human participants or animals; ethics committee approval and informed consent were therefore not required.
Supplementary Materials
The following supporting information can be downloaded at the website of this paper posted on Preprints.org, Supplementary Text S1; Supplementary Table S1-S2.
Author Contributions
S.K.S.V. conceived and designed the review, developed the search strategy, screened and extracted the data, synthesized and interpreted the evidence, drafted and critically revised the manuscript, and approved the final version. As sole author, S.K.S.V. takes full responsibility for the integrity of the work.
Funding
This research received no specific grant from any funding agency in the public, commercial, or not-for-profit sectors.
Data Availability Statement
No new data were generated. All quantitative estimates are those reported in the cited meta-analyses and primary studies; extraction sheets are available from the corresponding author on reasonable request.
Declaration of generative AI and AI-Assisted Technologies in the Manuscript Preparation Process: During the preparation of this work the author used generative artificial intelligence in order to assist with language editing and formatting. After using this tool, the author reviewed and edited the content as needed and takes full responsibility for the content of the published article.
Conflicts of interest
None.
Abbreviations
1H-MRS, proton magnetic resonance spectroscopy; ACC, anterior cingulate cortex; AHRS, Auditory Hallucination Rating Scale; AVH, auditory verbal hallucinations; BAVQ-R, Beliefs About Voices Questionnaire–Revised; BOLD, blood oxygenation level–dependent; CI, confidence interval; CVR, coefficient of variation ratio; E/I, excitation–inhibition; fMRI, functional magnetic resonance imaging; GABA, γ-aminobutyric acid; GABA+, γ-aminobutyric acid plus macromolecules; GAD67, 67-kDa glutamic acid decarboxylase; Glu, glutamate; Glx, glutamate plus glutamine; HC, healthy controls; IFG, inferior frontal gyrus; MEGA-PRESS, Mescher-Garwood point-resolved spectroscopy; mGluR5, metabotropic glutamate receptor 5; mPFC, medial prefrontal cortex; NMDAR, N-methyl-D-aspartate receptor; pAVH, persistent auditory verbal hallucinations; PANSS, Positive and Negative Syndrome Scale; PET, positron emission tomography; PRESS, point-resolved spectroscopy; PRISMA, Preferred Reporting Items for Systematic Reviews and Meta-Analyses; PV, parvalbumin; SMD, standardized mean difference; SPECT, single-photon emission computed tomography; STG, superior temporal gyrus; SZ, schizophrenia; TE, echo time; tNAA, N-acetylaspartate plus N-acetylaspartylglutamate.
References
- Howes, O.D.; Montgomery, A.J.; Asselin, M.C.; et al. Elevated striatal dopamine function linked to prodromal signs of schizophrenia. Arch. Gen. Psychiatry 2009, 66(1), 13–20. [Google Scholar] [CrossRef]
- Howes, O.D.; Bose, S.K.; Turkheimer, F.; et al. Dopamine synthesis capacity before onset of psychosis: a prospective [18F]-DOPA PET imaging study. Am. J. Psychiatry 2011, 168(12), 1311–1317. [Google Scholar] [CrossRef]
- Lisman, J.E.; Coyle, J.T.; Green, R.W.; et al. Circuit-based framework for understanding neurotransmitter and risk gene interactions in schizophrenia. Trends Neurosci. 2008, 31(5), 234–242. [Google Scholar] [CrossRef]
- Tsai, G.; Coyle, J.T. Glutamatergic mechanisms in schizophrenia. Annu Rev. Pharmacol. Toxicol. 2002, 42, 165–179. [Google Scholar] [CrossRef]
- Frohlich, J.; Van Horn, J.D. Reviewing the ketamine model for schizophrenia. J. Psychopharmacol. 2014, 28(4), 287–302. [Google Scholar] [CrossRef]
- Lewis, D.A.; Sweet, R.A. Schizophrenia from a neural circuitry perspective: advancing toward rational pharmacological therapies. J. Clin. Invest. 2009, 119(4), 706–716. [Google Scholar] [CrossRef]
- Hashimoto, T.; Volk, D.W.; Eggan, S.M.; et al. Gene expression deficits in a subclass of GABA neurons in the prefrontal cortex of subjects with schizophrenia. J. Neurosci. 2003, 23(15), 6315–6326. [Google Scholar] [CrossRef]
- de Jonge, J.C.; Vinkers, C.H.; Hulshoff Pol, H.E.; Marsman, A. GABAergic mechanisms in schizophrenia: linking postmortem and in vivo studies. Front Psychiatry 2017, 8, 118. [Google Scholar] [CrossRef]
- Chung, D.W.; Fish, K.N.; Lewis, D.A. Pathological basis for deficient excitatory drive to cortical parvalbumin interneurons in schizophrenia. Am. J. Psychiatry 2016, 173(11), 1131–1139. [Google Scholar] [CrossRef]
- Uhlhaas, P.J.; Haenschel, C.; Nikolić, D.; Singer, W. The role of oscillations and synchrony in cortical networks and their putative relevance for the pathophysiology of schizophrenia. Schizophr. Bull. 2008, 34(5), 927–943. [Google Scholar] [CrossRef]
- Jardri, R.; Hugdahl, K.; Hughes, M.; et al. Are hallucinations due to an imbalance between excitatory and inhibitory influences on the brain? Schizophr. Bull. 2016, 42(5), 1124–1134. [Google Scholar] [CrossRef]
- Jardri, R.; Denève, S. Circular inferences in schizophrenia. Brain 2013, 136(11), 3227–3241. [Google Scholar] [CrossRef]
- Page, M.J.; McKenzie, J.E.; Bossuyt, P.M.; et al. The PRISMA 2020 statement: an updated guideline for reporting systematic reviews. BMJ 2021, 372, n71. [Google Scholar] [CrossRef]
- Mullins, P.G.; McGonigle, D.J.; O’Gorman, R.L.; et al. Current practice in the use of MEGA-PRESS spectroscopy for the detection of GABA. Neuroimage 2014, 86, 43–52. [Google Scholar] [CrossRef]
- Peek, A.L.; Rebbeck, T.; Leaver, A.M.; et al. A comprehensive guide to MEGA-PRESS for GABA measurement. Anal. Biochem. 2023, 669, 115113. [Google Scholar] [CrossRef]
- Puts, N.A.J.; Edden, R.A.E. In vivo magnetic resonance spectroscopy of GABA: a methodological review. Prog. Nucl. Magn. Reson Spectrosc. 2012, 60, 29–41. [Google Scholar] [CrossRef]
- Bogner, W.; Gagoski, B.; Hess, A.T.; et al. 3D GABA imaging with real-time motion correction, shim update and reacquisition of adiabatic spiral MRSI. Neuroimage 2014, 103, 290–302. [Google Scholar] [CrossRef]
- Merritt, K.; McCutcheon, R.A.; Aleman, A.; et al. Variability and magnitude of brain glutamate levels in schizophrenia: a meta and mega-analysis. Mol. Psychiatry 2023, 28(5), 2039–2048. [Google Scholar] [CrossRef]
- Merritt, K.; McGuire, P.K.; Egerton, A.; et al. Association of age, antipsychotic medication, and symptom severity in schizophrenia with proton magnetic resonance spectroscopy brain glutamate level: a mega-analysis of individual participant-level data. JAMA Psychiatry 2021, 78(6), 667–681. [Google Scholar] [CrossRef]
- Marsman, A.; van den Heuvel, M.P.; Klomp, D.W.J.; Kahn, R.S.; Luijten, P.R.; Hulshoff Pol, H.E. Glutamate in schizophrenia: a focused review and meta-analysis of 1H-MRS studies. Schizophr. Bull. 2013, 39(1), 120–129. [Google Scholar] [CrossRef]
- Li, C.T.; Yang, K.C.; Lin, W.C. Glutamatergic dysfunction and glutamatergic compounds for major psychiatric disorders: evidence from clinical neuroimaging studies. Front Psychiatry 2019, 9, 767. [Google Scholar] [CrossRef]
- Lopes, J.J.; Carruthers, S.; Meyer, D.; Dean, B.; Rossell, S.L. Glutamatergic neurotransmission in schizophrenia: a systematic review and quantitative synthesis of proton magnetic resonance spectroscopy studies across schizophrenia spectrum disorders. Aust. N Z. J. Psychiatry 2024, 58(11), 930–951. [Google Scholar] [CrossRef]
- Egerton, A.; Modinos, G.; Ferrera, D.; McGuire, P. Neuroimaging studies of GABA in schizophrenia: a systematic review with meta-analysis. Transl. Psychiatry 2017, 7(6), e1147. [Google Scholar] [CrossRef]
- Schür, R.R.; Draisma, L.W.R.; Wijnen, J.P.; et al. Brain GABA levels across psychiatric disorders: a systematic literature review and meta-analysis of 1H-MRS studies. Hum. Brain Mapp. 2016, 37(9), 3337–3352. [Google Scholar] [CrossRef]
- Marques, T.R.; Ashok, A.H.; Angelescu, I.; et al. GABA-A receptor differences in schizophrenia: a positron emission tomography study using [11C]Ro154513. Mol. Psychiatry 2021, 26(6), 2616–2625. [Google Scholar] [CrossRef]
- Lukow, P.B.; Schubert, J.; Severino, M.; et al. GABAA receptor availability in clinical high-risk and first-episode psychosis: a [11C]Ro15-4513 positron emission tomography study. Mol. Psychiatry 2026, 31(2), 987–996. [Google Scholar] [CrossRef]
- Brambilla, C.R.; Veselinović, T.; Rajkumar, R.; et al. mGluR5 receptor availability is associated with lower levels of negative symptoms and better cognition in male patients with chronic schizophrenia. Hum. Brain Mapp. 2020, 41(10), 2762–2781. [Google Scholar] [CrossRef]
- Bustillo, J.R.; Jones, T.; Chen, H.; et al. Glutamatergic and neuronal dysfunction in gray and white matter: a spectroscopic imaging study in a large schizophrenia sample. Schizophr. Bull. 2017, 43(3), 611–619. [Google Scholar] [CrossRef]
- Théberge, J.; Bartha, R.; Drost, D.J.; et al. Glutamate and glutamine measured with 4.0 T proton MRS in never-treated patients with schizophrenia and healthy volunteers. Am. J. Psychiatry 2002, 159(11), 1944–1946. [Google Scholar] [CrossRef]
- Kraguljac, N.V.; White, D.M.; Reid, M.A.; Lahti, A.C. Increased hippocampal glutamate and volumetric deficits in unmedicated patients with schizophrenia. JAMA Psychiatry 2013, 70(12), 1294–1302. [Google Scholar] [CrossRef]
- de la Fuente-Sandoval, C.; León-Ortiz, P.; Azcárraga, M.; et al. Glutamate levels in the associative striatum before and after 4 weeks of antipsychotic treatment in first-episode psychosis: a longitudinal proton magnetic resonance spectroscopy study. JAMA Psychiatry 2013, 70(10), 1057–1066. [Google Scholar] [CrossRef]
- Olbrich, H.M.; Valerius, G.; Rüsch, N.; et al. Frontolimbic glutamate alterations in first episode schizophrenia: evidence from a magnetic resonance spectroscopy study. World J. Biol. Psychiatry 2008, 9(1), 59–63. [Google Scholar] [CrossRef]
- Kraguljac, N.V.; Reid, M.A.; White, D.M.; den Hollander, J.; Lahti, A.C. Regional decoupling of N-acetyl-aspartate and glutamate in schizophrenia. Neuropsychopharmacology 2012, 37(12), 2635–2642. [Google Scholar] [CrossRef]
- Duarte, J.M.N.; Xin, L. Magnetic resonance spectroscopy in schizophrenia: evidence for glutamatergic dysfunction and impaired energy metabolism. Neurochem Res. 2019, 44(1), 102–116. [Google Scholar] [CrossRef]
- Brandt, A.S.; Unschuld, P.G.; Pradhan, S.; et al. Age-related changes in anterior cingulate cortex glutamate in schizophrenia: a 1H MRS study at 7 Tesla. Schizophr. Res. 2016, 172(1-3), 101–105. [Google Scholar] [CrossRef]
- Wijtenburg, S.A.; Yang, S.; Fischer, B.A.; Rowland, L.M. In vivo assessment of neurotransmitters and modulators with magnetic resonance spectroscopy: application to schizophrenia. Neurosci. Biobehav Rev. 2015, 51, 276–295. [Google Scholar] [CrossRef]
- Poels, E.M.P.; Kegeles, L.S.; Kantrowitz, J.T.; et al. Glutamatergic abnormalities in schizophrenia: a review of proton MRS findings. Schizophr. Res. 2014, 152(2-3), 325–332. [Google Scholar] [CrossRef]
- Öngür, D.; Prescot, A.P.; McCarthy, J.; Cohen, B.M.; Renshaw, P.F. Elevated gamma-aminobutyric acid levels in chronic schizophrenia. Biol. Psychiatry 2010, 68(7), 667–670. [Google Scholar] [CrossRef]
- Kegeles, L.S.; Mao, X.; Stanford, A.D.; et al. Elevated prefrontal cortex γ-aminobutyric acid and glutamate-glutamine levels in schizophrenia measured in vivo with proton magnetic resonance spectroscopy. Arch. Gen. Psychiatry 2012, 69(5), 449–459. [Google Scholar] [CrossRef]
- Reyes-Madrigal, F.; González-Manríquez, L.; Mora-Durán, R.; et al. Prefrontal γ-aminobutyric acid levels in never-medicated individuals with chronic schizophrenia. JAMA Psychiatry 2023, 80(10), 1075. [Google Scholar] [CrossRef]
- Yoon, J.H.; Maddock, R.J.; Rokem, A.; et al. GABA concentration is reduced in visual cortex in schizophrenia and correlates with orientation-specific surround suppression. J. Neurosci. 2010, 30(10), 3777–3781. [Google Scholar] [CrossRef]
- Yoon, J.H.; Maddock, R.J.; Cui, E.H.; et al. Reduced in vivo visual cortex GABA in schizophrenia, a replication in a recent onset sample. Schizophr. Res. 2020, 215, 217–222. [Google Scholar] [CrossRef]
- Taylor, S.F.; Tso, I.F. GABA abnormalities in schizophrenia: a methodological review of in vivo studies. Schizophr. Res. 2015, 167(1-3), 84–90. [Google Scholar] [CrossRef]
- Brown, A.K.; Kimura, Y.; Zoghbi, S.S.; et al. Metabotropic glutamate subtype 5 receptors are quantified in the human brain with a novel radioligand for PET. J. Nucl. Med. 2008, 49(12), 2042–2048. [Google Scholar] [CrossRef]
- Terbeck, S.; Akkus, F.; Chesterman, L.P.; Hasler, G. The role of metabotropic glutamate receptor 5 in the pathogenesis of mood disorders and addiction: combining preclinical evidence with human positron emission tomography (PET) studies. Front Neurosci. 2015, 9, 86. [Google Scholar] [CrossRef]
- Abdallah, C.G.; Hannestad, J.; Mason, G.F.; et al. Metabotropic glutamate receptor 5 and glutamate involvement in major depressive disorder: a multimodal imaging study. Biol. Psychiatry Cogn. Neurosci. Neuroimaging 2017, 2(5), 449–456. [Google Scholar] [CrossRef]
- Brugger, S.P.; Angelescu, I.; Abi-Dargham, A.; Mizrahi, R.; Shahrezaei, V.; Howes, O.D. Heterogeneity of striatal dopamine function in schizophrenia: meta-analysis of variance. Biol. Psychiatry 2020, 87(3), 215–224. [Google Scholar] [CrossRef]
- Laruelle, M. Imaging dopamine transmission in schizophrenia: a review and meta-analysis. Q. J. Nucl. Med. 1998, 42(3), 211–221. [Google Scholar]
- Kambeitz, J.; Abi-Dargham, A.; Kapur, S.; Howes, O.D. Alterations in cortical and extrastriatal subcortical dopamine function in schizophrenia: systematic review and meta-analysis of imaging studies. Br. J. Psychiatry 2014, 204(6), 420–429. [Google Scholar] [CrossRef]
- Howes, O.; McCutcheon, R.; Stone, J. Glutamate and dopamine in schizophrenia: an update for the 21st century. J. Psychopharmacol. 2015, 29(2), 97–115. [Google Scholar] [CrossRef]
- Howes, O.; Bose, S.; Turkheimer, F.; et al. Progressive increase in striatal dopamine synthesis capacity as patients develop psychosis: a PET study. Mol. Psychiatry 2011, 16(9), 885–886. [Google Scholar] [CrossRef]
- Jauhar, S.; Veronese, M.; Nour, M.M.; et al. Determinants of treatment response in first-episode psychosis: an 18F-DOPA PET study. Mol. Psychiatry 2019, 24(10), 1502–1512. [Google Scholar] [CrossRef]
- McCutcheon, R.A.; Krystal, J.H.; Howes, O.D. Dopamine and glutamate in schizophrenia: biology, symptoms and treatment. World Psychiatry 2020, 19(1), 15–33. [Google Scholar] [CrossRef]
- Hjelmervik, H.; Craven, A.R.; Sinceviciute, I.; et al. Intra-regional Glu-GABA vs inter-regional Glu-Glu imbalance: a 1H-MRS study of the neurochemistry of auditory verbal hallucinations in schizophrenia. Schizophr. Bull. 2020, 46(3), 633–642. [Google Scholar] [CrossRef]
- Wang, Q.; Ren, H.; Li, C.; et al. Metabolite differences in the medial prefrontal cortex in schizophrenia patients with and without persistent auditory verbal hallucinations: a 1H MRS study. Transl. Psychiatry 2022, 12(1), 116. [Google Scholar] [CrossRef]
- Weber, S.; Hjelmervik, H.; Craven, A.R.; et al. Glutamate- and GABA-modulated connectivity in auditory hallucinations: a combined resting state fMRI and MR spectroscopy study. Front Psychiatry 2021, 12, 643564. [Google Scholar] [CrossRef]
- Craven, A.R.; Dwyer, G.E.; Ersland, L.; et al. GABA, glutamate dynamics and BOLD observed during cognitive processing in psychosis patients with hallucinatory traits. Sci. Rep. 2025, 15(1), 19466. [Google Scholar] [CrossRef]
- Shao, X.; Liao, Y.; Gu, L.; Chen, W.; Tang, J. The etiology of auditory hallucinations in schizophrenia: from multidimensional levels. Front Neurosci. 2021, 15, 755870. [Google Scholar] [CrossRef]
- Allen, P.; Sommer, I.E.; Jardri, R.; Eysenck, M.W.; Hugdahl, K. Extrinsic and default mode networks in psychiatric conditions: relationship to excitatory-inhibitory transmitter balance and early trauma. Neurosci. Biobehav Rev. 2019, 99, 90–100. [Google Scholar] [CrossRef]
- Wang, Z.; Xue, K.; Kang, Y.; et al. Altered intrinsic neural activity and its molecular analyses in first-episode schizophrenia with auditory verbal hallucinations. Front Neurosci. 2024, 18, 1478963. [Google Scholar] [CrossRef]
- Jardri, R.; Pouchet, A.; Pins, D.; Thomas, P. Cortical activations during auditory verbal hallucinations in schizophrenia: a coordinate-based meta-analysis. Am. J. Psychiatry 2011, 168(1), 73–81. [Google Scholar] [CrossRef]
- Ćurčić-Blake, B.; Ford, J.M.; Hubl, D.; et al. Interaction of language, auditory and memory brain networks in auditory verbal hallucinations. Prog. Neurobiol. 2017, 148, 1–20. [Google Scholar] [CrossRef]
- Alderson-Day, B.; McCarthy-Jones, S.; Fernyhough, C. Hearing voices in the resting brain: a review of intrinsic functional connectivity research on auditory verbal hallucinations. Neurosci. Biobehav Rev. 2015, 55, 78–87. [Google Scholar] [CrossRef]
- Wolf, N.D.; Sambataro, F.; Vasic, N.; et al. Dysconnectivity of multiple resting-state networks in patients with schizophrenia who have persistent auditory verbal hallucinations. J. Psychiatry Neurosci. 2011, 36(6), 366–374. [Google Scholar] [CrossRef]
- Scheinost, D.; Tokoglu, F.; Hampson, M.; Hoffman, R.; Constable, R.T. Data-driven analysis of functional connectivity reveals a potential auditory verbal hallucination network. Schizophr. Bull. 2019, 45(2), 415–424. [Google Scholar] [CrossRef]
- Feinberg, I. Efference copy and corollary discharge: implications for thinking and its disorders. Schizophr. Bull. 1978, 4(4), 636–640. [Google Scholar] [CrossRef]
- Ford, J.M.; Mathalon, D.H. Anticipating the future: automatic prediction failures in schizophrenia. Int. J. Psychophysiol. 2012, 83(2), 232–239. [Google Scholar] [CrossRef]
- Whitford, T.J.; Mathalon, D.H.; Shenton, M.E.; et al. Electrophysiological and diffusion tensor imaging evidence of delayed corollary discharges in patients with schizophrenia. Psychol. Med. 2011, 41(5), 959–969. [Google Scholar] [CrossRef]
- Ford, J.M.; Perez, V.B.; Mathalon, D.H. Neurophysiology of a possible fundamental deficit in schizophrenia. World Psychiatry 2012, 11(1), 58–60. [Google Scholar] [CrossRef]
- Chen, C.M.A.; Mathalon, D.H.; Roach, B.J.; Cavus, I.; Spencer, D.D.; Ford, J.M. The corollary discharge in humans is related to synchronous neural oscillations. J. Cogn. Neurosci. 2011, 23(10), 2892–2904. [Google Scholar] [CrossRef]
- Uhlhaas, P.J. Neural synchrony in cortical networks: history, concept and current status. Front Integr. Neurosci. 2009, 3, 17. [Google Scholar] [CrossRef]
- Spencer, K.M.; Niznikiewicz, M.A.; Nestor, P.G.; Shenton, M.E.; McCarley, R.W. Left auditory cortex gamma synchronization and auditory hallucination symptoms in schizophrenia. BMC Neurosci. 2009, 10, 85. [Google Scholar] [CrossRef]
- Spencer, K.M.; Nestor, P.G.; Perlmutter, R.; et al. Neural synchrony indexes disordered perception and cognition in schizophrenia. Proc. Natl. Acad. Sci. U S A 2004, 101(49), 17288–17293. [Google Scholar] [CrossRef]
- Muthukumaraswamy, S.D.; Edden, R.A.E.; Jones, D.K.; Swettenham, J.B.; Singh, K.D. Resting GABA concentration predicts peak gamma frequency and fMRI amplitude in response to visual stimulation in humans. Proc. Natl. Acad. Sci. U S A 2009, 106(20), 8356–8361. [Google Scholar] [CrossRef]
- Edden, R.A.E.; Muthukumaraswamy, S.D.; Freeman, T.C.A.; Singh, K.D. Orientation discrimination performance is predicted by GABA concentration and gamma oscillation frequency in human primary visual cortex. J. Neurosci. 2009, 29(50), 15721–15726. [Google Scholar] [CrossRef]
- Gaetz, W.; Edgar, J.C.; Wang, D.J.; Roberts, T.P.L. Relating MEG measured motor cortical oscillations to resting γ-aminobutyric acid (GABA) concentration. Neuroimage 2011, 55(2), 616–621. [Google Scholar] [CrossRef]
- Cousijn, H.; Haegens, S.; Wallis, G.; et al. Resting GABA and glutamate concentrations do not predict visual gamma frequency or amplitude. Proc. Natl. Acad. Sci. U S A 2014, 111(25), 9301–9306. [Google Scholar] [CrossRef]
- Kaar, S.J.; Angelescu, I.; Marques, T.R.; Howes, O.D. Pre-frontal parvalbumin interneurons in schizophrenia: a meta-analysis of post-mortem studies. J. Neural Transm. 2019, 126(12), 1637–1651. [Google Scholar] [CrossRef]
- Glausier, J.R.; Lewis, D.A. GABA and schizophrenia: where we stand and where we need to go. Schizophr. Res. 2017, 181, 2–3. [Google Scholar] [CrossRef]
- Kahn, R.S.; Sommer, I.E. The neurobiology and treatment of first-episode schizophrenia. Mol. Psychiatry 2015, 20(1), 84–97. [Google Scholar] [CrossRef]
- Fan, L.; Zhang, Z.; Ma, X.; et al. Glutamate levels and symptom burden in high-risk and first-episode schizophrenia: a dual-voxel study of the anterior cingulate cortex. J. Psychiatry Neurosci. 2024, 49(6). [Google Scholar] [CrossRef]
- Aleman, A.; Sommer, I.E.; Kahn, R.S. Efficacy of slow repetitive transcranial magnetic stimulation in the treatment of resistant auditory hallucinations in schizophrenia: a meta-analysis. J. Clin. Psychiatry 2007, 68(3), 416–421. [Google Scholar] [CrossRef]
- Tranulis, C.; Sepehry, A.A.; Galinowski, A.; Stip, E. Should we treat auditory hallucinations with repetitive transcranial magnetic stimulation? a metaanalysis. Can. J. Psychiatry 2008, 53(9), 577–586. [Google Scholar] [CrossRef]
- Li, J.; Cao, X.; Liu, S.; Li, X.; Xu, Y. Efficacy of repetitive transcranial magnetic stimulation on auditory hallucinations in schizophrenia: a meta-analysis. Psychiatry Res. 2020, 290, 113141. [Google Scholar] [CrossRef]
- Kruse, A.O.; Bustillo, J.R. Glutamatergic dysfunction in schizophrenia. Transl. Psychiatry 2022, 12(1), 500. [Google Scholar] [CrossRef]
- Remington, G.; Foussias, G.; Fervaha, G.; et al. Treating negative symptoms in schizophrenia: an update. Curr. Treat. Options Psychiatry 2016, 3(2), 133–150. [Google Scholar] [CrossRef]
- Keshavan, M.S.; Lawler, A.N.; Nasrallah, H.A.; Tandon, R. New drug developments in psychosis: challenges, opportunities and strategies. Prog. Neurobiol. 2017, 152, 3–20. [Google Scholar] [CrossRef]
- Koike, S.; Uematsu, A.; Sasabayashi, D.; et al. Recent advances and future directions in brain MR imaging studies in schizophrenia: toward elucidating brain pathology and developing clinical tools. Magn. Reson Med. Sci. 2022, 21(4), 539–552. [Google Scholar] [CrossRef]
- McQueen, G.; Sendt, K.V.; Gillespie, A.; et al. Changes in brain glutamate on switching to clozapine in treatment-resistant schizophrenia. Schizophr. Bull. 2021, 47(3), 662–671. [Google Scholar] [CrossRef]
- Kristensen, M.; Biuk, B.; Nielsen, J.; Bojesen, K.B.; Nielsen, M.Ø. Glutamate, GABA and NAA in treatment-resistant schizophrenia: a systematic review of the effect of clozapine and group differences between clozapine-responders and non-responders. Behav. Brain Res. 2025, 479, 115338. [Google Scholar] [CrossRef]
- Moriguchi, S.; Takamiya, A.; Noda, Y.; et al. Glutamatergic neurometabolite levels in major depressive disorder: a systematic review and meta-analysis of proton magnetic resonance spectroscopy studies. Mol. Psychiatry 2019, 24(7), 952–964. [Google Scholar] [CrossRef]
Figure 1.
Evidence synthesis framework. Records from MEDLINE, Embase, PsycINFO, Web of Science, and hand-searching were screened against prespecified eligibility criteria and allocated to 4 core synthesis streams (glutamatergic 1H-MRS meta-analyses and mega-analyses, GABAergic 1H-MRS meta-analyses, receptor positron emission tomography [PET] and single-photon emission computed tomography [SPECT] studies, and auditory verbal hallucination [AVH]–stratified 1H-MRS cohorts) and 3 contextual streams. Values indicate the number of reports contributing data to each stream. Case–control estimates were synthesized from published pooled estimates; AVH-stratified cohorts were synthesized narratively.
Figure 1.
Evidence synthesis framework. Records from MEDLINE, Embase, PsycINFO, Web of Science, and hand-searching were screened against prespecified eligibility criteria and allocated to 4 core synthesis streams (glutamatergic 1H-MRS meta-analyses and mega-analyses, GABAergic 1H-MRS meta-analyses, receptor positron emission tomography [PET] and single-photon emission computed tomography [SPECT] studies, and auditory verbal hallucination [AVH]–stratified 1H-MRS cohorts) and 3 contextual streams. Values indicate the number of reports contributing data to each stream. Case–control estimates were synthesized from published pooled estimates; AVH-stratified cohorts were synthesized narratively.
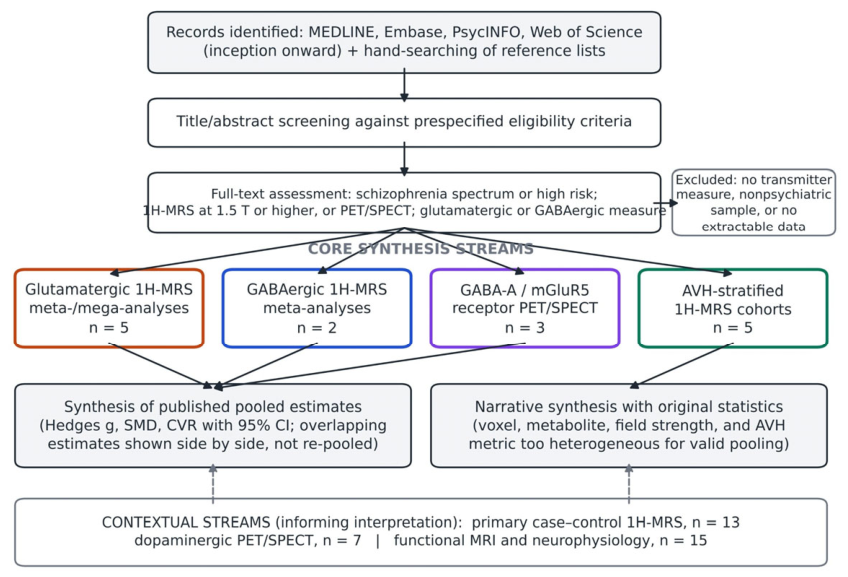
Figure 2.
Pooled case–control effect sizes for glutamatergic and GABAergic 1H-MRS markers in schizophrenia. Points show Hedges g and horizontal lines show 95% CIs, as reported in the source meta-analyses (A, glutamatergic metabolites; B, GABA). Positive values indicate higher levels in patients than in healthy controls. Estimates from different meta-analyses of the same region share constituent studies and are shown side by side rather than re-pooled. Glx indicates glutamate plus glutamine; GABA, γ-aminobutyric acid.
Figure 2.
Pooled case–control effect sizes for glutamatergic and GABAergic 1H-MRS markers in schizophrenia. Points show Hedges g and horizontal lines show 95% CIs, as reported in the source meta-analyses (A, glutamatergic metabolites; B, GABA). Positive values indicate higher levels in patients than in healthy controls. Estimates from different meta-analyses of the same region share constituent studies and are shown side by side rather than re-pooled. Glx indicates glutamate plus glutamine; GABA, γ-aminobutyric acid.
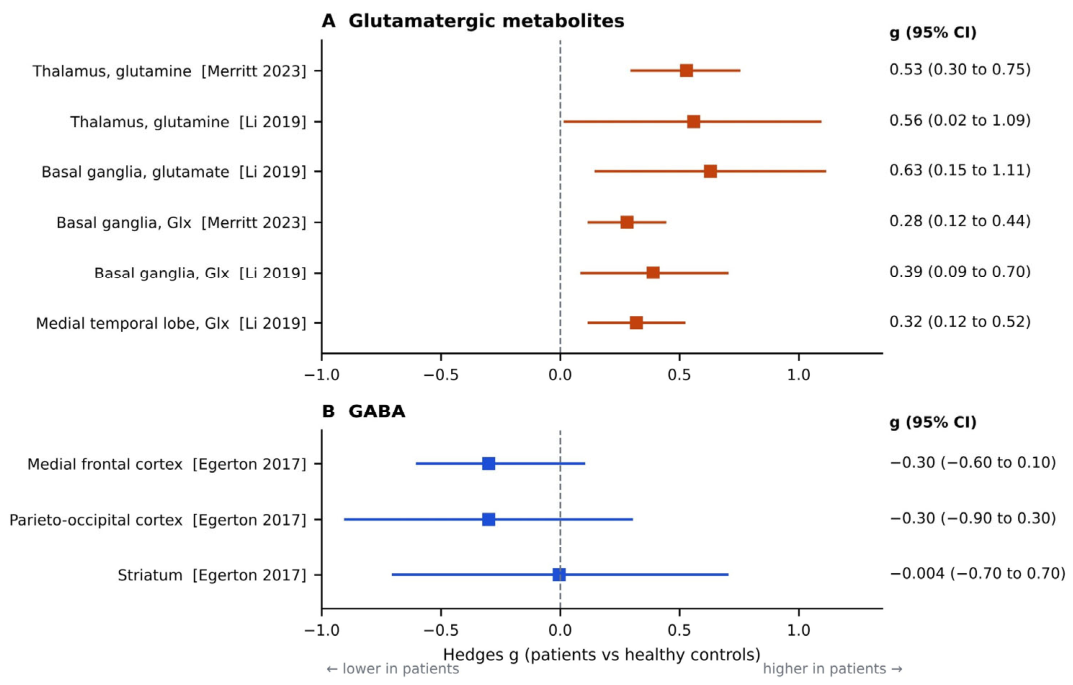
Figure 3.
Proposed temporo-cingulate glutamatergic gradient model of auditory verbal hallucinations. N-methyl-D-aspartate receptor (NMDAR) hypofunction reduces excitatory drive onto parvalbumin (PV) interneurons, disinhibiting pyramidal neurons in left superior temporal gyrus (STG), where glutamate plus glutamine (Glx) is elevated and scales with hallucination severity. Medial prefrontal cortex (mPFC) and anterior cingulate cortex (ACC) show reduced Glx and connectivity, consistent with impaired cognitive inhibition of voices. Corollary discharge failure permits self-generated inner speech to be experienced as externally generated. 1H-MRS GABA and GABA-A receptor PET are insensitive to the subpopulation-specific inhibitory lesion. Solid arrows denote associations supported by in vivo evidence; dashed arrows denote inferred mechanistic links.
Figure 3.
Proposed temporo-cingulate glutamatergic gradient model of auditory verbal hallucinations. N-methyl-D-aspartate receptor (NMDAR) hypofunction reduces excitatory drive onto parvalbumin (PV) interneurons, disinhibiting pyramidal neurons in left superior temporal gyrus (STG), where glutamate plus glutamine (Glx) is elevated and scales with hallucination severity. Medial prefrontal cortex (mPFC) and anterior cingulate cortex (ACC) show reduced Glx and connectivity, consistent with impaired cognitive inhibition of voices. Corollary discharge failure permits self-generated inner speech to be experienced as externally generated. 1H-MRS GABA and GABA-A receptor PET are insensitive to the subpopulation-specific inhibitory lesion. Solid arrows denote associations supported by in vivo evidence; dashed arrows denote inferred mechanistic links.
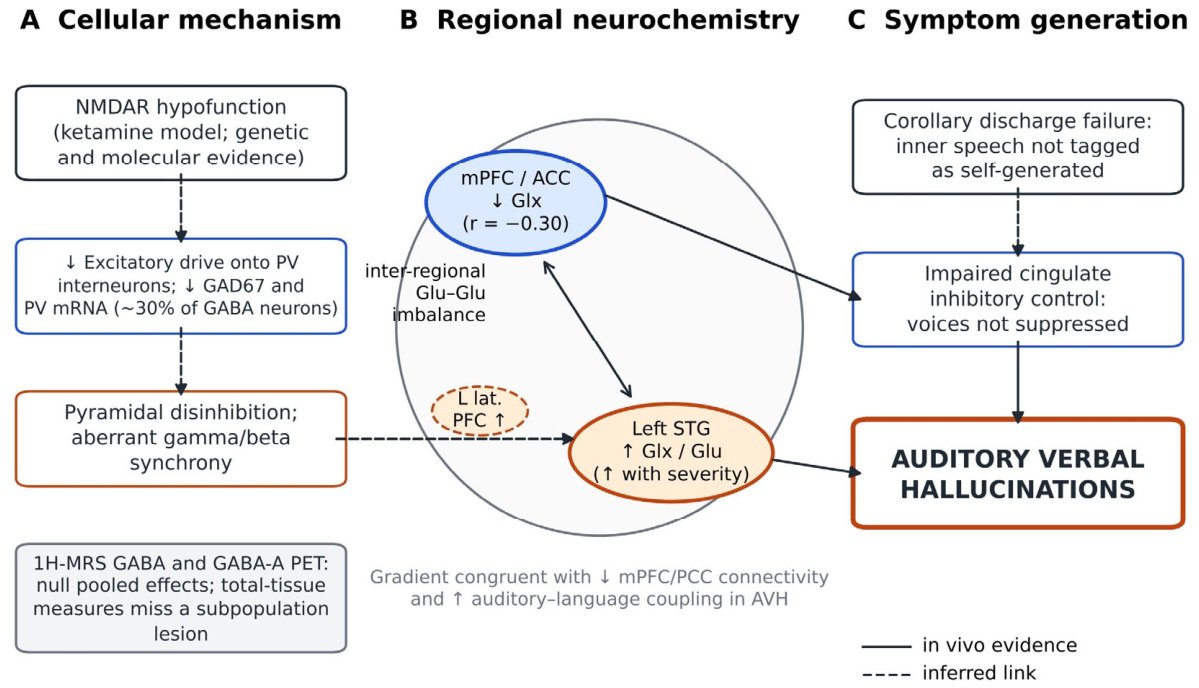

Table 1.
1H-MRS Cohorts Reporting Glutamatergic or GABAergic Measures by Auditory Verbal Hallucination Status or Severity.
Table 1.
1H-MRS Cohorts Reporting Glutamatergic or GABAergic Measures by Auditory Verbal Hallucination Status or Severity.
| Study | Sample | Acquisition | Voxel(s) | AVH measure | Glutamatergic findings | GABA findings |
|---|---|---|---|---|---|---|
| Hjelmervik et al, 2020 [54] | 77 SZ, 77 HC | 3 T; PRESS and MEGA-PRESS (TE 68 or 35 ms) | L STG, R STG, ACC, L IFG | PANSS P3 | High- vs low-AVH: higher L STG Glx, lower ACC Glx; HC intermediate. L STG Glx–AVH positive (P = .054); ACC Glx–AVH negative (P = .04) | GABA+ unrelated to AVH; no case–control difference |
| Wang et al, 2022 [55] | 61 SZ with pAVH, 53 SZ without AVH, 59 HC | Single-voxel 1H-MRS | mPFC | pAVH status and severity | pAVH < non-AVH (Glx P = .012; tNAA P = .022) and < HC (both P = .001); Glx r = −0.30 (P = .002) with severity | Not measured |
| Hjelmervik et al, 2018a | 23 SZ (18 AVH, 5 non-AVH), 53 HC | PRESS (Glu); MEGA-PRESS (GABA) | Bilateral STG | Hallucination severity | R STG Glu higher in SZ (P = .005); L STG Glu–severity β = 0.36 (P = .05) | No main or interaction effects (all P > .1) |
| Weber et al, 2021 [56] | 81 psychosis (high vs low AVH) | 1H-MRS with resting-state fMRI | ACC; L STG | High vs low AVH | ACC Glu positively related to interhemispheric STG connectivity in high-AVH only | ACC GABA negatively related to connectivity in low-AVH only |
| Craven et al, 2025 [57] | 51 psychosis with hallucinatory traits (P3 ≥3), 51 HC | 3 T functional MEGA-PRESS (TE 68 ms) and fMRI; flanker task | Medial ACC | PANSS P3; BAVQ-R | Lower baseline Glx in patients; Glx–BOLD positive in patients vs negative in HC (interaction P = .016); task-evoked Glx increase similar | No group or task effects on GABA+ |
Abbreviations: ACC, anterior cingulate cortex; AVH, auditory verbal hallucinations; BAVQ-R, Beliefs About Voices Questionnaire–Revised; BOLD, blood oxygenation level–dependent; fMRI, functional magnetic resonance imaging; GABA+, γ-aminobutyric acid plus macromolecules; Glu, glutamate; Glx, glutamate plus glutamine; HC, healthy controls; IFG, inferior frontal gyrus; L, left; MEGA-PRESS, Mescher-Garwood point-resolved spectroscopy; mPFC, medial prefrontal cortex; pAVH, persistent AVH; PANSS P3, Positive and Negative Syndrome Scale hallucinatory behavior item; R, right; STG, superior temporal gyrus; SZ, schizophrenia; TE, echo time; tNAA, N-acetylaspartate plus N-acetylaspartylglutamate. aMeeting abstract (Schizophr Bull. 2018;44 [suppl 1]; doi:10.1093/schbul/sby017.715). Four of the 5 cohorts originate from the same research center; participant overlap cannot be excluded.
Table 2.
Principal Sources of Heterogeneity in AVH Neurochemical Imaging and Recommendations for Future Studies.
Table 2.
Principal Sources of Heterogeneity in AVH Neurochemical Imaging and Recommendations for Future Studies.
| Source | Evidence | Recommendation |
|---|---|---|
| Edited GABA measurement | Low signal-to-noise ratio and subtraction artifacts; GABA+ includes macromolecules; total tissue pool cannot isolate synaptic GABA [15,16] | Follow consensus MEGA-PRESS guidance; report macromolecule handling and fit-quality metrics [14,15] |
| Referencing and tissue correction | Creatine ratios confounded by creatine change; voxel gray/white matter fractions vary | Report tissue-corrected, water-referenced concentrations alongside ratios |
| Voxel placement | Direction of AVH effects reverses between left STG and mPFC/ACC [54,55] | Multivoxel or spectroscopic imaging covering STG, IFG, ACC, and mPFC |
| Antipsychotic exposure | mPFC glutamate negatively associated with dose; no case–control differences in antipsychotic-naive subgroup [18,19] | Record dose equivalents; include antipsychotic-naive or longitudinal samples |
| Age and illness stage | Faster age-related glutamate decline in patients; nonlinear stage effects [20,81] | Age-matched designs; model age; stratify by illness stage |
| Sample size and balance | Groups as unbalanced as 18 vs 5; associations marginal | Power for r = 0.24-0.30 (approximately 85-135 patients for 80% power, 2-sided α = .05) |
| AVH phenotype | PANSS P3, AHRS, and dichotomous classifications not interchangeable; persistent AVH may be distinct [55] | Continuous validated AVH scales; report persistence and frequency |
| Receptor imaging | Benzodiazepine-site tracers lack subtype selectivity; no AVH-stratified PET study [25,26] | α5-selective and mGluR5 PET in AVH-stratified samples; combined PET-MRS |
| Cohort overlap | Four of 5 AVH cohorts from 1 center | Declare overlap; share data for individual participant mega-analysis |
Abbreviations: ACC, anterior cingulate cortex; AHRS, Auditory Hallucination Rating Scale; AVH, auditory verbal hallucinations; GABA+, γ-aminobutyric acid plus macromolecules; IFG, inferior frontal gyrus; MEGA-PRESS, Mescher-Garwood point-resolved spectroscopy; mGluR5, metabotropic glutamate receptor 5; mPFC, medial prefrontal cortex; PANSS P3, Positive and Negative Syndrome Scale hallucinatory behavior item; PET, positron emission tomography; STG, superior temporal gyrus. Sample sizes were calculated by the author using the Fisher z transformation.
Disclaimer/Publisher’s Note: The statements, opinions and data contained in all publications are solely those of the individual author(s) and contributor(s) and not of MDPI and/or the editor(s). MDPI and/or the editor(s) disclaim responsibility for any injury to people or property resulting from any ideas, methods, instructions or products referred to in the content. |
© 2026 by the author. Licensee MDPI, Basel, Switzerland. This article is an open access article distributed under the terms and conditions of the Creative Commons Attribution (CC BY) license.
Copyright: This open access article is published under a Creative Commons CC BY 4.0 license, which permit the free download, distribution, and reuse, provided that the author and preprint are cited in any reuse.