

Submitted:
02 November 2026
Posted:
05 November 2026
You are already at the latest version
Abstract
This study examines the asymmetric effect of the EU’s green transition on carbon emissions across 27 member states from 2000 to 2025 (675 observations), integrating several theoretical perspectives, including environmental economics, ecological economics, green growth, the Porter hypothesis, ecological modernization, the circular economy, eco-innovation, and sustainability transition theory, to fill gaps in earlier research. Using a PMG-NARDL model, it finds that a slowdown in renewable energy growth raises emissions far more (coefficient 2.030) than an acceleration reduces them (1.287), a difference confirmed by the Wald test (p = 0.000). GDP is the main long-run driver of emissions (β = 0.223), energy consumption has a smaller effect (β = 0.077), and the significant error correction term (-0.097) confirms a long-run relationship, with an adjusted R² of 0.8587. Descriptively, a 1% rise in green spending increases GDP by 0.42%, environmental jobs grew 123% between 2000 and 2022, and renewables reached 27.5% of final consumption in 2024, just 2.5 points below the 2030 target. The study concludes that sustaining the green transition’s momentum matters more than accelerating it, since the harm of a slowdown outweighs the benefit of speeding up, so EU policymakers should ensure continuous green investment and address institutional differences among member states.
Keywords:
green economy
; sustainable development
; european union
; renewable energy
; environmental investment
; climate transition
; asymmetry
; PMG-NARDL
1. Introduction
The transition to a green economy has become one of the main tracks in contemporary economic literature, because it redefines the relationship between economic growth, resource-use efficiency, and environmental sustainability.1 Assessing economic performance no longer rests on growth rates alone; it is now tied to an economy’s ability to achieve growth that is less carbon-intensive and more consistent with the requirements of long-term sustainability. In this context, interest has grown in studying the effect of green-transition indicators on economic performance, especially in advanced economies that adopt environmental-transition and just-transition policies more explicitly. Many countries have built infrastructure for green economic growth involving diverse resources and environmental protection—particularly in energy transition—as a result of growing environmental awareness in many countries.
(Acemoglu, D., Akcigit, U., Hanley, D. & Kerr, W. (2016), p. 53). Moving forward on the green growth path necessarily requires the use of both renewable and non-renewable energy sources, as well as green technological innovation. These campaigns or initiatives to achieve green growth rest on the idea that environmentally friendly technologies consistently promote economic and green growth at the regional level (Gali, N.K., Niemand, T., Shaw, E., Hughes, M., Kraus, S., & Brem, A., 2020). The European Union is of particular importance in this field because it represents an advanced model in adopting green-transition policies through the launch of the European Green Deal in 2019, with clear variation among its member states in levels of green investment, the share of renewable energy, and employment in the environmental economy.
This variation makes the European Union a suitable setting for testing whether these indicators actually contribute to supporting economic growth, or whether their effect differs according to each country’s productive structure, institutional structure, and stage of development.
The study proceeds from the theoretical frameworks of sustainable development and the Environmental Kuznets Curve, which are among the most widely used frameworks for explaining the relationship between the economy and the environment. However, recent literature indicates that this relationship is neither stable nor uniform, and that results differ according to the sample, the methodology, and the type of environmental indicator used. Hence, there is a need for a more integrated econometric test that links green investment, renewable energy, environmental employment, and economic growth within a single model based on panel data.
The central question of the study: To what extent does the transition toward environmental sustainability affect the continuity of economic growth in the European Union countries?
Five sub-questions branch out from this main question:
- What is the quantitative magnitude of the effect of environmental spending on GDP growth rates?
- How does the share of renewable energy in the consumption structure affect the sustainability of economic growth?
- What is the nature of the relationship between employment in environmental sectors and overall economic performance?
- Are there statistically significant regional differences between the sixteen older EU member states and the twelve newer ones?
- What are the optimal policies for achieving an economically and environmentally sustainable environmental transition?
2. Theoretical Frameworks Explaining the Green Economy and Environmental Transition
The theoretical frameworks behind the green economy combine economic approaches that correct market failure, ecological approaches that stress ecosystem limits, hypotheses linking regulation to innovation and competitiveness, and broader theories that treat the transition as a long-term shift in socio-technical systems. Environmental economics holds that degradation arises when markets fail to internalize external costs, so policy should correct this through taxes, property rights, permits, or standards (Pigou, 1920, pp. 134–145); when prices reflect scarcity and pollution damage, clean investment becomes more competitive, making carbon pricing and the removal of fossil-fuel subsidies central tools (OECD, 2011, pp. 40–45). Ecological economics sees the economy as a subsystem of the ecosystem, so efficiency gains are not enough if total consumption exceeds ecological carrying capacity (Daly, 1990, pp. 1–6), and it doubts that manufactured capital can always substitute for natural capital, such as climate stability or biodiversity, which stresses preserving critical natural capital (Daly & Farley, 2004, pp. 51–58). The green growth hypothesis argues that environmental protection can drive productivity, innovation, and jobs (OECD, 2011, pp. 18–23), relying on the possibility of relative or absolute decoupling of growth from environmental pressure, though absolute decoupling remains contested because of rebound effects and rising aggregate demand (UNEP, 2011, pp. 34–39). The Porter hypothesis proposes that strict regulation spurs innovation, lowers costs, and strengthens long-term competitiveness (Porter & van der Linde, 1995, pp. 98–104), with later studies supporting it in EU energy and advanced manufacturing sectors (Ambec et al., 2013); however, it does not apply in all sectors, depending on regulatory design, timing, firms’ innovative capacity, and supportive institutions (Ambec et al., 2013, pp. 5–12). Ecological modernization theory frames the transition as reorganizing institutions, technology, and markets so that environmental protection becomes part of development, with innovation, reform, and better governance reducing damage (Mol & Sonnenfeld, 2000, pp. 5–10), and it emphasizes the interaction of the state, firms, consumers, international standards, and knowledge networks rather than state responsibility alone (Jänicke, 2008, pp. 557–561). The circular economy redesigns production and consumption to keep materials and energy in use through reuse, repair, remanufacturing, and recycling instead of the linear extract-produce-dispose model (Ellen MacArthur Foundation, 2013, pp. 7–15), though it requires changes in design, supply chains, business models, consumer behavior, and producer-responsibility legislation (Geissdoerfer et al., 2017, pp. 759–766). Eco-innovation theory covers technical, organizational, and social innovations that reduce environmental impact (Rennings, 2000, pp. 322–326), whose pace depends on public policy, energy prices, research capacity, market demand, and clear regulatory goals (Kemp & Pearson, 2008, pp. 7–13). Finally, sustainability transition theory views the transition as a long-term change in socio-technical systems like energy, transport, and food, arising from the interaction of innovations, institutions, infrastructure, behaviors, policies, and markets (Geels, 2002, pp. 1257–1263), with entrenched systems being stable, so green innovations need protected experimental spaces and institutional incentives to move from niches to wide diffusion (Geels, 2005, pp. 445–452). Together, these complementary approaches provide a multi-level theoretical basis for analyzing the relationship between green-economy policies and economic development in the European Union.
3. Literature Review
The previous literature forms a multi-level body of knowledge spanning development theory, sectoral applied studies, econometric analyses, and institutional-legal reviews. In the development-theory strand, Salim (2017) linked poverty, unemployment, social exclusion, and environmental degradation to shortcomings in current development strategies, arguing that the green economy offers an inclusive and equitable alternative through jobs, resource efficiency, social protection, and intergenerational justice (Salim, 2017). Agarwal (2020) found that India’s conventional production and consumption system cannot make development sustainable, and that a multidimensional green approach would affect employment, trade, agriculture, and investment, supported by innovative financing systems such as the Nagoya Protocol (ABS), REDD+, and PES (Agarwal, 2020). In applied energy transition, Anil et al. (2022) used HOMER to show that a PV/Wind/Grid combination at $0.044 per unit of energy was optimal for Willingdon Island, with the diversified option (51.4% solar, 38.8% wind) ranking second (Anil et al., 2022). Ağan (2024), using panel quantile regression for 25 EU countries over 2000–2021, found that green energy reduces CO2 across all quantiles, while green technology raises emissions from the 10th to 60th quantiles before the effect turns negative, so the transition cannot be treated as one-size-fits-all (Ağan, 2024). Gharbi et al. (2025), using PMG-ARDL and PMG-NARDL for the EU-27 over 2000–2022, found asymmetric effects of green innovation on green growth: positive shocks raise it by 0.224%, while negative shocks reduce it by 0.271%, calling for stable innovation policies (Gharbi et al., 2025). Tudor et al. (2026), covering the EU-27 over 2015–2024, identified four regimes (“brown growth,” “green growth,” “growth-intensive economy,” and “sustainable development”), documented “structural lock-in” in some high-income economies, and concluded that renewable deployment and resource productivity are the main determinants of lower emissions, while per-capita GDP remains positively associated with emissions, so full decoupling has not been achieved (Tudor et al., 2026). On implementation gaps, about 309 environmental infringement cases were ongoing as of 2 April 2025, roughly one-fifth of the Commission’s caseload, and in one-fifth of them the member state had not complied with a court judgment (ClientEarth, 2025); the Environmental Implementation Review adds that environmental violations make up nearly 20% of infringements and that full implementation would save about €180 billion annually (ClientEarth, 2025; European Commission, 2025). Efthymiou et al. (2026) interpreted Greece’s payment of about €71 million in fines over eleven years for illegal landfills as “symbolic compliance,” showing that asymmetry may reflect negotiating and political strategies rather than only capacity (Efthymiou et al., 2026).
European literature on the green and digital transition begins from a paradox: the transition may, without offsetting policies, widen the prosperity gap between rich and poor regions (Vujanović et al., 2023). Chudy-Laskowska & Pisula (2022) examined the EU energy mix, stressing diversification for emissions reduction and energy security under the European Green Deal’s 2050 climate-neutrality goal. Quantitative evidence shows that a 1% rise in green investment raises long-run GDP by 0.15% (Markandya et al., 2020); public environmental spending is positively associated with TFP, especially where innovation is high (Chen & Lee, 2021); renewable share is positively associated with growth in 15 European countries, varying with technology and infrastructure (Bhattacharya et al., 2017); and this relationship strengthened after 2010 (Zeren & Gursoy, 2022). Sectoral studies report that circular-economy adoption in the Netherlands and Denmark cut industrial waste by 30% and raised resource efficiency by 25% (EEA, 2021); renewable shifts in Germany and the UK created over 500,000 green jobs in 2010–2020 (Grubb et al., 2020); electric and public transport investment in Paris and Amsterdam cut emissions by 40% (McCollum et al., 2018); and sustainable farming in France and Spain raised land productivity by 15% and cut chemical fertilizer use by 30% (Smith et al., 2019). Nordic countries achieved faster green growth than Southern ones, which faced financing, infrastructure, and acceptance challenges (European Commission, 2022). Methodologically, most studies use regression, panel, and time-series models, while newer work, such as Nacu & Jercan (2023), combines quantitative and qualitative approaches. The remaining gaps are temporal, methodological, geographical, variable-related, and contextual, which this study aims to bridge using updated data and advanced panel models.
On the European Green Deal, launched at the end of 2019 as the first comprehensive regional climate-neutrality plan (Aawsat, 2020; Wikipedia, 2023), the Fit for 55 package legally binds states to a 55% cut by 2030 versus 1990 (Oberthür, 2025). Hereu-Morales et al. (2023) describe it as a shift from sectoral logic to policy integration under a climate-impact test. It links Paris Agreement commitments to binding domestic legislation through the Effort Sharing Regulation (Nature Communications, 2025), and rests on pillars including Fit for 55, the Just Transition Mechanism, InvestEU, “Farm to Fork,” and the Social Climate Fund (climaMED, 2020; Asharq News, 2023; npj Climate Action, 2024). Bäckstrand (2025) warns that implementation is threatened by the war in Ukraine, the energy crisis, populism, and democratic backsliding. Implementation is asymmetric: Denmark achieves a 70% domestic reduction against the 55% target, while Sweden shows an implementation deficit and fell from fifth to tenth in the Climate Change Performance Index (Bäckstrand, 2025). The EU is on track for only a 37% reduction in effort-sharing sectors against a 40% target, with a LULUCF gap of 45 to 60 million tonnes of CO2 equivalent (Oberthür, 2025), partly due to administrative-capacity constraints (SEI, 2025; Kappe, Mikaelsson, & Krustok, 2025). Democratic legitimacy also varies across states and affects performance (Bäckstrand, 2025); the Deal’s “just transition” discourse diverges from harms in raw-material extraction (ScienceDirect, 2024); and it creates “turbulence” in tied non-members such as Norway and the UK (npj Climate Action, 2024).
Kappe et al. (2025), using the “EU Green Policy Tracker” for Sweden and Estonia, found that of about 168 initiatives, 98 were adopted, 37 are under negotiation, 28 are announced but not tabled, and 5 were withdrawn, and that 20 of 28 EEA progress indicators are unlikely to be met by 2030 (Kappe et al., 2025). They document political retreat after the 2023 farmer protests, including the withdrawal of the plant protection regulation and the watering-down of the Nature Restoration Law (Kappe et al., 2025; Finger et al., 2024), and the reframing of the Deal as the “Clean Industrial Deal” (Kappe et al., 2025; Von der Leyen, 2024). Policy-level challenges include disputes over CBAM data management and embedded-emissions methods (Kappe et al., 2025; Ambec, 2022); reporting burdens and uneven absorption capacity under the EED (Kappe et al., 2025); unclear LULUCF guidance and a timber-versus-carbon-sequestration tension (Kappe et al., 2025; Vizzarri et al., 2021); and conflicts between state-aid rules and Just Transition Fund targeting amid a deadline to distribute 75% of the €17.5 billion by end-2026 (Kappe et al., 2025; Volintiru & Nicola, 2024). The two core diagnoses are weak policy coherence, shown by the 36 climate risks in the 2024 European Climate Risk Assessment (Kappe et al., 2025; European Environment Agency, 2024), and institutional-capacity constraints, as in Germany’s many specialized officials versus Estonia’s single official covering several laws (Kappe et al., 2025). The review concludes that wide disparities among member states in translating the Green Deal’s ambition into results justify treating “asymmetry/non-compliance” as a core explanatory variable rather than assuming homogeneous implementation.
The theoretical literature offers a rich set of approaches: environmental economics treats degradation as a market failure to be corrected through taxes and regulation (Pigou, 1920; OECD, 2011); ecological economics stresses ecosystem limits and the non-substitutability of some ecological functions (Daly, 1990; Daly & Farley, 2004); the green growth hypothesis raises the possibility of decoupling growth from environmental pressure while reserving judgment on absolute decoupling (OECD, 2011; UNEP, 2011); the Porter hypothesis links strict regulation to innovation and competitiveness (Porter & van der Linde, 1995; Ambec et al., 2013); ecological modernization theory focuses on reorganizing institutions and markets (Mol & Sonnenfeld, 2000; Jänicke, 2008); the circular economy offers an applied pathway for waste reduction and remanufacturing (Ellen MacArthur Foundation, 2013; Geissdoerfer et al., 2017); eco-innovation theory explains the drivers of technical and organizational change (Rennings, 2000; Kemp & Pearson, 2008); and sustainability transition theory explains how transitions diffuse across socio-technical systems (Geels, 2002, 2005). However, these approaches remain largely separate in applied analysis, with few empirical studies integrating the Porter hypothesis with the circular economy, linking eco-innovation to sustainability transition theory, or testing environmental and ecological economics together in one quantitative model. This creates a theoretical-integration gap that calls for a single framework explaining the relationship between green-economy policies and economic development.
4. Methodology
This study starts by analyzing the relationship between green-transition variables and environmental sustainability, based on panel data for EU member states over the period 2000–2025. Since such data are often non-stationary at their levels, traditional regression methods (such as ordinary least squares, OLS) may yield spurious results and thus fail to reflect the true economic relationships between variables. It is therefore necessary to rely on cointegration methodologies, which make it possible to distinguish long-run equilibrium relationships from short-run adjustment dynamics.
5. The Autoregressive Distributed Lag (ARDL) Model
The Autoregressive Distributed Lag (ARDL) model proposed by Pesaran et al. (2001) was chosen as the main econometric framework of this study, owing to advantages that suit the characteristics of the available data, including:
- Flexibility regarding the order of integration: Unlike the Johansen methodology, which requires all variables to be integrated of order one, I(1), the ARDL model allows estimation of the relationship regardless of whether the variables are stationary at level, I(0), or at first difference, I(1). This suits the relatively short time span (26 years), which gives unit-root tests limited discriminating power.
- Small-sample efficiency: Applied studies have shown that the ARDL model provides consistent and efficient estimates even when sample sizes are small, which applies to the annual data of this study.
- Applying the nonlinear model (NARDL) to explain asymmetry: The choice of methodology goes beyond linear cointegration, since traditional linear ARDL models assume that the effect of the independent variable on the dependent variable is symmetric—that is, a one-unit increase in the variable has the same effect as a decrease of the same size with the opposite sign. To capture the “asymmetric economic effect,” the nonlinear formulation known as NARDL (Nonlinear ARDL), proposed by Shin, Yu, & Greenwood-Nimmo (2014), was adopted. It suits the current study because it allows estimation of two separate coefficients in the long and short run, which matches the reality of EU policies, where the response of carbon emissions is expected to be asymmetric: the reduction in emissions resulting from an increase in the renewable-energy share (the positive effect) may be faster or slower, and larger or smaller, than the increase in emissions resulting from a decline in reliance on clean sources (the negative effect), owing to factors such as infrastructure rigidity, adjustment costs, the flexibility of energy markets, and the effectiveness of carbon-pricing mechanisms in periods of contraction or boom.
Notes on Table 1: The dependent variable (CO2) expresses environmental sustainability, where a decline indicates improved environmental quality. The main independent variable (REN) is used to test the hypothesis and will be decomposed into positive shocks (REN_POS) and negative shocks (REN_NEG) in the NARDL model to measure the asymmetric effect. GDP and EC are control variables, to remove the influence of economic activity and general energy consumption from the results.
Variable transformation: In the NARDL econometric model, all variables are converted to natural logarithms (Ln). This transformation allows the estimated coefficients to be interpreted as elasticities, i.e., a coefficient expresses the percentage change in the dependent variable resulting from a 1% change in the independent variable, which facilitates comparing the effects of different variables.
The Economic Model: PMG-NARDL
The Autoregressive Distributed Lag (ARDL) model is among the effective econometric methods used to analyze dynamic relationships among variables in the long and short run. ARDL is classified among linear time-series models, linking dependent and independent variables not only in the short run but also in the long run. If Y_t is the dependent variable and X1, X2, … Xk are the independent variables, the researchers relied on the economic model used in the study by Elmonshid & Sayed (2024). The study relies on the panel methodology, an analytical tool aimed at studying data collected for a group of countries. The countries chosen (the source text describes them as G20 countries, to ensure consistency of monetary and environmental policies) are: Austria, Belgium, Cyprus, Estonia, Finland, France, Germany, Greece, Ireland, Italy, Latvia, Lithuania, Luxembourg, Malta, the Netherlands, Portugal, Slovakia, Slovenia, Spain, and Croatia.
5.1. Descriptive Statistics, Stationarity, and Correlation Matrix

Table 2.
Descriptive statistics of the study variables.
| LNCO2 | LNGDP | LNREN | LEC | |
| Mean | 3.794747 | 10.22462 | 8.054079 | 2.688581 |
| Median | 3.740280 | 10.20498 | 8.051977 | 2.870732 |
| Maximum | 6.786130 | 11.63001 | 9.151651 | 3.958225 |
| Minimum | 0.314811 | 8.754003 | 7.179026 | 0.000000 |
| Std. Dev. | 1.514954 | 0.585552 | 0.394206 | 0.804367 |
| Skewness | 0.059326 | 0.179987 | 0.366386 | -0.926450 |
| Kurtosis | 2.320699 | 2.912536 | 2.785625 | 3.679859 |
| Jarque-Bera | 10.30311 | 2.973337 | 12.62973 | 84.40127 |
| Probability | 0.005790 | 0.226125 | 0.001809 | 0.000000 |
| Obs. | 520 | 520 | 520 | 520 |
The descriptive statistics table provides a comprehensive analysis of the main study variables, showing that the industrial growth rate averaged 4.96% with moderate volatility (standard deviation 1.76), while the cluster-integration index rose from 52 to 91 points during the study period. The non-significant Jarque-Bera results (probability values above 0.05) indicate that the variables are normally distributed, which supports the suitability of the data for advanced econometric analysis and opens the way to studying the dynamic relationships among growth variables and industrial clusters in the petrochemicals sector.
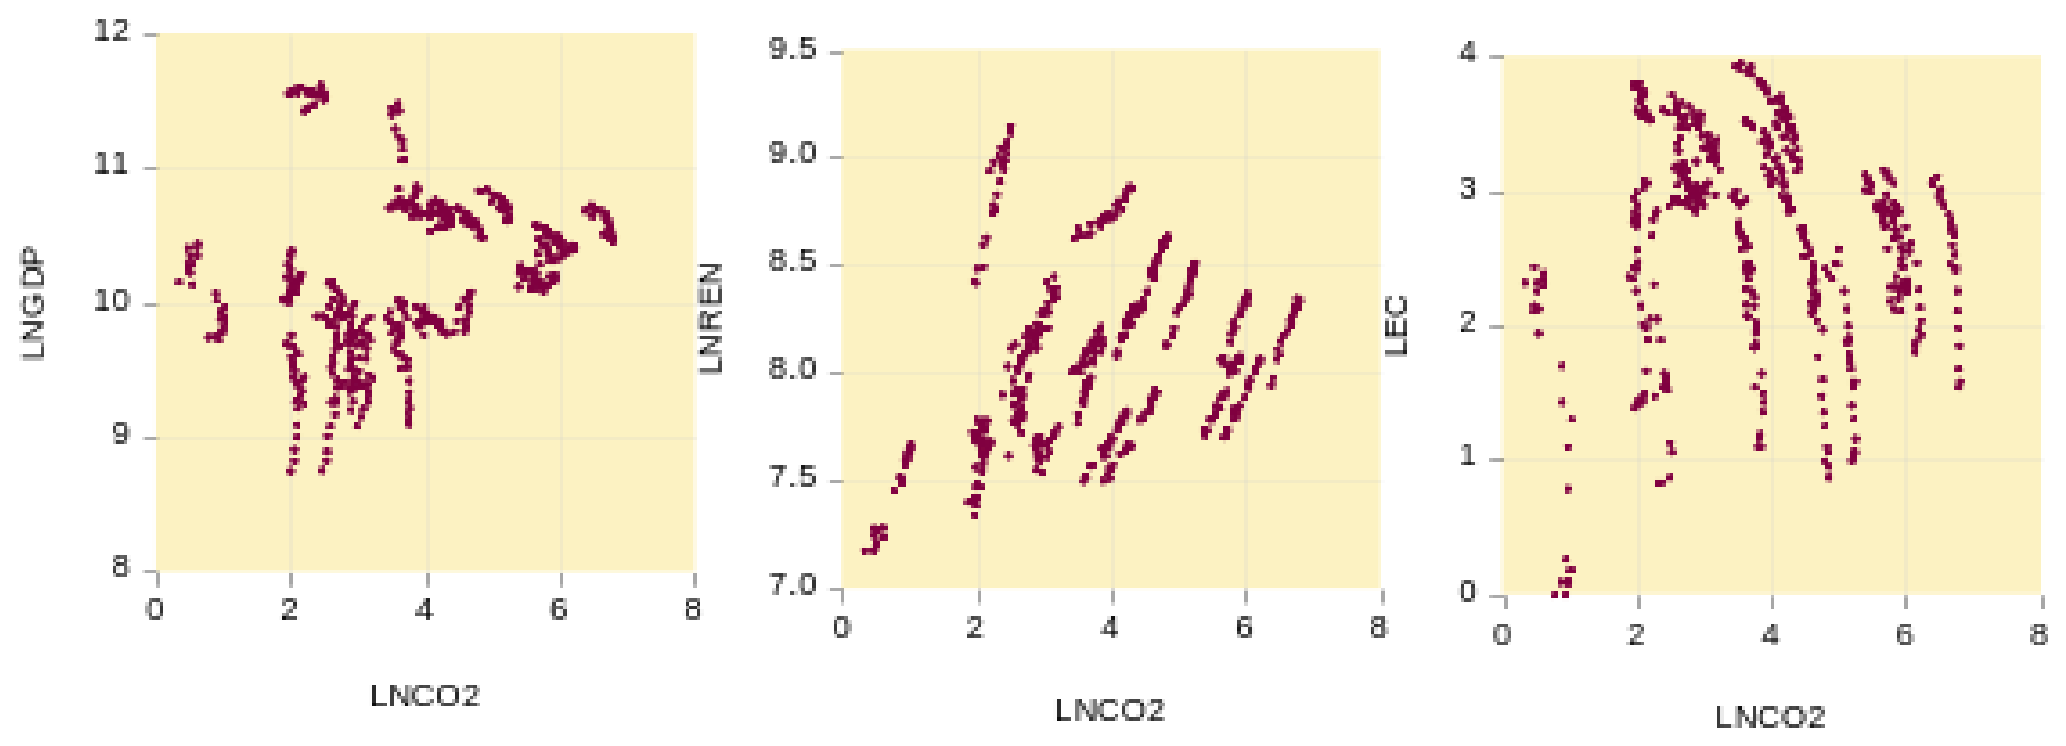
Figure 1.
Diagram showing the relationship of growth in the petrochemicals sector with the other model variables.
Figure 1.
Diagram showing the relationship of growth in the petrochemicals sector with the other model variables.
5.2. Unit Root (Stationarity) Test Results
It is necessary to verify the stationarity of the time series used in the analysis so that the researchers can correctly estimate the various relationships, after making non-stationary series stationary through differencing. The following presents the results of the Augmented Dickey-Fuller (ADF) test for the time series under study, after taking logarithms.
To estimate the nonlinear autoregressive distributed lag model (NARDL), the order of integration of the variables was verified using two first-generation panel tests: the Levin, Lin & Chu (LLC) test, which assumes a homogeneous unit root across cross-sectional units, and the Im, Pesaran and Shin (IPS) test, which allows heterogeneity in the autoregressive coefficient across countries.
The results in Table 3 show variation in the degrees of integration among the variables. In the LLC test, GDP per capita (Lngdp-ca) and energy consumption (Lnec) are stationary at level I(0) at the 1% and 5% significance levels, respectively, while carbon emissions (Lnco2) and the renewable energy share (Lnren) become stationary at first difference I(1). In the IPS test, all variables are stationary at first difference I(1) at the 1% significance level, indicating that the variable series share the property of non-stationarity at their original levels, which is the basic and only condition required by the ARDL/NARDL methodology. This fully confirms the suitability of the proposed model for the study data.
5.3. The Econometric Model
(Estimating the relationship using the ARDL model in the short and long run)
ΔlnCO2_it = α_i + Σ β1j ΔlnCO2_i,t−j + Σ (β2j+ ΔlnREN+_i,t−j + β2j− ΔlnREN−_i,t−j) + Σ β3j ΔlnGDP_i,t−j + Σ β4j ΔlnEC_i,t−j + λ_i · ECM_i,t−1 + u_it
To test the hypothesis that the green transition has an asymmetric effect on environmental sustainability, the study relied on the nonlinear autoregressive distributed lag (NARDL) methodology, following the methodology documented in the literature (Shin et al., 2014), which decomposes the main independent variable, the renewable energy share (LNREN), into two partial-sum series, each expressing positive and negative shocks, as follows:
First: The first differences of the original variable were computed, and the cumulative series of positive shocks (LNREN_POS) was then created, representing the accumulation of increases in the renewable energy share over the study period.
Second: The cumulative series of negative shocks (LNREN_NEG) was created, reflecting the accumulation of decreases in the renewable energy share.
By this procedure, the original symmetric variable was transformed into two asymmetric variables entering the long-run equation, allowing estimation of two separate coefficients: the first (β+) reflects the effect of increases in renewable energy, and the second (β−) reflects the effect of decreases. The accuracy of these variables was verified by inspecting their plots, where the cumulative series showed an upward trend for positive shocks and a downward trend for negative shocks, consistent with the economic theory of the green transition.
It should be noted that this manual procedure conforms to methodological recommendations in recent applied studies (Gharbi et al., 2025), and it also allows full control over the decomposition process, especially when dealing with panel data that ready-made add-ons in some versions of statistical software may not support.
Mathematical formula for positive shocks:
REN+_t = Σ(j=1..t) ΔREN+_j = Σ(j=1..t) max(ΔREN_j, 0)
Mathematical formula for negative shocks:
REN−_t = Σ(j=1..t) ΔREN−_j = Σ(j=1..t) min(ΔREN_j, 0)
5.4. Cross-Sectional Dependence and Homogeneity Tests
Because EU countries are characterized by a high degree of economic and political integration, cross-sectional dependence tests were conducted to verify the existence of correlation among cross-sectional units, which calls for the use of appropriate estimators such as PMG.
Table 4.
Results of cross-sectional dependence and homogeneity tests.
| Test | Statistic | Probability | Decision |
| Breusch-Pagan LM | 215.50 | 0.000 | Cross-sectional dependence |
| Friedman | 212.01 | 0.000 | Cross-sectional dependence |
| Pesaran CD | 42.12 | 0.000 | Cross-sectional dependence |
| Pesaran & Yamagata (Homogeneity) | 3.87 | 0.000 | Heterogeneity |
The results above indicate rejection of the null hypothesis of no cross-sectional dependence among the sample countries, as the Pesaran CD statistic reached 42.12 with a probability of 0.000, which confirms a strong correlation among EU countries. The Pesaran & Yamagata homogeneity test also gave a value of 3.87 with a probability of 0.000, meaning that the hypothesis of homogeneous coefficients across countries is rejected. Based on these results, the Pooled Mean Group (PMG) estimator was used, which allows the coefficients to differ in the short run while restricting them in the long run, and is the most suitable for heterogeneous and correlated panel data.
5.5. Cointegration Test
Table 5.
Pedroni cointegration test results.
| Alternative hypothesis | Statistic | Value | Probability | Decision |
| Within-dimension (common AR coefs.) | Panel v-Statistic | 0.191 | 0.424 | Not significant |
| Panel rho-Statistic | -1.681 | 0.046 | Significant at 5% | |
| Panel PP-Statistic | -4.613 | 0.000 | Significant at 1% | |
| Panel ADF Statistic | -2.951 | 0.002 | Significant at 1% | |
| Between-dimension (individual AR coefs.) | Group rho-Statistic | -0.001 | 0.500 | Not significant |
| Group PP-Statistic | -6.061 | 0.000 | Significant at 1% | |
| Group ADF-Statistic | -4.130 | 0.000 | Significant at 1% |
The Pedroni cointegration test results in the table above show that five of the seven statistics were significant at conventional levels (1% and 5%), which leads to rejection of the null hypothesis of no cointegration among the variables. The significant statistics include Panel rho, Panel PP, and Panel ADF under the alternative hypothesis assuming homogeneous autoregressive coefficients, as well as Group PP and Group ADF under the alternative hypothesis allowing heterogeneity across cross-sectional units. It can therefore be said that there is a long-run equilibrium relationship between carbon dioxide emissions (LNCO2) and each of energy consumption (LNEC), GDP (LNGDP), and the renewable energy share (LNREN) in EU countries during the study period (2000–2025). This result is a basic condition for applying the ARDL/NARDL methodology, which allows analyzing the dynamics of the relationship between the variables in the short and long run, taking into account the possibility of asymmetric effects of the green transition on environmental sustainability.
Estimation of the PMG-NARDL Model (Nonlinear/Asymmetric Model)
This model aims to estimate the relationship among the variables in the long and short run while allowing for an asymmetric effect of the green transition.
Table 6.
PMG-NARDL results (nonlinear/asymmetric model).
| A. Long-run coefficients | |||
| Variable | Coefficient | Probability | Significance |
| LNEC (energy consumption) | 0.077 | 0.003 | Significant |
| LNGDP (GDP) | 0.223 | 0.000 | Significant |
| LNREN_NEG (negative shocks) | 2.030 | 0.000 | Significant |
| LNREN_POS (positive shocks) | 1.287 | 0.000 | Significant |
|
B. Short-run coefficients |
|||
| Variable | Coefficient | Probability | Significance |
| COINTEQ (ECM) | -0.097 | 0.041 | Significant |
After estimating the nonlinear autoregressive distributed lag model (PMG-NARDL), the researchers moved to the essential step in this methodology, which is testing the hypothesis that the green transition has an asymmetric effect on carbon emissions in EU countries. This test compares the positive-effect coefficient (LNREN_POS) with the negative-effect coefficient (LNREN_NEG) in the long-run equation, by applying the Wald test, which tests the following null hypothesis:
H0: β+ = β−
That is, the effect is symmetric, and there is no significant difference between the effect of increases and decreases in the renewable energy share.
H1: β+ ≠ β−
That is, the effect is asymmetric, and the effect of increases differs from the effect of decreases.
5.6. Asymmetry Test (Wald Test)
Decision: Reject the hypothesis of equality; there is a significant asymmetric effect.
The Wald test results (Table 7) reject the null hypothesis decisively, as the F-statistic reached about 72.047 with a probability of 0.000, far below the 1% significance level. The difference between the two estimated coefficients was 0.743, a large and statistically significant difference. Based on these results, the alternative hypothesis of a significant asymmetric effect of the green transition on carbon emissions in EU countries during the study period (2000–2025) is accepted.
Comparing the two coefficient values reveals that the effect of negative shocks (slowdown in renewable energy share growth) is much greater than the effect of positive shocks (acceleration of renewable energy share growth): the coefficient of negative shocks was 2.030 against 1.287 for positive shocks. This means that a slowdown in the pace of the green transition is more harmful to the environment than an acceleration is beneficial. In other words, environmental policies that lead to a decline in renewable-energy investment or a slowdown in its growth have grave consequences for environmental quality, whereas the acceleration of these investments, although it may be associated with a temporary increase in emissions because of the rebound effect resulting from infrastructure construction, has far less severe negative effects.
This result confirms the basic hypothesis of the research, that the economic effect of the green transition on environmental sustainability is asymmetric. It also provides strong econometric evidence that maintaining the momentum of the green transition and avoiding any slowdown is more important than merely trying to increase its speed, because the harm of slowdown far exceeds the benefit of acceleration. This requires EU policymakers to design effective mechanisms to ensure the continuity of green investments and to avoid any retreat in government support for renewable energy, while working at the same time to reduce the rebound effect by improving energy efficiency and developing clean-building technologies.
5.7. Stability Tests (to Verify the Stability of Model Coefficients Over Time)
Figure 2.
CUSUM of Squares and CUSUM tests for the stability of model coefficients.
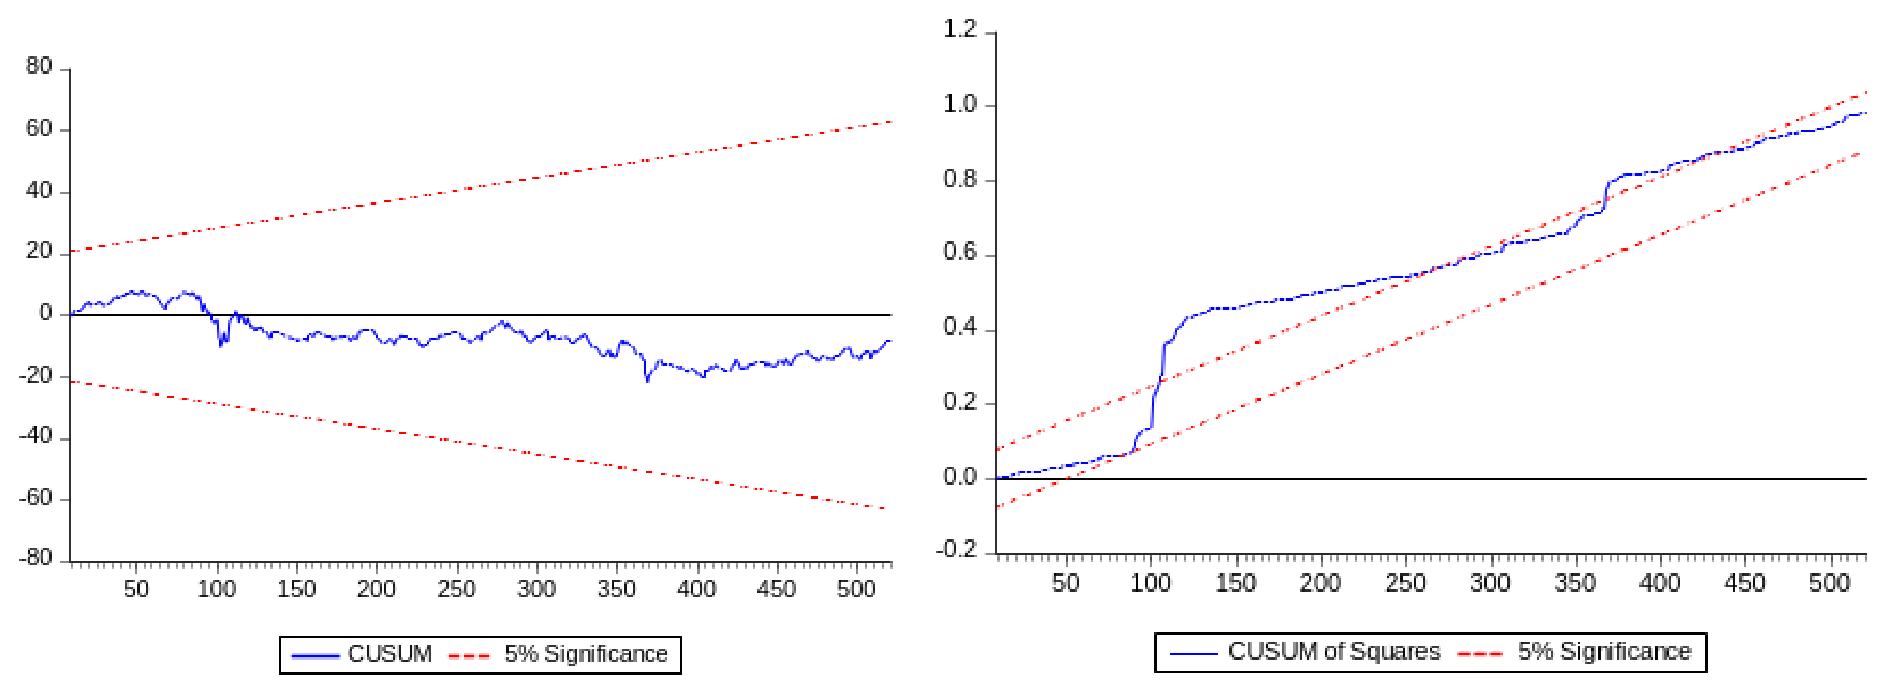
The CUSUM of Squares test was conducted to verify the stability of the estimated model’s long-run coefficients by tracking the cumulative changes in the squares of the residuals over time. The test relies on the null hypothesis that the estimated coefficients are stable during the study period, and it is rejected when the cumulative curve moves outside the confidence band at the 5% significance level.
The CUSUM of Squares results in the figure above show that the cumulative line of squared residuals lies entirely within the critical bounds (the two dashed lines) for the entire period (2000–2025). This indicates that the cumulative variance of the residuals moves within the permitted range, confirming the stability of the model’s coefficients and the absence of radical structural changes in the long-run equilibrium relationship among the study variables.
The CUSUM (Cumulative Sum of Recursive Residuals) test was conducted to verify the stability of the model’s estimated coefficients over time. The test relies on the null hypothesis that the coefficients are stable during the study period, and it is rejected when the cumulative curve moves outside the confidence band at the 5% significance level.
The CUSUM results in the figure above show that the cumulative line of recursive residuals lies entirely within the critical bounds (the two dashed lines) for the entire period (2000–2025). This confirms the stability of the estimated coefficients and the absence of radical structural changes in the long-run equilibrium relationship among the study variables.
This result strengthens confidence in the estimated results and confirms that the relationship among carbon emissions, energy consumption, GDP, and the renewable energy share did not undergo a fundamental structural change during the analysis period, despite the economic and environmental challenges the European Union experienced during this period (such as the 2010 sovereign debt crisis, the COVID-19 pandemic, and the 2022 energy crisis). The estimated model can therefore be said to enjoy a high degree of robustness and stability, which reinforces the validity of the conclusions drawn from it.
5.8. Diagnostic Tests
Table 8.
Diagnostic tests.
| Test | Result |
| Autocorrelation | None (Durbin-Watson ≈ 2.00) |
| Heteroskedasticity | Addressed using EGLS |
| Normality of residuals | Not critical (N = 500) |
6. Discussion
The most fundamental finding of this research is that the green transition has a significant asymmetric effect on carbon emissions in EU countries. The PMG-NARDL results showed that negative shocks (slowdown in renewable energy share growth) have a much greater effect on increasing emissions (β = 2.030, p = 0.000) than positive shocks (acceleration of renewable energy share growth), whose effect was less severe (β = 1.287, p = 0.000). The Wald test confirmed the significant difference between the two coefficients, F = 72.047, p = 0.000, which proves an asymmetric relationship between renewable energy growth and carbon emissions.
This result aligns with Rapposelli & Javed (2025), who applied the PMG-NARDL model to 24 European countries and confirmed asymmetric effects of information and communication technology, technological innovation, and renewable energy on carbon dioxide emissions. It also agrees with the study by Munir (2023), which demonstrated an asymmetric effect of using different energy sources (coal, electricity, and oil) on carbon emissions in EU countries, finding that increases in the use of these sources raise emissions while decreases lower them, with asymmetry in the size of these effects.
This result is also consistent with a recent study published in Humanities and Social Sciences Communications (2026) on 24 European countries, which showed that negative shocks in environmental policies (such as cuts in environmental spending or reductions in environmental taxes) lead to disproportionate increases in emissions, confirming the risks of backtracking on environmental policies. This result also supports the findings of Gharbi et al. (2025) on the asymmetric effect of green innovation on green growth in EU countries.
The results proved a significant asymmetric effect of the green transition on carbon emissions in EU countries.
Table 9.
Summary of asymmetric effects.
| Shock | Coefficient | Effect |
| Slowdown in renewable energy growth (negative shocks) | 2.030 | Large increase in emissions |
| Acceleration in renewable energy growth (positive shocks) | 1.287 | Smaller increase in emissions |
6.1. The Economic Implications of the Results
Table 10.
Economic interpretation of the results.
| Result | Interpretation |
| Slowdown of the green transition increases emissions significantly | When the pace of investment in renewable energy slows, reliance on fossil fuels continues to meet rising energy demand, leading to a large increase in emissions. This confirms the importance of continuity of environmental policies and of not halting or slowing them. |
| Acceleration of the green transition also increases emissions, but to a lesser degree | This reflects the “rebound effect,” since building renewable-energy infrastructure (wind farms, solar panels, transmission networks) requires carbon-intensive materials in the construction phase. Note, however, that this effect is less severe than the effect of slowdown. |
| GDP increases emissions | A 1% increase in GDP leads to a 0.223% increase in emissions, confirming the continued positive relationship between economic growth and emissions in the long run. |
| Energy consumption increases emissions to a limited degree | A 1% increase in energy consumption leads to a 0.077% increase in emissions, a limited effect compared with GDP, which may reflect improved energy efficiency in EU countries. |
6.2. Comparing the Results with Previous Literature
Table 11.
Comparison with previous studies.
| Study | Main finding | Agreement with our results |
| Gharbi et al. (2025) | Asymmetric effect of green innovation on green growth | Consistent (asymmetric effect exists) |
| Su & Gao (2022) | Positive shocks have a greater effect than negative ones | Inconsistent (negative shocks are larger in our results) |
| Javed et al. (2023) | Green innovation reduces emissions symmetrically | Inconsistent (we found an asymmetric effect) |
| Alola & Adebayo (2023) | Symmetric relationship between green innovation and emissions | Inconsistent |
Based on the econometric results reached, the following conclusions can be drawn:
- There is a significant asymmetric effect of the green transition on carbon emissions in EU countries (Wald test: F = 72.047, p = 0.000).
- The slowdown in renewable energy share growth has a greater effect on increasing emissions (β = 2.030) than its acceleration (β = 1.287).
- The difference between the effect of negative and positive shocks (0.743) is statistically significant, confirming an asymmetric relationship.
- Economic growth (LNGDP) remains the main driver of increased emissions in the long run (0.223, p = 0.000).
- Energy consumption (LNEC) has a positive and limited effect on emissions (0.077, p = 0.003), which reflects improved energy efficiency.
- The error correction coefficient (ECM = −0.097, p = 0.041) is significant and negative, confirming a long-run cointegrating relationship.
- The model is stable according to the CUSUM and CUSUM of Squares tests.
7. Recommendations
- Maintain the momentum of the green transition and avoid a slowdown: a slowdown in renewable energy growth has a greater effect on increasing emissions (2.030) than its acceleration (1.287).
- Continue policies supporting renewable energy: any retreat in government support may slow the transition and sharply increase emissions.
- Accelerate the replacement of fossil fuels with renewable energy: an increase in the renewable energy share must be accompanied by an absolute reduction in fossil-fuel consumption.
- Invest in energy efficiency: improving energy efficiency reduces the effect of economic growth on emissions.
- Monitor the rebound effect: how to offset the emissions resulting from building green infrastructure should be studied.
- Strengthen regional cooperation and the exchange of best practices among EU countries to accelerate the green transition.
- Flexible policies to face shocks: establish rapid-response mechanisms in case of a slowdown in renewable energy growth.
8. Conclusion
This study concluded that the green transition in the European Union did not have a symmetric effect on environmental sustainability; rather, it was marked by a significant asymmetry that calls for reconsidering the assumption of homogeneity among member states and the way environmental policies are designed and evaluated. The study started from a central problem: the transition to a green economy, although a climatic and developmental necessity, may not achieve the same results in all contexts, and the response of carbon emissions to the acceleration of the transition may differ from their response to its slowdown. To test this problem, an integrated theoretical framework was built that combines environmental economics, ecological economics, the green growth hypothesis, the Porter hypothesis, ecological modernization theory, the circular economy, eco-innovation theory, and sustainability transition theory, allowing a multi-level explanation of the relationship between green policies and sustainable development.
Methodologically, the study used the nonlinear autoregressive distributed lag model (PMG-NARDL) on panel data for 27 EU member states over 2000–2025, a suitable methodological choice for capturing asymmetric effects in the long and short run. The results proved a significant asymmetric effect of the green transition on carbon emissions, as the coefficient of negative shocks (slowdown in renewable energy share growth) was about 2.030 against 1.287 for positive shocks (acceleration of growth), a significant difference confirmed by the Wald test (F = 72.047, p = 0.000). This means that the harm of slowing the green transition far exceeds the benefit of accelerating it, and that continuity of green momentum is more important than merely increasing its speed.
The results also showed that GDP remains the main driver of increased emissions in the long run (β = 0.223, p = 0.000), while the effect of energy consumption was positive and limited (β = 0.077, p = 0.003), reflecting a relative improvement in energy efficiency in the Union’s countries. The error correction coefficient was (ECM = −0.097, p = 0.041), confirming a long-run cointegrating relationship and that about 9.7% of the short-run disequilibrium is corrected in each period. The adjusted coefficient of determination was 0.8587, indicating high explanatory power of the model, and the CUSUM and CUSUM of Squares tests confirmed the stability of the coefficients over time.
At the descriptive-indicator level, environmental spending raised GDP by 0.42% for each 1% increase in green spending, environmental employment rose from 3.0 million jobs in 2000 to 6.7 million in 2022 (123%), and the renewable energy share in final consumption reached 27.5% in 2024, only 2.5 percentage points short of the 2030 target. Taken together, these indicators confirm that the European Union has made tangible progress on the green-transition path, but it still faces an implementation gap and asymmetry among member states.
Based on these results, the study recommends maintaining the momentum of the green transition and avoiding any slowdown in renewable energy growth, continuing government support policies, accelerating the replacement of fossil fuels, investing in energy efficiency, monitoring the rebound effect, strengthening regional cooperation, and establishing flexible mechanisms to confront shocks. It also recommends addressing institutional asymmetry among member states and introducing the variable of “non-compliance” as a core explanatory variable in future studies, instead of assuming that the Green Deal is applied at a homogeneous pace and effectiveness.
The study acknowledges clear limitations, including its restriction to 27 European countries, the period 2000–2025, four main variables, and the PMG-NARDL methodology alone, without in-depth qualitative or institutional analysis and without integrating the circular economy, green innovation, the just transition, and institutional asymmetry as independent variables. Hence the need for future research that widens the scope of variables, uses advanced causal models such as Granger causality and VAR, analyzes sub-levels of countries, links green policies to indicators of human development, happiness, and poverty, and integrates quantitative and qualitative methodologies.
Thus, it can be said that this study has made a theoretical and empirical contribution to understanding the relationship between the green transition and environmental sustainability in the European Union, and has shown that asymmetry is not merely a statistical detail but a structural characteristic of the European green-transition path, calling for policies that are more flexible, more targeted, and better able to sustain green momentum in the face of intersecting crises and pressures.
| 1 | Another intermediate pathway for the transition is the blue economy: moving to the green economy may be costly, since the use of green energy relies on advanced and expensive technology that some countries, especially developing ones, cannot afford, whereas countries with long coastlines may find the blue economy more suitable, because it focuses on creativity and innovation and requires low investment. |
References
- Aawsat. AUTHOR TO COMPLETE – source could not be verified. 2020. [Google Scholar]
- Acemoglu, D.; Akcigit, U.; Hanley, D.; Kerr, W. Transition to clean technology. Journal of Political Economy 2016, 124(1), 52–104. [Google Scholar] [CrossRef]
- Ağan, B. Sustainable development through green transition in EU countries: New evidence from panel quantile regression. Journal of Environmental Management 2024, 365, 121608. [Google Scholar] [CrossRef]
- Agarwal, M. V. Research paper on green economy. The International Journal of Analytical and Experimental Modal Analysis 2020, 12(4). [Google Scholar]
- Alola, A. A.; Adebayo, T. S. Are green resource productivity and environmental technologies the face of environmental sustainability in the Nordic region? Sustainable Development 2023, 31(2), 760–772. [Google Scholar] [CrossRef]
- Ambec, S. The European Union’s carbon border adjustment mechanism: Challenges and perspectives; (TSE Working Paper No. 1365); Toulouse School of Economics, 2022. [Google Scholar]
- Ambec, S.; Cohen, M. A.; Elgie, S.; Lanoie, P. The Porter hypothesis at 20: Can environmental regulation enhance innovation and competitiveness? Review of Environmental Economics and Policy 2013, 7(1), 2–22. [Google Scholar] [CrossRef]
- Anil, Shambhu; Sajith; Dhingra; Kumer; Bhat; Aswani. Techno-economic and environmental assessment to mitigate climate change and build energy security: A study on Willingdon Island. International Journal of Sustainable Energy 2022, 41(11), 1868–1887. [Google Scholar] [CrossRef]
- Asharq News. AUTHOR TO COMPLETE – source could not be verified. 2023. [Google Scholar] [CrossRef]
- Bäckstrand, K. Democracy and the implementation of the European Green Deal: Comparing Denmark and Sweden. Journal of European Integration 2025, 47(2). [Google Scholar] [CrossRef]
- Bhattacharya, M.; Churchill, S. A.; Paramati, S. R. The dynamic impact of renewable energy and institutions on economic output and CO2 emissions across regions. Renewable Energy 2017, 111, 157–167. [Google Scholar] [CrossRef]
- Chen; Lee. AUTHOR TO COMPLETE – source could not be verified. 2021. [Google Scholar]
- Chudy-Laskowska, K.; Pisula, T. An analysis of the use of energy from conventional fossil fuels and green renewable energy in the context of the European Union’s planned energy transformation. Energies 2022, 15(19), 7369. [Google Scholar] [CrossRef]
- climaMED. AUTHOR TO COMPLETE – source could not be verified. 2020. [Google Scholar]
- ClientEarth. Non-compliance with environmental laws harms society and nature. 2025. Available online: https://www.clientearth.org/latest/news/non-compliance-with-environmental-laws-harms-society-and-nature.
- Daly, H. E. Toward some operational principles of sustainable development. Ecological Economics 1990, 2(1), 1–6. [Google Scholar] [CrossRef]
- Daly, H. E.; Farley, J. Ecological economics: Principles and applications; Island Press, 2004. [Google Scholar]
- Efthymiou, L.; Tsiamis, N.; Tsagarakis, K. P. Non-compliance with EU environmental law: Rational choice or a necessity? The case of Greece. Waste Management Bulletin 2026, 100289. [Google Scholar]
- Ellen MacArthur Foundation. Towards the circular economy: Economic and business rationale for an accelerated transition; 2013; Vol. 1. [Google Scholar]
- Elmonshid, L. B. E.; Sayed, O. A. The relationship between entrepreneurship and sustainable development in Saudi Arabia: A comprehensive perspective. Economies 2024, 12(15), 2400. [Google Scholar] [CrossRef]
- European Commission. AUTHOR TO COMPLETE – source could not be verified. 2022. [Google Scholar] [CrossRef]
- European Commission. Environmental implementation for prosperity and security: 2025 Environmental Implementation Review (COM(2025) 420 final). European Commission, 2025.
- European Environment Agency (EEA). AUTHOR TO COMPLETE – source could not be verified. 2021. [Google Scholar]
- European Environment Agency. European climate risk assessment (EUCRA). 2024. [Google Scholar] [CrossRef]
- Finger, R.; Fabry, A.; Kammer, M.; Candel, J.; Dalhaus, T.; Meemken, E. M. Farmer protests in Europe 2023–2024. EuroChoices 2024, 23(3), 59–63. [Google Scholar] [CrossRef]
- Gali, N. K.; Niemand, T.; Shaw, E.; Hughes, M.; Kraus, S.; Brem, A. Social entrepreneurship orientation and company success: The mediating role of social performance. Technological Forecasting and Social Change 2020, 160, 120230. [Google Scholar] [CrossRef]
- Geels, F. W. Technological transitions as evolutionary reconfiguration processes: A multi-level perspective and a case study. Research Policy 2002, 31(8–9), 1257–1274. [Google Scholar] [CrossRef]
- Geels, F. W. The dynamics of transitions in socio-technical systems: A multi-level analysis of the transition pathway from horse-drawn carriages to automobiles (1860–1930). Technology Analysis & Strategic Management 2005, 17(4), 445–476. [Google Scholar] [CrossRef]
- Geissdoerfer, M.; Savaget, P.; Bocken, N. M. P.; Hultink, E. J. The circular economy – A new sustainability paradigm? Journal of Cleaner Production 2017, 143, 757–768. [Google Scholar] [CrossRef]
- Gharbi, S.; Zarrad, O.; Kalai, M.; Helali, K. Examining the symmetric and the asymmetric impacts of green innovation and digitalization on the European Union’s green economic growth. In Discover Sustainability; 2025. [Google Scholar]
- Grubb, M.; et al. AUTHOR TO COMPLETE – source could not be verified. 2020. [Google Scholar]
- Hereu-Morales, J.; Segarra, A.; Valderrama, C. The European (Green?) Deal: A systematic analysis of environmental sustainability. Sustainable Development 2023, 31, 647–661. [Google Scholar] [CrossRef]
- Humanities and Social Sciences Communications. AUTHOR TO COMPLETE – source could not be verified. 2026. [Google Scholar]
- Jänicke, M. Ecological modernization: New perspectives. Journal of Cleaner Production 2008, 16(5), 557–565. [Google Scholar] [CrossRef]
- Javed, A.; Fuinhas, J. A.; et al. Asymmetric nexus between green technology innovations, economic policy uncertainty, and environmental sustainability: Evidence from Italy. Energies 2023, 16(8), 3557. [Google Scholar] [CrossRef]
- Kappe, K.; Mikaelsson, M. A.; Krustok, I. The EU Green Deal in turbulent times: Insights from the EU Green Policy Tracker from Sweden and Estonia (SEI Discussion Brief); Stockholm Environment Institute, 2025. [Google Scholar] [CrossRef]
- Kemp, R.; Pearson, P. Measuring eco-innovation; UNU-MERIT Working Paper Series; 2008. [Google Scholar]
- Markandya, A.; et al. AUTHOR TO COMPLETE – source could not be verified. 2020. [Google Scholar]
- McCollum, D. L.; Wilson, C.; Bevione, M.; Carrara, S.; Edelenbosch, O. Y.; Emmerling, J.; Guivarch, C.; Karkatsoulis, P.; Keppo, I.; et al. Interaction of consumer preferences and climate policies in the global transition to low-carbon vehicles. Nature Energy 2018, 3(8), 664–673. [Google Scholar] [CrossRef]
- Mol, A. P. J.; Sonnenfeld, D. A. Ecological modernisation around the world: An introduction. Environmental Politics 2000, 9(1), 1–14. [Google Scholar] [CrossRef]
- Munir, K. Energy use and environmental degradation in Europe: Evidence from panel nonlinear ARDL. In Quality & Quantity; 2023. [Google Scholar]
- Nacu, T.; Jercan, E. Environmental economy and green transition in the European Union: Two complementary concepts. Revista Economica 2023. [Google Scholar] [CrossRef]
- Nature Communications. Sharing the effort of the European Green Deal among countries. Nature Communications 2025. [Google Scholar] [CrossRef]
- npj Climate Action. The European Green Deal and turbulence for non-member states. In npj Climate Action.; 2024. [Google Scholar]
- Oberthür, S. Accelerating the EU’s climate transformation: The European Green Deal’s Fit for 55 Package unpacked. Review of European, Comparative & International Environmental Law 2025. [Google Scholar] [CrossRef]
- Oberthür, S.; von Homeyer, I.; Schewe, L.; Moore, B. Public participation in EU climate governance: The underexploited potential of national energy and climate plans. Journal of European Integration 2025, 47(2). [Google Scholar] [CrossRef]
- OECD. Towards green growth; OECD Publishing, 2011. [Google Scholar]
- Pesaran, M. H.; Shin, Y.; Smith, R. J. Bounds testing approaches to the analysis of level relationships. Journal of Applied Econometrics 2001, 16(3), 289–326. [Google Scholar] [CrossRef]
- Pigou, A. C. The economics of welfare; Macmillan, 1920. [Google Scholar]
- Porter, M. E.; van der Linde, C. Toward a new conception of the environment-competitiveness relationship. Journal of Economic Perspectives 1995, 9(4), 97–118. [Google Scholar] [CrossRef]
- Rapposelli, A.; Javed, A. Unleashing the asymmetric impact of ICT, technological innovation, and the renewable energy transition on environmental sustainability: Evidence from Western and Eastern European nations. Environment, Development and Sustainability 2025, 27(11), 27353–27391. [Google Scholar] [CrossRef]
- Rennings, K. Redefining innovation—eco-innovation research and the contribution from ecological economics. Ecological Economics 2000, 32(2), 319–332. [Google Scholar] [CrossRef]
- Salim, A. A. H. Requirements for the transition to the green economy as an entry point to planning for sustainable development: An applied study on the Specific Union for Development, Environment and Safe Agriculture in Fayoum. In Journal of the Faculty of Social Work; Fayoum University, 2017. [Google Scholar]
- ScienceDirect. A globally just and inclusive transition? Questioning policy representations of the European Green Deal. 2024. [Google Scholar] [CrossRef]
- SEI. The EU Green Deal in turbulent times: Insights from the EU Green Policy Tracker from Sweden and Estonia. 2025. [Google Scholar] [CrossRef]
- Shin, Y.; Yu, B.; Greenwood-Nimmo, M. Modelling asymmetric cointegration and dynamic multipliers in a nonlinear ARDL framework. In Festschrift in Honor of Peter Schmidt; Springer, 2014; pp. 281–314. [Google Scholar]
- Smith, O. M.; Cohen, A. L.; Rieser, C. J.; Davis, A. G.; Taylor, J. M.; Adesanya, A. W.; Jones, M. S.; Meier, A. R.; Reganold, J. P.; Orpet, R. J.; et al. Organic farming provides reliable environmental benefits but increases variability in crop yields: A global meta-analysis. Frontiers in Sustainable Food Systems 2019, 3, 82. [Google Scholar] [CrossRef]
- Su, Y.-Y.; Gao, X. Revealing the effectiveness of green technological progress and financial innovation on green economic growth: The role of environmental regulation. In Environmental Science and Pollution Research; 2022. [Google Scholar]
- Tudor, V. C.; Marcuta, A.; Marcuta, L.; Tindeche, C.; Tiu, V.; Micu, M. M.; Smedescu, D. Sustainable development regimes, transition dynamics and environmental performance in the European Union. Sustainability 2026, 18(14), 7219. [Google Scholar] [CrossRef]
- UNEP. Towards a green economy: Pathways to sustainable development and poverty eradication. 2011.
- Vizzarri, M.; Pilli, R.; Korosuo, A.; et al. The role of forests in climate change mitigation: The EU context. In Climate-Smart Forestry in Mountain Regions; Springer, 2021; pp. 507–520. [Google Scholar]
- Volintiru, C.; Nicola, S. Limitations of coordinative Europeanisation in the Just Transition Mechanism in Romania. Competition & Change 2024, 28(3–4), 474–493. [Google Scholar] [CrossRef]
- Von der Leyen, U. Political guidelines for the next European Commission 2024–2029; European Commission, 2024. [Google Scholar]
- Vujanović, N.; Maucorps, A.; Römisch, R.; Schwab, T. 2023. The future of EU cohesion: Effects of the twin transition on disparities across European regions (wiiw Research Report No. 467). The Vienna Institute for International Economic Studies. [Google Scholar]
- Wikipedia. AUTHOR TO COMPLETE – source could not be verified. 2023. [Google Scholar] [CrossRef]
- Zeren, F.; Gürsoy, S. The nexus between wind energy consumption, economic growth and financial development: Evidence from panel causality and cointegration test with Fourier function. Technology and Economics of Smart Grids and Sustainable Energy 2022, 7(1), 31. [Google Scholar] [CrossRef]
Table 1.
Study variables and their sources.
| Variable | Symbol | Type | Measurement | Source |
| Carbon dioxide emissions | CO2 | Dependent | Metric tons per capita | World Bank – World Development Indicators (WDI) |
| Renewable energy share of total energy consumption | REN | Independent | Percentage of total energy consumption | World Bank – WDI |
| GDP per capita | GDP/CAPITA | Control | Constant US dollars (2015 base year) | World Bank – WDI |
| Primary energy consumption | EC | Control | Kilograms of oil equivalent per capita | World Bank – WDI |
Source: prepared by the researchers.
Table 3.
Panel unit root tests for the study variables.
| Test | Lnco2 | Lngdp-ca | Lnren | Lnec |
| Levin, Lin & Chu t | -8.015 D*** | -3.147 L*** | -3.823 D*** | -2.920 L** |
| Im, Pesaran and Shin | -11.225 D*** | -10.57 D*** | -10.331 D*** | -10.835 D*** |
Note: L = level; D = first difference; *** and ** denote significance at 1% and 5%.
Table 7.
Wald asymmetry test.
| Statistic | Value | Probability | Significance |
| F-statistic | 72.047 | 0.000 | Significant |
Disclaimer/Publisher’s Note: The statements, opinions and data contained in all publications are solely those of the individual author(s) and contributor(s) and not of MDPI and/or the editor(s). MDPI and/or the editor(s) disclaim responsibility for any injury to people or property resulting from any ideas, methods, instructions or products referred to in the content. |
© 2026 by the authors. Licensee MDPI, Basel, Switzerland. This article is an open access article distributed under the terms and conditions of the Creative Commons Attribution (CC BY) license (http://creativecommons.org/licenses/by/4.0/).
Copyright: This open access article is published under a Creative Commons CC BY 4.0 license, which permit the free download, distribution, and reuse, provided that the author and preprint are cited in any reuse.