

Submitted:
03 November 2026
Posted:
05 November 2026
You are already at the latest version
Abstract
This study investigated episode-dependent variations in aerosol physical, optical, and chemical properties and in reactive gases using integrated atmospheric composition observed at the Anmyeon-do Global Atmosphere Watch Station, Republic of Korea, in November 2025. Asian dust, haze, high-particulate matter (PM) episodes, and a wildfire-influenced period were examined, and air-mass pathways were assessed using HYbrid Single-Particle Lagrangian Integrated Trajectory backward trajectories. PM10 concentrations during all event periods were more than twice the non-event mean (24.8±9.9 µg/m3), reaching its peak during Asian dust (66.1±19.2 µg/m3). The scattering Ångström exponent was lowest during Asian dust (1.1±0.5), consistent with a greater contribution from coarse particles. By contrast, aerosol scattering and absorption coefficients increased during haze, high-PM, and wildfire-influenced periods. Ion composition indicated enhanced natural-source components (chloride, sodium, and non-sea-salt calcium) during Asian dust, whereas secondary aerosol components (ammonia, nitrate-, non-sea-salt sulfate) accounted for 93.4% and 75.1% of reported composition during haze and high-PM episodes, respectively. NOX concentrations were 1.5–1.7 times higher during haze and high-PM episodes, while carbon monoxide showed the largest increase during the wildfire-influenced period. Back trajectories linked Asian dust to northwestern China, Inner Mongolia, and the Gobi region, whereas haze and high-PM episodes were linked with air-mass transport from eastern China and relatively slow air-mass movement. These results demonstrate distinct aerosol and gas profile across pollution episodes.
Keywords:
aerosol
; Asian dust
; haze
; reactive gases
; backward trajectory
1. Introduction
Atmospheric aerosols and reactive gases are key components of atmospheric chemistry and climate variability. As aerosols have relatively short atmospheric lifetimes and high chemical reactivity, they interact strongly with gaseous precursors through atmospheric oxidation and secondary aerosol formation [1,2,3]. Pollution episodes can reveal distinct characteristics depending on their sources, transport pathways, and meteorological conditions [2,4]. During naturally occurring Asian dust events, the coarse-particle fraction can increase markedly, while strong winds may dilute some gaseous species [5,6]. In contrast, haze associated with atmospheric stagnation or long-range transport can promote the accumulation and chemical processing of fine particles [7,8]. Biomass burning, including wildfires, can elevate black carbon (BC) and carbon monoxide (CO) concentrations and alter aerosol optical properties [9,10,11].
November represents a transition from autumn to winter in East Asia. The development of the Siberian High can strengthen continental flow, facilitating the transport of Asian dust and haze, while increased heating demand and other combustion-related emissions may contribute to anthropogenic air pollution [12]. Consequently, atmospheric composition during this period can reflect the combined influences of natural sources, anthropogenic emissions, and long-range transport. Elucidating the differences among pollution episodes therefore requires observations of multiple atmospheric components rather than reliance on a single pollutant or measurement parameter.
Previous studies have investigated individual pollution episodes and their associated aerosol characteristics. However, comparing results across studies can be challenging when observations are made at different locations, during different periods, or using varying measurement approaches. Examining multiple episode types within a common observation period at the same monitoring station accurately compares their atmospheric characteristics. In particular, concurrent measurements of aerosol physical properties, optical parameters, ionic composition, and reactive gases help identify similarities and differences among pollution episodes and provide complementary evidence for interpreting their potential sources and atmospheric processing. Backward trajectory analysis can further support the interpretation of these observations by identifying potential air-mass transport pathways.
The Anmyeon-do Global Atmosphere Watch (GAW) Station, located on the west coast of the Korean Peninsula, is well-positioned to observe air masses transported from continental Asia and is relatively less affected by nearby local emission sources than urban monitoring sites. The station provides concurrent observations of aerosol physical, optical, and chemical properties, as well as major reactive gases [13,14,15]. In November 2025, observations at the station captured several distinct atmospheric conditions, including Asian dust, haze, high-particulate-matter (high-PM) episodes, and a short wildfire-influenced period. These different episode types within a single monthly observation period enable efficient comparison of atmospheric signatures under a common observational framework. Integrating aerosol measurements, ionic composition, reactive gases, and backward trajectory analysis presents a more comprehensive picture of the differences among these episodes.
Accordingly, this study aims to characterize episode-dependent variations in aerosol physical, optical, and chemical properties and reactive gases observed at the Anmyeon-do GAW Station in November 2025. Specifically, we compared the atmospheric characteristics of Asian dust, haze, high-PM, and wildfire-influenced episodes and examined their potential relationships with air-mass transport pathways using backward trajectory analysis. By integrating multiple observational parameters, we intended to improve comprehension of how atmospheric composition varies among different pollution conditions within a common observation period.
2. Materials and Methods
2.1. Observation Site
The Anmyeon-do GAW Station is located in Anmyeon-eup, Taean County, Chungcheongnam-do, Republic of Korea (36.32° N, 126.19° E; Figure 1). A coal-fired power plant is located approximately 35 km to the northeast, industrial complexes occur within a 100 km radius, and coastal tidal flats lie to the west. These surroundings should be considered when interpreting the observations [13,16,17].
2.2. Aerosol and Gas Measurements
Aerosol mass concentration was measured employing a beta-attenuation PM10 monitor (FH62C14, Thermo Fisher Scientific, Waltham, MA, USA). Particle-size characteristics were quantified using an aerodynamic particle sizer (aerodynamic particle sizer [APS]; model 3321, TSI Inc., Shoreview, MN, USA). APS measured aerosol number concentrations across 52 size channels over a particle-size range of 0.5–20.0 μm, with an approximate measurement uncertainty of ±10% [14,16]. Aerosol absorption was measured using an Aethalometer (AE33, Aerosol d.o.o., Ljubljana, Slovenia) at seven wavelengths spanning 370–950 nm, while aerosol scattering was measured using a nephelometer (model 3563, TSI Inc., Shoreview, MN, USA) at 450, 550, and 700 nm. Post-processing followed a previously published procedure [18,19]. Physical and optical observations were adjusted to standard conditions of 25 °C and 1 atm.
Aerosol chemical samples were collected in accordance with the WMO/GAW Report No. 227 using two low-volume air samplers and Teflon filters. Sampling was conducted for 24 h at a flow rate of 16.7 L/min. The filters were dedicated for ion and elemental analyses; only the results for nine ionic species (sodium [Na+], ammonia [NH4+], potassium [K+], magnesium [Mg2+], calcium [Ca2+], chloride [Cl-], nitrate [NO3-], sulfate [SO42-], fluoride [F-]) measured via ion chromatography were used in this study.
CO was measured using a cavity ring-down spectroscopy instrument (CRDS; G2401, Picarro Inc., Santa Clara, CA, USA). NOX (42i-TLE), SO2 (43i-TLE), and O3 (49i) were quantified using gas analyzers from Thermo Fisher Scientific. Zero/span and multipoint calibrations were conducted, and a mass flow controller was utilized to supply air at a constant flow rate.
2.3. Episode Classification
Hourly observations collected in November 2025 were examined and classified into five categories: non-event conditions, Asian dust, haze, high-PM episodes, and a wildfire-influenced period. High-PM episodes were identified by examining aerosol size distributions measured with APS. Periods during which both coarse-mode and fine-mode particle concentrations were elevated were classified as high-PM episodes. Therefore, this category was defined based on the observed particle-size distribution and concurrent enhancement of both particle-size fractions, rather than on PM10 mass concentration alone. The episode periods and numbers of hourly records are summarized in Table 1.
High-PM episodes were identified through an integrated assessment of aerosol particle-size distributions, PM₁₀ mass concentrations, and gaseous species concentrations. APS measurements were examined to assess variations in particle number-size distributions, with particular attention to particles with aerodynamic diameters of ≤2.5 and ≤10 µm. The observed distributions were evaluated alongside PM₁₀ mass concentrations and gaseous species concentrations to identify periods characterized by enhanced particulate matter and associated changes in atmospheric composition. Thus, the classification of high-PM episodes was based on the combined assessment of aerosol size distributions, PM₁₀ concentrations, and gaseous species, rather than on a single measurement parameter.
The wildfire-influenced period was identified by jointly examining air-mass transport pathways, CO concentrations, and aerosol optical properties. Backward trajectory analysis investigated the potential origin and transport pathway of the incoming air masses. The temporal variations in CO concentrations and aerosol optical parameters determined whether they exhibited concurrent changes consistent with potential wildfire influence. The episode was classified as wildfire-influenced based on the combined evidence from air-mass transport and observed variations in gaseous and aerosol optical properties. This classification indicates a potential wildfire influence rather than definitive attribution of the observed atmospheric changes to wildfire emissions alone.
3. Results and Discussion
3.1. Aerosol Mass Concentrations
Figure 2 presents the temporal variations in aerosol and gaseous species concentrations throughout November 2025, while Table 2 lists the mean PM₁₀ mass concentrations per episode. Under non-event conditions, the mean PM₁₀ mass concentration was 24.8±9.9 μg/m³, which was lower than both the annual PM₁₀ standard in South Korea (50 μg m⁻³) and mean PM₁₀ concentration observed at the Anmyeon-do GAW station in 2025 (25.8 μg/m³). During the Asian dust episodes, the mean PM₁₀ mass concentration reached 66.1±19.2 μg/m³, approximately 2.7 times the non-event level. The corresponding concentrations during haze and high-PM episodes were 52.9±7.6 and 64.4±19.8 μg/m³, respectively, representing 2.1- and 2.6-fold increases relative to non-event conditions. During the wildfire-influenced episode, the mean PM₁₀ mass concentration was 58.7±28.7 μg/m³, approximately 2.4 times the non-event level. This concentration was lower than that reported immediately after the Hongseong wildfire in 2023 (75.7±31.2 μg/m³) by Bu et al. [13], suggesting a weaker PM₁₀ enhancement during the wildfire-influenced episode examined in November 2025. Overall, all identified episodes exhibited mean PM₁₀ mass concentrations >2-fold higher than those observed under non-event conditions.
3.2. Aerosol Optical Properties
Episode-specific scattering and absorption coefficients at 550 nm and the derived optical parameters are presented in Table 3 and Figure 3. The mean scattering coefficient was 52.0±40.1 Mm−1 during non-event conditions and 62.7±34.2 Mm−1 during Asian dust. It increased to 270.8±100.2 Mm−1 during haze, 182.8±134.6 Mm−1 during high-PM episodes, and 256.4±212.1 Mm−1 during the wildfire-influenced period. The corresponding absorption coefficients were 4.8±3.6, 4.5±2.6, 13.0±3.8, 10.9±8.1, and 13.0±9.7 Mm−1, respectively. Thus, scattering and absorption were enhanced during haze, high-PM, and wildfire-influenced periods, whereas absorption during Asian dust was comparable to the non-event value.
The SAE was lowest during Asian dust (1.1±0.5), consistent with a larger contribution from coarse particles. SAE values were 1.3±0.1 during haze, 1.7±0.4 during high-PM episodes, and 1.7±0.1 during the wildfire-influenced period. SSA values ranged from 0.91 to 0.95, indicating that scattering contributed substantially to aerosol extinction across all categories. Aerosol classification based on SAE and AAE, following the method attributed to Schmeisser et al. [20], suggested that haze and high-PM episodes were mainly classified as BC and small-particle/low-absorption types. Asian dust included mixed dust/BC/brown carbon (BrC), BC, and large-particle/BC-minimum types, while the wildfire-influenced episode was predominantly classified as BC (Figure 4). A comparison of aerosol types associated with the Hongseong wildfire in 2023 and wildfire-influenced episode observed in November 2025 revealed variations in their aerosol optical characteristics. During the Hongseong wildfire, which persisted for a longer period, the aerosol classification indicated contributions from BrC, BC/BrC, and BC. These results may reflect the presence of multiple carbonaceous aerosol types and possible alterations in aerosol composition during transport and aging [11]. In contrast, the short duration of the wildfire-influenced episode examined in the current study was associated predominantly with the BC aerosol type [13]. This difference suggests that the duration of wildfire influence and associated atmospheric processing may have contributed to the contrasting aerosol-type distributions, although further chemical and optical analyses are warranted to elucidate the underlying mechanisms.
3.3. Aerosol Ionic Composition and Reactive Gases
Ionic concentrations were higher during haze and high-PM episodes than during Asian dust (Figure 5). Relative to non-event conditions, Asian dust was associated with elevated chloride (Cl−; 3.9-fold), sodium (Na+; 4.0-fold), and non-sea-salt calcium (nss-Ca2+; 2.8-fold), consistent with an enhanced contribution from natural mineral and marine-related sources. During haze, NO3−, non-sea-salt sulfate (nss-SO42−), and NH4+ increased by factors of 4.4, 3.4, and 5.0, respectively. The draft reported that secondary aerosol species (NH4+, NO3−, and nss-SO42−) represented 93.4% of composition during haze and 75.1% during high-PM episodes. These patterns aligned with a substantial contribution from secondary inorganic aerosol, including ammonium sulfate ((NH4)2SO4) and ammonium nitrate (NH4NO3).
During the wildfire-influenced period, the relative contribution of K+, a species often associated with biomass burning, was more than twice that under non-event conditions. However, the episode lasted merely 3 h, and its ionic composition indicated a limited wildfire influence.
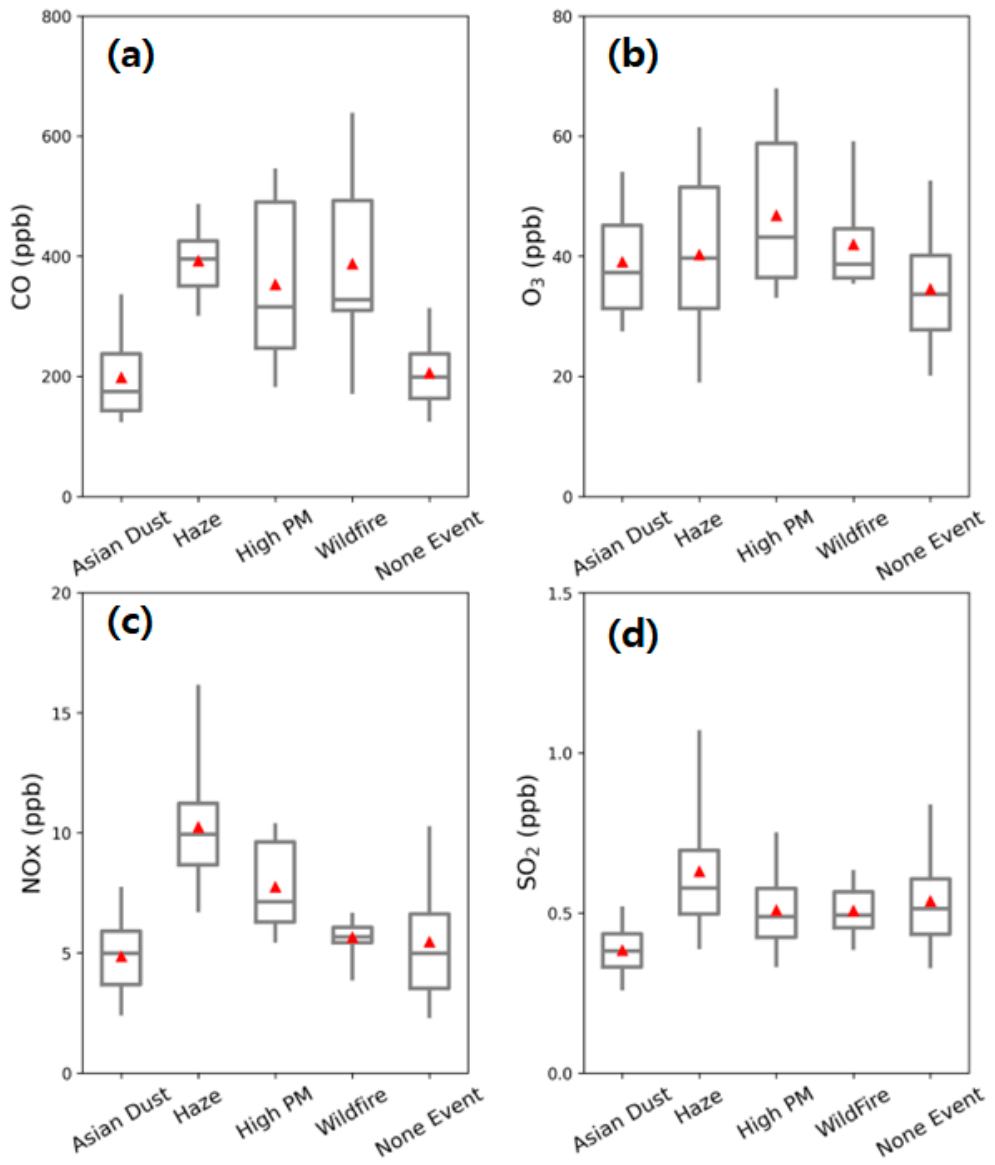
Figure 6.
Concentrations of gaseous components((a) Carbon monoxide (CO), (b) Ozone (O3), (c) Nitrogen Oxides (NOX), (d) Sulfur dioxide (SO2)) by episode category.
Figure 6.
Concentrations of gaseous components((a) Carbon monoxide (CO), (b) Ozone (O3), (c) Nitrogen Oxides (NOX), (d) Sulfur dioxide (SO2)) by episode category.
Among the four gaseous species examined (SO2, CO, O3, and NOX), SO2 and O3 showed no pronounced differences among episode categories. CO concentrations were 1.7–1.9 times higher during haze, high-PM, and wildfire-influenced periods than during non-event conditions, peaking during the wildfire-influenced period. While this pattern aligns with incomplete combustion, the short duration and trajectory evidence suggest caution before attributing the increase specifically to a wildfire. NOX concentrations were 1.7 times higher during haze and 1.5 times higher during high-PM episodes. The concurrent increase in NOX and nitrate is consistent with a possible link between reactive nitrogen chemistry and particulate nitrate formation.
3.4. Air-Mass Transport Pathways
Figure 7 and Figure 8 demonstrate the 72-h HYbrid Single-Particle Lagrangian Integrated Trajectory (HYSPLIT) backward trajectories arriving at 500 m above the Anmyeon-do station. Asian dust trajectories passed over northwestern China, Inner Mongolia, and the Gobi region before reaching the Korean Peninsula (Figure 7a). Trajectories during high-PM episodes indicated a mixture of long-range transport and air masses passing over industrial regions of eastern China (Figure 7c). During haze, air-mass movement was comparatively slow, and trajectories were associated mainly with eastern China (Figure 7b), and may have favored the accumulation and chemical processing of aerosol and gaseous precursors.
For the wildfire-influenced period, the number of hourly trajectories was limited. The source draft interpreted the trajectories and mapped fire information as indicating transport from a wildfire in China toward the Korean Peninsula (Figure 8). Considering the constrained trajectories and short observation period, this possible influence should be treated as an interpretation rather than a definitive source attribution [21].
4. Conclusions
Integrated observations from the Anmyeon-do GAW Station were used to characterize atmospheric composition during Asian dust, haze, high-PM, and wildfire-influenced episodes in November 2025. PM10 concentrations during all selected episodes were 2-fold higher than the non-event mean. Asian dust exhibited the highest mean PM10 concentration and lowest SAE, consistent with higher coarse particle contributions. Haze, high-PM, and wildfire-influenced periods revealed elevated aerosol scattering and absorption coefficients, indicating distinct optical behavior from non-event conditions and Asian dust.
Ion composition suggested enhanced natural-source components during Asian dust and a larger contribution from secondary inorganic aerosol during haze and high-PM episodes. NOX was elevated during haze and high-PM episodes, while CO reached its peak during the wildfire-influenced period. These co-occurring changes are consistent with differences in aerosol formation and combustion influence, although causal attribution requires additional evidence.
HYSPLIT backward trajectories linked Asian dust with air masses moving over northwestern China, Inner Mongolia, and the Gobi region. Haze and high-PM episodes were associated with transport from eastern China and relatively slow air-mass movement, which may have favored aerosol accumulation. The wildfire interpretation remains uncertain due to the short episode duration and limited trajectory coverage.
Further research is needed to better characterize the compositional changes associated with individual atmospheric pollution episodes. In particular, analyses of elemental composition and additional ionic species would provide complementary information on aerosol sources, chemical processing, and the relative contributions of different components during each episode. Integrating these measurements with aerosol physical and optical properties and gaseous species observations would help inform the processes governing aerosol composition and variability under different atmospheric conditions.
Author Contributions
Conceptualization, J.O.B.; Methodology, J.O.B., H.J.K. and E.S.K.; software, S.M.O; validation, J.O.B., H.J.K. and E.S.K.; formal analysis, J.O.B..; Investigation, J.O.B.; Writing—original draft preparation, J.O.B.; Writing—review and editing, J.O.B., H.J.K., and S.M.O. All authors have read and agreed to the published version of the manuscript.
Funding
This study was supported by the Korea Meteorological Administration Research and Development Program (KMA2018-00521).
Institutional Review Board Statement
Not applicable.
Informed Consent Statement
Not applicable.
Data Availability Statement
We encourage all authors of articles published in MDPI journals to share their research data. In this section, please provide details regarding where data supporting reported results can be found, including links to publicly archived datasets analyzed or generated during the study. Where no new data were created, or where data is unavailable due to privacy or ethical restrictions, a statement is still required. Suggested Data Availability Statements are available in section “MDPI Research Data Policies” at https://www.mdpi.com/ethics.
Acknowledgement
This work was funded by the Korea Meteorological Administration Research and Development Program “Development of Asian Dust and Haze Monitoring and Prediction Technology” under Grant (KMA2018-00521).
Conflicts of Interest
The authors declare no conflicts of interest.
Abbreviations
The following abbreviations are used in this manuscript:
| BC | Black Carbon |
| BrC PM SAE SSA |
Brown Carbon Particulate Matter Scattering Ångström Exponent Single Scattering Albedo |
| GAW | Global Atmospheric Watch |
| HYSPLIT | HYbrid Single-Particle Lagrangian Integrated Trajectory |
References
- Baek, J.D.; Bae, S.H.; Kim, J.H.; Shin, Y.S.; Kim, M.W.; Joo, H.S. Relationships Between PM2.5 and Its Precursor Gases in Agricultural Areas of South Korea Using a Loading-Rate-Based Analysis. Atmosphere 2026, 17, 898. [Google Scholar] [CrossRef]
- Jeong, J.Y.; Ko, H.J.; Seo, W.; Kim, J.E.; Boo, K.O. Size-segregated Aerosol Chemical Characteristics in According with Pathways of the Asian Dust Observed in 2014 and 2015 in Jeju, Korea. J. Kor. Soc. Atmos. Environ. 2023, 39, 202–216. [Google Scholar] [CrossRef]
- Lamarque, J.-F.; Bond, T.C.; Eyring, V.; Granier, C.; Heil, A.; Klimont, Z.; Lee, D.; Liousse, C.; Mieville, A.; Owen, B.; Schultz, M.G.; Shindell, D.; Smith, S.J.; Stehfest, E.; Van Aardenne, J.; Cooper, O.R.; Kainuma, M.; Mahowald, N.; McConnell, J.R.; Naik, V.; Riahi, K.; van Vuuren, D.P. Historical (1850-2000) gridded anthropogenic and biomass burning emission of reactive gases and aerosol: methodology and application. Atmos. Chem. Phys. 2010, 10, 7017–7039. [Google Scholar] [CrossRef]
- Aldabe, J.; Elustondo, D.; Santamaría, C.; Lasheras, E.; Pandolfi, M.; Alastuey, A.; Querol, X.; Santamaría, J.M. Chemical characterisation and source apportionment of PM2.5 and PM10 at rural, urban and traffic sites in Navarra (North of Spain). Atmos. Res. 2011, 102, 191–205. [Google Scholar] [CrossRef]
- Lee, Y.C.; Yang, X.; Wenig, M. Transport of dusts from East Asian and non-East Asian sources to Hong Kong during dust storm related events 1996-2007. Atmos. Environ. 2010, 44, 3728–3738. [Google Scholar] [CrossRef]
- Yu, T.; Xiaole, P.; Yujie, J.; Yuting, Z.; Weijie, Y.; Hang, L.; Shandong, L.; Zifa, W. East Asia dust storms in spring 2021: Transport mechanisms and impacts on China. Atmos. Res. 2023, 290, 106773. [Google Scholar] [CrossRef]
- Sun, Y.; Jiang, Q.; Wang, Z.; Fu, P.; Li, J.; Yang, T.; Yin, Y. Investigation of the sources and evolution processes of severe haze pollution in Beijing in January 2013. J. Geophys. Res. Atmos. 2014, 119, 4380–4398. [Google Scholar] [CrossRef]
- Ham, J.; Suh, I.; Lee, M.; Kim, H.; Kim, S. Elemental Carbon Observed at a Peri-Urban Forest Site near the Seoul Metropolitan Area as a Tracer of Seasonal Haze Occurrence. Atmosphere 2021, 12, 1627. [Google Scholar] [CrossRef]
- Kang, Y.; Jang, E.; Im, J.; Kwon, C. A deep learning model using geostationary satellite data for forest fire detection with reduced detection latency. Glsci. Remote Sens. 2022, 59, 2019–2035. [Google Scholar] [CrossRef]
- Souri, A.H.; Choi, Y.; Jeon, W.; Kochanski, A.K.; Diao, L.; Mandel, J.; Bhave, P.V.; Pan, S. Quantifying the impact of biomass burning emissions on major inorganic aerosols and their precursors in the US. J. Geophys. Res. Atmos. 2017, 122, 12–20. [Google Scholar] [CrossRef]
- Park, E.; Kim, M.-H.; Han, J.; Yoo, H.-J.; Yang, S.-H.; Kim, S.; Kim, Y.A.; Won, D.; Kim, S.-W. Light-absorption properties of fresh biomass burning aerosols observed at the Anmyeondo Global Atmosphere Watch (GAW) Regional Station: A case study in April 2023. J. Korean Soc. Atmos. Environ. 2024, 40, 614–627. [Google Scholar] [CrossRef]
- Ma, S.; Zhang, X.; Gao, C.; Tong, Q.; Xiu, A.; Zhao, H.; Zhang, S. Simulating Performance of CHIMERE on a Late Autumnal Dust Storm over Northern China. Sustainability 2019, 11, 1074. [Google Scholar] [CrossRef]
- Bu, J.O.; Ko, H.J.; Yoo, H.J.; Oh, S.M. Multi-Aspect Analysis of Wildfire Aerosols from the 2023 Hongseong Case: Physical, Optical, Chemical, and Source Characteristics. Atmosphere 2025, 16, 1074. [Google Scholar] [CrossRef]
- Jeong, M.J.; Yoo, H.J.; Ko, H.J.; Oh, S.M.; Hwang, S.O. Comparison of Physical, Optical, and Chemical Properties of Aerosols from Asian Dust and Haze Episodes Observed at Anmyeon-do in 2018-2021. J. Korean Soc. Atmos. Environ. 2024, 40, 171–179. [Google Scholar] [CrossRef]
- National Institute of Meteorological Sciences (NIMS). Report of Global Atmosphere Watch 2025. 2026. Available online: http://www.nims.go.kr/?sub_num=1076.
- Park, E.; Han, J.; Yoo, H.J.; Yang, S.H.; Kim, S.; Kim, Y.A.; W, D.; Kim, M.H.; Kim, S.W. Seasonal Characteristics in Aerosol Number Size Distribution and New Particle Formation (NPF) Observed at Anmyeondo Global Atmosphere Watch (GAW) Station from 2005 to 2024. J. Korean Soc. Atmos. Environ. 2025, 41, 502–514. [Google Scholar] [CrossRef]
- Lee, E.; Yu, N.; Choi, S.; Han, J.; Oh, S.M.; Yoo, H.J.; Kim, S.; Seo, J.; Lim, S. Spatial Correlation Analysis of Carbonaceous Aerosol and Air Pollutants Observed in Anmyeondo Global Atmosphere Watch (GAW) Regional Station. J. Korean Soc. Atmos. Environ. 2025, 41, 372–389. [Google Scholar] [CrossRef]
- Anderson, T.L.; Ogren, J.A. Determining aerosol radiative properties using the TSI 3563 integrating Nephelometer. Aerosol Sci. Technol. 1998, 29, 57–69. [Google Scholar] [CrossRef]
- Hansen, A.; Rosen, H.; Novakov, T. The Aethalometer – an instrument for the real-time measurement of optical absorption by aerosol particles. Sci. Total Environ. 1984, 36, 191–196. [Google Scholar] [CrossRef]
- Schmeisser, L.; Andrews, E.; Ogren, J.A.; Sheridan, P.; Jefferson, A.; Sharma, S.; Kim, J.E.; Sherman, J.P.; Sorribas, M.; Kalapov, I. Classifying aerosol type using in situ surface spectral aerosol optical properties. Atmos. Chem. Phys. 2017, 17, 12097–12120. [Google Scholar] [CrossRef]
- NASA. Fire Information for Resource Management System (FIRMS). Available online: https://firms.modaps.eosdis.nasa.gov/map/.
Figure 1.
Location of the Anmyeon-do Global Atmosphere Watch Station.
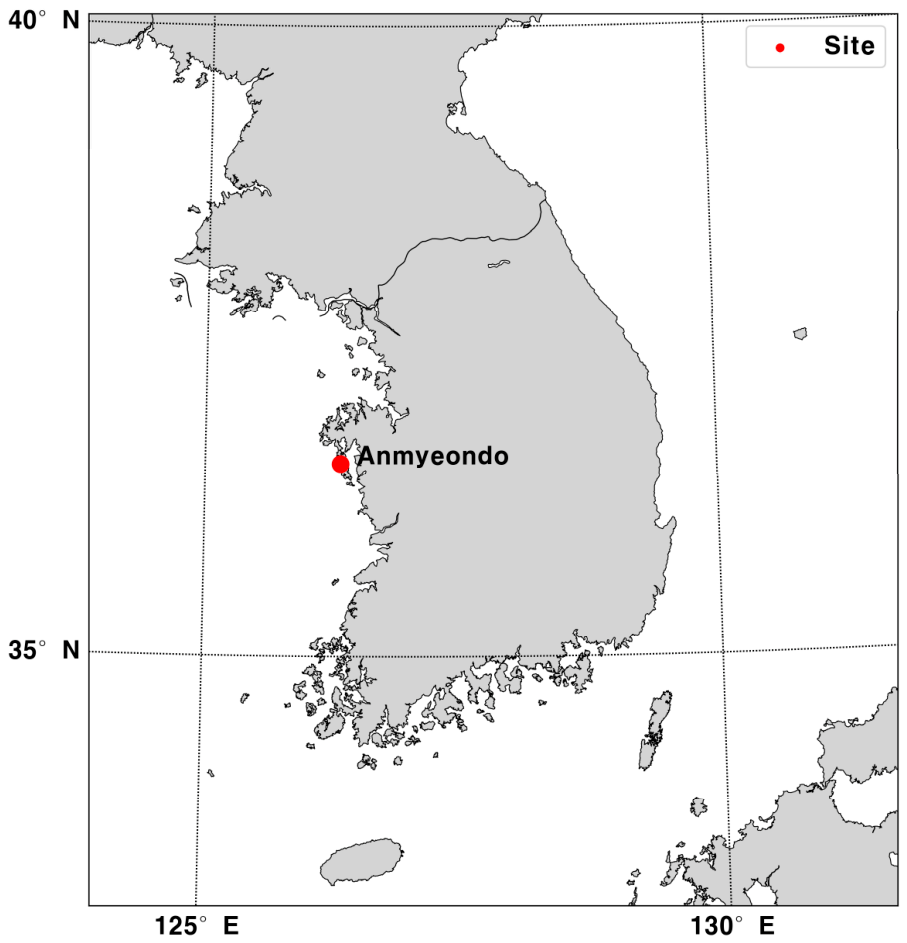
Figure 2.
Hourly variations in aerosol volume size distribution (dV/dlogD), PM10 mass concentration, aerosol scattering coefficient, aerosol absorption coefficient at 550 nm, and reactive gases (CO, SO2, NOX, O3) from November, 2025.
Figure 2.
Hourly variations in aerosol volume size distribution (dV/dlogD), PM10 mass concentration, aerosol scattering coefficient, aerosol absorption coefficient at 550 nm, and reactive gases (CO, SO2, NOX, O3) from November, 2025.
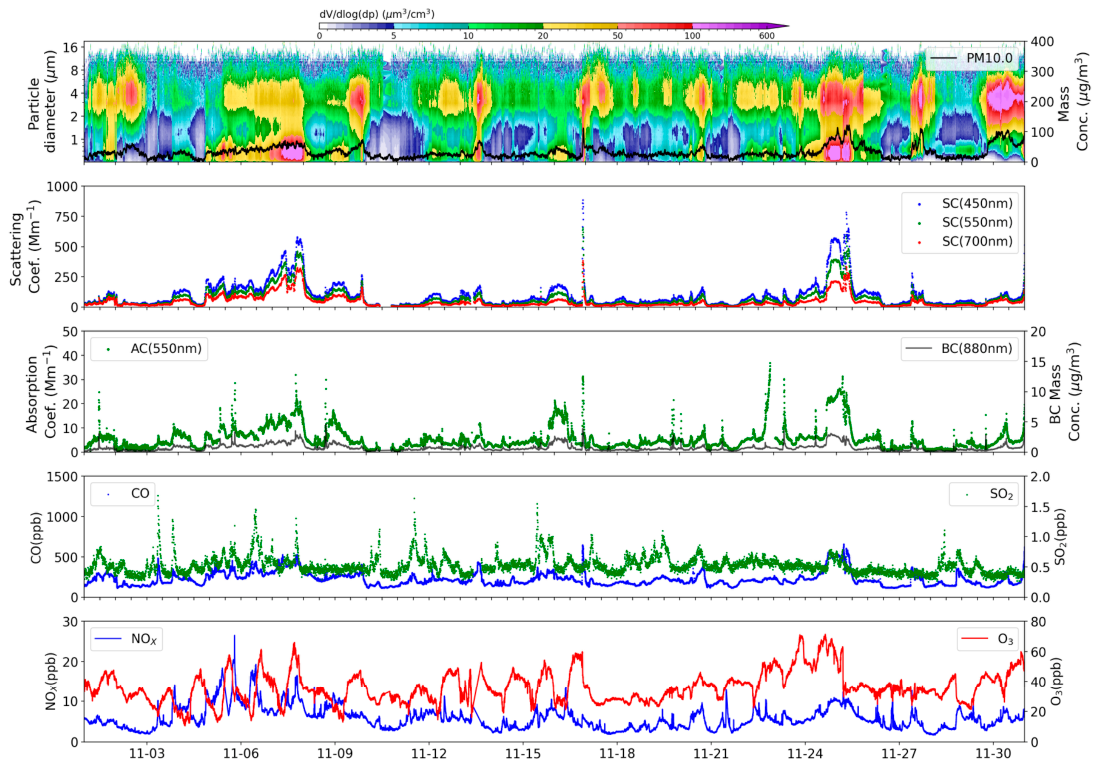
Figure 3.
Distributions of aerosol optical properties((a) Scattering coefficient, (b) Absorption coefficient, (c) Scattering Ångström Exponent, (d) Single Scattering Albedo) according to episode category.
Figure 3.
Distributions of aerosol optical properties((a) Scattering coefficient, (b) Absorption coefficient, (c) Scattering Ångström Exponent, (d) Single Scattering Albedo) according to episode category.
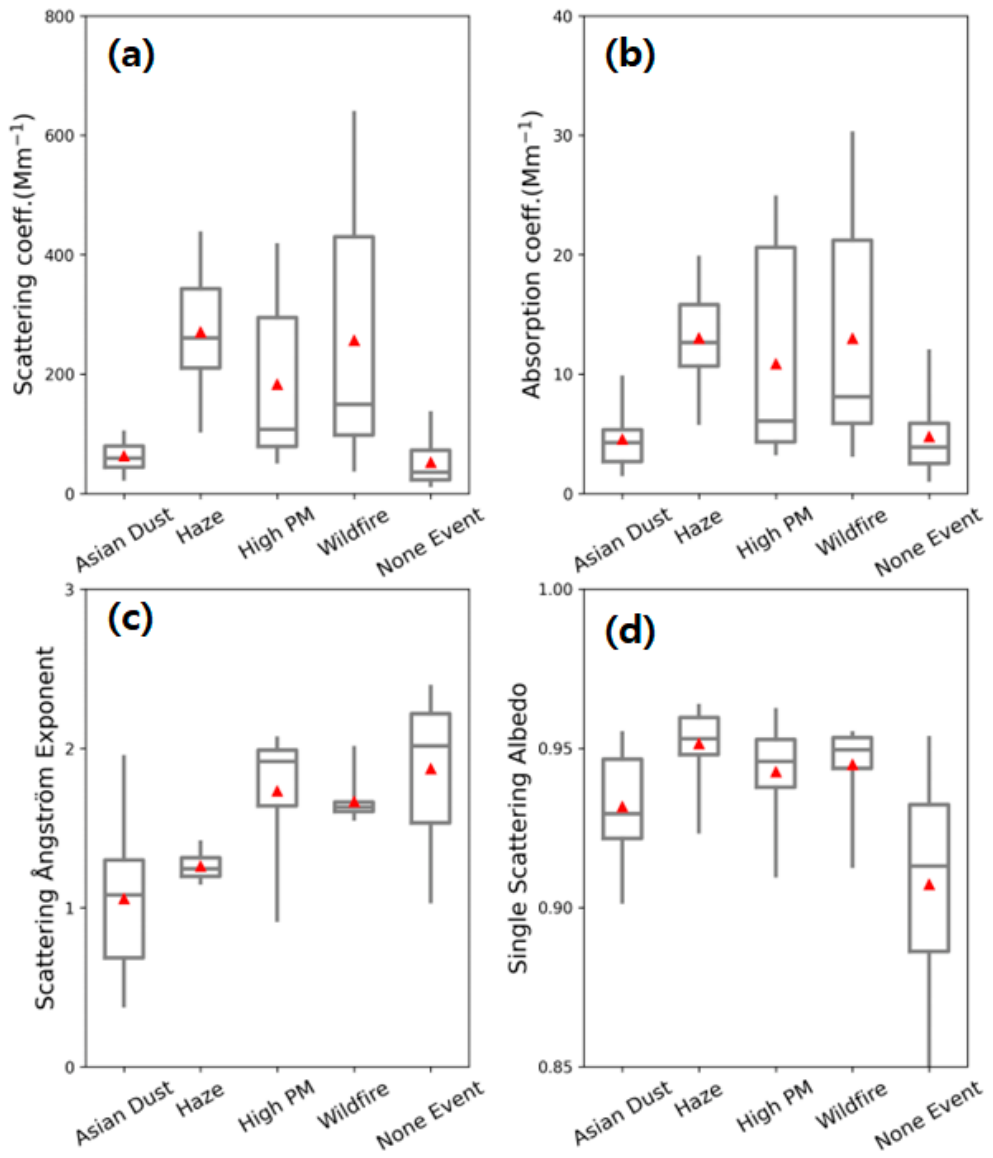
Figure 4.
Aerosol type classification by episode (Asian dust (blue), Haze (red), High-PM (yellow), Wildfire (green), 2023 Hongseong wildfire (gray)) based on the scattering Ångström exponent (SAE) and absorption Ångström exponent (AAE).
Figure 4.
Aerosol type classification by episode (Asian dust (blue), Haze (red), High-PM (yellow), Wildfire (green), 2023 Hongseong wildfire (gray)) based on the scattering Ångström exponent (SAE) and absorption Ångström exponent (AAE).
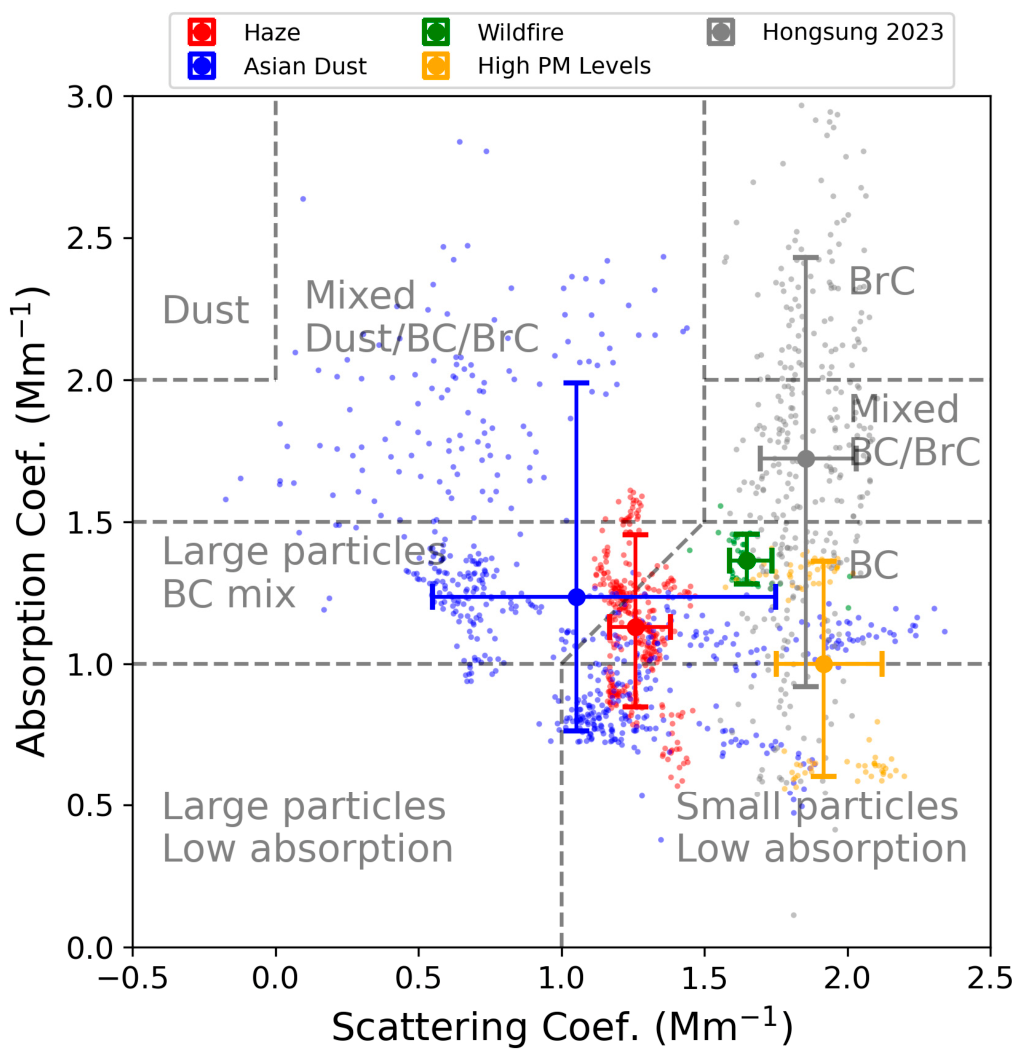
Figure 5.
Concentrations and relative composition of nine PM10 ionic species by episode category.
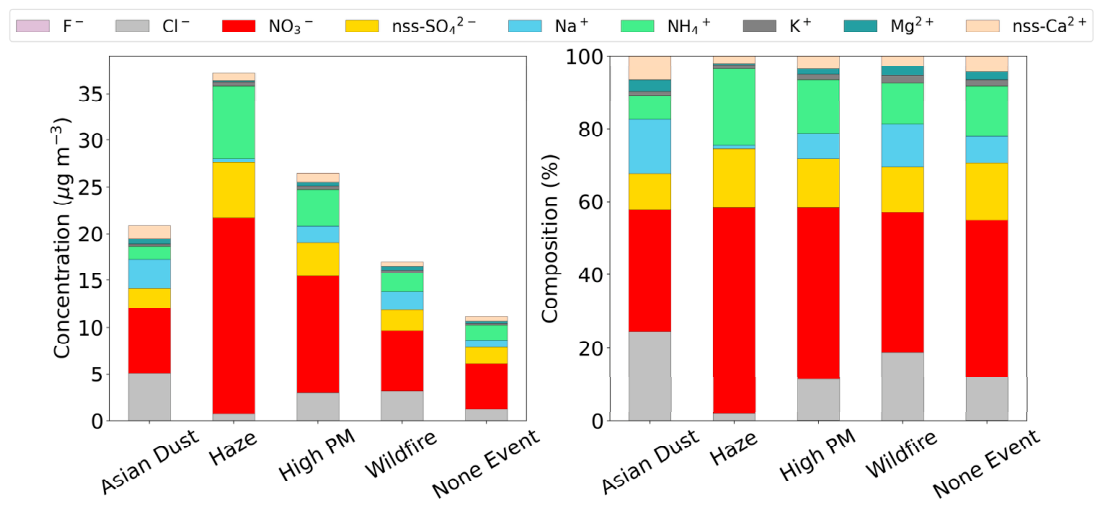
Figure 7.
Backward trajectories for (a) Asian dust, (b) haze, and (c) high-particulate matter episodes.
Figure 7.
Backward trajectories for (a) Asian dust, (b) haze, and (c) high-particulate matter episodes.
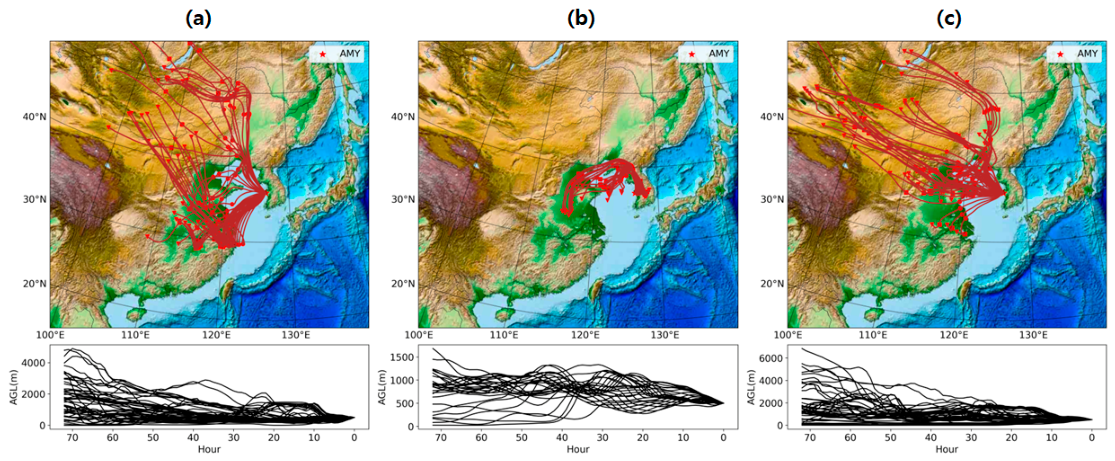
Figure 8.
Air-mass trajectories during the wildfire-influenced episode (left) and mapped wildfire information for November 16, 2025 (right).
Figure 8.
Air-mass trajectories during the wildfire-influenced episode (left) and mapped wildfire information for November 16, 2025 (right).
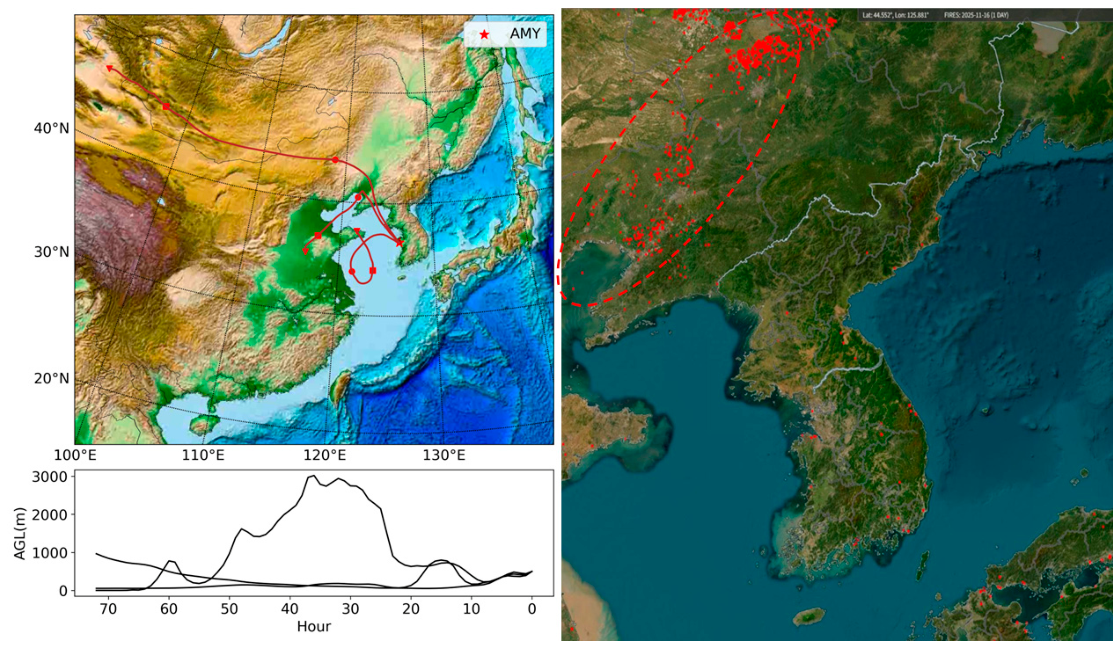

Table 1.
Summary of the physical and optical properties of aerosol for each period studied.
| Category | Observation periods (Local Time) | No. of records |
|---|---|---|
| Asian dust | Nov 2, 2025, 06:00–17:00 Nov 27, 2025, 09:00–19:00 Nov 29, 2025, 20:00– Nov 30, 2025, 23:00 |
51 |
| Haze | Nov 6, 2025, 11:00–14:00 Nov 7, 2025, 00:00–23:00 |
28 |
| High-PM | Nov 9, 2025, 12:00–22:00 Nov 13, 2025, 11:00–17:00 Nov 24, 2025, 12:00– Nov 25, 2025, 21:00 |
52 |
| Wildfire-influenced | Nov 16, 2025, 21:00–23:00 | 3 |
Table 2.
Mean PM10 concentrations by episode category.
| Category | PM10 (µg/m3), mean±SD | Ratio to non-event |
|---|---|---|
| Non-event | 24.8±9.9 | - |
| Asian dust | 66.1±19.2 | 2.7 |
| Haze | 52.9±7.6 | 2.1 |
| High-PM | 64.4±19.8 | 2.6 |
| Wildfire-influenced | 58.7±28.7 | 2.4 |
| 2025 Anmyeon-do station mean | 25.8±7.6 | - |
| Immediately after the 2023 Hongseong wildfire | 75.7±31.2 | - |
Table 3.
Mean aerosol optical properties according to episode category.
| Parameter | Non-event | Asian dust | Haze | High-PM | Wildfire |
|---|---|---|---|---|---|
| Scattering coefficient at 550 nm (Mm-1) | 52.0±40.1 | 62.7±34.2 | 270.8±100.2 | 182.8±134.6 | 256.4±212.1 |
| SAE (450-700 nm) | 1.9±0.4 | 1.1±0.5 | 1.3±0.1 | 1.7±0.4 | 1.7±0.1 |
| Absorption coefficient at 550 nm (Mm-1) | 4.8±3.6 | 4.5±2.6 | 13.0±3.8 | 10.9±8.1 | 13.0±9.7 |
| SSA (ω) | 0.91±0.03 | 0.93±0.02 | 0.95±0.01 | 0.94±0.02 | 0.94±0.02 |
Disclaimer/Publisher’s Note: The statements, opinions and data contained in all publications are solely those of the individual author(s) and contributor(s) and not of MDPI and/or the editor(s). MDPI and/or the editor(s) disclaim responsibility for any injury to people or property resulting from any ideas, methods, instructions or products referred to in the content. |
© 2026 by the authors. Licensee MDPI, Basel, Switzerland. This article is an open access article distributed under the terms and conditions of the Creative Commons Attribution (CC BY) license (http://creativecommons.org/licenses/by/4.0/).
Copyright: This open access article is published under a Creative Commons CC BY 4.0 license, which permit the free download, distribution, and reuse, provided that the author and preprint are cited in any reuse.