

Submitted:
03 November 2026
Posted:
05 November 2026
You are already at the latest version
Abstract
Under baseline assumptions, 12 of 18 affordable-housing developments in western Chester County, Pennsylvania, had no modeled two-hour evening/weekend pantry opportunity by walking or scheduled transit during November 2–29, 2026 (5–18 across tested assumptions), and none had more than one. All three Parkesburg developments remained without a date across the seven configurations tested. With two-hour outings and all-day availability, 17 developments had at least seven usable dates under either eligibility rule; only Parkesedge had none. This public-data study combined 26 housing address groups, pantry calendars, walking distances and exact scheduled bus departures, including a 30-minute pickup and return home. Outcomes distinguished usable dates from alternative-provider opportunities under assumed eligibility and an illustrative same-school-district rule. With three hours, the number of developments without an evening/weekend opportunity fell to four under assumed eligibility but remained 12 under district filtering. A separate directory-version comparison was driven by an ambiguous Salvation Army listing: interpreting its 2024 general hours as distribution hours added eight dates at 14 developments under district filtering in the two-hour all-day comparison. Removing that listing from both versions eliminated every 2024/current contrast in dates and alternatives. The results identify specific needs for service-area clarification, accurate distribution-hour descriptions and complete return-trip information. These are in-person pickup opportunities; a supplementary review identified delivery alternatives but could not establish household coverage. Results do not measure food acquisition or historical service cuts.
Keywords:
food pantry
; affordable housing
; time geography
; public transit
; service eligibility
1. Introduction
Collecting food from a pantry in person requires a usable service opportunity. A household must be able to leave home, reach a pantry during its distribution window, complete a pickup and return within available time. Eligibility can remove an otherwise feasible destination. Counting locations without those conditions can therefore miss constraints relevant to housing and food-assistance referrals. Volunteer work with Chester County Food Bank and Safe Harbor motivated this study; neither organization's client records or observations of individual clients were used.
Time-geographic accessibility research has long treated travel time, opening hours and individual availability jointly. Weber and Kwan (2002) examined the contribution of travel-time variation and facility hours; Delafontaine et al. (2011) and Neutens et al. (2012) examined service hours and accessibility. Farber, Morang and Widener (2014) applied temporal accessibility analysis to transit access to supermarkets. These precedents establish the conceptual basis for examining a pantry visit as a complete scheduled activity rather than a distance alone (Weber and Kwan 2002; Delafontaine et al. 2011; Neutens et al. 2012; Farber, Morang and Widener 2014).
Emergency-food studies already address several of these dimensions. Mikelbank (2021) examined spatial, temporal and transit access to emergency-food providers, including within-month variation. Clark, Perfit and Reznickova (2024) combined dimensions of pantry access in New York City. Bayly et al. (2025) included walking, waiting and bus travel within a round-trip threshold. These studies establish pantry calendars and return journeys as relevant dimensions of access (Mikelbank 2021; Clark, Perfit and Reznickova 2024; Bayly et al. 2025).
Evening and weekend availability is a useful scenario because published service hours may conflict with other commitments, with resident schedules represented here by explicit scenarios. Yan et al. (2026) reported that access in the urban counties they studied appeared more affected by limited pantry operating hours than by pantry location. Stone et al. (2025) surveyed 430 pantry clients and found associations between transport mode, client characteristics and pantry conditions, including bus connections and monthly-use policies. Their findings support examining transport and administrative conditions together; they do not establish the eligibility rules or household schedules in Chester County.
Published information also limits inference. Ginsburg et al. (2019) documented discrepancies between listed and observed pantry availability; Wessel and Farber (2019) examined differences between schedule-based and retrospectively reconstructed transit accessibility. These findings justify treating published itineraries as conditional opportunities, without importing another study's discrepancy rates into this county (Ginsburg et al. 2019; Wessel and Farber 2019).
Chester County already has food-security assessments, including a 2018 community report and subsequent participatory research. The contribution is an auditable local application connecting inventory-defined housing developments, explicit out-and-back journeys, monthly recurrences, eligibility assumptions and alternative-provider opportunities. It asks: (1) which housing developments and pantry destinations enter the study; (2) when published service is available; (3) how many usable dates remain after complete-trip and eligibility constraints; and (4) how published-information versions change those conclusions with transport held fixed (Chester County Food Bank 2018; Berger, Sartain and Klassen 2022).
2. Materials and Methods
2.1. Study Area and Sample
The housing frame comprised publicly listed affordable rental developments physically located in Parkesburg Borough, Coatesville City, South Coatesville Borough or Caln Township and represented in the reviewed July 2026 Chester County Department of Community Development or Pennsylvania Housing Finance Agency inventories. Public HUD records and operator descriptions supported reconciliation of aliases, financing groups and multi-address entries. Physical municipality determined inclusion. Differences in source unit counts and program groupings supported reporting developments without population weighting.
Eighteen developments were represented by 27 address groups. Twenty-six groups matched county address features and entered routing; provisional address H017-05 was held out. All developments retained at least one routable group. Address groups represent selected locations within each development. Downtown Revival's multiple routed groups and the four Willows records were summarized within their respective developments.
All 54 records in the October 19, 2026 Chester County Food Bank directory snapshot were screened by service description. Forty physical grocery-pickup candidates remained after excluding 14 records without such a service. Destination discovery was countywide. A generous geographic lower-bound screen tied to the 180-minute maximum outing budget retained 14 candidates for detailed routing, including five West Chester destinations. Every candidate has a recorded screening disposition. A listed temporary closure, incomplete times, appointment requirements and uncertain locations were distinguished from geographic exclusion. The sample is defined by the reviewed inventories and directory. Delivery-only programs, including SILO, were excluded from the physical-pickup frame and considered separately in the supplementary delivery review.
Public county address points, municipal boundaries, road centerlines and trails provided location and network inputs. Coordinates were analyzed in WGS84 / UTM zone 18N. County building/address coordinates serve as representative locations. Figure 1 and the audit in Supplementary Data 1 retain source identifiers, provisional locations, aliases and unit-count discrepancies.
Neighborhood vehicle availability was summarized from 2020–2024 ACS table B08201. The 26 routed housing coordinates were assigned to contemporaneous Census tract polygons, and the seven unique housing-containing tracts were aggregated. These tracts extend beyond some municipal boundaries. The percentage without a vehicle used E002/E001; published 90 percent count margins of error were combined by root-sum-squares, then converted to a percentage margin using the Census subset-proportion formula. The published county estimate supplied the comparison. These estimates describe surrounding households, including households outside the sampled developments; no tenant-level transport dependence was inferred (U.S. Census Bureau 2008, 2024).
The seven housing-containing tracts had an estimated 7.7 percent of households without a vehicle (90 percent margin of error: ±2.1 percentage points), compared with 4.3 percent countywide (±0.3 points). The tract aggregate represented 10,199 households, including 788 without a vehicle. Tract 3055 in downtown Coatesville, containing eight of the 26 routed address groups, had an estimated 19.5 percent without a vehicle (±7.9 points); the other six tracts ranged from 3.0 to 13.6 percent. The tract-level margins of error are wide. This neighborhood context supports examining walking and transit while leaving the sampled tenants' vehicle access unknown. Estimates and margins are supplied in the vehicle-context tables in Supplementary Data 1.
2.2. Pantry Calendars and Transit
Published weekday, ordinal-weekday and clock-time rules were explicitly transcribed into a service calendar. A 30-minute pickup had to fit within a bounded, nonappointment interval. Incomplete or booking-dependent services were retained as information gaps rather than given invented durations or confirmed appointments. Figure 2 isolates calendar fit before travel is considered.
The primary 28-day window was November 2–29, 2026. The completed calendar-placement analysis covers all 120 possible 28-day starts within the pinned transit-feed period, September 27, 2026–February 20, 2027. The same captured pantry rules are replayed throughout. In a dated amendment before the full-sample analysis, unconfirmed Thanksgiving, Christmas and New Year pantry recurrences were removed from the primary presentation, while original inclusion results were preserved. This conservative presentation retains holiday-operation uncertainty. Archived directory advice to call ahead around holidays supports caution about recurrence expansion.
SEPTA route 135 used GTFS release v202609271. LINK used the archived PDF timetable, transcribed as 34 trips and 323 timed cells, with published timepoints as baseline boarding/alighting locations. Published bus calendars and exceptions were applied. LINK Saturday call-ahead service remained outside the fixed timetable. At most one LINK/135 transfer per direction was permitted at Madison/Strode. The July 2024 and May 2026 LINK uploads had identical extracted timetable clock tokens but different fares. An ambiguous 08:52 timetable cell was retained rather than silently corrected using a conflicting vendor entry.
2.3. Complete-Trip Model
Walking distances were calculated on county road/trail geometry after excluding expressways, ramps and interstate segments; elevation attributes prevented inappropriate connections at grade-separated crossings. Private roads and point-to-network connectors were retained conditionally. Bounded online imagery checks examined selected near-threshold paths without adding favorable shortcuts. The network provides a pedestrian-distance proxy.
A custom Python search enumerated exact scheduled departures and feasible return connections, with network distances calculated using NetworkX. Table 1 summarizes the principal settings.
The itinerary search allowed walking-only, walking in one direction with transit in the other, and transit in both directions. Walking, waiting, transfers, pickup and the return had to fit entirely within both the outing budget and the selected availability window. Regency Park's co-located service was modeled with five minutes each way plus pickup. Its use was restricted to Regency residents as a conservative assumption; current program eligibility remains uncertain. The original on-site removal sensitivity is preserved.
The six additional configurations in Table 1 include combined slow/short-distance and estimated-stop/generous-walking scenarios; combined scenarios test joint assumptions.
Estimated LINK times were interpolated between two PDF timepoints along matched vendor trip geometry, without extrapolation. Accepted locations and bracketing anchors had to fall within 100 m of the route; ambiguous repeated passes over 250 m were rejected. Thirty-two intermediate locations contributed 388 estimates. Estimated boarding was required five minutes before the estimate in addition to the regular buffer; estimated alighting was delayed five minutes. The partial interpolation is reported separately from the official-timepoint baseline.
2.4. Eligibility and Development-Level Outcomes
Three complementary outcomes were computed from unique feasible date/provider pairs: usable dates, the union of feasible dates across providers; provider-dates, the number of distinct date/provider pairs; and backup dates, dates with at least two distinct feasible providers. Programs and routes are deduplicated to physical providers. Each alternative on a backup date must independently satisfy the complete-outing budget.
The headline unit is the development. Each development's minimum, median and maximum across sampled address groups are reported; origins are neither pooled into an artificial shared destination set nor weighted by population. A development has no modeled opportunity only when all sampled origins have zero dates. A mixed result would be reported separately. Whiskers are spatial ranges, not confidence intervals. Address-level itineraries and all seven configurations remain available for audit.
Interpreting modeled opportunities. Usable dates represent choices for scheduling a permitted visit; provider-dates and backup dates describe alternatives. They do not measure visit entitlements, capacity, food acquired or a chain of two pantry visits within one outing. Published hours, scheduled buses, walking connections and assumed eligibility define a conditional model. Monthly service limits can apply despite several feasible dates. Directory-version differences describe information sensitivity, not historical service cuts. The analyses are deterministic and exploratory; statistical inference about residents or causal benefits is outside their scope.
Two eligibility scenarios were reported side by side. Assumed eligibility retains the original conditional treatment of unknown rules, including the Regency-only on-site assumption. Same-district eligibility additionally permits a housing-provider pair only when both point locations fall in the same unified school district. The latter is motivated by the archived 2022/2024 Food Bank print-list header's statement that service typically follows county residency and school-district lines. It approximates service areas using provider location. The added sensitivity applies a blanket same-district filter to feasible provider pairs; a verified eligibility model would instead retain program-specific exceptions. The P37 Express residency exception is immaterial to these results because no West Chester journey qualified before filtering.
Locations were assigned using the official Census TIGERweb unified-school-district polygons with January 1, 2026 vintage, archived with metadata and hashes. All 67 inventory points had a single polygon match. The routing sample uses only the 26 accepted housing coordinates; the provisional point remains excluded from routing. Ebenezer's point was approximately 88 m from a district boundary and was flagged. The district scenario was added during review after the initial full-sample results.
2.5. Published-Directory-Version Comparison
Internet Archive captures of the Food Bank print lists dated September 27, 2022 and July 19, 2024 were compared with the current snapshot. Nine same-location, comparable general/client services formed the all-version pool; a separate paired ten-service 2024/2026 comparison added Brandy's Pantry. Relocation, missing historical listings, appointment-dependent programs and noncomparable bonus/Express services were excluded from schedule-only contrasts. West Chester Food Cupboard client service remained in the common pool for transparency but contributed no feasible journeys under the evaluated configurations.
All versions were replayed with the same contemporary housing, transport, pickup and walking assumptions, under both eligibility scenarios. This isolates published-information sensitivity. Primary displays use 120-minute all-day outings, show both historical contrasts, and report paired current-minus-earlier changes in usable and backup dates. Provider-date changes, other budgets, generous walking and calendar-placement results are supplied separately. Development ranges summarize paired address-level differences. To assess dependence on the ambiguous Coatesville Salvation Army entry, the two-hour all-day comparison was repeated after removing P04 from both versions. This diagnostic retains all other programs, eligibility rules and transport assumptions.
2.6. Quality Checks and Reproducibility
Archived source files retain URLs, capture/retrieval information and hashes. Calendar encodings, accepted and rejected location matches, timetable cells, network exchange files, representative itineraries and derived tables are supplied in the working package. The eligibility addition filters preserved feasible itineraries; it cannot create a new route. Checks require district-filtered outcomes to be subsets of assumed-eligibility outcomes, backup dates not to exceed usable dates, and original date/provider-date counts to be reproduced before development aggregation. Original analysis tables were retained. This is an iterative exploratory study with substantive amendments documented separately from the manuscript.
OpenAI ChatGPT and Codex assisted with data processing, coding, analysis checks, figures, and manuscript drafting and revision. The author reviewed the outputs and takes responsibility for the work.
2.7. Complementary Delivery Services
A supplementary public-source review on November 2, 2026 examined the 14 retained pantry providers and linked county, Food Bank and regional delivery programs. The audit distinguished household grocery delivery, prepared-meal delivery, on-site pickup and food transported to partner organizations. Published geography was compared with the 18 developments' municipalities, separately from individual eligibility, enrollment and capacity. Source captures, retrieval dates, hashes, provider classifications and a development crosswalk are included in Supplementary Data 1. Missing delivery information was coded as unknown. This review contextualized the completed analysis; it did not replace the frozen directory or convert meal deliveries into pantry-visit dates.
3. Results
3.1. Study Locations and Published Opportunities
The 18 developments comprise 13 in Coatesville City, three in Parkesburg Borough, one in South Coatesville Borough and one in Caln Township (Figure 1). Twenty-six county-matched address groups entered the travel model. Fourteen of 40 pantry candidates survived the geographic screen. None of the five retained West Chester providers produced a qualifying journey in any of the seven full-feed configurations.
In the holiday-removed primary calendar, the Co-op supplied one evening/weekend pickup date, November 21, and Lord's Pantry supplied three ordinary Thursday evening dates (Figure 2). Brandy's Pantry had calendar-compatible Friday/Saturday windows but no complete evening/weekend outing in the tested configurations. Its Friday 18:00 close and the lack of a modeled Saturday LINK call-ahead timetable illustrate why calendar fit and journey fit differ. Saturday call-ahead travel remains outside the fixed-departure model.
Across all eight current directory providers located in Coatesville Area School District, no Monday or Tuesday grocery-distribution recurrence was listed. Under the same-district approximation, this is a published-calendar gap before travel constraints are applied. It covers the eight listed locations, including two outside the detailed travel screen; unspecified emergency assistance and unlisted services are outside this claim.
3.2. Complete Trips, Eligibility and Alternative Providers
Under baseline assumptions, six developments had exactly one two-hour evening/weekend date and 12 had none under either eligibility scenario (Figure 3). Across walking and stop assumptions, the number with no date ranged from five to 18: five with generous walking or estimated LINK stops, and 18 with slow walking in both directions combined with the shorter walking-only limit. Across all seven configurations and both eligibility scenarios in the primary window, no development had more than one date, and all three Parkesburg developments remained at zero. The sensitivity summary in Supplementary Data 1 reports each configuration; this range describes scenario dependence rather than statistical uncertainty. Every positive baseline origin used the Co-op's third Saturday, on foot. The pattern is sensitive near the walking cutoff: Steel City's modeled Co-op path was 1,582 m, while Chestnut Court's was 1,619 m, straddling the 1,609 m rule.
With three hours and assumed eligibility, 14 developments had at least one evening/weekend date and four had none. All additional primary-window dates came from Lord's three ordinary Thursday evenings. Lord's lies in Downingtown Area School District, whereas the affected housing lies in Coatesville Area School District. Applying the illustrative district filter restored the two-hour pattern: six developments with one date and 12 with none. The apparent gain from a longer outing is therefore conditional on cross-district eligibility.
Under all-day availability and the two-hour budget, 17 of 18 developments had at least seven usable dates at every sampled address under either eligibility rule; only Parkesedge had none. Willows had 15 dates with assumed eligibility and seven with the district filter. Figure 3 also displays backup dates, which ranged from zero to seven across developments' sampled addresses under the baseline. Usable dates and alternatives are distinct: a development can have many dates while depending on only one feasible provider on several of them.
The shortest baseline evening Willows-Lord's outing on an ordinary Thursday took 126.16 minutes. A 30-minute pickup ended at 18:28:03, after an earlier 18:24:23 bus departure; the selected return departed at 19:20:45. Allowing for the walk to the stop and boarding buffer, the pickup would have to last at most 18.24 minutes to catch that earlier connection from the same outbound arrival. This diagnostic shows the return-connection margin. A 45-minute pickup eliminated Willows' two-hour all-day opportunities in the tested model.
Ebenezer appeared only under generous-walking configurations. Its modeled walk from the nearest route 135 stop was approximately 1,087 m, above the 805 m baseline transit-leg limit. Parkesedge's 1,779 m path to Octorara similarly exceeded the walking-only limit; generous walking changed its two-hour all-day result from zero to eight dates. Expanded walking or estimated-stop assumptions increased coverage, while every positive address still had only one two-hour evening/weekend date in the primary window. The detailed sensitivity and shortest-outing tables retain address-level differences.
Across all 120 overlapping windows, the number of developments with zero two-hour evening/weekend dates ranged from 12 to 18 under either eligibility scenario; two windows had no such opportunity at any development. With three hours, the zero count ranged from four to five under assumed eligibility and 12 to 18 under district filtering.
3.3. Published Wording Changes Dates and Redundancy Differently
The 2024/current two-hour all-day contrast is driven by the Coatesville Salvation Army listing (Figure 4). Its older Monday-Thursday 09:00–14:00 entry generates 15 nonholiday dates, whereas the current explicitly labeled Thursday 10:00–12:00 pantry entry generates three. Treating the older general hours as grocery-distribution hours supplies all eight Mondays and Tuesdays in the primary window: eight of 19 nonholiday weekdays. The older text may describe office or emergency availability, so that interpretation is the central uncertainty in this comparison.
Under district filtering, 14 developments each have eight fewer unique dates with current wording. In the 2022 contrast, Regency loses twelve dates: eight attributable to the Salvation Army listing and four to its 2022 Friday on-site listing. The other 13 developments lose eight dates each. Under assumed eligibility, cross-district alternatives preserve unique dates for 13 of these developments, leaving Regency as the only development with fewer unique dates. Nevertheless, all 14 have fewer backup dates under both eligibility scenarios. At address level, 22 groups have 12 fewer provider-dates in the 2024 comparison.
Table 2 summarizes the number of developments with fewer dates or alternatives under current wording.
Removing P04 from both versions eliminates every 2024/current difference in unique dates, provider-dates and backup dates under both eligibility scenarios at this budget. In the 2022 comparison, the remaining differences are confined to Regency and its on-site listing. Figure 4 is consequently a focused demonstration of how one ambiguous listing and eligibility assumptions interact, rather than evidence of widespread independent schedule changes. Both historical versions remain visible to show the Regency-specific difference.
Across the common nine programs, six normalized schedule rules differ between 2022 and current wording and five differ between 2024 and current wording. These descriptive differences are broader than their modeled effects. P37 contributes no qualifying journey; its older client-service entry nevertheless illustrates the loss of visible monthly-frequency, district and documentation guidance in the captured current directory. The archived headers also provide district and holiday guidance. Missing current wording leaves those requirements unresolved.
3.4. Delivery Alternatives and the Scope of the Access Gaps
Meals on Wheels names Coatesville City and Parkesburg Borough among its service areas, encompassing the municipalities of 16 developments; coverage descriptions for the remaining two require address clarification. Its eligibility concerns homebound people unable to prepare meals, and its area page notes a possible frozen-meal alternative when routes are full (Meals on Wheels of Chester County n.d.-a, n.d.-b). The county also lists Caring for Friends service contacts for Coatesville, Parkesburg and Caln. Simple Suppers offers potentially weekly delivery in some county areas, while SILO documents grocery delivery centered on Oxford (Chester County n.d.; Chester County Food Bank n.d.; Oxford SILO n.d.). The reviewed pages did not establish household enrollment, capacity or delivery coverage at the sampled developments. Municipality-level service descriptions therefore could not support a delivery-adjusted access count.
4. Discussion
The analysis identifies a conjunction of temporal and administrative constraints. A two-hour outing leaves 12 developments without an evening/weekend date under baseline assumptions, with five to 18 across walking and stop assumptions in the primary window. Three hours expands coverage through Lord's Pantry, but the gain depends on cross-district eligibility. The directory-version comparison shows a different interaction: alternative providers can preserve usable dates while backup choices disappear, and district filtering can remove those substitutes. Dates and redundancy therefore answer complementary referral questions.
Mikelbank's (2021) account of variation by time of day, day of week and week of month is reflected directly in this corridor: every positive two-hour evening/weekend result in the primary window depends on the Co-op's third Saturday. Lord's ordinary Thursday evenings supply the three-hour gains, so the higher-budget result is also shaped by weekly service. Clark, Perfit and Reznickova's (2024) multidimensional weekly access framework motivates integrating transport and hours. The month-specific calendar additionally distinguishes third-Saturday and fourth-Thursday sessions. A single representative week could omit or overrepresent those sessions, motivating this calendar resolution. Yan et al.'s (2026) suggestion that urban counties appear more affected by limited operating hours than by pantry location is consistent with the temporal scarcity observed here, while the Chester County results add a need to establish who may use the additional destination.
Bayly et al. (2025) used a community-informed 36-minute acceptable round-trip bus travel budget. Their methods and results describe walk and wait components as well as transit. The present 120/180-minute budgets include a 30-minute pickup and serve a different population and setting, limiting direct numerical comparison. Even these longer complete-outing allowances leave scarce evening/weekend opportunities. The Willows itinerary further identifies the specific return connection behind a threshold crossing, which is useful when reviewing a referral's practical time burden.
Ginsburg et al. (2019) compared listed pantry availability with field observations. The present comparison concerns differences between published versions and supplies no operational ground truth. The P04 removal diagnostic makes that distinction concrete: the principal 2024 contrast disappears when the ambiguous listing is omitted. The contribution is an auditable example of how one source interpretation can propagate across many housing developments and change both apparent dates and alternatives. It identifies a priority for clarification rather than estimating service reliability.
The Monday/Tuesday gap concerns routine distribution recurrences in the frozen directory for the eight Coatesville-district providers. The Salvation Army operator separately advertises weekday emergency food with a 60-day box frequency (Salvation Army Coatesville Corps n.d.). Such assistance may supply additional options, but it cannot be treated as an unrestricted weekly entitlement. The directory finding therefore does not establish an absence of food assistance on Mondays and Tuesdays. Brandy's Friday 18:00 close also leaves only one hour after the assumed weekday availability begins, within which outward travel and pickup must occur before returning home. Local partners can use these observations to review distribution-hour wording, actual service areas, program exceptions and the availability of alternatives.
Berger, Sartain and Klassen's (2022) Chester County participatory assessment identifies transport and other hardships through community evidence. This study complements that work with development-specific itinerary and calendar diagnostics. A practical next product is a dated referral worksheet that separates distribution hours, service requirements, appointment/call-ahead arrangements and usable return connections. The community sheet in Supplementary Data 1 lists targeted questions; optional partner clarification would strengthen it without being required to complete the public-data analysis.
Delivery can reduce or remove the need for a pantry journey for recipients and may substantially change the practical importance of a modeled travel gap. The present results measure opportunities to collect groceries in person by walking or scheduled transit. They cannot identify developments whose residents lack all food assistance. Prepared meals, monthly grocery boxes and housing-site distributions differ in eligibility, quantity and timing. The audit records documented programs as complementary services rather than equivalent pantry visits; proxy pickup remains unmeasured. Local referral work should establish available delivery or proxy arrangements before interpreting a zero-trip result as a need for additional transport or opening hours.
4.1. Limitations
The inventory-defined corridor is not a probability sample of county residents. Developments differ in size, address coverage and household needs; minimum-to-maximum address ranges do not measure resident exposure. One provisional housing group was omitted, and representative coordinates do not enumerate all entrances. Individual vehicle access, work schedules, disability, food insecurity and service use were not measured; the ACS context describes surrounding tracts. The results cannot quantify hunger reduced, meals supplied, equity between demographic groups or effects of inflation. Affordability motivated the project, but inflation is not an explanatory variable in this manuscript.
The road/trail network can omit pedestrian links, barriers and accessible crossings. Private-road legality, carrying groceries, queues, safety and weather remain unobserved. Results near walking cutoffs are especially sensitive. Bus schedules are not actual vehicle movements; timepoint-only boarding omits some possibilities, while partial interpolation cannot establish their reliability. Informal rides, other modes and untimed services may improve access. Delivery enrollment and unadvertised volunteer or proxy arrangements were unmeasured; the public-source audit cannot quantify how many households still need in-person pickup. Senior-housing designation alone establishes neither homebound eligibility nor receipt of delivery. Conversely, pantry capacity, documentation, frequency limits and unconfirmed operation may reduce it. The district scenario is a location-based approximation, with one destination near a boundary, not verified catchment mapping.
The 28-day window and repeated static-schedule windows cannot represent year-round observed behavior. Overlapping windows are not independent observations or uncertainty intervals. Archive capture dates do not identify schedule effective dates, and historical print/current interactive formats may differ in meaning. No temporal service trend or causal intervention was estimated. The contribution is a local integration and diagnostic application of established accessibility concepts.
5. Conclusion
Under baseline assumptions, 12 of 18 housing developments had no modeled two-hour evening/weekend pantry opportunity by walking or scheduled transit, ranging from five to 18 across walking and stop assumptions. Across all seven configurations in the primary window, no development had more than one date, and the three Parkesburg developments consistently had none. A three-hour budget improved coverage only with assumed cross-district eligibility. The version comparison demonstrates the influence of one ambiguous Salvation Army entry, while the frozen directory reveals a gap in routine Coatesville-district Monday/Tuesday listings, alongside separately advertised emergency assistance. Together, the results provide specific priorities for eligibility clarification, precise distribution-hour descriptions and complete return-trip information. Delivery alternatives should be considered before translating these in-person access gaps into claims about unmet household food needs.
Supplementary Materials
The following supporting information can be downloaded at the website of this paper posted on Preprints.org.
Author Contributions
Arjun Neel Mohanan: conceptualization, methodology, software, validation, formal analysis, investigation, data curation, visualization, writing of the original draft, and review and editing.
Funding
This research received no external funding.
Data availability
Supplementary Data 1 contains the derived analytical tables, analysis code, source manifests and supporting documentation. Supplementary Figures contains the detailed displays and workflow. Primary public data are identified by source URL, version and retrieval information in the manifests. Archived third-party originals are excluded from the supplement; reproducing steps that read those originals requires retrieving the listed inputs. No individual client records were collected.
Research ethics
This study analyzed public institutional, geographic and aggregate data. It involved no participant recruitment, interviews or individual client records.
Conflicts of Interest
The author declares no conflicts of interest.
References
- Bayly, Ric; Pustz, Jennifer; Stopka, Thomas J.; Metzger, Jay; Waters, Mary C. "Transit bus access to healthy, affordable food: A novel geographic information system (GIS) and community-informed analysis. SSM - Population Health 2025, 29, 101753. [Google Scholar] [CrossRef] [PubMed]
- Berger, Michelle; Sartain, Courtney; Klassen, Ann Carroll. Addressing community needs through a participatory food security assessment. Journal of Hunger & Environmental Nutrition 2022, 17(2), 170–190. [Google Scholar] [CrossRef]
- Chester County. "Home Delivered Meals / Food Programs.". n.d. Available online: https://www.chesco.org/493/Meals-Food-Programs (accessed on 2 November 2026).
- Chester County Food Bank. Community Food Security Assessment. 2018. Available online: https://chestercountyfoodbank.org/wp-content/uploads/2018/04/2018-Community-Food-Security-Assessment-Report.pdf.
- Chester County Food Bank. "Prepared Meals.". n.d. Available online: https://chestercountyfoodbank.org/our-approach/distribution/simple-suppers-prepared-meals/ (accessed on 2 November 2026).
- Clark, Callie; Perfit, Christa; Reznickova, Alice. A multi-dimensional access index: Exploring emergency food assistance in New York City. Health & Place 2024, 89, 103319. [Google Scholar] [CrossRef] [PubMed]
- Delafontaine, Matthias; Neutens, Tijs; Schwanen, Tim; Van de Weghe, Nico. The impact of opening hours on the equity of individual space-time accessibility. Computers, Environment and Urban Systems 2011, 35(4), 276–288. [Google Scholar] [CrossRef]
- Farber, Steven; Morang, Melinda Z.; Widener, Michael J. Temporal variability in transit-based accessibility to supermarkets. Applied Geography 2014, 53, 149–159. [Google Scholar] [CrossRef]
- Ginsburg, Zoë A.; Bryan, Alexander D.; Rubinstein, Ellen B.; Frankel, Hilary J.; Maroko, Andrew R.; Schechter, Clyde B.; Stowers, Kristen Cooksey; Lucan, Sean C. Unreliable and Difficult-to-Access Food for Those in Need: A Qualitative and Quantitative Study of Urban Food Pantries. Journal of Community Health 2019, 44(1), 16–31. [Google Scholar] [CrossRef] [PubMed]
- Meals on Wheels of Chester County "Delivery Areas. Available online: https://mowcc.org/delivery-areas-1 (accessed on 2 November 2026).
- Meals on Wheels of Chester County "Frequently Asked Questions from Our Clients.". Available online: https://mowcc.org/faq-from-clients-1 (accessed on 2 November 2026).
- Mikelbank, Brian A. Spatial, Temporal, and Transit Access to Emergency Food Providers. The Professional Geographer 2021, 73(4), 725–736. [Google Scholar] [CrossRef]
- Neutens, Tijs; Delafontaine, Matthias; Schwanen, Tim; Van de Weghe, Nico. The relationship between opening hours and accessibility of public service delivery. Journal of Transport Geography 2012, 25, 128–140. [Google Scholar] [CrossRef]
- Oxford SILO. "Delivering Hope.". n.d. Available online: https://oxfordsilo.com/delivering-hope/ (accessed on 2 November 2026).
- Salvation Army Coatesville Corps. "Providing Emergency Services.". n.d. Available online: https://easternusa.salvationarmy.org/eastern-pennsylvania/coatesville-pa/emergency-services/ (accessed on 2 November 2026).
- Stone, Jackson F.; Bales, John R.; Harris, Jonathan D.; Harper, Claire E.; Scott, Joshua J.; Kotva, Joseph J.; Lassen, David S. "Client and Pantry Factors Influencing Transportation-Related Barriers Among Users of Food Pantries: A Cross-Sectional Analysis. Foods 2025, 14(21), 3673. Available online: https://pubmed.ncbi.nlm.nih.gov/41227645/. [CrossRef] [PubMed]
- U.S. Census Bureau. A Compass for Understanding and Using American Community Survey Data: What Federal Agencies Need to Know. Appendix: derived-estimate margins of error. 2008. Available online: https://www.census.gov/content/dam/Census/library/publications/2008/acs/ACSFed.pdf.
- U.S. Census Bureau. "Household Size by Vehicles Available, Table B08201." 2020–2024 American Community Survey Five-Year Estimates. Dataset. Bulk table (https://www2.census.gov/programs-surveys/acs/summary_file/2024/table-based-SF/data/5YRData/acsdt5y2024-b08201.dat). Corresponding ACS 2024 tract geography. 2024. Available online: https://tigerweb.geo.census.gov/arcgis/rest/services/TIGERweb/tigerWMS_ACS2024/MapServer/8.
- Weber, Joe; Kwan, Mei-Po. Bringing Time Back In: A Study on the Influence of Travel Time Variations and Facility Opening Hours on Individual Accessibility. The Professional Geographer 2002, 54(2), 226–240. [Google Scholar] [CrossRef]
- Wessel, Nate; Farber, Steven. On the accuracy of schedule-based GTFS for measuring accessibility. Journal of Transport and Land Use 2019, 12(1), 475–500. [Google Scholar] [CrossRef]
- Yan, Minhao; Just, David R.; Byrne, Anne T.; Zhang, Dongyue. The role of location in private food assistance: client travel patterns and accessibility. Food Policy 2026, 138, 103029. [Google Scholar] [CrossRef]
- Archived directory data: Chester County Food Bank, print-list captures September 27, 2022 (https://web.archive.org/web/20220927053453id_/https://chestercountyfoodbank.org/find-help/food-finder/food-providers-list/) and July 19, 2024 (https://web.archive.org/web/20240719220136id_/https://chestercountyfoodbank.org/find-help/food-finder/food-providers-list/); current Food Finder (https://chestercountyfoodbank.org/find-help/food-finder/), local snapshot October 19, 2026. Capture dates are used as version identifiers.
- Other primary data: County housing inventory (https://www.chesco.org/DocumentCenter/View/36825); PHFA inventory (https://www.phfa.org/forms/multifamily_inventory/dv_chester.pdf); Census school districts Exact transit releases, county GIS queries, archived URLs and hashes are supplied in the package manifests. Analysis uses saved versions. Available online: https://tigerweb.geo.census.gov/arcgis/rest/services/TIGERweb/School/MapServer/0.
Figure 1.
Study area and housing sample. Representative locations for 18 developments and corridor pantry candidates, with provisional locations distinguished. Municipal boundaries provide geographic context.
Figure 1.
Study area and housing sample. Representative locations for 18 developments and corridor pantry candidates, with provisional locations distinguished. Municipal boundaries provide geographic context.
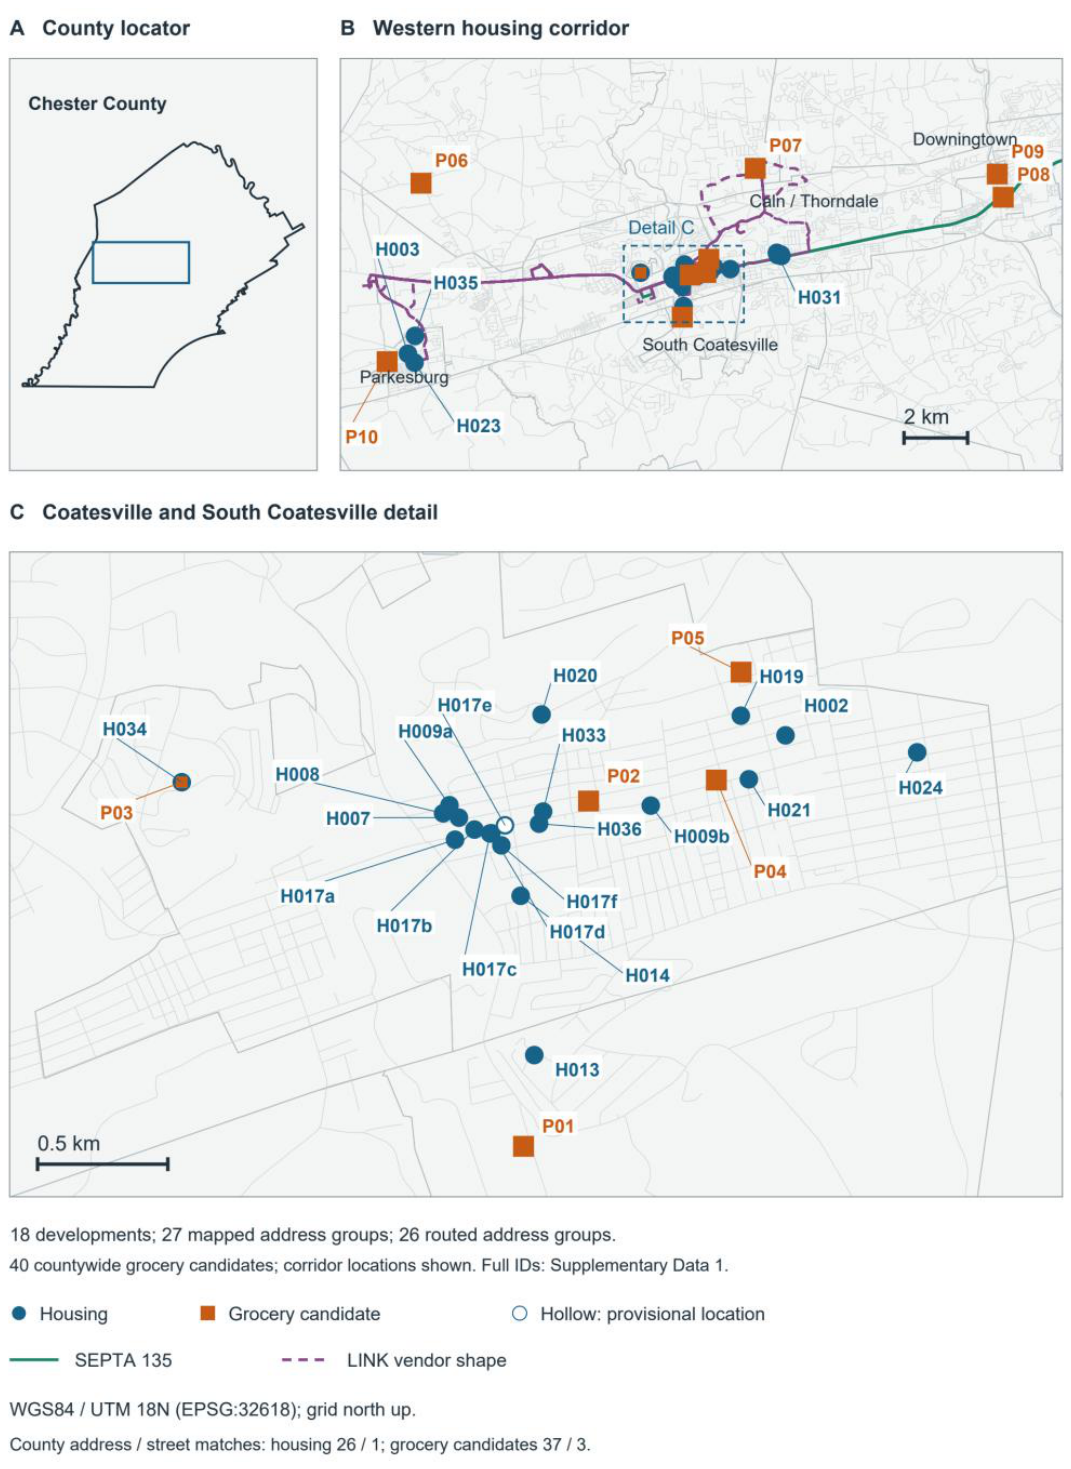
Figure 2.
Published calendar for 14 retained providers. November 2–29, 2026, with unconfirmed Thanksgiving recurrences removed. Colored cells indicate calendar-only 30-minute pickup fit; no journey or eligibility is implied. West Chester candidates remain visible although none generated a qualifying trip. The full 40-provider supplemental calendar preserves the conditional holiday-included display.
Figure 2.
Published calendar for 14 retained providers. November 2–29, 2026, with unconfirmed Thanksgiving recurrences removed. Colored cells indicate calendar-only 30-minute pickup fit; no journey or eligibility is implied. West Chester candidates remain visible although none generated a qualifying trip. The full 40-provider supplemental calendar preserves the conditional holiday-included display.
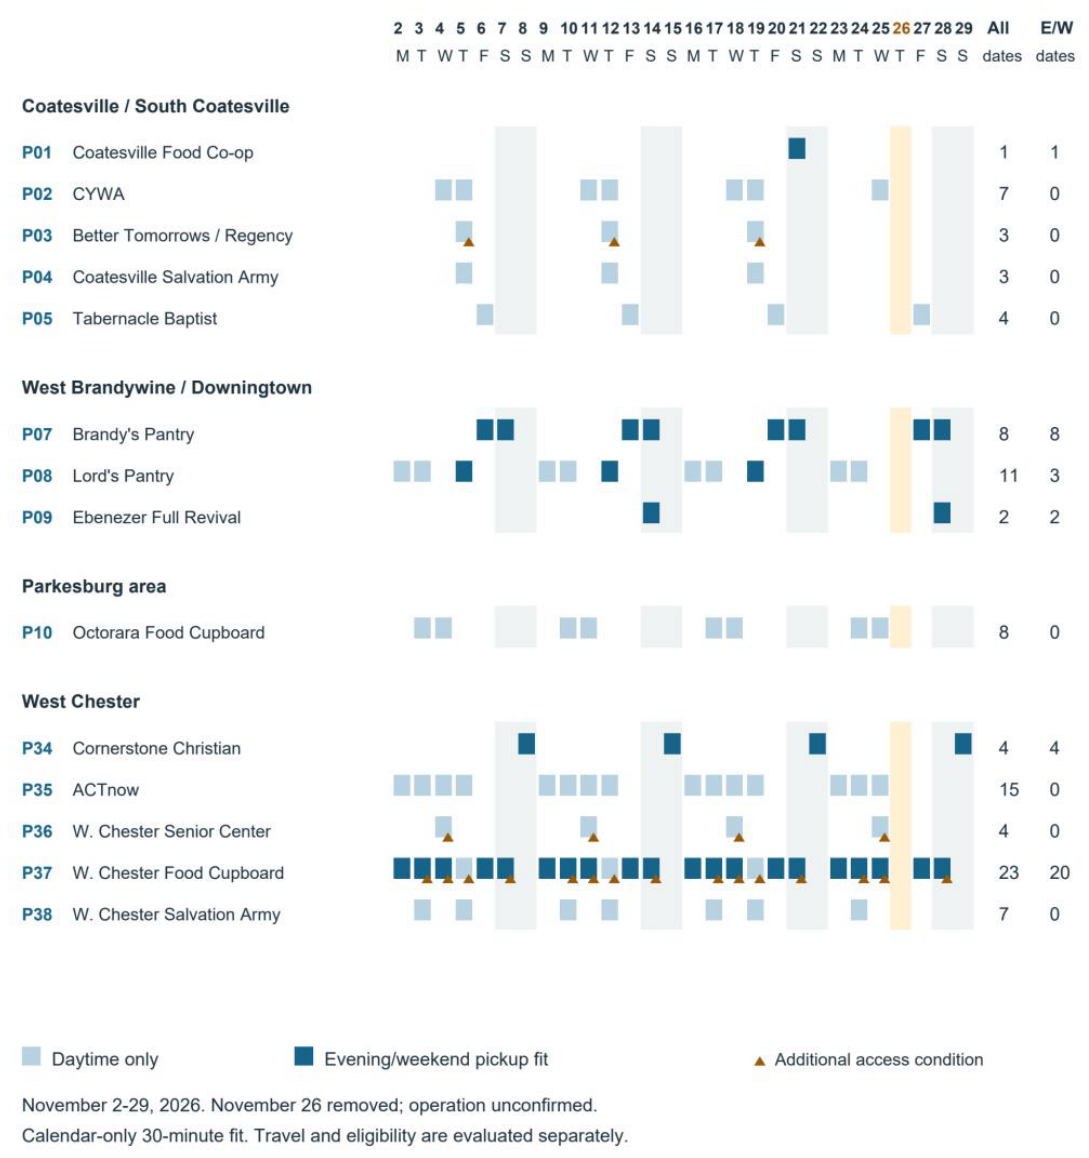
Figure 3.
Complete-trip access at all 18 developments. Usable dates for two- and three-hour evening/weekend outings, and usable/backup dates for two-hour all-day outings. Assumed and illustrative same-district eligibility are shown separately. Dots are within-development medians; whiskers are sampled-address ranges, not confidence intervals. Only N. Second Ave. has a nonzero range, for backup dates; sampled addresses gave identical values elsewhere in the displayed outcomes. E/W denotes weekday 17:00–21:00 and weekend 07:00–21:00 availability. Backup dates offer at least two separately feasible providers.
Figure 3.
Complete-trip access at all 18 developments. Usable dates for two- and three-hour evening/weekend outings, and usable/backup dates for two-hour all-day outings. Assumed and illustrative same-district eligibility are shown separately. Dots are within-development medians; whiskers are sampled-address ranges, not confidence intervals. Only N. Second Ave. has a nonzero range, for backup dates; sampled addresses gave identical values elsewhere in the displayed outcomes. E/W denotes weekday 17:00–21:00 and weekend 07:00–21:00 availability. Backup dates offer at least two separately feasible providers.
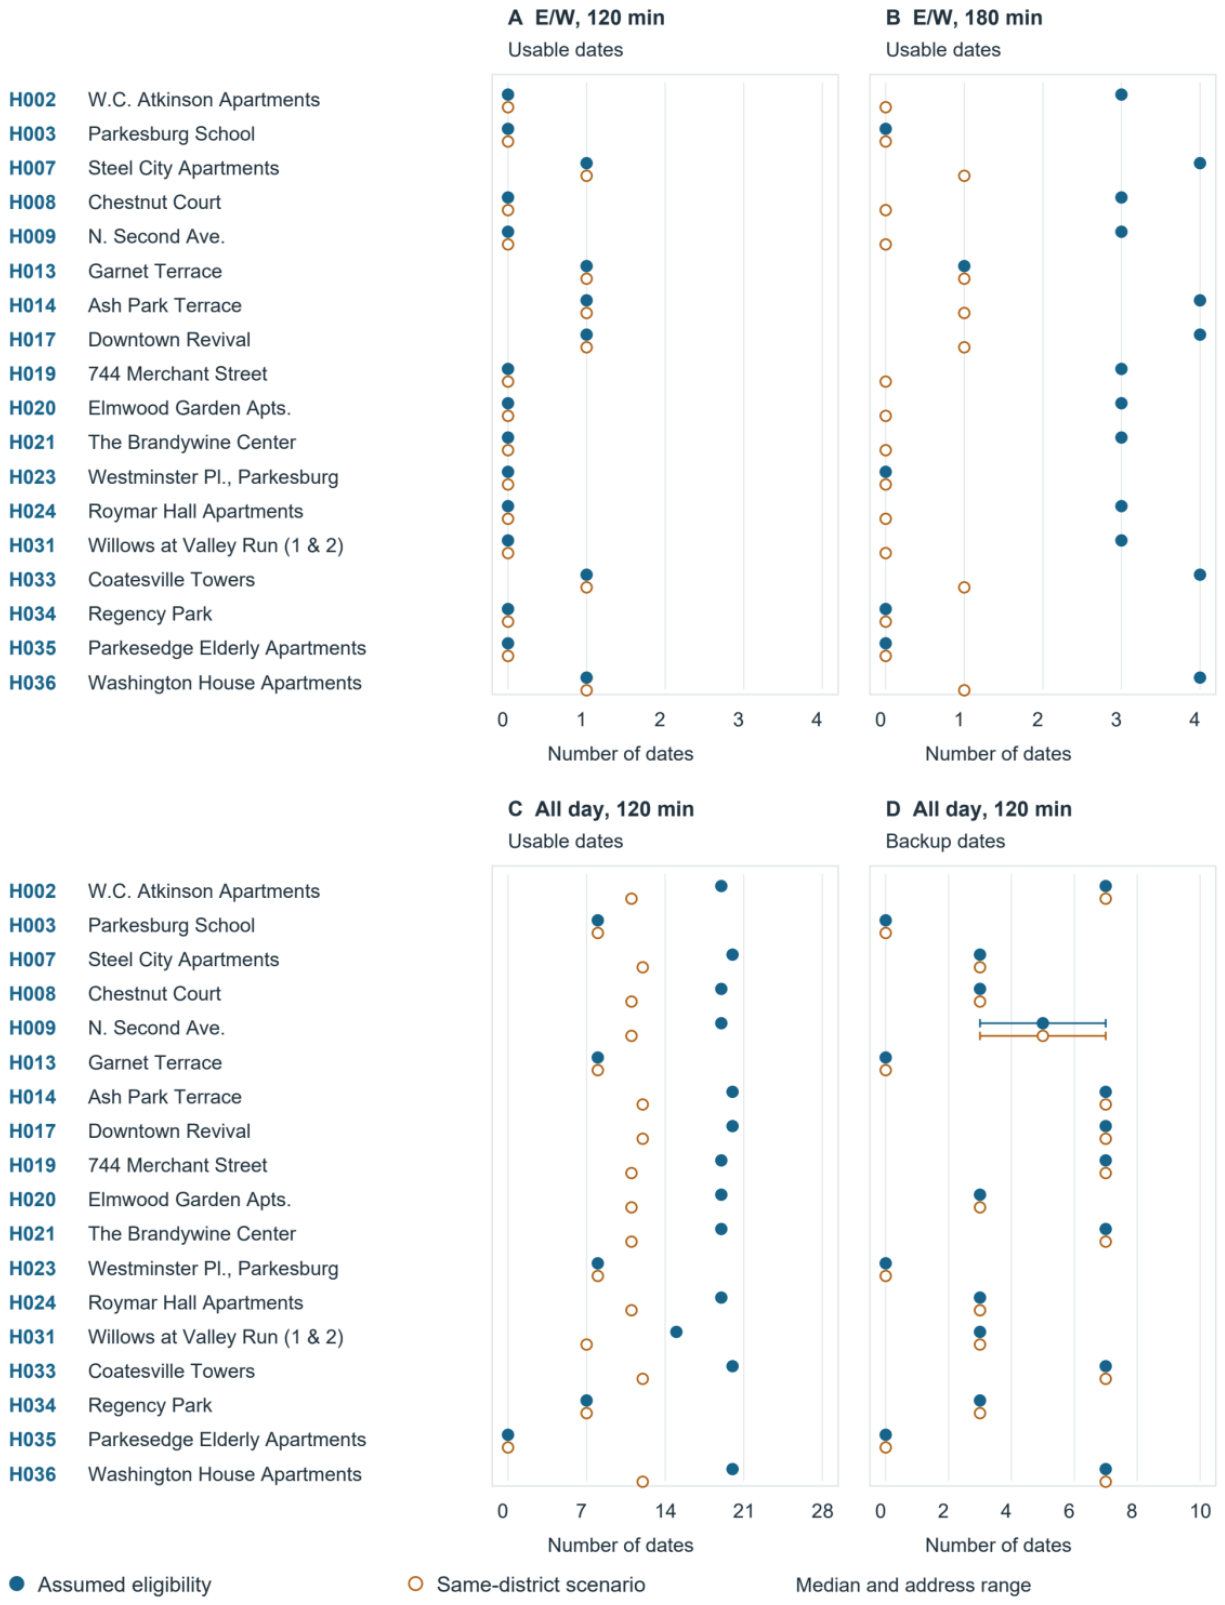
Figure 4.
Published-information sensitivity in dates and alternatives. Current-minus-earlier differences for both 2022 and 2024 wording, using two-hour all-day outings and nine matched services. The 2024 contrast depends entirely on P04 in the removal diagnostic; 2022 additionally reflects Regency's on-site wording. Negative differences indicate fewer modeled dates under current wording. Medians and ranges summarize paired address-level differences. Sampled addresses gave identical differences within every development for these panels, so the ranges coincide with the median dots. Each alternative provider independently satisfies the 120-minute outing budget. Supplementary Figures contains the original pilot display (S01), full calendar (S02), address-level outings and sensitivity (S03), paired version changes (S04), and workflow (S05). Supplementary Data 1 supplies the derived tables, code and source records.
Figure 4.
Published-information sensitivity in dates and alternatives. Current-minus-earlier differences for both 2022 and 2024 wording, using two-hour all-day outings and nine matched services. The 2024 contrast depends entirely on P04 in the removal diagnostic; 2022 additionally reflects Regency's on-site wording. Negative differences indicate fewer modeled dates under current wording. Medians and ranges summarize paired address-level differences. Sampled addresses gave identical differences within every development for these panels, so the ranges coincide with the median dots. Each alternative provider independently satisfies the 120-minute outing budget. Supplementary Figures contains the original pilot display (S01), full calendar (S02), address-level outings and sensitivity (S03), paired version changes (S04), and workflow (S05). Supplementary Data 1 supplies the derived tables, code and source records.
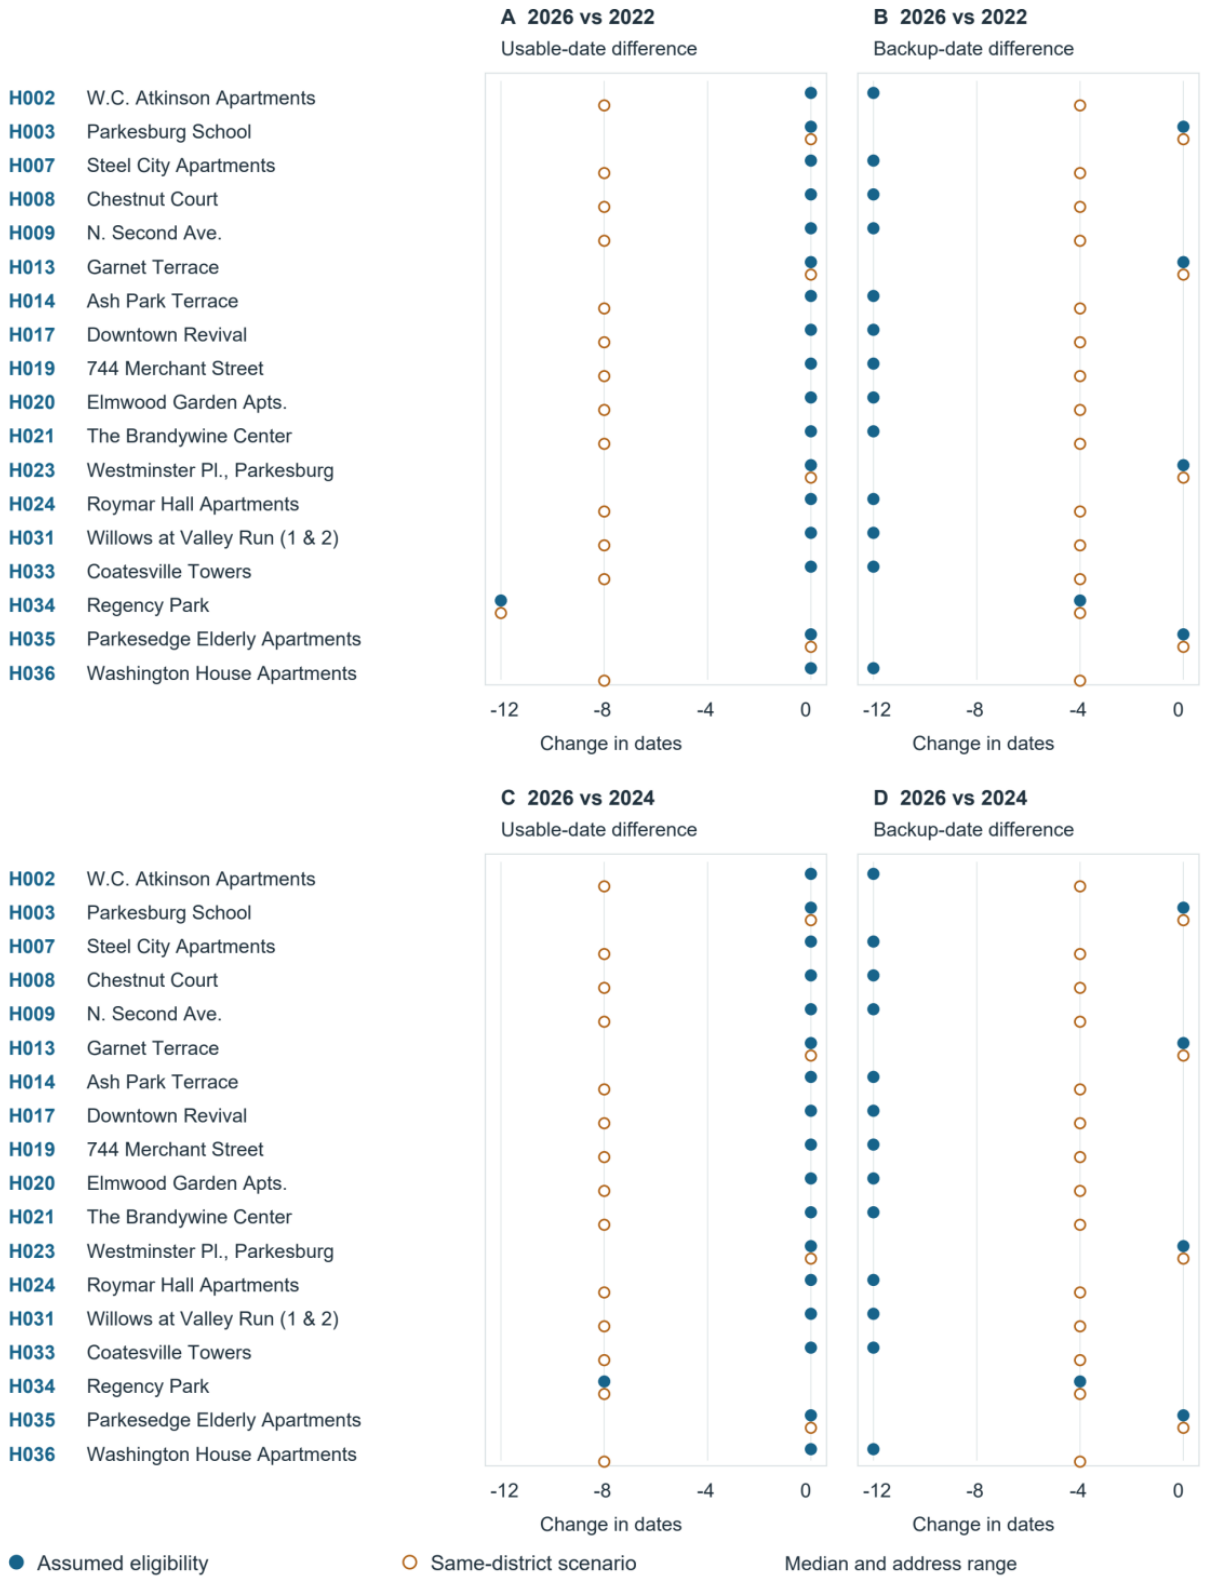

Table 1.
Principal modeling parameters and their rationale.
| Parameter | Baseline | Completed sensitivity / alternative | Source or rationale |
|---|---|---|---|
| Complete outing | 120 min, including pickup and return | 90 and 180 min | Declared time-budget scenarios |
| Walking-only distance | 1,609 m each way | 3,218 m; 805 m in combined slow/short scenario | Half-/one-mile geographic anchors from USDA/FTA, adapted to network paths |
| Transit walking | 805 m per leg; 1,609 m per direction | 1,609 m per leg; 3,218 m per direction | Declared access/egress constraints |
| Walking speed | 1.35 m/s | 1.0 m/s return only; 1.0 m/s both ways with 805 m walk-only cap | OpenTripPlanner documented default; study-selected slower scenarios |
| Pickup duration | 30 min | 45 min | Declared service allowance |
| Boarding buffer | 5 min | Additional 5 min before estimated intermediate-stop boarding | Conservative timing allowance |
| Regency on-site travel | 5 min each way | On-site service removed in retained pilot sensitivity | Within-development travel allowance |
| Availability | Daily 07:00–21:00 | Weekdays 17:00–21:00; weekends 07:00–21:00 | Hypothetical household availability profiles |
| LINK stops | Published PDF timepoints | Partial intermediate-stop interpolation, alone / with generous walking | Distinguishes official and estimated times |
| Eligibility | Assumed, with Regency-only on-site access | Same-district filter | Archived typical-district guidance; current catchments unverified |
| Directory version | October 2026 snapshot | 2022 and 2024 wording with transport fixed | Tests information sensitivity |
Table 1 note. OpenTripPlanner's route-request documentation supplied the walking-speed reference; routing used the custom Python search. The walking-distance anchors come from USDA ERS and FTA guidance; neither validates pantry walking tolerances. Settings and exploratory amendments are preserved in the reproducibility package. Figure S05 summarizes the workflow. (https://docs.opentripplanner.org/en/dev-2.x/RouteRequest/; https://www.ers.usda.gov/data-products/food-access-research-atlas/documentation/large-retailer-access-map-reference-guide; https://www.transit.dot.gov/regulations-and-guidance/transportation-planning/nci-charrette-system-guide-transit-oriented).
Table 2.
Developments with fewer opportunities under current wording, among 18 developments.
| Earlier version | Eligibility | Developments with fewer usable dates | Fewer provider-dates | Fewer backup dates |
|---|---|---|---|---|
| 2022 | Assumed | 1/18 | 14/18 | 14/18 |
| 2022 | Same district | 14/18 | 14/18 | 14/18 |
| 2024 | Assumed | 1/18 | 14/18 | 14/18 |
| 2024 | Same district | 14/18 | 14/18 | 14/18 |
Two-hour all-day outings; baseline travel; nine matched services. Counts compare current wording with the indicated earlier version. Changes describe published-information scenarios.
Disclaimer/Publisher’s Note: The statements, opinions and data contained in all publications are solely those of the individual author(s) and contributor(s) and not of MDPI and/or the editor(s). MDPI and/or the editor(s) disclaim responsibility for any injury to people or property resulting from any ideas, methods, instructions or products referred to in the content. |
© 2026 by the authors. Licensee MDPI, Basel, Switzerland. This article is an open access article distributed under the terms and conditions of the Creative Commons Attribution (CC BY) license (http://creativecommons.org/licenses/by/4.0/).
Copyright: This open access article is published under a Creative Commons CC BY 4.0 license, which permit the free download, distribution, and reuse, provided that the author and preprint are cited in any reuse.