

Submitted:
03 November 2026
Posted:
05 November 2026
You are already at the latest version
Abstract
PHP2Shell (CVE-2026-109618, CVE-2026-109619) caused numerous organisations to proactively shut down their services. This research provides an estimation of the cost incurred by proactively shutting down services and reacting to this incident. A listing of 46 reporting units was created based on public documentation. Costs are framed through scenario-based modelling using documented cases as the input population. An opportunity cost of being unavailable was considered, along with incremental cost of reacting to the incident. Transactional and informational services were also considered. The listing of reporting units documents the publicly observed cases. Scenario populations were created where the cost is estimated to be approximately $76,500 to $99.06 million. An example middle scenario was $1.565 million. Verified durations can be added as they become available. The counterfactual analysis shows that if a typical transactional service was shut down immediately compared to continuing operation, it becomes economically favourable to shut down if the probability of a significant compromise occurring during the exposure period is above approximately 0.45% (assuming the loss incurred if compromised to be $1 million). Decisions to shut down depend on the service and will not always be rational or irrational. Decisions to shut down depend on service-specific context. If alternative mitigations are possible then incremental cost and risk should be considered.
Keywords:
cybersecurity economics
; precautionary downtime
; PHP vulnerabilities
; incident cost
; open-source software
; break-even analysis
; patch management
1. Introduction
1.1. Background
A breach in an open source software will have wide-reaching impacts. Due to how widespread many of these components are, vulnerabilities in core components can impact government services, commercial platforms, hosting platforms, hospitals, universities and small operators all at the same time.
A recent example was the PHP2Shell vulnerability. This exploit was discovered in October 2026 and involves two critical vulnerabilities in the PHP runtime. The first vulnerability, CVE-2026-109618, allows for remote code execution via out of memory corruption. The second vulnerability, CVE-2026-109619, allows for remote code execution via stale global state. Both of these vulnerabilities were rated 9.2 on the CVSS v4.0 scale. The vulnerable code has been present since PHP 5.4.0 (2012). A separate PHP vulnerability, CVE-2026-115560, was also disclosed on the 23rd October 2026.
PHP provided early notification on the 20th October 2026 that there was a security release planned for the 21st October at 14:00 UTC. Prior to the patches being available, technical details were leaked and the vulnerabilities were replicated by watchTowr. Amazon Threat Intelligence reported that the vulnerability was being exploited on the 17th October in honeypot telemetry. Cloudflare also reported being targeted early in the morning of the 21st October and implemented temporary firewall rules. Patches were released in PHP 8.5.12, 8.4.27, 8.3.36 and 8.2.35.
Many government agencies in Europe, Australia, Japan, the United Kingdom and United States encouraged operators to patch their systems immediately or take systems offline if they could not. Many organisations did this prior to any patches being released. The Dutch National Cyber Security Centre took their website offline, followed by the Port of Rotterdam, government portal Overheid.nl, national football association KNVB and several hospitals, according to Reuters. Hundreds of websites were taken offline according to The Record on the 21st October.
The potential for exposure is vast. PHP is used by 69.3% of websites with a known server-side language according to W3Techs. Qualys analysed anonymized data from over 10,000 customers and found that there were 167 million PHP packages installed. Of these, 156 million had a known version. 73% of these are exposed to the internet. Of the known versions, 73% were exposed to the internet. 28% (around 44 million) were on supported branches with a fix available. 71% (around 110 million) were on end of life/end of support branches. Only around 199,000 (0.13% of the known versions) were patched within 12 hours of disclosure. However, Qualys later reported that around 581,000 were patched within 24 hours due to the increased observation period.
1.2. Precautionary Downtime as an Economic Event
Costs associated with cybersecurity incidents are often looked at through the lens of breaches, such as data loss, fraud, recovery costs, legal penalties and reputation damage. This study looks at the costs associated with precautionary downtime. This is defined by three key characteristics:
1. This is the cost of protection. Protection cost refers to deliberate service interruption chosen proactively. The service may be taken down proactively as a precautionary measure.
2. The choice is evidence-informed. Operators will look at what the expected cost of keeping the service available is, compared to the costs of taking it down. They will also investigate whether mitigation is possible, and how long it will take to prove the service is safe.
3. These costs are distributed. Many organisations will be impacted. Public agencies, hosting providers, vendors and small operators will have to take action immediately. This means that although the costs to each organisation are small, they can add up to a large issue.
This study frames outage necessity and compromise patterns as scenario variables. It has been shown that there was a variety in compromises. For example, the online supermarket Picnic did not take their website offline as their ordering systems do not use PHP.
1.3. Related Literature and Research Gap
Cost of Cyber-incidents
Studies have shown that headline figures can offer valuable context, and defence and indirect costs complement direct costs. Incident level studies show that there is a heavy tailed distribution of costs. A few large incidents will skew the average contributing to the distribution shape. Event studies look at the impact of security announcements on the stock market.
Patching Economics
Patching management involves timing decisions between early deployment (enabling rapid defect identification) and later deployment (enabling exploit monitoring). Patch management is a coordination problem between vendors and users. The PHP2Shell tool condenses this into hours, with an added ‘middle ground’ of shutting down.
Precautionary and Avoidance Costs
There is literature about the economics of disaster preparedness. If the expected loss avoided is greater than the precautionary cost then it is rational to spend on precautions. However, the probability of the event being avoided is often unknown. This study uses this principle to model the cost of precautionary shutdowns in cybersecurity. The event being avoided may not be confirmed (successful compromise). The Gordon-Loeb model shows that optimal spending on security should be less than a proportion of the expected loss. In this case the ‘cost’ is downtime, which is a unique scenario as it is a cost of availability.
Decision Making with Uncertainty
The decision to shut down a service relies on the visibility of assets, technical debt and organisational authority. Organisations with mature inventories can patch in hours. Those with less mature inventories may default to a shut down due to no way of confirming the remediation has been completed. This creates an imbalance in how organisations will rationally react to the same vulnerability. This study uses a break-even approach to capture this, with thresholds for each service.
Open Source Infrastructure
Studies have shown that there is a huge amount of downstream dependency on software maintained by small groups. Measurement studies have shown how quickly Heartbleed flaws can spread across the web.
There is no standardised public data available for the cost of precautionary shutdowns. Public reports document organisations affected and the threat posed. This means that a defendable assessment must be made based on the evidence of the incident and modelling of the cost. This must include uncertainty.
1.4. Research Questions
1. What types of organisations and services publicly reported precautionary interruption or emergency remediation during the PHP2Shell incident?
2. What economic costs can reasonably be attributed to unavailability, distinguishing transactional from informational services?
3. What additional costs arose from emergency identification, patching, testing, restarting and verification?
4. What range of costs is consistent with transparent assumptions about duration, service criticality, organisational scale and response effort?
5. Under what conditions would the expected losses avoided through precaution exceed the cost of downtime and emergency remediation?
1.5. Contributions
The study makes four contributions. Firstly, a replicable framework is developed to calculate the costs of precautionary downtime without large-scale scraping of proprietary data. Secondly, opportunity cost and incremental costs are separated to prevent double-counting. Thirdly, publicly reported outages are considered as a systematically recorded register of known cases. This section also outlines the extent to which the findings can be extrapolated. Finally, the precautionary costs are compared to a counterfactual of continuing operations to understand the economic rationale behind shutdowns.
Section 2 provides an overview of the incident. Section 3 discusses the data and evidence criteria. Section 4 and Section 5 outline the cost model and scenario analysis. Section 6 provides the counterfactual framework. Section 7 compares PHP2Shell to Heartbleed. Section 8 discusses the policy implications, Section 9 the limitations and Section 10 the conclusions.
2. Incident Background and Scope
2.1. Technical Details
The PHP2Shell vulnerability contains two memory safety issues within the PHP engine, meaning applications are vulnerable even if their code is correct.
CVE-2026-109618: Request memory is freed using longjmp() when a PHP application runs out of memory. In some cases the request memory will be partially uninitialised during allocation. This can be accessed or used for control flow during the tidy-up phase.
CVE-2026-109619: Global data that refers to request memory is not always reference request memory consistently. The memory can then be accessed by subsequent requests in the same worker process. This means the memory will have been freed, but will not have been re-initialised.
Three key points are important from an economic perspective. Firstly, the request is processed by PHP before any application code is run. This means authentication in the application cannot stop the attack. Secondly, PHP has listed all installations that process web requests as vulnerable, including PHP-FPM, Apache mod_php, php-cgi, FrankenPHP and LiteSpeed. Lastly, the researchers also showed that it was possible to disclose memory in the worker without authentication.
The fixed versions are PHP 8.5.12, 8.4.27, 8.3.36 and 8.2.35. PHP 8.1 and below are vulnerable but are no longer getting upstream updates.
2.2. Timeline and Response Window
A table of key events has been provided below. The timeline shows the key events that happened between the initial discovery of multiple RCE paths by Calif on 1 Aug and the patching of around 199,000 installations by Qualys on 24 Oct. Other key events include honeypot attacks on 17 Oct, advance warning and leaks on 20 Oct, Cloudflare attacks, advisories, patches and takedowns by the Dutch NCSC and an NHS advisory on 21 Oct.

Table 1.
Key events in the PHP2Shell disclosure and response sequence.
| Date (2026) | Event | Source |
|---|---|---|
| 1 Aug | Calif identifies multiple RCE paths in PHP | [14] |
| 11 Aug | Calif reports the first bug to PHP; coordinated disclosure begins | [14] |
| 24 Aug | Wiz Research independently reports the vulnerabilities | [14] |
| 17 Oct | Exploitation attempt recorded in Amazon MadPot honeypot telemetry | [15] |
| 20 Oct | PHP gives advance notice of a critical release for 21 Oct 14:00 UTC; technical details leak; watchTowr confirms flaws are real | [5,6,18] |
| 21 Oct, 07:43 UTC | Cloudflare reports early attacks and deploys stopgap firewall rules | [13,14] |
| 21 Oct, 13:34 UTC | PHP publishes its two GitHub security advisories | [12] |
| 21 Oct, ~14:00 UTC | Fixed releases go live; 8.5.12 GitHub release stamped 14:06 UTC | [7,13] |
| 21 Oct | Dutch NCSC and others take sites offline; CISA reports no observed exploitation at the time of publication | [2,13] |
| 21 Oct, 15:51 (UK) | NHS England Digital advisory CC-4875 published | [3] |
| 24 Oct | Qualys reports ≈199,000 installations patched within 12 hours of disclosure | [16] |
Note. Two examples from secondary sources have been provided to give an idea of the range. The Weird Gloop wiki was down for approximately 13 hours. The fortrabbit hosting dashboard was also unavailable between approximately 18:00 and 21:20 CEST, however client sites remained available. These are only examples and do not represent a true picture.
The response window will need to be determined for each organisation as it is rare for the awareness time, disruption time, mitigation time, recovery time and verification time to be the same.
2.3. Attack Attempts Not Confirmed as Compromises
The exploitation attempts were confirmed in public reporting up to the cut-off. The Dutch NCSC confirmed that there was no confirmed active exploitation when taking sites offline. NHS England also confirmed there was a high likelihood this would be exploited in the future.
Both vulnerabilities were added to CISA’s catalogue of Known Exploited Vulnerabilities on 26 October 2026. NHS England Digital updated their advisory on 29 October 2026. Whilst this does not confirm mass compromise, it does change the threat context.
2.4. Scope of the Economic Assessment
There are two costs considered:
Opportunity costs caused by unavailability – This is the economic activity or service that can no longer be provided due to an unavailable service.
Emergency increase costs – This is any extra costs incurred to identify the exposure, make changes to systems, confirm remediation and restore service.
The study focuses on downtime and emergency response costs. Breach costs and social impacts can be added as future enrichment categories.
3. Data and Methods
3.1. Research Design
This is a systematic secondary data analysis. A list of organisations and services has been created by manually verifying that they have been reported to provide precautionary disruption or emergency repair. Each entry should have at least one source. Ideally the source will be an official announcement, government statement, status page or news article mentioning an organisation responsible.
Three levels of evidence. The study distinguishes three categories throughout: (1) observed facts from public reporting (which organisations interrupted service, what actions they took, and whether exploitation was confirmed); (2) hypothetical cost scenarios (deterministic point estimates under stated parameter assumptions for stylised populations); and (3) simulated results (Monte Carlo draws and sensitivity indices that quantify uncertainty in the assumed parameters). All cost figures are built from scenario-based assumptions and Monte Carlo simulation. The register records that services were interrupted.
3.2. Search Strategy
Between 21st and 30th October 2026 evidence was gathered using search engines. A search was performed for a combination of the vulnerability IDs (CVE-2026-109618, CVE-2026-109619), PHP2Shell, plus keywords such as offline, precautionary, taken offline, maintenance mode and back online. Example search terms were PHP2Shell, CVE-2026-109618, CVE-2026-109619 offline, PHP2Shell precautionary shutdown, “PHP2Shell taken down”, and PHP2Shell maintenance mode. The searches were performed using general search engines, plus searching security vendor and government advisory websites from the references. For each potential result the URL, date of publication and whether the report mentioned a specific operator and service were noted. If multiple stories mentioned the same original report this was counted as one evidence chain. Any sources that did not allow automated access were prioritised for higher confidence ratings. Social media was only used if there was a link to the publisher. Most searches were performed in English so there is a English-language sources formed the core set. The cut off date for evidence was 30th October 2026. Some reports were published after this date. These can be added in a future update. This includes CISA adding both vulnerabilities to their Known Exploited Vulnerabilities catalogue on the 26th October and NHS England Digital updating their advisory on the 29th October. These were noted but not included in the case counts.
3.3. Evidence Hierarchy
Table 2.
Evidence levels used in the case register.
| Level | Evidence | Use |
|---|---|---|
| A: primary | PHP advisories, government cybersecurity advisories, official status pages, statements by affected organisations, hosting-provider incident reports | Establishes facts about the vulnerability, the patch and an organisation’s own action |
| B: contemporaneous reporting | Vendor and researcher technical write-ups, established news reports that name an affected service and cite an organisation or official | Establishes that a named service was interrupted and the circumstances |
| C: secondary summaries | Aggregator lists, explainers, commentary, retrospective roundups | Leads only; never independent confirmation |
3.4. Inclusion Criteria and Register Fields
Services were included in the register if there was a source between 20–30 October 2026 that showed they had been disrupted, limited or put into maintenance mode by the service operator, or had emergency mitigation. Those that remained online are included as comparison data (no disruption) and are not remain available as reference points. Two subpopulations have been identified within the register: (i) those that were disrupted or significantly limited (CD and CR eligible) and (ii) those that had emergency mitigation applied but were not disrupted (CR eligible). The parameter N in the scenarios refers to population (i). All response costs in the scenarios have been scaled to population (i). This is a conservative approach as population (ii) did have mitigation applied. No services were independently identified as having only mitigation (population ii), all 46 register entries had disruption or limitation.
3.5. Preliminary Register
The register has grown from an initial 23 entries to 46 entries across 13 countries. The initial pass of 23 entries is included in the register, however the register has been updated. Each entry is a documented report unit. These can be organisations, services or an unknown number of services that were disrupted, limited or mitigated. Some entries are single services whilst others are an unknown number of hospitals, political party websites, government services or banking websites. None of the entries Verified start and end times can be added as they become available. One entry (addy.io) has a reported time of approximately 3 hours 26 minutes from its own status page. 4 Class A (transactional), 32 Class B (informational) and 10 Class C or unknown. 1 High confidence, 29 Medium confidence and 16 Low confidence.
Table 3.
Profile of the case register (expanded pass).
| Dimension | Count |
|---|---|
| Entries (expanded register) | 46 |
| Entries with verified start and end timestamps | 0 of 46 |
| Entries with reported duration (time given but not independently verified) | 1 of 46 (addy.io) |
| Entries with unknown duration | 45 of 46 |
| Class A (transactional) / Class B (informational) / Class C or unknown | 4 / 32 / 10 |
| Confidence high / moderate / low | 1 / 29 / 16 |
| Evidence level A / B / C | 3 / 37 / 6 |
| Countries | 13 (Netherlands 15, Japan 8, USA 6, Belgium 3, Canada 2, Nepal 4, United Kingdom 2, and one each for Denmark, Finland, France, Germany, Czech Republic, South Africa) |
The full register is given in Appendix A; the supplementary CSV (data/case_register.csv) records PHP exposure evidence, duration status, source URLs and deduplication decisions for every entry.
3.6. Selection Bias
This register is a census of cases that have been publicly documented according to this search protocol. This means that the number of cases in the register provides a documented floor for documented events meeting inclusion criteria. The register records that services were interrupted and which organisations were involved. It is a qualitative record of documented incidents that frames parameter assumptions for scenario modelling.
4. Economic Estimation Framework
4.1. Accounting Principles
The framework distinguishes between costs associated with reduced availability and additional costs incurred during emergency response. For organisation i:
Ci = CD,i + CR,i
Where Ci is the total modelling cost associated with precautionary measures, CD,i is the opportunity cost associated with reduced availability and CR,i is the additional cost incurred during emergency response. These two components should only be summed if they are describing different effects.
4.2. Service Classes
Table 4.
Service classification and cost treatment.
| Class | Description | Treatment |
|---|---|---|
| A: transactional commercial | Payment, booking, checkout, paid SaaS and other services where unavailability interrupts measurable transactions | Monetised from interrupted transaction volume, contribution margin or foregone output |
| B: informational | Ministry homepages, information portals, party and news sites whose main function is communication | Reported qualitatively; monetised only with a defensible valuation method and data |
| C: mixed or unknown | Portals combining information with applications, appointments or payments, and services whose function the evidence does not establish | Only the interrupted transactional component is monetised; unknown cases shown in a sensitivity row |
4.3. Availability-Related Opportunity Loss
The opportunity cost for transactional services is best considered as CD,i = Li × mi, where Li represents the value of lost transactions and mi is the contribution margin ratio. If transaction data is not available then the opportunity cost will be estimated using CD,i = Hi × Vi × qi. Hi represents the length of time the service was effectively unavailable, Vi represents the assumed average hourly contribution of the transactional element of the service, and qi represents the proportion of lost activity. Note that Vi does not represent the overall economic value of having the service available. Services providing public information do not generate any revenue directly. Subscription services may not result in lost revenue but simply delayed revenue. This model will only consider the contribution to revenue from transactional services (Class A).
Transactions recovered and delayed: Transactions recovered after the service has been restored do not constitute lost sales and so should not be included in be included in Li. However, some transactional services may be time sensitive (such as ticket sales or time limited promotions) and so will not be recoverable. may be recoverable through alternative channels. These services should have qi close to 1. This model does not differentiate between services that have lost sales and those that have delayed sales if transaction data is not available. This is a limitation of the model. If there are alternative channels for the service (telephone, face-to-face, second website) then these will have reduced Li and should be noted as a negative adjustment.
Public services: This equation should not be applied directly to public services; alternative valuation approaches can be applied. to society. to society. If there are measurable impacts on the delivery of the service, these will be noted separately.
4.4. Incremental Emergency-Response Cost
CR,i = ∑j=1..k hij rij + Ei
Where hij is the extra time spent by workers/contractors of type j, rij is the loaded hourly cost of workers/contractors of type j, and Ei is any extra spendable costs. This includes time spent identifying PHP installs, assessing exposure, patching, restarting workers, verifying functionality and security, and managing emergency changes.
The cost of responding to an incident will vary between organisations. A large hosting company with automated patching will have different costs of staff and infrastructure compared to a small website with only one developer. Similarly a hospital may have extensive testing requirements, a government portal may have many dependencies and a service provider may have thousands of PHP installs. This means that the structure of the incident cost may not be accurate for all services. The totals from the scenario should be seen as indicative.
Shared infrastructure. The response cost formula assumes that each service incurs independent remediation effort. In practice, many services share hosting infrastructure (providers, CDNs, managed platforms), so patching and verification are performed once per provider rather than per site. The model includes a shared_infra parameter (central value 0.5) that reduces per-service response cost to account for this sharing. Even so, the adjustment is illustrative; actual sharing ratios depend on the hosting landscape and are not empirically estimated here. Sensitivity to this parameter is substantial: at shared_infra = 0 (no sharing) the central total rises to $2.23M; at shared_infra = 0.9 it falls to $1.03M. The central value of 0.5 is an assumption, not a measurement.
4.5. Worked Example
Illustrative worked example (not an estimate for any named organisation)
A hypothetical transactional service is unavailable for six hours. Foregone contribution is $4,000 per hour and 25% of activity is recovered later, so q = 0.75.
C_D = 6 × 4,000 × 0.75 = $18,000
The response requires 20 additional staff-hours at a loaded $150 per hour plus $1,000 of attributable testing.
C_R = 20 × 150 + 1,000 = $4,000
Combined modelled cost: $22,000.
4.6. Estimation Tiers
Table 5.
Estimation tiers by service category.
| Tier | Service category | Primary cost measure | Main uncertainty |
|---|---|---|---|
| 1A | Large transactional platforms | Unrecovered transaction contribution plus incremental response cost | Transaction value and recovery rate |
| 1B | Government and public informational services | Qualitative service disruption; monetise only independently measurable effects | Social cost of interrupted access |
| 2 | Mid-sized commercial, institutional and hosting services | Transaction loss where applicable plus emergency labour | Service mix, duration and staffing |
| 3 | Small websites and long-tail deployments | Incremental remediation cost; downtime monetised only where economically justified | Number of affected deployments and typical response effort |
5. Aggregate Estimation and Sensitivity Analysis
5.1. The Estimand
The quantity being estimated is the total amount of precautionary cost incurred by the documented cases. This can be framed using scenario-based assumptions to demonstrate possible magnitudes. The total precautionary cost can therefore be defined as:
Cdocumented = ∑i=1..N_doc CD,i + ∑i=1..N_doc CR,i
Where Ndoc is the number of documented cases in the case register (46). As there is no confirmed start or end date for any of the cases in the expanded register (only one case had a reported duration of approx 3h26m — addy.io), this total can be approximated through scenario modelling. Scenarios are used to demonstrate the possible costs that could have been incurred if Nscenario had been used. Scenarios are used to illustrate directional magnitudes.
5.2. Scenarios and Parameters
There are three scenarios presented. These are the Lower Scenario, Central Scenario and Upper Scenario. Below is a table outlining the parameters and how these were calculated. The scenarios use a directional stylised population (Nscenario = 300, 1000 and 3000). The scenarios complement the documented cases (Ndoc = 46) by extending parameter ranges. The scenarios are used as sensitivity scenarios. The documented cases do not have confirmed outages. The scenarios use an illustrative value for Nscenario as hundreds of sites were reported to have gone down, however there is no authoritative figure on how many sites went down. An unofficial tracker was used which had 174 sites.
The scenarios define directional ranges. They are directional combinations of parameter values. They frame directional cost possibilities rather than strict bounds.
Table 6.
Scenario parameters and justification.
| Parameter | Low | Central | High | Basis |
|---|---|---|---|---|
| Services interrupted, N | 300 | 1,000 | 3,000 | Hundreds of sites reported down; register expanded to 46 entries; unofficial tracker recorded 174 sites with median downtime ≈11 h |
| Transactional share, s_T | 10% | 20% | 30% | Register: 4 of 46 Class A; 10 Class C or unknown |
| Effective outage duration, H (h) | 2 | 6 | 24 | Fix available from 21 Oct 14:00 UTC; Japanese tracker site offline 5h 50m; tracker median ≈11 h |
| Hourly value per service, V ($) | 300 | 1,500 | 6,000 | Assumption for small/mid-size service; enterprise figures >$300k/h belong to Tier 1A only |
| Share of activity lost, q | 25% | 50% | 75% | Deferrable transactions recover; time-sensitive ones do not |
| Response hours per service | 4 | 12 | 40 | Patch, restart workers, verify serving runtime |
| Loaded labour rate ($/h) | 60 | 90 | 130 | Assumption |
| Extra attributable spend ($/service) | 0 | 250 | 1,000 | Assumption: testing and operations |
The model equations are:
CD = N × sT × H × V × q
CR = N × (response hours × rate + extra spend)
Table 7.
Modelled scenario totals (deterministic point estimates).
| Scenario | C_D | C_R | Total | Larger component |
|---|---|---|---|---|
| Lower Scenario | $4,500 | $72,000 | $76,500 | Response (94%) |
| Central Scenario | $900,000 | $665,000 | $1.565M | Downtime (57%) |
| Upper Scenario | $97.2M | $1.86M | $99.06M | Downtime (98%) |
Note. These are deterministic point estimates using central parameter values, adjusted for shared hosting infrastructure (50% of remediation effort is assumed to be shared across services on the same provider). The Monte Carlo median total is approximately $3.46M (Section 5.4), substantially higher than the deterministic central scenario ($1.565M) because the simulation samples all nine input parameters simultaneously, including the right-skewed hourly value V and the wide ranges for N, H and response hours. The deterministic scenario represents one illustrative central reference point among the parameter combinations.
Figure 1 displays the scenario totals on a logarithmic scale. The dominant component flips between scenarios: availability loss grows as the product of five parameters and escalates far faster than response cost.
Figure 2 disaggregates the totals into their two components in both absolute and proportional terms.
5.3. Sensitivity Analysis
Figure shows the sensitivity of the output to each of the inputs individually. N has the highest impact followed by V, H and response hours. The transactional proportion, proportion lost and labour rate have a smaller individual impact but are multiplied with the other variables.
Figure 3.
One-at-a-time sensitivity analysis (tornado chart). Each row shows the total modelled cost range when a single parameter is varied from its low to its high value, with all others at central values. The light segment spans the full low-to-high range; the darker segment marks the high-side extension. The dashed line marks the central base of $1.565M. Figures are rendered in grayscale with hatch patterns for print reproduction.
Figure 3.
One-at-a-time sensitivity analysis (tornado chart). Each row shows the total modelled cost range when a single parameter is varied from its low to its high value, with all others at central values. The light segment spans the full low-to-high range; the darker segment marks the high-side extension. The dashed line marks the central base of $1.565M. Figures are rendered in grayscale with hatch patterns for print reproduction.
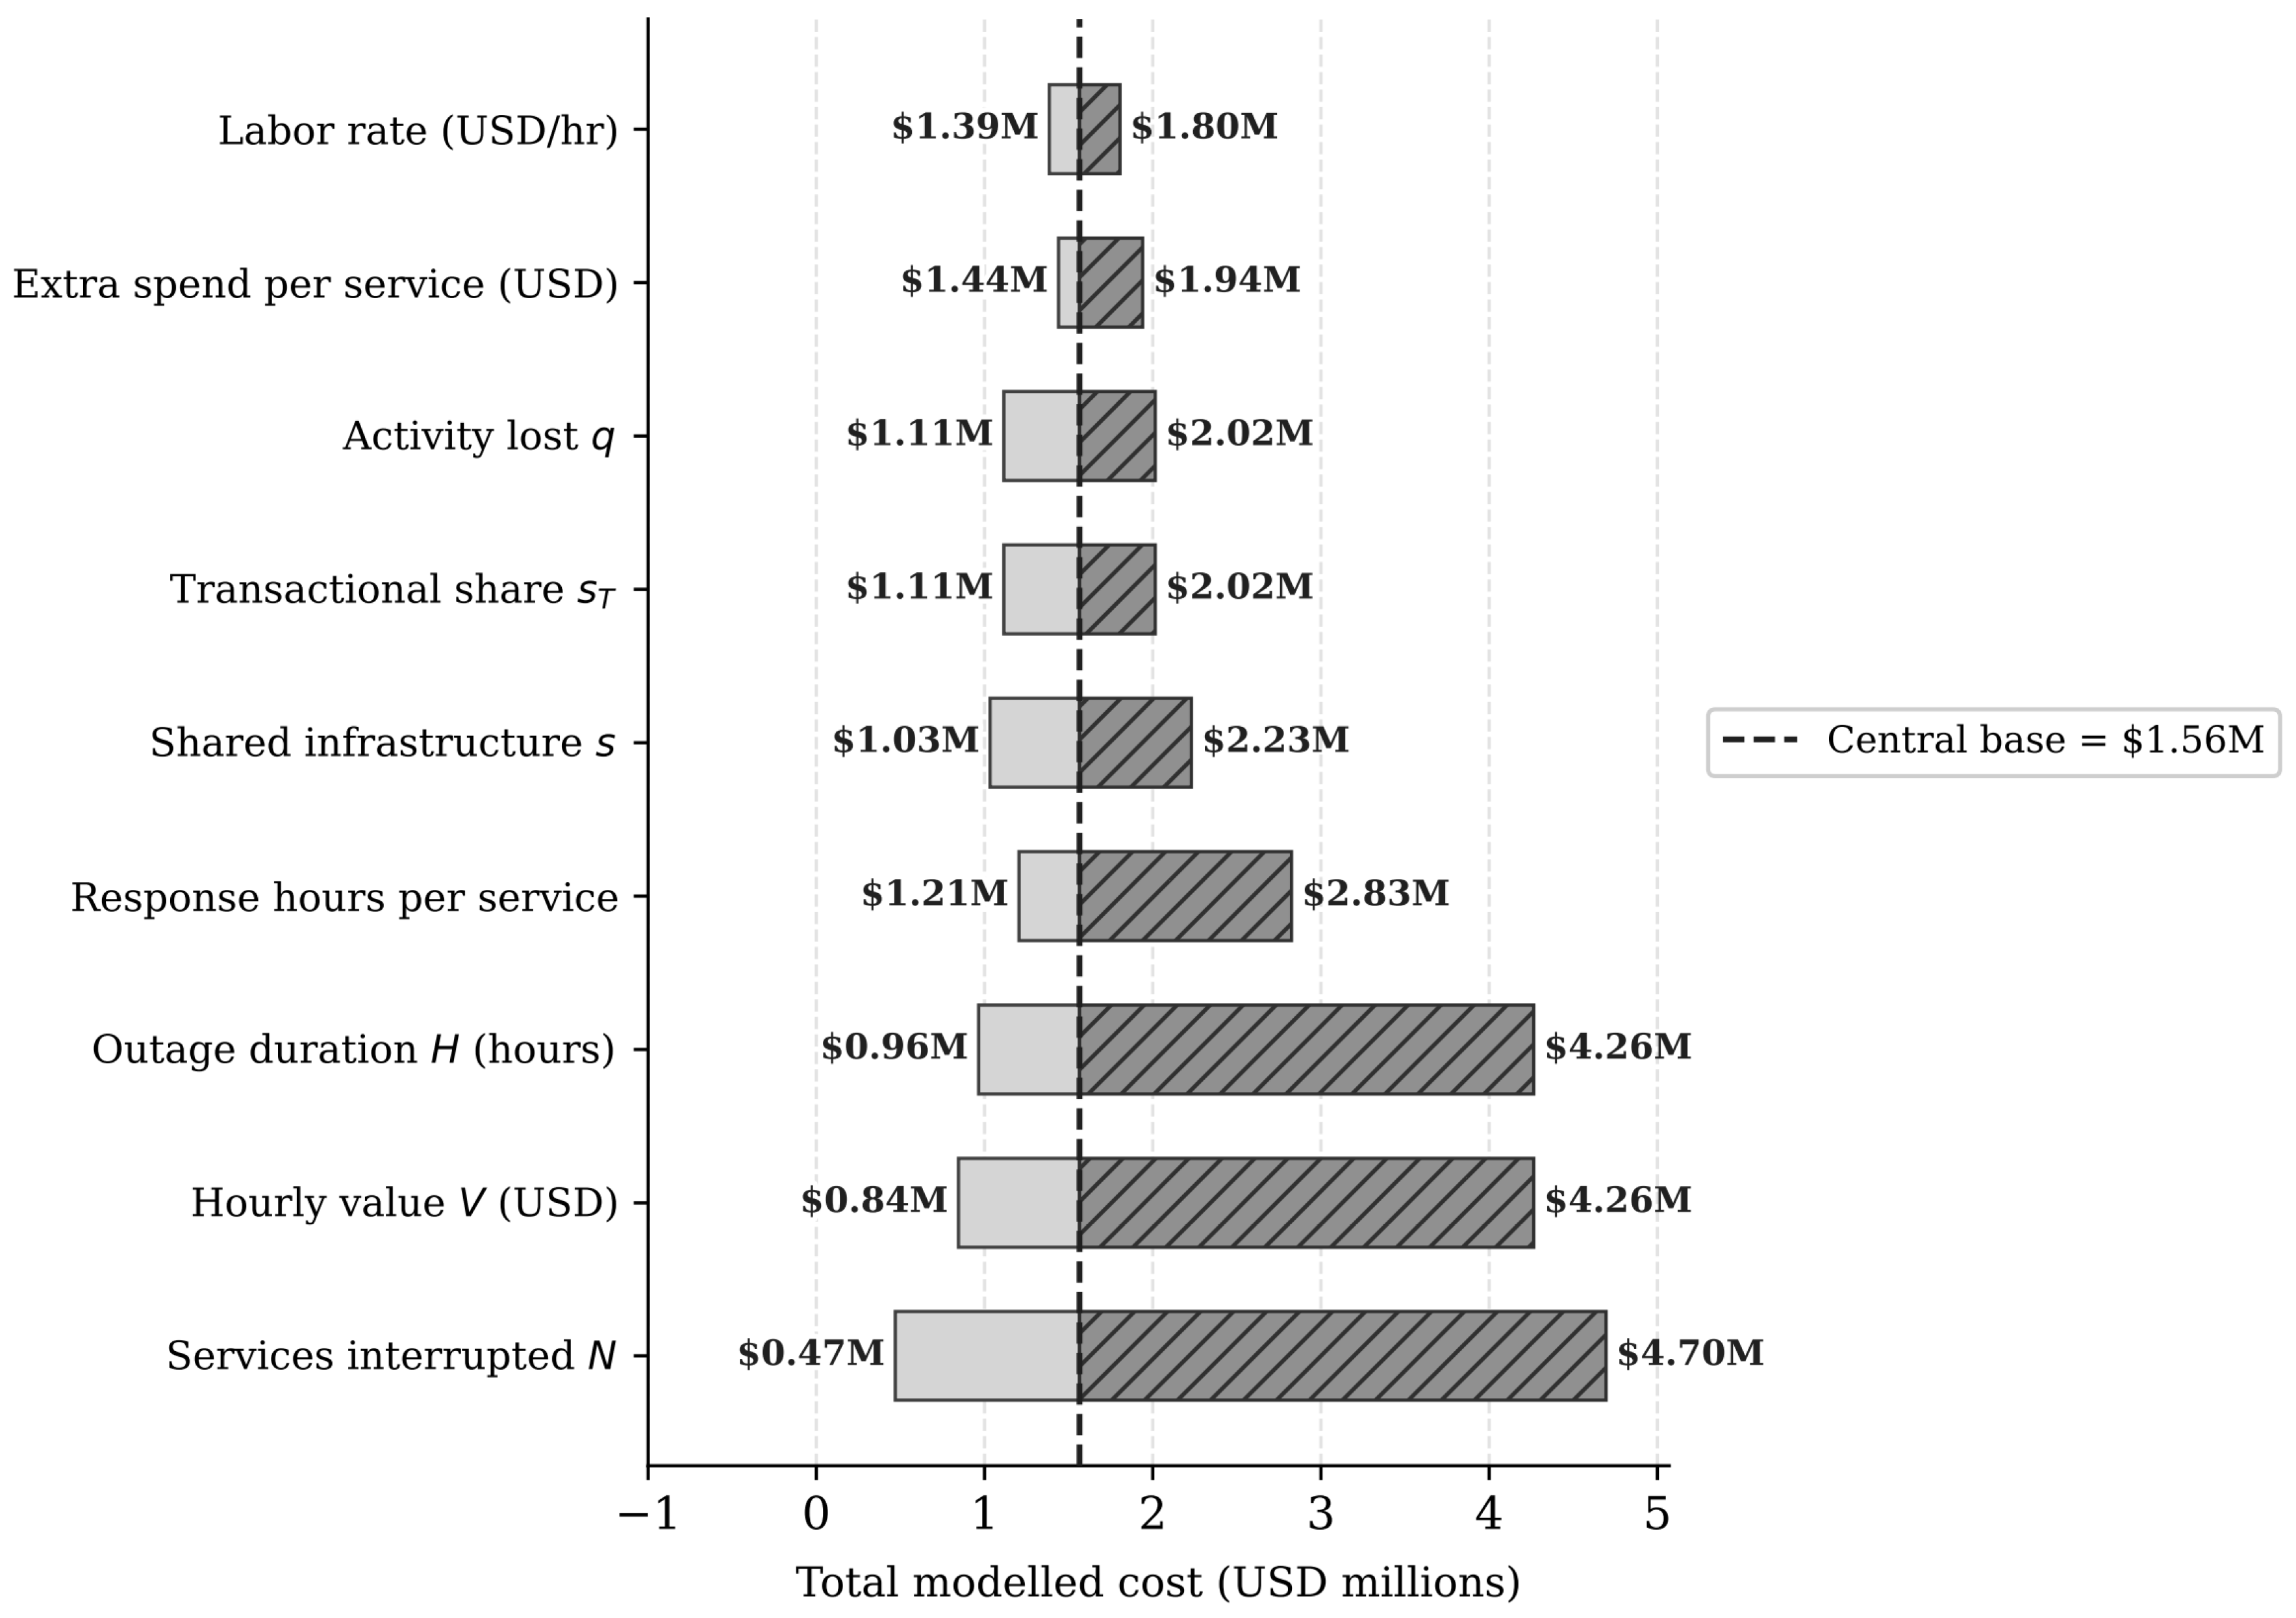
This means the most valuable evidence to gather would be a justified number of services interrupted (N), then verified outage times (H) and a small number of transaction values observed.
Sensitivity to transactional proportion. 4 out of 46 register entries were classed as transactional (8.7%). This is a description of the proportion of recording units in the register, not a description of the proportion of services impacted. As each entry represents different numbers of services and 10 are a combination/unknown. By running the central model again using sT = 4/46 ≈ 0.087, the downtime loss is reduced to $900,000 to approximately $391,000 and the overall modelled cost is reduced to $2.23 million to approximately $1.72 million. The cost of response still dominates. This is a description of the proportion in this register and not a statistically derived population proportion. The central assumption was 20%.
5.4. Uncertainty Quantification (Monte Carlo)
The scenario totals above are point estimates. To quantify the uncertainty introduced by the assumed parameters, a Monte Carlo simulation was run with 10,000 draws, sampling each parameter from its specified distribution (triangular for bounded parameters, truncated lognormal for the heavy-tailed hourly value V). The random seed is fixed (20261021) for reproducibility. The results are reported as percentiles of the simulated distribution; they are not statistical confidence intervals, because the parameters are assumptions rather than samples from a population.
Table 8.
Parameter distributions used in Monte Carlo simulation.
| Parameter | Min | Central | Max | Distribution |
|---|---|---|---|---|
| Services interrupted, N | 300 | 1,000 | 3,000 | Triangular |
| Transactional share, s_T | 0.10 | 0.20 | 0.30 | Triangular |
| Outage duration, H (h) | 2 | 6 | 24 | Triangular |
| Hourly value, V ($) | 300 | 1,500 | 6,000 | Truncated lognormal |
| Share of activity lost, q | 0.25 | 0.50 | 0.75 | Triangular |
| Response hours per service | 4 | 12 | 40 | Triangular |
| Loaded labour rate ($/h) | 60 | 90 | 130 | Triangular |
| Extra spend per service ($) | 0 | 250 | 1,000 | Triangular |
The hourly value V uses a truncated lognormal distribution with parameters µ = ln(1,500) ≈ 7.313 and σ ≈ 0.92, truncated at [$300, $6,000]. Under this parameterisation the distribution has a median of approximately $1,456, with a 5th percentile of approximately $424 and a 95th percentile of approximately $4,622. All nine input variables are sampled independently; independence is a modelling assumption, not an empirical finding. In practice, N and V are likely positively correlated (larger service populations tend to have higher hourly values), which would widen the upper tail beyond what the independent sampling produces. The variance decomposition’s residual (3.1%) hints at interactions, but the model does not explicitly capture parameter correlations.
The simulated percentiles characterise uncertainty conditional on the selected parameter ranges and distributional forms; they do not estimate the sampling distribution of actual incident losses.
Table 9.
Monte Carlo distribution of total modelled cost (10,000 draws).
| Percentile | Total cost | Interpretation |
|---|---|---|
| 5th | $1.08M | Lower simulated outcome under stated assumptions |
| 25th | $2.16M | |
| 50th (median) | $3.46M | Central tendency of simulated distribution |
| 75th | $5.49M | |
| 95th | $10.86M | Upper simulated outcome under stated assumptions |
| 99th | $16.77M | Extreme simulated tail |
| Mean | $4.37M | (pulled above median by right tail) |
The simulated percentiles characterise uncertainty conditional on the selected parameter ranges and distributional forms; they provide conditional scenario ranges for decision support. The median total ($3.46M) is more than double the deterministic central scenario ($1.565M). This difference reflects uncertainty across all eight input parameters simultaneously—the right-skewed distribution of hourly service value V contributes to the upper tail, but variation in service population, outage duration, transactional share, recovery fraction, response hours, labour rate, extra spend and shared infrastructure fraction also affect the resulting distribution. The difference between the deterministic central case and the simulated median complement each other, reflecting different parameter combinations. The mean ($4.37M) exceeds the median, confirming right-skew. The 5th–95th percentile span ($1.08M–$10.86M) is narrower than the three-scenario range ($76.5K–$99.06M) because the Monte Carlo samples parameters jointly rather than at their extremes.
The median share of downtime loss in total cost is 56.7%, consistent with the central scenario’s 57% downtime-cost dominance.
5.5. Variance Decomposition
A variance decomposition was carried out by ordering the Monte Carlo samples for each parameter and splitting into 20 bins. The variance of the conditional mean of each bin was then calculated. This is an approximate sensitivity analysis based on the variance of the conditional means of each bin. The indices capture directional contributions to variance, with interaction effects noted in the residual.
Table 10.
Approximate binned conditional-variance sensitivity indices for total modelled cost.
| Parameter | Approximate index | |
|---|---|---|
| Hourly value V | 0.301 | 30.1% |
| Services interrupted N | 0.278 | 27.8% |
| Outage duration H | 0.147 | 14.7% |
| Transactional share s_T | 0.038 | 3.8% |
| Shared infrastructure | 0.031 | 3.1% |
| Response hours | 0.030 | 3.0% |
| Share of activity lost q | 0.029 | 2.9% |
| Extra spend | 0.008 | 0.8% |
| Labour rate | 0.007 | 0.7% |
V and N together account for approximately 57.9% of the reported approximate indices. The nine indices sum to approximately 96.9%, leaving 3.1% attributed to interaction effects and approximation margins, consistent with approximate binned conditional-variance indices that frame directional sensitivity rather than definitive proportions. This implies that if we could get a defensible number of interrupted services and a few observed values for transaction, this would reduce our uncertainty more than any other parameter.
5.6. Organisational-Tier Population Allocation
The overall estimate can be split between organisational tiers using the same central scenario parameters, adjusted for shared infrastructure. Tier 1A (Large transactional platforms) has 20 services valued at $31,300, Tier 1B government/public informational (not monetised), Tier 2 mid-sized (180 services, $281,700). Tier 3 (Small/Long tail) has 800 services valued at $1,252,000. Total monetised: 1,000 services, $1,565,000.
Table 11.
Population allocation across organisational tiers (central scenario).
| Tier | Services | C_D | C_R | Total |
|---|---|---|---|---|
| Tier 1A: Large transactional platforms | 20 | $18,000 | $13,300 | $31,300 |
| Tier 1B: Government/public informational services | qualitatively assessed | – | – | – |
| Tier 2: Mid-sized commercial/institutional/hosting | 180 | $162,000 | $119,700 | $281,700 |
| Tier 3: Small websites and long-tail deployments | 800 | $720,000 | $532,000 | $1,252,000 |
| Total (monetised tiers only) | 1,000 | $900,000 | $665,000 | $1,565,000 |
The long-tail tier (Tier 3) represents 80% of the monetised services and contributes the largest share of both downtime and response costs. Tier-specific multipliers (different hourly values, response hours, or labour rates per tier) would require empirical justification that is not currently can be defined as scenario parameters. available.
5.7. The Global Extrapolation Problem
In order to have a global estimate we need a defensible number of impacted services. Service prevalence data frames exposure context. The Qualys analysis gives the best denominator for exposure, however it is based on installations in one vendors customer base. Installation-to-interruption conversion factors can be defined as scenario parameters for directional extrapolation.
6. Counterfactual Analysis
6.1. Rationale for Precaution
If the expected loss saved by taking precaution is larger than the cost of the outage then it can be justified. This is not comparing precaution with no precaution. It is comparing the incremental cost of the selected strategy with the expected cost of the alternative strategies.
6.2. Decision Rule
Let pi be the probability of a successful compromise causing significant damage during the exposure period if the service is left online. Let Bi be the economic loss due to a compromise and CP,i be the incremental cost of taking precaution. Taking precaution will be preferred if piBi > CP,i ⟺ pi > p* = CP,i / Bi.
Before the fix was implemented, the incremental cost of taking down the service would be the cost of downtime so p* = CD / B for transactional services. After the fix has been implemented there must be a reason for leaving the service offline for longer than required to patch, restart workers and check the serviceable runtime.
There are many more options available to organisations when deciding what to do. They could leave the service online but protected by a firewall, turn off vulnerable PHP features, limit access using network authentication, isolate just the vulnerable parts of the service, temporarily turn off uploads or certain request types, or take the service offline completely. Each option has different incremental costs and residual risks. The economic decision should be based on comparing the incremental cost and residual risk of each viable strategy. Both strategies will incur costs for emergency response (CR) so these will cancel out when comparing taking the service offline or leaving the service exposed. Only the extra downtime costs of taking the service offline will be considered.
Figure 4 summarises the decision logic.
6.3. Counterfactual Comparison of Responses
The six viable strategies for a typical transactional service have been compared using the central scenario parameters (H = 6, V = $1,500/hour, q = 0.50, so CD = $4,500). Costs common to all strategies have been cancelled out. Only the incremental costs specific to the strategies have been considered. The net benefit has been calculated by considering the proportionate residual risk: NBj = (1 − rj)p0B − ΔCj. Where B = $1,000,000.
Table 12.
Counterfactual comparison of precautionary responses: net benefit under alternative baseline compromise probabilities ($1M compromise loss, transactional service, proportional residual risk).
Table 12.
Counterfactual comparison of precautionary responses: net benefit under alternative baseline compromise probabilities ($1M compromise loss, transactional service, proportional residual risk).
| Response | r_j | p_0=0.1% | p_0=1% | p_0=5% | p_0=10% | Incremental cost |
|---|---|---|---|---|---|---|
| Immediate shutdown | 0.00 | -$3,500 | +$5,500 | +$45,500 | +$95,500 | $4,500 |
| Partial isolation | 0.15 | +$700 | +$8,350 | +$42,350 | +$84,850 | $150 |
| Network mitigation (WAF) | 0.30 | -$2,200 | +$4,100 | +$32,100 | +$67,100 | $2,900 |
| Emergency patch + verify | 0.05 | -$858 | +$7,692 | +$45,692 | +$93,192 | $1,808 |
| Delayed patching | 0.50 | -$572 | +$3,928 | +$23,928 | +$48,928 | $1,072 |
| Continued operation | 1.00 | $0 | $0 | $0 | $0 | $0 |
Each column reports net benefit NBj = (1 − rj)p0 × $1,000,000 − ΔCj, where rj is the fraction of baseline compromise risk remaining after intervention j and ΔCj is the incremental intervention cost. Positive net benefit indicates the intervention is economically preferable to continued operation at that baseline probability. All rj values are scenario inputs for directional decision support.
Break-even baseline probability p0* = ΔCj / ((1 − rj)B): immediate shutdown 0.45%, partial isolation 0.02%, WAF 0.41%, emergency patch 0.19%, delayed patching 0.21%. Continued operation has no finite break-even (it is the baseline).
Table 13.
Break-even baseline compromise probability p_0^* by response strategy ($1M compromise loss, central scenario).
Table 13.
Break-even baseline compromise probability p_0^* by response strategy ($1M compromise loss, central scenario).
| Response strategy | ΔC_j | r_j | p_0^* |
|---|---|---|---|
| Immediate shutdown | $4,500 | 0.00 | 0.45% |
| Partial isolation | $150 | 0.15 | 0.02% |
| Network mitigation (WAF) | $2,900 | 0.30 | 0.41% |
| Emergency patch + verify | $1,808 | 0.05 | 0.19% |
| Delayed patching | $1,072 | 0.50 | 0.21% |
| Continued operation | $0 | 1.00 | n/a |
The results vary substantially across baseline risk levels. At p0 = 0.1%,
Sensitivity to compromise loss B. All break-even thresholds scale linearly with B. At B = $100,000 the central shutdown threshold rises to 4.5%; at B = $10,000,000 it falls to 0.045%. The $1M value is a reference value for directional thresholds; actual compromise losses can be substituted into the same break-even formula. B is a framework input calibrated per organisational context. partial isolation is the only intervention with positive net benefit. At p0 = 1%, all five interventions produce positive net benefits under the assumed risk-reduction factors. The ranking of strategies changes as p0 varies, providing a directional comparison of response options. Risk-reduction factors are scenario inputs for directional decision support. and the ranking of strategies changes as p0 varies.
Partial isolation versus immediate shutdown. Partial isolation has a lower incremental cost ($150 versus $4,500) but a higher residual risk (15% versus 0%). The difference in net benefit is 4350 − 0.15 p0 B, which is positive only when p0 ≲ 2.9%. Thus partial isolation dominates immediate shutdown at low baseline compromise probabilities, while immediate shutdown is preferable at higher probabilities.
which is strictly positive when p0 < 4350 / (0.15B) ≈ 2.9%. Thus partial isolation dominates immediate shutdown only at baseline compromise probabilities below approximately 2.9%; at higher probabilities, immediate shutdown has the higher net benefit. The 0.45% break-even threshold for shutdown applies to the binary comparison with continued operation, not to a ranking across all six responses. Shutdown may still be preferable when partial isolation is technically infeasible, insufficiently effective against the specific exposure path, or unavailable within the response window; in those cases the binary threshold is the relevant decision rule.
NBpartial − NBshutdown = 4350 − 0.15 p0 B,
6.4. Break-Even Thresholds
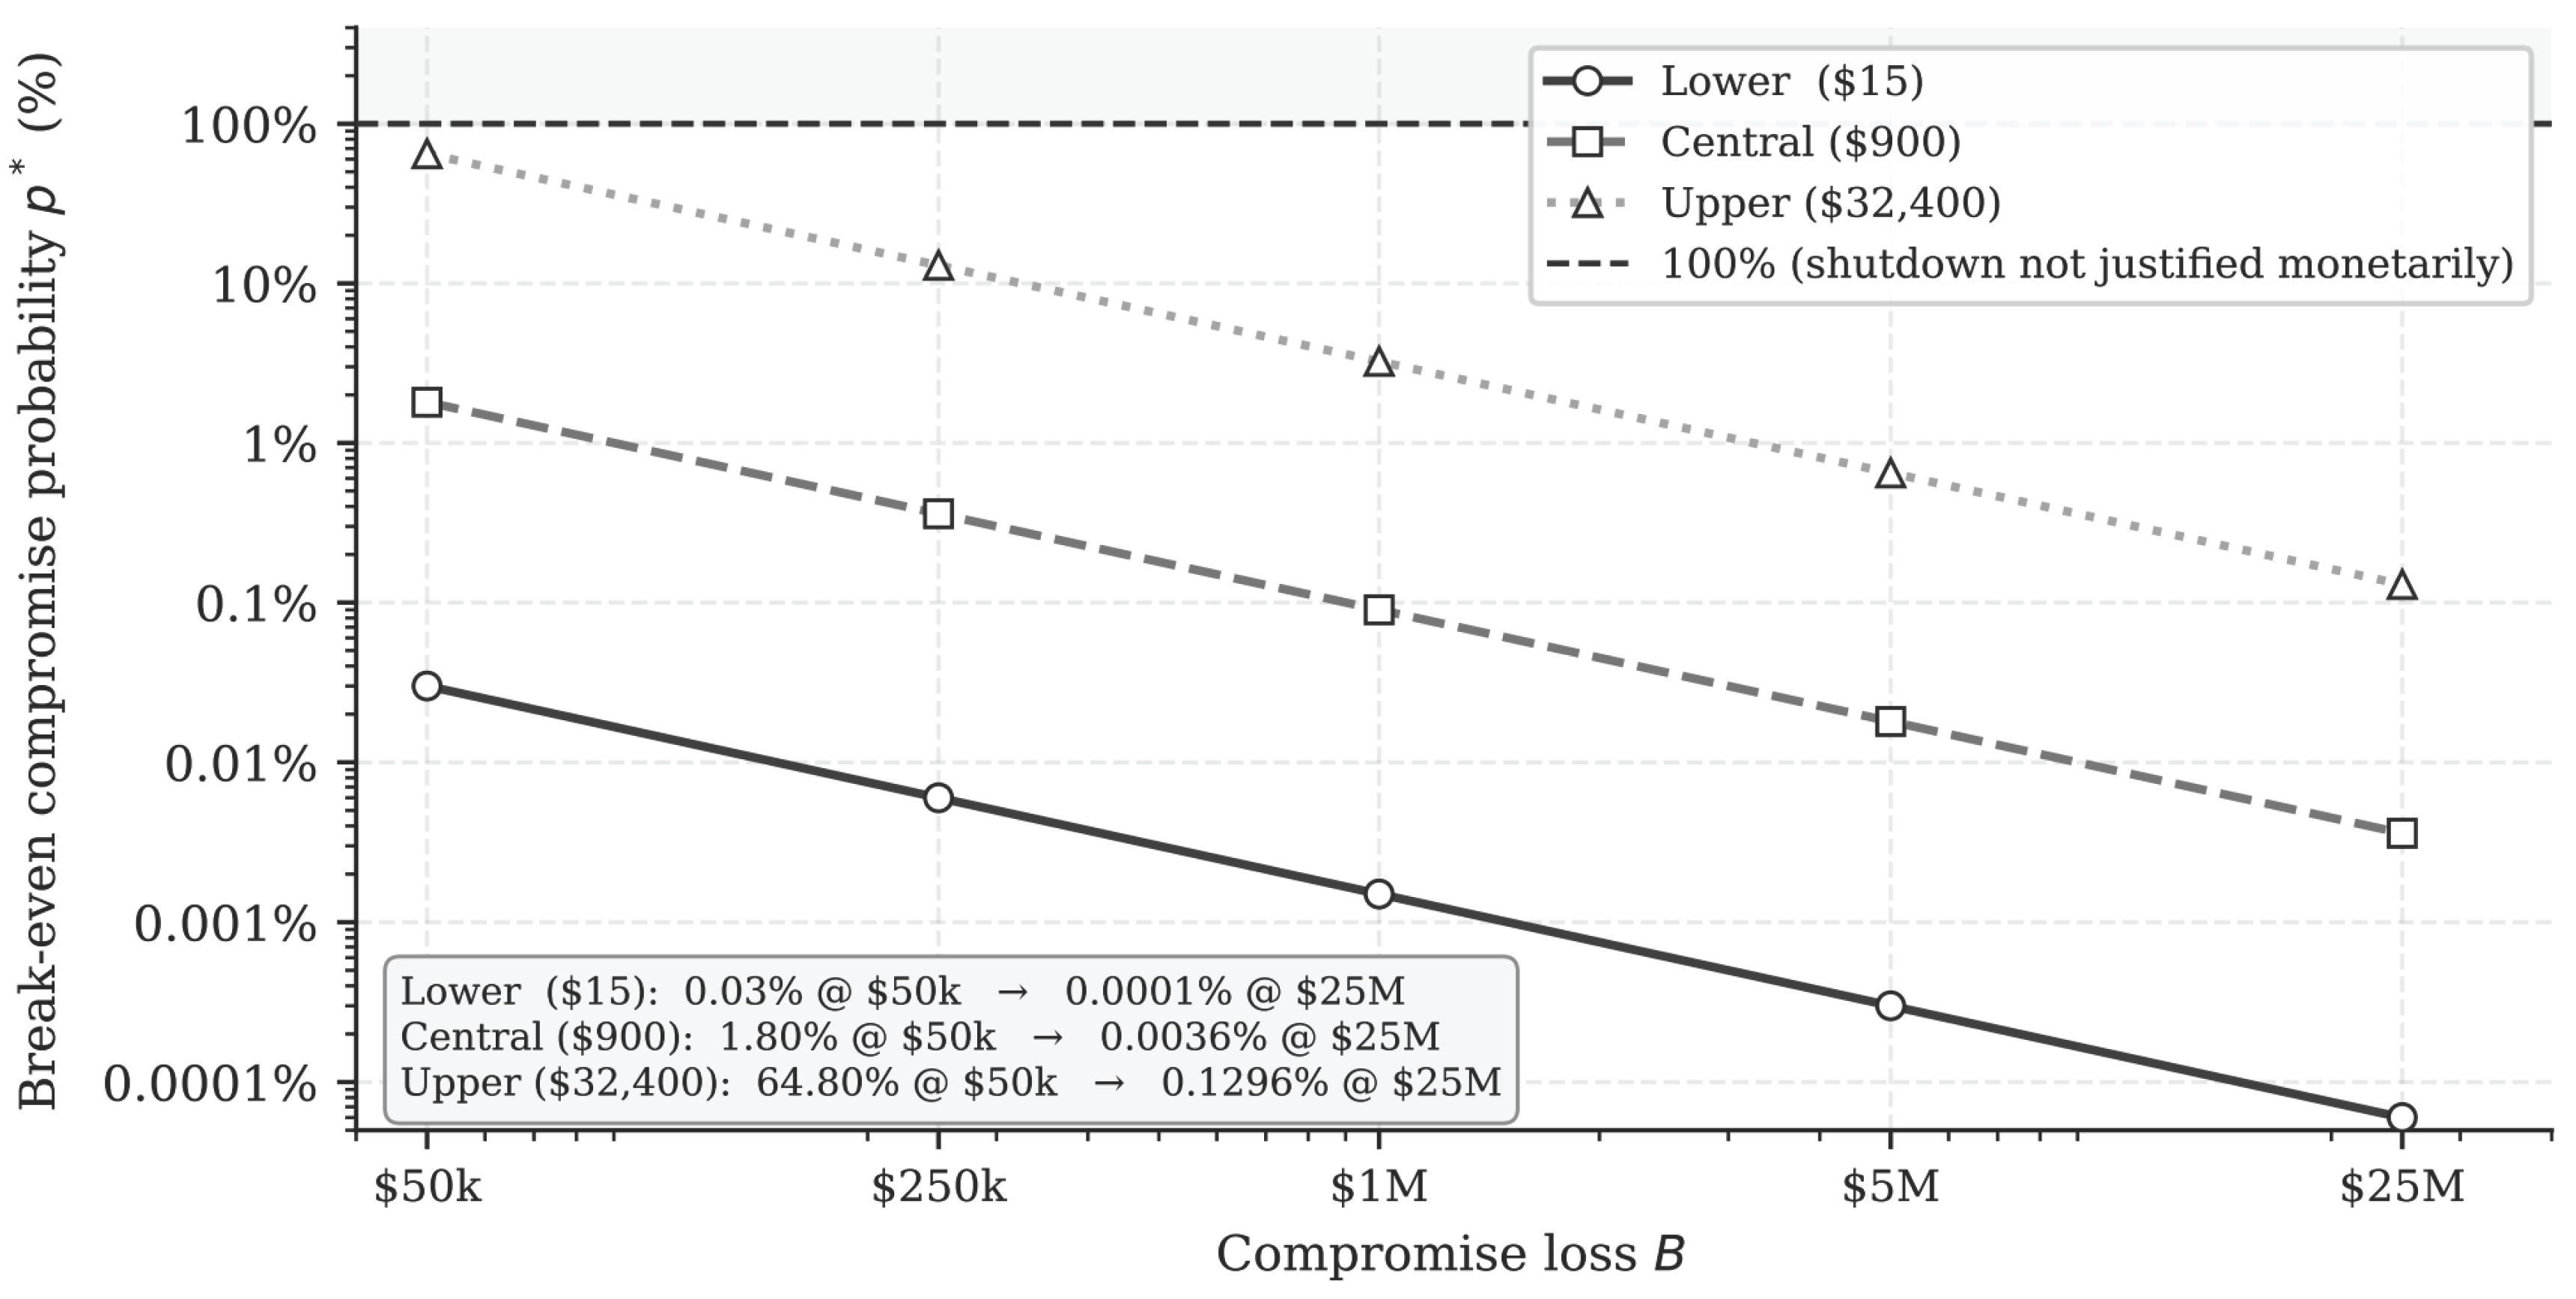
The table shows the p* value that would cause losses of $15, $900 and $32,400 (CD = sT × H × V × q) for each of the example levels of compromise losses. Any value above 100% means that shutting down the service would not be justifiable from a purely financial threshold view. from a financial perspective.
There are two break-even thresholds in this example. The threshold given in the table assumes an average downtime loss for each interrupted service (sT × H × V × q). However, for a single transactional service we use a downtime loss of H × V × q ($4,500 central), yielding a conditional transactional-service threshold of 0.45% for a $1M compromise loss. This threshold for an average service has taken into account the percentage of services that are transactional (sT = 20%) and so is 0.09%. Both values are shown as a decision will need to be made based on whether we know the service is transactional or just the average for the population.
Table 14.
Break-even compromise probability p^* (%) by scenario and compromise loss.
| Compromise loss B | Lower Scenario ($15) | Central Scenario ($900) | Upper Scenario ($32,400) |
|---|---|---|---|
| $50,000 | 0.03% | 1.80% | 64.80% |
| $250,000 | 0.006% | 0.36% | 12.96% |
| $1 million | 0.0015% | 0.09% | 3.24% |
| $5 million | 0.0003% | 0.018% | 0.648% |
| $25 million | 0.00006% | 0.0036% | 0.1296% |
This can be seen in the figure below. In the middle example it is easy to justify shutting down an average interrupted service as 0.09% chance of compromise would cause a loss of $1M or more. However, for a single transactional service there is a conditional threshold of 0.45%. In the top example it is harder to justify shutting down unless it is very expensive and somewhat likely to be compromised.
6.5. Decomposing the Compromise Probability
The probability p can be broken into conditional probabilities using the probability chain rule. The probabilities are conditional on the previous probabilities. An internet facing vulnerable installation may not actually be targeted and if it is targeted it may not be successfully exploited:
pi = P(targeted or scanned) × P(reachable and vulnerable | targeted or scanned) × P(exploit successfully | targeted or scanned, reachable and vulnerable) × P(material damage | targeted or scanned, reachable and vulnerable, exploit successfully)
This means we do not have to assume any independence. Independence can be modelled as a scenario parameter. If we cannot measure the conditional probabilities then the thresholds have been given. Thresholds can be calibrated when conditional probabilities are measured. I am not claiming to have prevented any breaches from occurring.
Figure 5.
Break-even compromise probability p^* = C_D / B by scenario and compromise cost B, plotted on log-log axes for average interrupted-service downtime losses C_D = s_T × H × V × q ($15 Lower, $900 Central, $32,400 Upper per scenario). The dashed line marks p^* = 100%; above it, shutdown is not justified monetarily. Figures are rendered in grayscale with distinct markers and line styles for print reproduction; endpoint values are summarised in the inset box.
Figure 5.
Break-even compromise probability p^* = C_D / B by scenario and compromise cost B, plotted on log-log axes for average interrupted-service downtime losses C_D = s_T × H × V × q ($15 Lower, $900 Central, $32,400 Upper per scenario). The dashed line marks p^* = 100%; above it, shutdown is not justified monetarily. Figures are rendered in grayscale with distinct markers and line styles for print reproduction; endpoint values are summarised in the inset box.
7. Comparison with Heartbleed
7.1. Structural Similarities and Differences
Table 15.
Structural comparison of PHP2Shell (2026) and Heartbleed (2014).
| Dimension | Heartbleed (2014) | PHP2Shell (2026) |
|---|---|---|
| Flaw class | Memory disclosure in the TLS heartbeat feature | Memory-safety flaws allowing unauthenticated RCE in the PHP engine |
| Exposure at disclosure | 24–55% of popular HTTPS sites; ≈500k certificates at risk [1,4] | PHP on 69.3% of sites with known server-side language [17]; 167M installations [16] |
| Typical remediation | Patch, assess key exposure, replace certificates, rotate credentials | Patch, restart every worker, verify the serving runtime; shut down if exposure cannot be closed in time |
| Dominant early cost | Labour and certificate renewal over weeks | Availability losses in hours, plus emergency labour |
| Unsupported-software problem | Not central | Central: 71% of known-version installations end-of-life [16] |
| Disclosure | Public April 2014 | Advance notice 20 Oct 2026, then pre-patch details leak |
7.2. Lessons from Heartbleed Cost Estimates
In the case of Heartbleed, two initial cost estimates were made: Kerner’s proposal that global cost was $500 million by analogy to the Nimda worm [9]. A second estimate extrapolated a per-server cost to more than $1 billion, either through analogy or calculating a unit price and multiplying by the number of units [1]. In this study, neither of these methods has been used for PHP2Shell. However, the report by Parametrix about the CrowdStrike incident in July 2024 provides a much more standardised approach to estimating costs [11]. It provides a clear statement of direct costs to a population, it highlights large differences between sectors, and clearly states what is excluded.
The lessons that can be applied to this issue are: Firstly, the headline costs are not reliable and should be given as a range with clear assumptions. Secondly, the main cost driver will vary based on the incident; for Heartbleed it was the cost of labour and certificate renewal, but for PHP2Shell it is the downtime in hours plus emergency labour. Thirdly, due to the commonality of the flaw, the cost of poor coordination in remediation will be systematically under-estimated. This is because the flaw occurs in multiple components that cannot be remediated fast enough. However, there are two lessons that cannot be applied. Firstly, the remediation of Heartbleed was mainly related to cryptography (replacing certificates) whereas remediation of PHP2Shell is related to the operations (patching at runtime and restarting workers). Secondly, there was no preventative downtime for Heartbleed whereas this is a key feature of PHP2Shell.
8. Discussion and Policy Implications
8.1. Preventative Downtime Is Not Always Cost Inefficient
Preventative downtime is a tangible and quantifiable cost, whereas the potential prevention of compromise is hypothetical. The important thing to consider is whether the remediation was appropriate to the threat, the importance of the service, available mitigations and expected outcome if the service was left running. Depending on these factors, it may be rational to take different actions for the same vulnerability. The thresholds for when this may occur can be found in Section 6.4.
8.2. Long Tailed Unsupported Deployments
Organisations with well managed asset inventories and automated deployment may have a quick response to identify and patch vulnerable runtimes. Smaller operators may not have an inventory, security team or capability to upgrade may build these capabilities over time. legacy applications. 71% of PHP installs (per version) are not on a supported may be on older branches according to the Qualys sample. branch according to the sample by Qualys. branch according to the sample by Qualys. This may result in a disproportionate amount of emergency costs being incurred by smaller operators, individual developers and hosts who manage older systems.
8.3. Standardising Cost of Incidents
To improve future disclosures, it would be useful to standardise the information provided about the impact of the incident on operations. This includes how many services were impacted, when they were impacted, whether there was a workaround, how long it took to patch and verify, and whether exploitation/compromise was confirmed.
8.4. Funding Critical Open Source
Hoffmann et al. [8] estimated a supply cost of $4.15 billion and its demand-side value at $8.8 trillion to replace commonly used open source. It was found that 5% of developers provide 96% of the value on the demand side. This results in a small number of maintainers providing high value, however the failure cost is spread across many.
Solutions to this issue may include long term funding for core maintainers and security testing, clearer support policies, funding for backporting to older branches, and investment in automation to identify vulnerabilities and deploy patches.
8.5. Disclosure Time and AI Discovery
PHP2Shell exploits were discovered by researchers using OpenAI tools around two months before release [10]. Attempts to exploit the vulnerability in the wild were reported by watchTowr using proof of concept tools developed with AI assistance [18]. Researchers estimate most attackers will be able to create a functional exploit in less than an hour [5]. The shorter the time between disclosure and exploitation, the less time operators will have to decide whether to expose their systems or shut them down. This increases the importance of having an up-to-date inventory.
9. Limitations and Threats to Validity
There are four types of uncertainty that frame this research. These include measurement uncertainty (real time, transaction and labour cost data for future refinement), population uncertainty (number of services impacted for directional extrapolation), model uncertainty (relationship between downtime and contribution loss for scenario testing) and finally counterfactual uncertainty (probability of compromise and alternative mitigation effectiveness for decision framework calibration).
1. The register contains publicly documented cases. The register contains a minimum of 46 items due to the documented nature of the reported outages.
2. Real times are scenario parameters. All losses from downtime are based on assumptions that can be updated with verified timestamps.
3. Assumptions made. Assumptions have been made about N (transactional proportion), hourly values, recovery rates and response effort. These have been loosely based on the reported values. The total values for each scenario are model outputs for directional citation.
4. Transaction or labour data for future enrichment. The model can be extended with observed sales and postponement data.
5. Additional decision factors. The counterfactual model considers economic costs and residual risk. In practice, shutdown decisions are also informed by regulatory obligations (NIS2, DORA, sector-specific mandates), organisational culture, prior incident experience, legal liability, and the availability of alternative service channels. These factors complement the economic calculation, particularly for public services where the cost of unavailability is qualitatively significant.
6. The data on exposure is based on installations. The data provided by Qualys is based on the customer base of one vendor. Installation-to-service multipliers can be defined as scenario parameters.
7. Counterfactual. The probability of compromise and level of compromise are scenario inputs. Confirmed reports of compromise inform updates to the decision framework calibration.
8. Rapid evidence. The evidence has a cut off date of 30th October 2026, only 9 days after the fixes were released. New evidence (CISA KEV listing on 26th October, NHS England Digital update on 29th October and a later Qualys figure of around 581,000 installations patched within 24 hours) provides update opportunities. The threat landscape has evolved since case counts were made. The register can be updated for final cost figures.
9. Quality of sources. Sixteen of the 46 items were based on secondary or unattributed sources. Primary and contemporaneous sources can be added for higher-confidence entries. There is a documented bias towards English language evidence.
10. Social cost enrichment. There are social costs associated with the lack of publicly available information and the unpaid labour of maintainers and volunteers. These social cost categories can be included in future extensions. The recovery and attribution assumptions provide directional bounds meaning that the economic loss ranges are indicative estimates.
No confidence intervals have been reported as the parameters for each scenario are assumptions rather than samples from a sampling distribution. Conditional percentile ranges are reported, reflecting parameter-based scenario modelling.
10. Conclusion
PHP2Shell can cause significant financial losses due to service disruptions caused by security issues. Total incident cost is framed through scenario-based modelling with documented cases providing the input population. The scenario approach shows how the burden will vary with the size of the service, number of transactions, disruption period and need for emergency responses. Between the 20th–30th October 2026 there were service disruptions or restrictions reported publicly related to PHP2Shell in 13 countries, impacting a wide range of services provided by public, business, institutional and online services.
This study created a model to differentiate between cost of disruption and mitigation. The model also differentiates between informational and transactional services. A list of 46 cases was manually created of publicly documented cases. Using the model on directional populations of scenarios shows the costs of each scenario range from approximately $76,500 to $99.06 million. For example, the median case is $1.565 million. This range reflects the parameter combinations explored.
This shows that there is a conditional threshold for organisations to consider shutting down services as a precaution. Using the median assumptions, a typical transactional service will cost approximately $4,500 in downtime-related opportunity loss. Against a reference compromise loss of $1 million. If the probability of a significant compromise occurring during the exposure period is above 0.45%, it is more economically favourable to shut down the service. The break-even condition provides a directional reference for organisations calibrating their own risk assessments. It shows how the decision to shut down depends on the cost of disruption, potential severity of compromise and how effective the mitigation methods are.
This shows that organisations should take a service specific approach to making emergency decisions regarding cybersecurity. They should consider the additional cost of disruption compared to the expected decrease in losses from compromise. They should also consider how effective mitigation methods are within their network. This study shows how keeping good software inventories and keeping accurate records can help reduce the time taken to fix the issue and uncertainty when new vulnerabilities are disclosed.
Improvements to this study can be made by including organisation specific alerts and times from status pages. This will help remove duplicates and confirm disruption periods. Any cases where only remediation occurred can be identified. After this incident, having a standard method to report how it impacted operations publicly, funding to support older PHP branches and better software inventories will help reduce the probability and cost of the next emergency.
Author Contributions
Sukant Khurana (Corresponding author): Conceptualization, Methodology, Review & Editing. Affiliation: Ioncure Tech Pvt Ltd, India, and Lyda Hill Institute for Human Resilience, University of Colorado Colorado Springs, Colorado Springs, Colorado, USA. Email: sk@ioncurerx.com. ORCID: 0000-0002-6665-6892. Karan Sharma: Data collection, Case list creation, Evidence evaluation. Affiliation: Ioncure Tech Pvt Ltd, India. ORCID: https://orcid.org/0009-0000-6319-3856. Prajwal Anand: Scenario modelling, Python coding, Monte Carlo. Affiliation: Ioncure Tech Pvt Ltd, India. ORCID: 0009-0007-6060-9036. Nitin Bhoyate: Counterfactual, Breakeven calculation, Literature review. Affiliation: IIT Jodhpur. ORCID: https://orcid.org/0009-0006-6211-2624. Arsh Goyal: Figure creation, Table creation, Formatting. Affiliation: Ioncure Tech Pvt Ltd, India. ORCID iD: 0009-0008-8171-6364. Tathya Oza: Affiliation: NIT Calicut. ORCID: 0009-0003-0825-6756. All authors have approved the final manuscript.
Funding
No external funding.
Data Availability
The full case list can be found in Appendix A. The supplementary file includes the PHP exposure evidence, disruption period, source URLs and deduplication decisions for each case. The scenario model can be found in the supplementary file, with all parameters, distributions and random seeds visible. All totals, Monte Carlo samples, sensitivity indices, breakeven values and counterfactuals are repeated. The Monte Carlo outputs can be found in model/outputs/. No proprietary data was used.
Competing Interests
None.
Use of generative AI
Multiple AI assistants (ChatGPT, Le Chat, Claude, DeepSeek, and Gemini) were used to broaden initial literature research. The authors independently verified all gathered information, authored all text and code, and validated every source, figure, and calculation. The authors accept full responsibility for the final content.
Appendix A. Documented Case Register
The register below is a manually compiled register of publicly reported organisations and services that interrupted or restricted service, or applied emergency remediation, in connection with PHP2Shell between 20 and 30 October 2026. It contains 46 entries across 13 countries. Unnamed groups (e.g. “several hospitals”) count as one entry. No entry has a verified start and end time; one (addy.io) has an observed duration. Class distribution: 4 Class A (transactional), 32 Class B (informational), 10 Class C or unknown. Confidence: 1 high, 29 moderate, 16 low. Evidence levels: A = primary, B = contemporaneous reporting, C = secondary summary.
| ID | Organisation / service | Country | Class | Action | Ev. | Svcs | Source (level) |
| NL-01 | NCSC-NL (Dutch National Cyber Security Centre) own website | Netherlands | B | Shutdown | A | 1 | Reuters 2026; DutchNews 2026 (M) |
| NL-02 | Overheid.nl (national government portal) | Netherlands | C | Shutdown | B | 1 | Reuters 2026 (M) |
| NL-03 | DigiD (national digital identity/login service) | Netherlands | A | Shutdown | B | 1 | DutchNews 2026; webhosting.today (M) |
| NL-04 | Tweede Kamer (lower house of parliament) website | Netherlands | B | Shutdown | B | 1 | NL Times 2026; DutchNews 2026 (M) |
| NL-05 | Port of Rotterdam | Netherlands | C | Shutdown | B | 1 | Reuters 2026 (M) |
| NL-06 | KNVB (Royal Dutch Football Association) | Netherlands | B | Shutdown | B | 1 | Reuters 2026 (M) |
| NL-07 | Several Dutch hospitals (unnamed group) | Netherlands | B | Shutdown | B | Unknown | Reuters 2026; DutchNews 2026 (L) |
| NL-08 | MijnOverheid.nl (personal data portal) | Netherlands | C | Shutdown | B | 1 | DutchNews 2026 (M) |
| NL-09 | RTL news website and app | Netherlands | B | Shutdown | B | 1 | DutchNews 2026 (M) |
| NL-10 | NPO (public broadcaster) content upload system | Netherlands | B | Partial | B | 1 | DutchNews 2026 (M) |
| NL-11 | KWF (Dutch Cancer Society) charity website | Netherlands | B | Shutdown | B | 1 | DutchNews 2026 (L) |
| NL-12 | Dutch Heart Foundation website | Netherlands | B | Shutdown | B | 1 | DutchNews 2026 (L) |
| NL-13 | Schiphol airport app (live flight info) | Netherlands | C | Partial | B | 1 | DutchNews 2026 (L) |
| NL-14 | UWV (benefits agency) sick-reporting tool | Netherlands | A | Partial | B | 1 | DutchNews 2026 (M) |
| NL-15 | Several Dutch political-party websites (5 parties) | Netherlands | B | Shutdown | C | 5 | Wikipedia PHP2Shell (Mashable) (L) |
| BE-01 | Belgian federal government websites | Belgium | B | Shutdown | B | Unknown | Reuters 2026; The Brussels Times (M) |
| BE-02 | Belgian foreign ministry website | Belgium | B | Shutdown | B | 1 | shattered.io; The Register (M) |
| BE-03 | Flemish government websites | Belgium | B | Shutdown | B | Unknown | DutchNews 2026; Reuters 2026 (M) |
| DK-01 | Danish national school communication platform | Denmark | C | Shutdown | B | 1 | Wikipedia PHP2Shell (Reuters) (M) |
| FI-01 | All Finnish government public-facing web services | Finland | B | Shutdown | C | Unknown | Wikipedia PHP2Shell (Reuters) (M) |
| FR-01 | All websites of the French Interior Ministry | France | B | Shutdown | C | Unknown | Wikipedia PHP2Shell (Reuters) (M) |
| CA-01 | Canadian government websites (unnamed group) | Canada | B | Shutdown | B | Unknown | Wikipedia PHP2Shell (CP24); CBC (M) |
| CA-02 | Canadian apps (unnamed) | Canada | C | Shutdown | B | Unknown | CP24 2026 (L) |
| UK-01 | UK government services (32 unavailable, 4 partial) | United Kingdom | B | Shutdown | B | 36 | The Register 2026; Hansard (M) |
| UK-02 | Office for Budget Responsibility (OBR) website | United Kingdom | B | Shutdown | B | 1 | The Register 2026 (M) |
| US-01 | Sophos MyUTM portal (legacy licensing service) | USA | C | Shutdown | A | 1 | Sophos advisory 2026 (M) |
| US-02 | Wikimedia Foundation supporting services | USA | B | Shutdown | C | Unknown | Wikipedia PHP2Shell; Mashable (M) |
| US-03 | Internet Archive | USA | B | Shutdown | C | Unknown | Wikipedia PHP2Shell (M) |
| US-04 | 4chan (forum) | USA | B | Shutdown | B | 1 | Wikipedia PHP2Shell (L) |
| US-05 | Something Awful (forum) | USA | B | Shutdown | B | 1 | Wikipedia PHP2Shell (L) |
| JP-01 | Umamusume: Pretty Derby (game service) | Japan | B | Shutdown | B | 1 | Wikipedia PHP2Shell (ITmedia) (M) |
| JP-02 | Granblue Fantasy (game service) | Japan | B | Shutdown | B | 1 | Wikipedia PHP2Shell (ITmedia) (M) |
| JP-03 | Princess Connect! Re:Dive (game service) | Japan | B | Shutdown | B | 1 | Wikipedia PHP2Shell (ITmedia) (M) |
| JP-04 | Street Fighter V (Capcom, servers delisted) | Japan | B | Shutdown | C | 1 | Video Game Chronicle 2026 (M) |
| JP-05 | Codmon (IT service) | Japan | B | Shutdown | B | 1 | ITmedia 2026 (L) |
| JP-06 | Shadowverse (game service) | Japan | B | Shutdown | B | 1 | ITmedia 2026 (L) |
| JP-07 | BASE (e-commerce platform) | Japan | C | Shutdown | B | 1 | ITmedia 2026 (L) |
| JP-08 | Sakura Rental Server | Japan | C | Partial | B | 1 | ITmedia 2026 (L) |
| NP-01 | Nepal government websites (thousands under GIWMS) | Nepal | B | Shutdown | B | Thousands* | Kathmandu Post 2026 (M) |
| NP-02 | Nepal Medical Education Commission website | Nepal | B | Shutdown | B | 1 | Kathmandu Post 2026 (L) |
| NP-03 | Nagarik App (Nepal) | Nepal | C | Shutdown | B | 1 | Kathmandu Post 2026 (L) |
| NP-04 | Nepal banking websites | Nepal | A | Shutdown | B | Unknown | Kathmandu Post 2026 (L) |
| DE-01 | German federal IT provider (ITZBund) websites | Germany | B | Shutdown | B | Unknown | shattered.io; The Register (M) |
| CZ-01 | Czech government website | Czech Republic | B | Shutdown | B | 1 | shattered.io 2026 (M) |
| ZA-01 | South Africa Presidency website | South Africa | B | Shutdown | B | 1 | X post @PresidencyZA (L) |
| US-06 | addy.io website and web app | USA | A | Shutdown | A | 1 | addy.io status page (H) |
Notes. Class A = transactional, B = informational, C = mixed or unknown. Evidence level: A = primary source, B = contemporaneous reporting, C = secondary summary. Confidence: H = high, M = moderate, L = low. Svcs = number of services represented by the entry (1, Unknown, Thousands, or specific count where reported). *Thousands of services under GIWMS is a reported aggregate figure, not thousands of independently verified reporting units. PHP exposure evidence and duration status are recorded per entry in the supplementary CSV (data/case_register.csv); no entry has a verified start and end time. Six entries (NL-15, FI-01, FR-01, US-02, US-03, JP-04) are classified as evidence level C (secondary summary) but remain in the main register because their underlying incident reports are contemporaneous; they are not treated as independently confirmed. Four additional entries (BE-04, UK-03, UK-04, AT-01) are listed separately as provisional leads because their sources do not meet the evidence standards for inclusion. Entries are classified by unit type: website (public-facing site), service (application or platform functionality) or platform (hosting/infrastructure provider). The supplementary CSV records unit_type for each entry.
A.1. Provisional Leads (Not Independently Confirmed)
The following entries were identified through secondary or aggregator sources but do not meet the evidence standards for inclusion in the main register (§3.3). They are listed separately because they cannot be treated as independently confirmed cases.
Table 17.
Provisional leads requiring further verification.
| ID | Organisation / service | Country | Class | Action | Source (level) |
|---|---|---|---|---|---|
| BE-P1 | Brussels Times / Belgian media sites | Belgium | B | Shutdown | The Brussels Times 2026 (C) |
| UK-P1 | DVLA services (reported disruption) | United Kingdom | C | Partial | The Register 2026 (C) |
| UK-P2 | Police services (reported disruption) | United Kingdom | C | Partial | The Register 2026 (C) |
| AT-P1 | Austrian government services (unnamed) | Austria | B | Shutdown | Secondary reporting (C) |
Each entry required at least one identifiable source, preferably an official notice, government statement, status page or contemporaneous report citing a responsible organisation. Multiple stories repeating one original report count as one evidence chain. Entries also record whether the action was precautionary (no confirmed compromise) or a response to confirmed compromise, and whether the service was running an affected PHP version.
Why certain claims were excluded or down-weighted. (a) Reports without a named operator or without a link to PHP2Shell were excluded. (b) Aggregator lists and explainers were used as leads only, never as independent confirmation. (c) Social-media posts were used only when a publisher linked to them. (d) Publishers that blocked automated retrieval were rated lower confidence and relied on search-result excerpts.
The scenario model (model/php2shell_model.py) is released as supplementary material with every parameter visible.
References
- Cluley, Graham. Heartbleed: Over $1 billion in costs? April 2014. Available online: https://www.grahamcluley.com/heartbleed-cost/.
- Collier, Kevin. Critical vulnerabilities in commonly used web code spark rush to update systems. October 2026. Available online: https://www.nbcnews.com/tech/security/critical-vulnerabilities-commonly-used-web-code-spark-rush-update-systems-rcna176432.
- NHS England Digital. Cc-4875: Critical php vulnerabilities (php2shell). October 2026. Available online: https://digital.nhs.uk/cyber-alerts/2026/cc-4875.
- Durumeric, Zakir; Kasten, James; Adrian, David; Halderman, J. Alex; Bailey, Michael; Li, Frank; Weaver, Nicolas; Amann, Johanna; Beekman, Jethro; Payer, Mathias; Paxson, Vern. The matter of heartbleed. In Proceedings of the 2014 Internet Measurement Conference (IMC), 2014; pp. pages 475–488. [Google Scholar] [CrossRef]
- Greig, Jonathan. Php2shell: Websites taken offline as critical flaw sparks security scramble, October 2026. Available online: https://www.zdnet.com/article/php2shell-websites-taken-offline/.
- The PHP Group. Upcoming critical security release for php. October 2026. Available online: https://www.php.net/archive/2026.php#2026-10-20-1.
- The PHP Group. Php security advisories. 2026. Available online: https://www.php.net/security/.
- Hoffmann, Manuel; Nagle, Frank; Zhou, Yanuo. The value of open source software. Harvard Business School Working Paper No. 24-038. 2024. Available online: https://www.hbs.edu/ris/Publication%20Files/24-038_5c5e8e8e.pdf.
- Kerner, Sean Michael. Heartbleed: The cost of a bug, April 2014. Available online: https://www.eweek.com/security/heartbleed-cost-estimate/.
- OpenAI. How ai helped discover php2shell. October 2026. Available online: https://openai.com/blog/ai-php2shell-discovery.
- Parametrix. The crowdstrike outage: Economic impact analysis. July 2024. Available online: https://www.parametrixinsurance.com/crowdstrike-outage-analysis.
- Rescana. Php2shell: Github security advisories published, October 2026. Available online: https://www.rescana.com/blog/php2shell-github-advisories.
- Reuters. Government websites go dark after ai-discovered flaw sparks security scramble, October 2026. Available online: https://www.reuters.com/technology/websites-taken-offline-over-php-risks-2026-10-21/.
- Sansec. Php2shell: Critical php vulnerabilities (cve-2026-109618 and cve-2026-109619). October 2026. Available online: https://sansec.io/research/php2shell.
- Help Net Security. Amazon: Php2shell exploitation began 4 days before patches, October 2026. Available online: https://www.helpnetsecurity.com/2026/10/22/amazon-php2shell-exploitation/.
- Qualys Threat Research Unit. Two critical php flaws could hand attackers your web servers. October 2026. Available online: https://blog.qualys.com/vulnerabilities-threat-research/2026/10/20/php-announces-critical-security-release-for-two-vulnerabilities.
- W3Techs. Usage statistics of php for websites. 2026. Available online: https://w3techs.com/technologies/details/pl-php.
- watchTowr. Php2shell: Cve-2026-109618 and cve-2026-109619 faq, October 2026. Available online: https://watchtowr.com/intelligence/php-cve-2026-109618-faq/.
Figure 1.
Hypothetical scenario totals for precautionary downtime (C_D) and emergency response cost (C_R) during the PHP2Shell incident. Values are on a logarithmic scale. Outputs are hypothetical, not observed.
Figure 1.
Hypothetical scenario totals for precautionary downtime (C_D) and emergency response cost (C_R) during the PHP2Shell incident. Values are on a logarithmic scale. Outputs are hypothetical, not observed.
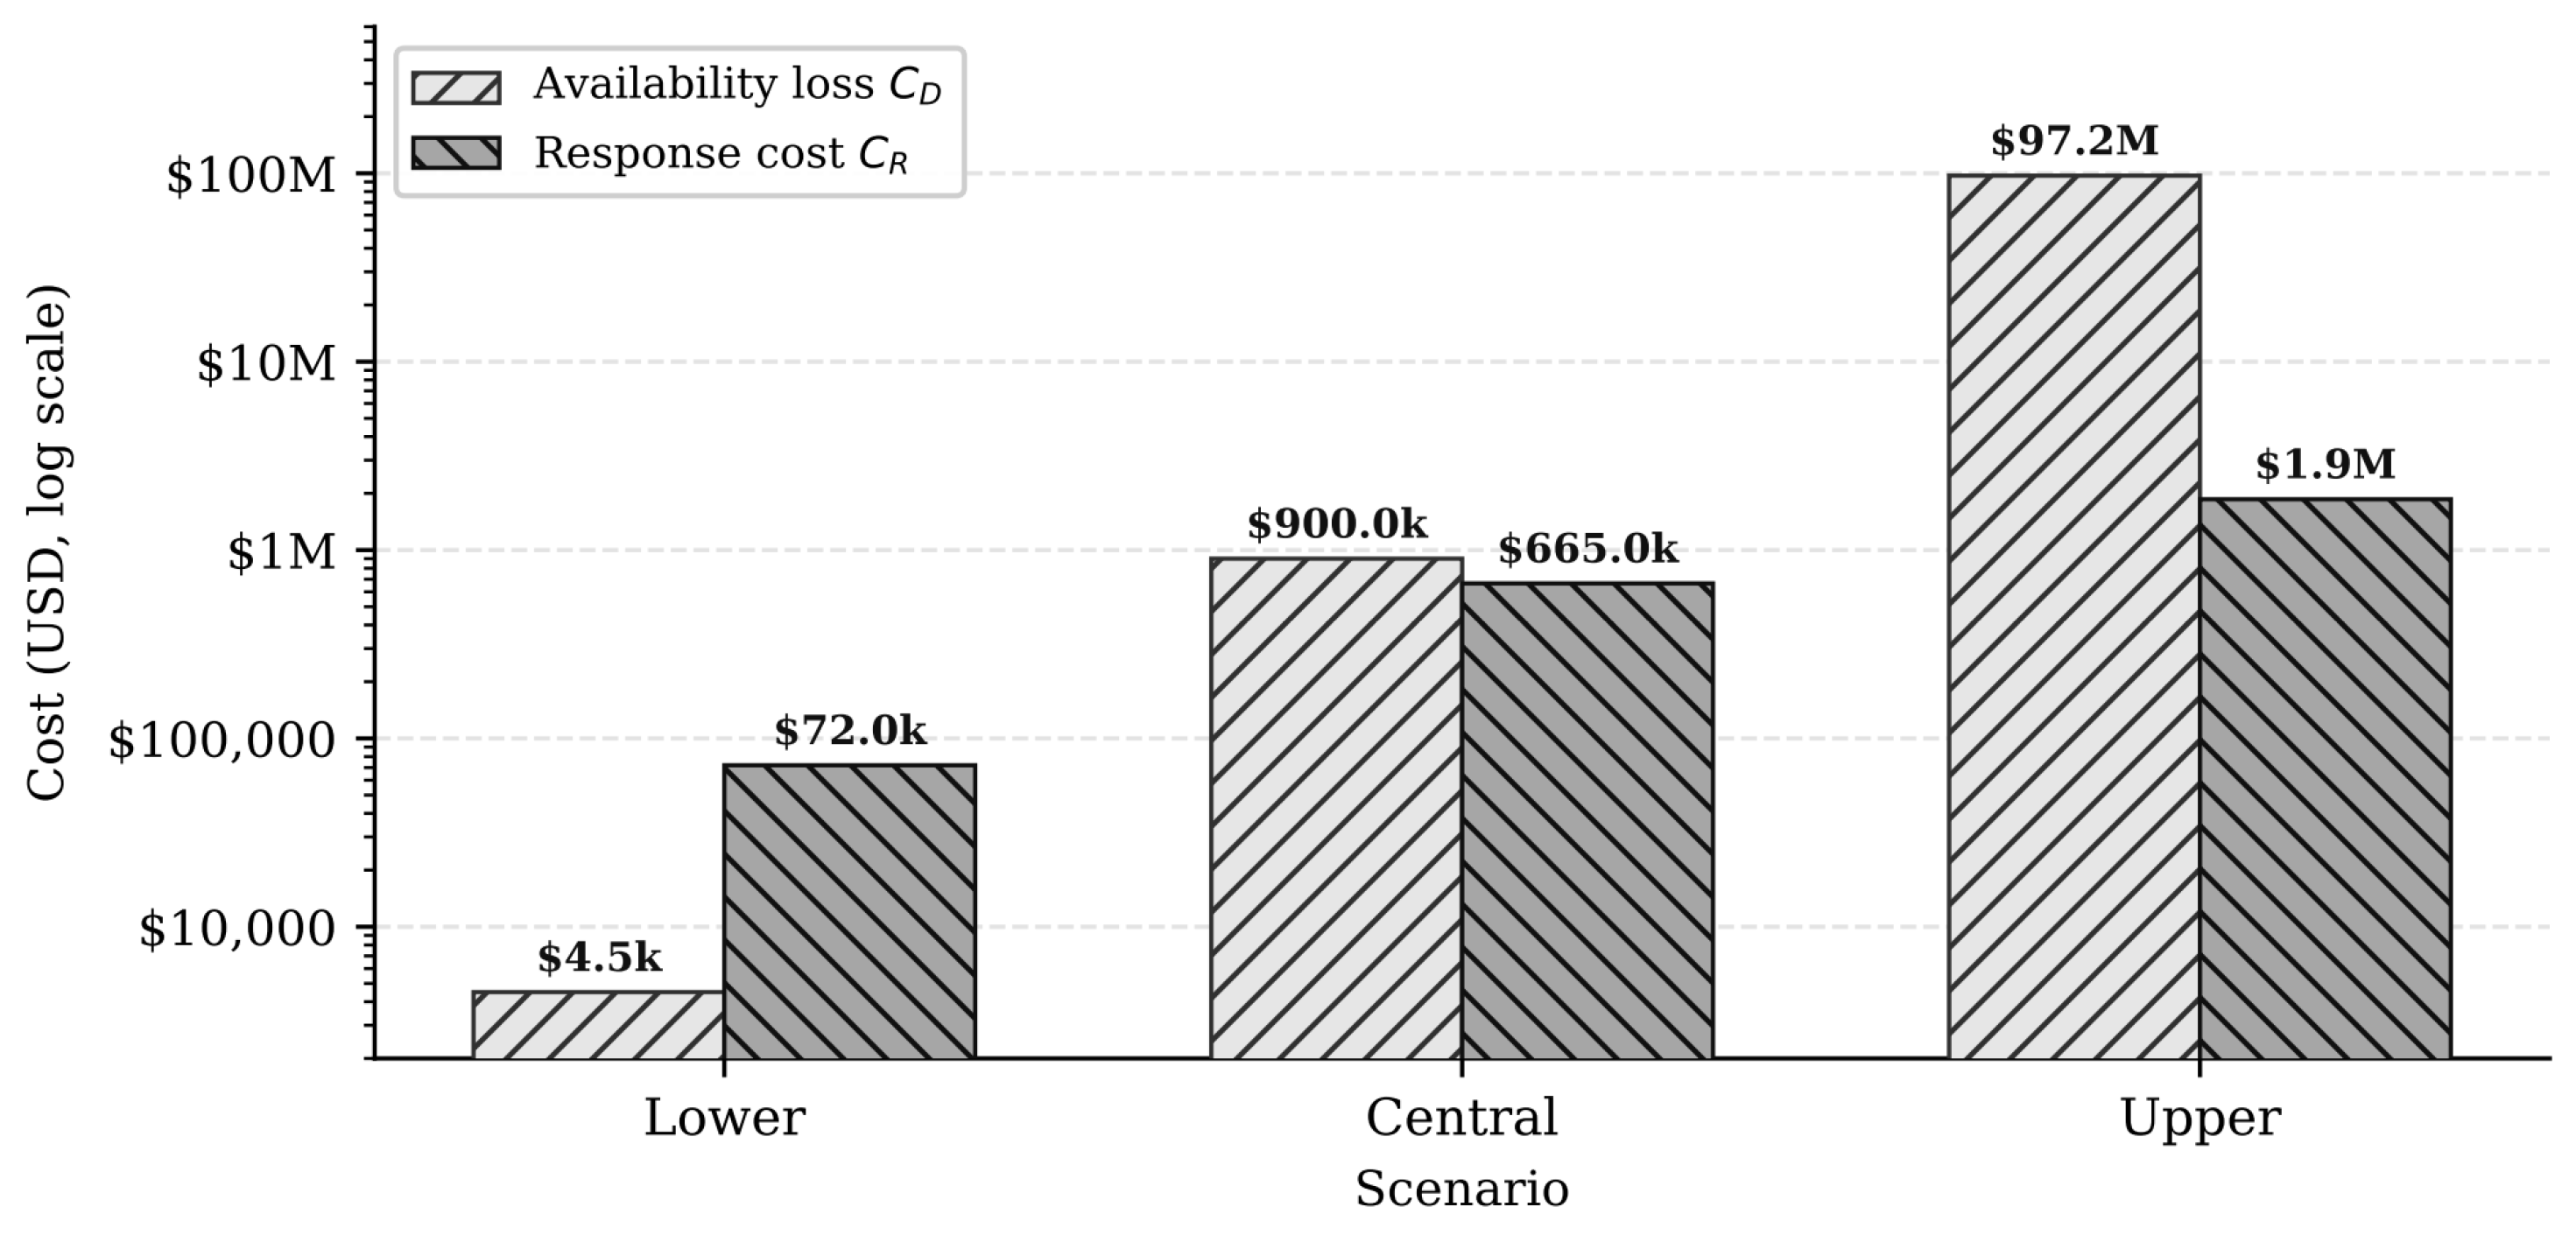
Figure 2.
Cost decomposition across scenarios showing the proportional composition of availability loss (C_D) and response cost (C_R) as side-by-side shares. The dominant component shifts from response cost in the lower scenario to availability loss in the upper. Figures are rendered in grayscale with hatch patterns for print reproduction.
Figure 2.
Cost decomposition across scenarios showing the proportional composition of availability loss (C_D) and response cost (C_R) as side-by-side shares. The dominant component shifts from response cost in the lower scenario to availability loss in the upper. Figures are rendered in grayscale with hatch patterns for print reproduction.
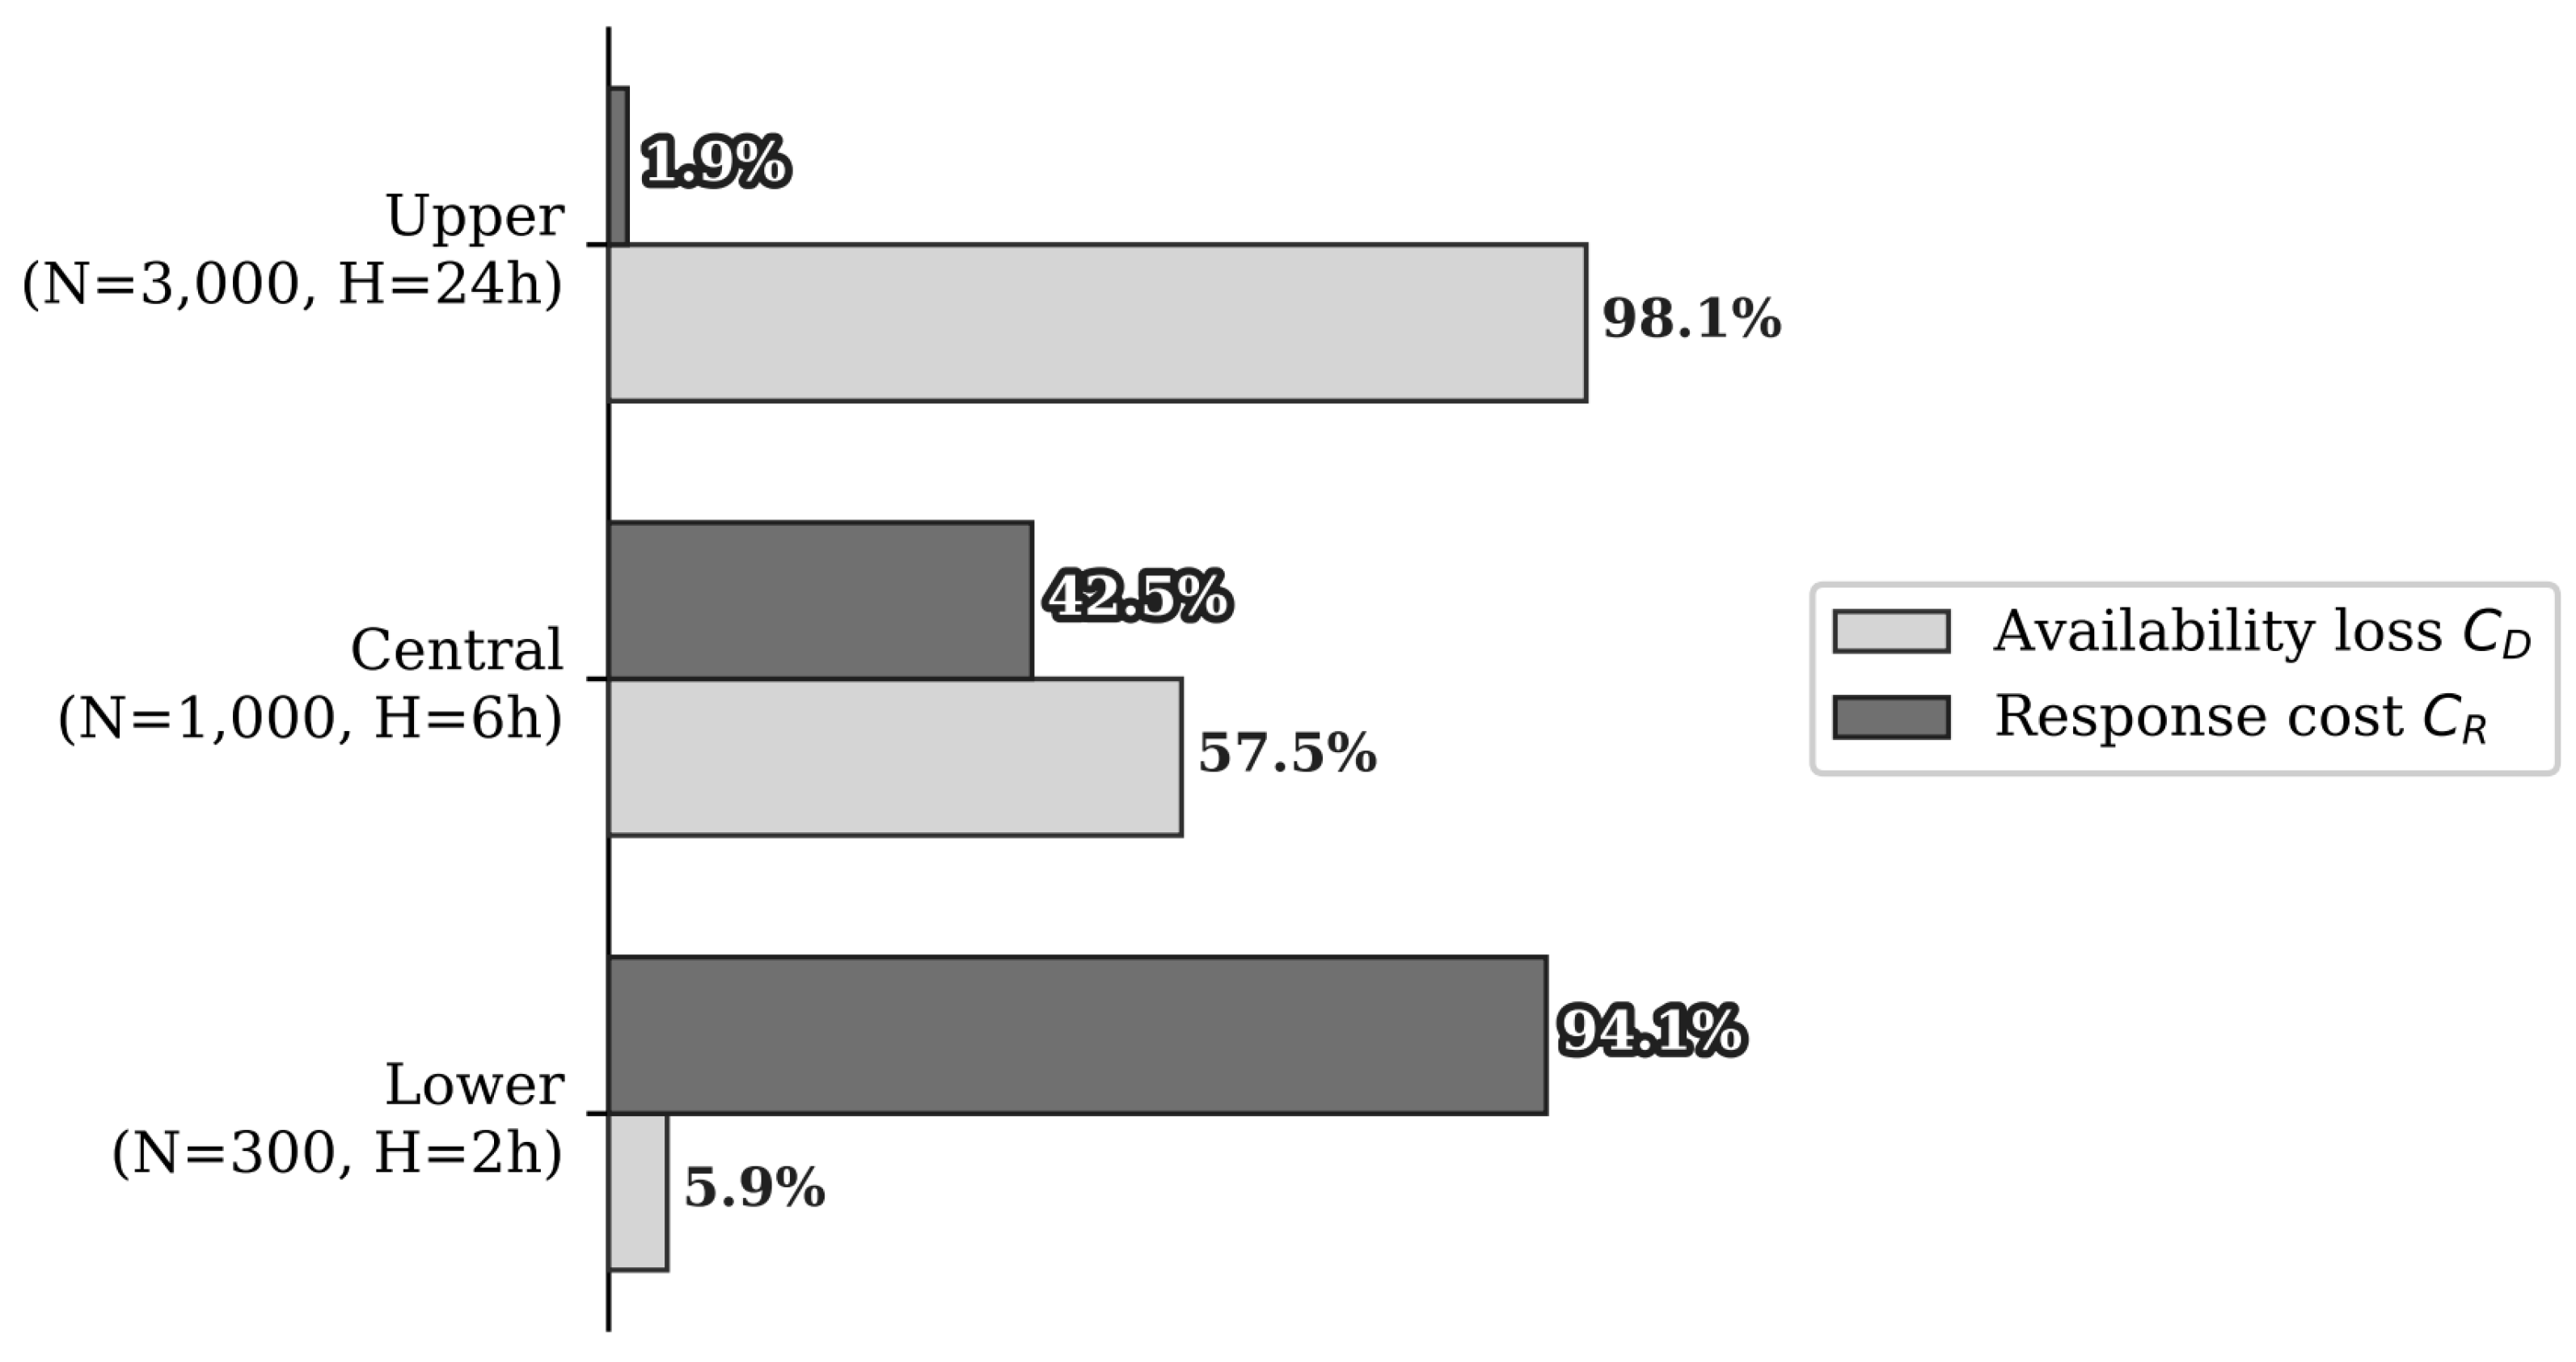
Figure 4.
Decision framework for the pre-patch and post-patch phases of the PHP2Shell incident, shown as a left-to-right flow. After threat detection, a branch on patch availability leads either to a second decision (patch-and-restore within hours vs. take offline) or directly to offline isolation. Both branches converge on a post-patch choice governed by the threshold condition p · B > C_D governing the restoration decision. Figures are rendered in grayscale for print reproduction.
Figure 4.
Decision framework for the pre-patch and post-patch phases of the PHP2Shell incident, shown as a left-to-right flow. After threat detection, a branch on patch availability leads either to a second decision (patch-and-restore within hours vs. take offline) or directly to offline isolation. Both branches converge on a post-patch choice governed by the threshold condition p · B > C_D governing the restoration decision. Figures are rendered in grayscale for print reproduction.
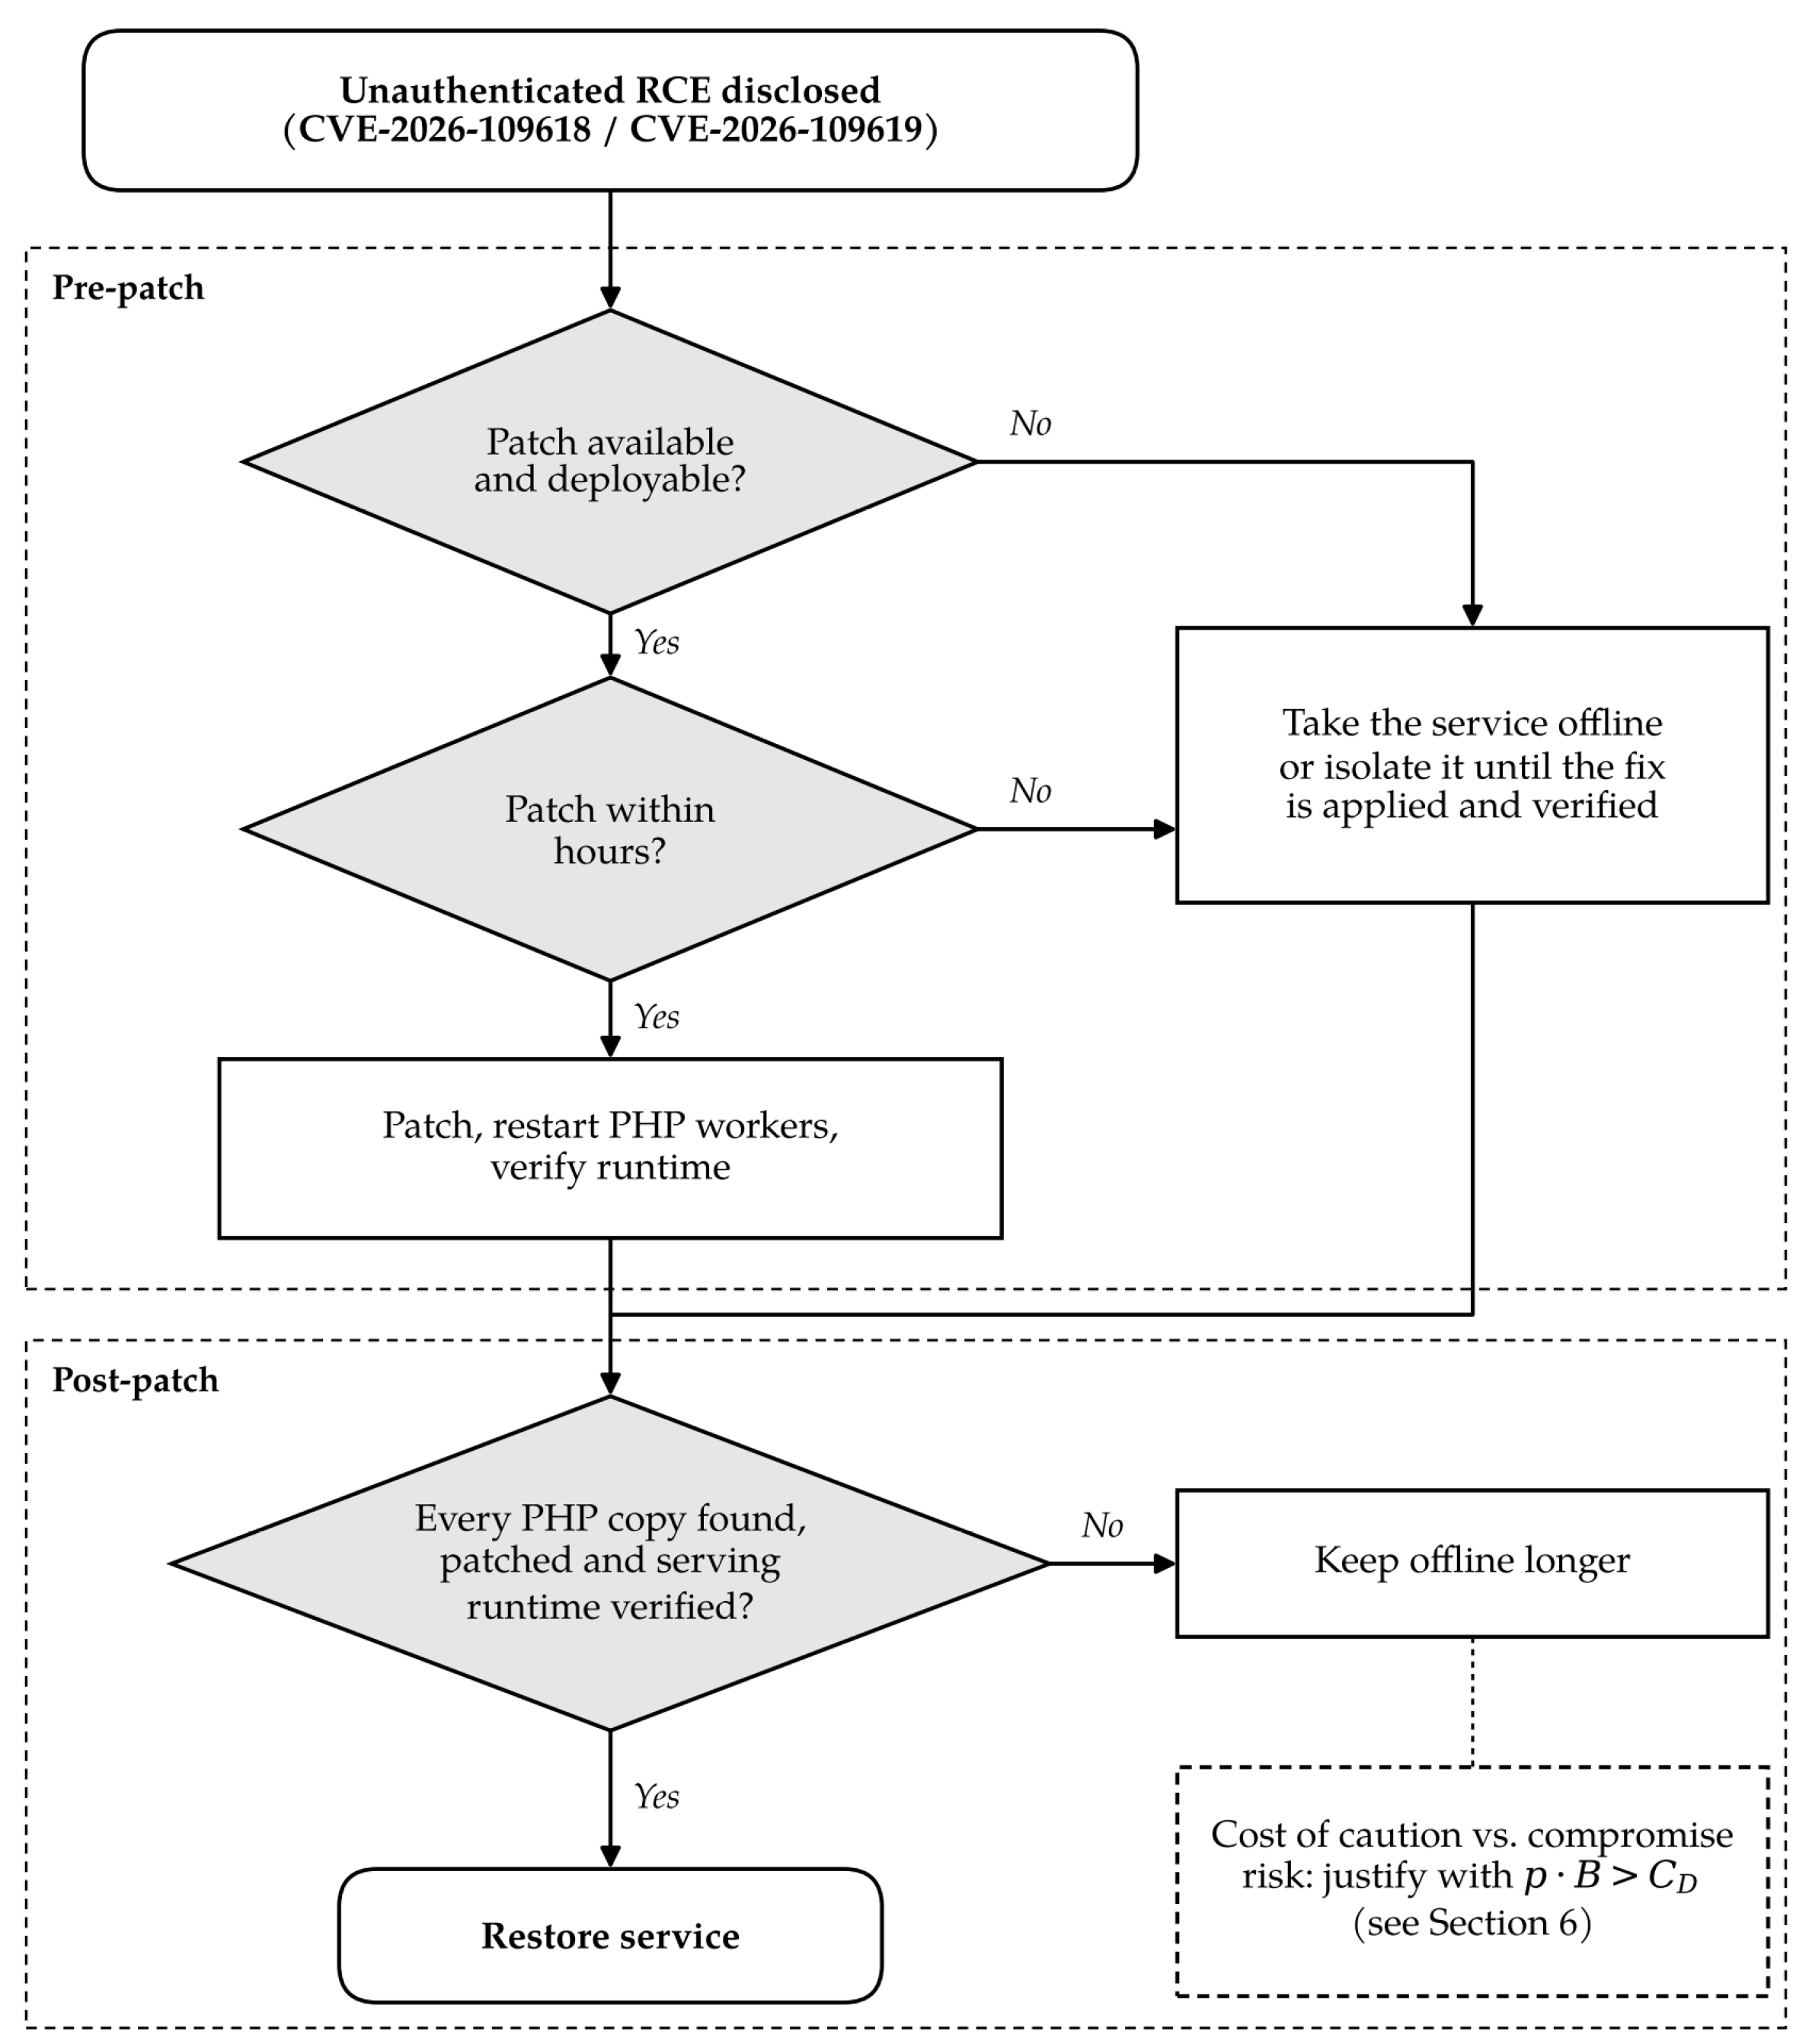
Disclaimer/Publisher’s Note: The statements, opinions and data contained in all publications are solely those of the individual author(s) and contributor(s) and not of MDPI and/or the editor(s). MDPI and/or the editor(s) disclaim responsibility for any injury to people or property resulting from any ideas, methods, instructions or products referred to in the content. |
© 2026 by the authors. Licensee MDPI, Basel, Switzerland. This article is an open access article distributed under the terms and conditions of the Creative Commons Attribution (CC BY) license (http://creativecommons.org/licenses/by/4.0/).
Copyright: This open access article is published under a Creative Commons CC BY 4.0 license, which permit the free download, distribution, and reuse, provided that the author and preprint are cited in any reuse.