

Submitted:
03 November 2026
Posted:
05 November 2026
You are already at the latest version
Abstract
Introduction: GDP rebasing and national-accounts revisions can improve the visibility of informal and MSME activity, but they also alter data sources, classifications, estimation procedures and the comparability of economic series. The supplied literature further indicates that GDP alone is insufficient for evaluating empowerment, enterprise performance and distributional outcomes. Methods: The researcher selected Google Scholar and ERIC as databases and information sources. The eligibility protocol limited publications to 2015–2026. The verified identification provenance did not record the exact calendar date of search execution; this differs from the publication-year eligibility range. We searched Google Scholar and ERIC using a prespecified Boolean strategy for studies published from 2015 to 2026. The recorded PRISMA workflow identified 150 records, removed 62 duplicates, screened 88 records, assessed 60 full texts and included 59 records. Results: Rebasing can broaden MSME visibility through newer surveys, administrative data and size-sensitive supply-use or input-output tables, but revised estimates are not automatically comparable across time or countries. Informality, unpaid work and non-observed activity remain central measurement gaps. The evidence supports multidimensional indicators covering income, employment, survival, household welfare, gender, productivity, sustainability and environmental effects. Transparent metadata, data governance, methodological validation and institutional capacity are enabling conditions. We found no direct, consistent comparisons of post-rebasing empowerment outcomes across all five BRICS economies. Discussion/Conclusion: GDP rebasing is best understood as an institutional measurement reform rather than a self-sufficient evaluation of MSME empowerment. Its policy value depends on transparent revisions, harmonised definitions, improved coverage of informal activity and complementary enterprise- and welfare-level indicators.
Keywords:
BRICS
; empowerment measurement
; GDP rebasing
; MSMEs
; national accounts
1. Introduction
Micro, Small, and Medium Enterprises (MSMEs) are frequently evaluated through measures of output, employment, productivity, enterprise counts and contribution to GDP. Yet the supplied literature shows that these indicators are shaped by the statistical systems through which economic activity is observed and classified. National-accounts revisions can introduce new base years, survey rounds, administrative sources, classifications and estimation procedures, thereby changing the measured size and composition of economic activity. In India, for example, national-accounts revisions draw on household, labour-force and enterprise surveys, while planned updates identify the potential use of GST, e-commerce and newer employment data (Kulshreshtha & Singh, 2026).
The evidence also indicates that informal, underground, unregistered and unpaid activities are difficult to observe consistently. Informality affects coverage, valuation, employment measurement, and comparability, while excluding unpaid household services and environmental costs narrows the welfare meaning of GDP (DeRock, 2019; Meghir et al., 2015; Qin et al., 2019). South African evidence similarly shows that informal enterprises differ by sector, age, gender, recordkeeping, location and employment-generating capacity (Mampuru, 2024). These issues matter directly for empowerment policy because an enterprise or worker may be economically active without being fully represented in official aggregates.
The supplied literature further suggests that MSME performance and empowerment are multidimensional. Income, employment, household contribution, business survival, productivity, environmental stewardship, social equity and workforce capability may reveal outcomes that GDP growth does not capture (Mkenda, 2024; Mahove & Matope, 2025; Rai et al., 2018). Extended supply-use and input-output tables can link macroeconomic aggregates to enterprise size, sector, trade exposure, and supply-chain position, although the resulting indicators remain dependent on definitions, source quality, and estimation choices (OECD & Union, 2025).
What remains insufficiently understood is how GDP rebasing specifically affects the evaluation of MSME empowerment policies across the BRICS economies. The supplied synthesis provides stronger direct representation of India and South Africa, while Brazil, Russia, and China are more often represented through adjacent evidence on informality, accounting, productivity, or national measurement. No supplied finding directly compares pre- and post-rebasing empowerment outcomes using a consistent design across all five economies. This systematic review was therefore needed to integrate the methodological evidence, distinguish measurement reform from substantive MSME change, and identify conditions under which revised national accounts can support defensible policy evaluation.
2. Research Objectives
RO1: Examine how GDP rebasing and base-year revisions affect evaluation of empowerment policies and measurement of MSME performance and development across BRICS economies (Brazil, Russia, India, China, and South Africa).
RO2: To identify the principal opportunities, benefits and enabling conditions associated with GDP rebasing and national accounts base-year revisions in relation to Methodological challenges in evaluating empowerment policies and measuring MSME performance.
RO3: To analyse the challenges, risks, ethical considerations and implementation barriers associated with GDP rebasing and national accounts base-year revisions for Micro, Small, and Medium Enterprises (MSMEs) and MSME development metrics.
RO4: To examine the contextual, institutional and practice-related factors that shape the adoption and effective use of GDP rebasing and national accounts base-year revisions within BRICS economies (Brazil, Russia, India, China, South Africa).
RO5: To identify gaps in the available evidence and derive implications for future research, policy, and practice relevant to Comparing MSME Development across BRICS Economies after GDP Rebasing: Methodological Challenges for Empowerment Policy Evaluation.
3. Research Methods
3.1. Review Design
The selected review type was a systematic review. This design was appropriate because the question required a transparent search, explicit eligibility criteria, study-level appraisal, and structured integration of heterogeneous evidence on national accounts, MSMEs, informality, empowerment, and policy evaluation. We used PRISMA as the reporting framework and CASP for critical appraisal. SALSA concepts distinguish searching, appraisal, synthesis, and analysis; these functions were operationalised in the verified project record rather than treated as interchangeable stages (Grant & Booth, 2009; Page et al., 2021).
3.2. Search Strategy and Information Sources
The researcher selected Google Scholar and ERIC as databases and information sources. The eligibility protocol restricted publication years to 2015-2026. The verified identification provenance did not record the exact calendar date of search execution; this differs from the publication-year eligibility range.
Full Boolean Search String
("Micro, Small, and Medium Enterprises (MSMEs)" OR "micro enterprises" OR "small and medium enterprises" OR SMEs OR "small business" OR "informal sector") AND ("GDP rebasing and associated methodological shifts in economic reporting" OR "national accounts" OR "statistical revision" OR "economic measurement" OR "GDP calculation" OR "methodology change") AND ("Methodological challenges in policy evaluation and empowerment metrics" OR Brazil OR Russia OR India OR China OR "South Africa" OR "emerging economies")
3.3. Inclusion and Exclusion Criteria
Inclusion
- Studies focusing on Micro, Small, and Medium Enterprises (MSMEs) or the MSME sector.
- Studies investigating GDP rebasing, base-year revisions, or associated methodological shifts in national economic reporting.
- Studies examining methodological challenges in policy evaluation, economic measurement, or empowerment metrics.
- Studies conducted within or explicitly covering one or more BRICS economies (Brazil, Russia, India, China, South Africa).
- Peer-reviewed journal articles.
- Studies published between 2015 and 2026.
- Studies published in the English language.
Exclusion
- Studies focusing exclusively on large enterprises, multinational corporations, or high-level macroeconomic trends without addressing MSMEs.
- Studies that do not address GDP rebasing, base-year adjustments, or methodological shifts in economic reporting.
- Studies that omit analysis of policy evaluation methodology, measurement challenges, or empowerment metrics.
- Studies conducted entirely outside the context of BRICS economies.
- Non-peer-reviewed publication types, such as conference abstracts, policy briefs, working papers, dissertations, books, or book chapters.
- Studies published prior to 2015 or after 2026.
- Studies published in languages other than English.
3.4. Screening and Study Selection
The PRISMA selection counts are persisted, but the decision rule used during title/abstract screening is not available in the verified audit payload. COSTAQDA therefore reports the recorded workflow counts without reconstructing an unverified screening procedure.
The persisted PRISMA workflow records 150 identified records, 62 duplicates, 88 records screened, 88 reports sought for retrieval, 0 records excluded at the title/abstract stage, 60 full texts assessed, 1 full-text exclusion, and 59 included records. These counts describe study selection and are not substantive review findings.
Figure 1.
PRISMA 2020 Flow Diagram. Source: COSTAQDA PRISMA Workflow, navigation item 8: PRISMA Flow Diagram; four-stage structure showing Identification, Screening, Eligibility (including CASP critical appraisal) and Included; adapted from PRISMA 2020 (Page et al., 2021).
Figure 1.
PRISMA 2020 Flow Diagram. Source: COSTAQDA PRISMA Workflow, navigation item 8: PRISMA Flow Diagram; four-stage structure showing Identification, Screening, Eligibility (including CASP critical appraisal) and Included; adapted from PRISMA 2020 (Page et al., 2021).
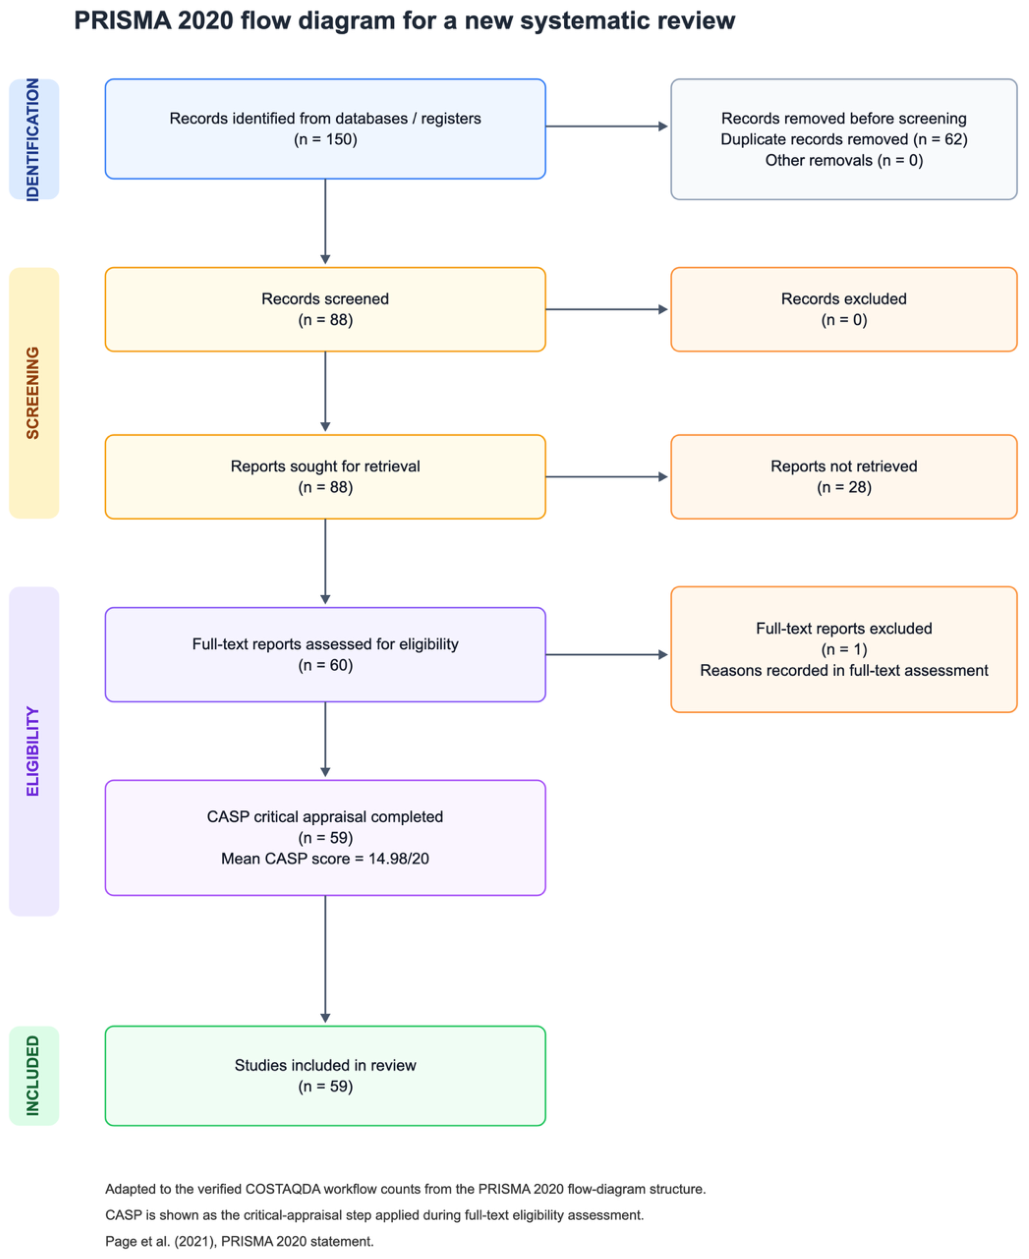
The PRISMA figure should be read as a transparent account of selection: 150 records were identified, 62 duplicates removed, 88 screened, 88 reports sought, 60 full texts assessed and 59 records included, with no recorded title/abstract exclusions and one full-text exclusion. The figure demonstrates the persistent numerical workflow, but the unavailable title/abstract decision rule and absent source-level retrieval counts limit independent reconstruction of every identification and screening decision. PRISMA counts are therefore evidence of reported process, not evidence about MSME development or GDP rebasing outcomes (Page et al., 2021).
3.5. Critical Appraisal
CASP was used in the PRISMA full-text workspace, and all 59 currently included studies had completed appraisals. CASP provides structured, study-design-specific prompts on methodological validity, findings, and relevance; it is not a universal quality scale. The supplied workspace reports a mean score of 14.98, but it does not include a validated interpretation of the total score or a method for assessing confidence at the finding level. Accordingly, the mean is reported descriptively and is not treated as a threshold for credibility (Long et al., 2020; Noyes et al., 2018).
The study-linked record indicates that the appraisal was conservative and text evidence-based. For unsupported criteria, judgments were recorded as “Can't tell,” particularly when the configured appraisal service was unavailable. This distinction is important: missing reporting is not equivalent to demonstrated methodological weakness. Nevertheless, several studies have recorded criterion-level concerns across multiple CASP items, including Anant (2020), Seemon (2024), Kulshreshtha and Singh (2026), Qin et al. (2019), and Mampuru (2024). These concerns constrain strong interpretation of findings derived from incomplete or indirectly relevant evidence.
The appraisal profile is heterogeneous because the evidence base spans quantitative surveys, econometric analyses, conceptual and methodological papers, reviews, working papers, repositories, and studies outside the BRICS setting. A single CASP summary therefore cannot establish equivalent methodological quality across designs. For example, the India-focused national-accounts evidence addresses changes in surveys and base-year procedures, whereas the MSME studies use different outcome definitions and analytical strategies (Kulshreshtha & Singh, 2026; Tandel, 2023). The relevance of each study to the review question must therefore be assessed alongside design, context, and directness.
Appraisal concerns directly affect the synthesis. Findings on expanded MSME visibility are plausible when the source describes revised surveys, administrative data or extended accounts, but they do not demonstrate that rebasing led to better empowerment outcomes. Similarly, associations between MSMEs and GDP growth cannot be treated as causal or comparable when studies use different indicators, periods and estimation strategies (Abuhatab, 2023; OECD & Union, 2025). The appraisal supports cautious thematic interpretation, not a formal ranking of studies.
COSTAQDA-supported traceability strengthens auditability by preserving links between extracted findings, study identifiers, codes and themes, but it does not remove limitations in the underlying studies (Costa & Costa, 2024). No GRADE-CERQual or other finding-level confidence assessment was recorded. Consequently, the review uses calibrated language based on convergence, divergence, directness and appraisal limitations, rather than assigning formal confidence ratings (Lewin et al., 2018).
Figure 2.
CASP Critical Appraisal Intelligence. Source: COSTAQDA PRISMA Workflow, navigation item 6: Full-Text Screening (CASP critical appraisal outputs). The Word figure is generated from the same deterministic COSTAQDA CASP visual.
Figure 2.
CASP Critical Appraisal Intelligence. Source: COSTAQDA PRISMA Workflow, navigation item 6: Full-Text Screening (CASP critical appraisal outputs). The Word figure is generated from the same deterministic COSTAQDA CASP visual.
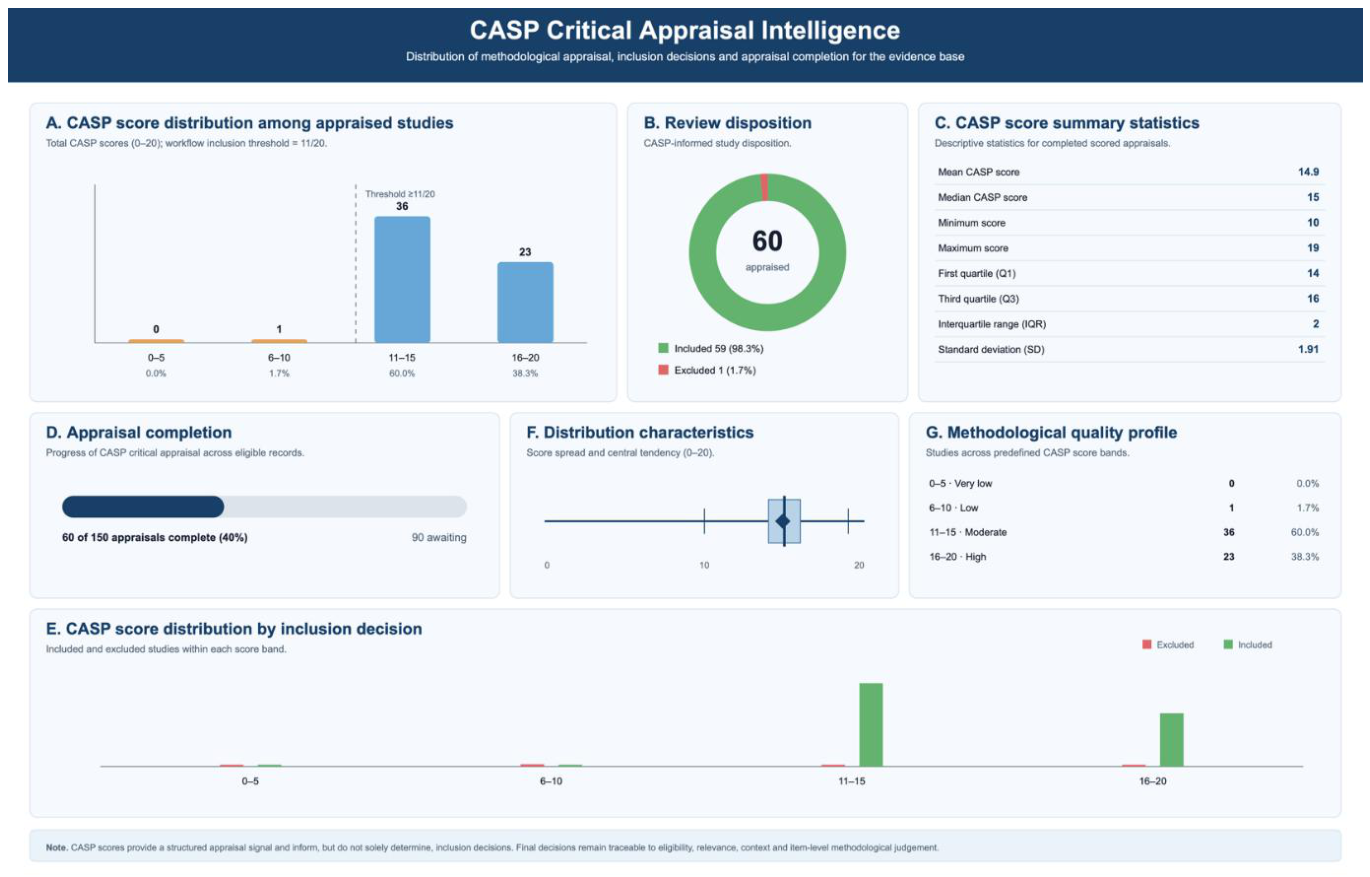
The CASP figure represents completed study-level appraisals for 59 included records and a reported mean score of 14.98. It provides a useful overview of appraisal completion and recorded judgments, but it must not be interpreted as a validated mean-quality estimate. The supplied study-linked records show variation in scores and multiple criterion-level concerns, while unsupported criteria were frequently marked “Can't tell” because of limited text evidence or service unavailability.
The visual summary should therefore be interpreted comparatively and cautiously. Studies addressing national-accounts revision and informality may offer direct methodological insight but incomplete reporting, whereas studies of MSME performance may provide empirical outcomes without directly evaluating rebasing. This variation in design and directness cannot be resolved by averaging scores. The CASP figure supports identification of uncertainty and appraisal coverage, not a claim that higher-scoring studies provide stronger causal evidence (Long et al., 2020; Noyes et al., 2018).
The appraisal narrative is most relevant to the synthesis where it limits claims of causation, comparability and transferability. Evidence from India and South Africa is more directly connected to national measurement and informal activity, while evidence from other settings contributes methodological analogies rather than BRICS-wide estimates. Because no CERQual assessment was recorded, the figure does not provide confidence ratings for the four analytical themes (Lewin et al., 2018).
3.6. Data Extraction
Data extraction was not recorded as a separate procedural narrative in the project record. Nevertheless, the verified synthesis workspace contains 401 extracted findings from 49 studies, each retained with finding identifiers and study identifiers. The available extracted fields include study bibliographic information, abstracts, appraisal information and finding-level text. Extraction completeness and a predefined extraction form cannot be independently verified, and this uncertainty is considered when interpreting truncated, methodological or bibliographic findings.
3.7. Data Synthesis and Analysis
We synthesised qualitative evidence from 401 extracted findings contributed by 49 studies. The COSTAQDA synthesis engine applied thematic synthesis, moving from traceable finding-level evidence to 6 initial codes, 3 categories, 0 descriptive themes and 4 analytical themes.
Theme development was constrained to the extracted finding-level evidence supplied by eligible studies. Each synthesised theme retained supporting study IDs and finding IDs, while contradictory evidence was preserved where identified. Titles, abstracts and bibliographic prominence were not treated as substitutes for extracted qualitative findings.
Recorded synthesis limitations included: The supplied evidence contains limited direct analysis of GDP rebasing and empowerment-policy evaluation specifically across all five BRICS economies. India and South Africa are more directly represented, while Brazil, Russia and China appear mainly through adjacent evidence on accounting, informality or national measurement.; Many supplied findings are truncated, methodological, bibliographic or drawn from studies outside the BRICS context; they therefore support cautious transfer of methodological lessons rather than strong country-comparative conclusions.; The evidence mixes national accounts, enterprise surveys, accounting-standard adoption, informal-sector studies and broader sustainability measures. These measures are not directly interchangeable, and the supplied findings do not establish a common post-rebasing indicator framework for MSMEs.; No supplied finding directly compares pre- and post-rebasing MSME empowerment outcomes using a consistent design across BRICS economies.; Several findings report associations or descriptive patterns rather than causal effects, so the synthesis cannot determine whether rebasing itself improves MSME performance or empowerment..
3.8. Bibliometric Intelligence and Confidence in the Evidence Base
Bibliometric intelligence provides a structural view of the evidence base that complements PRISMA selection, critical appraisal and qualitative synthesis. The following analyses examine citation relationships, scholarly influence, evidence connectivity and knowledge development within the included corpus. They provide contextual evidence about the intellectual structure and provenance of the literature and are not substitutes for methodological quality appraisal.
3.8.1. Local Citation Network
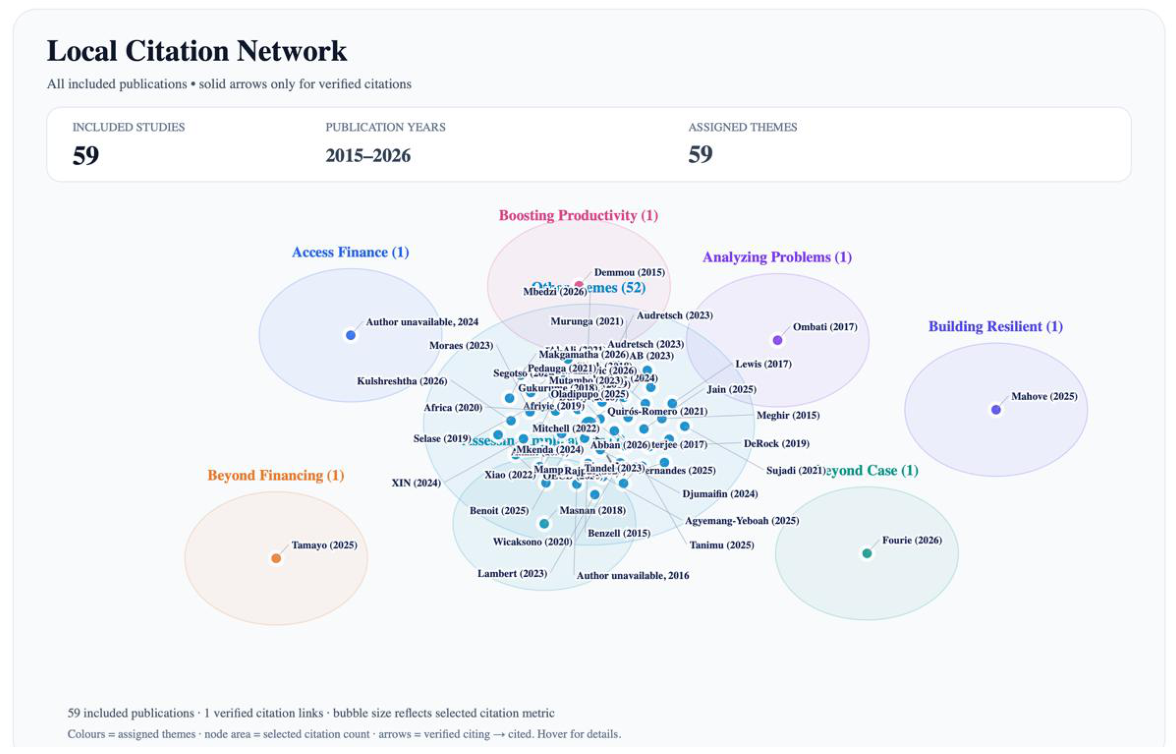
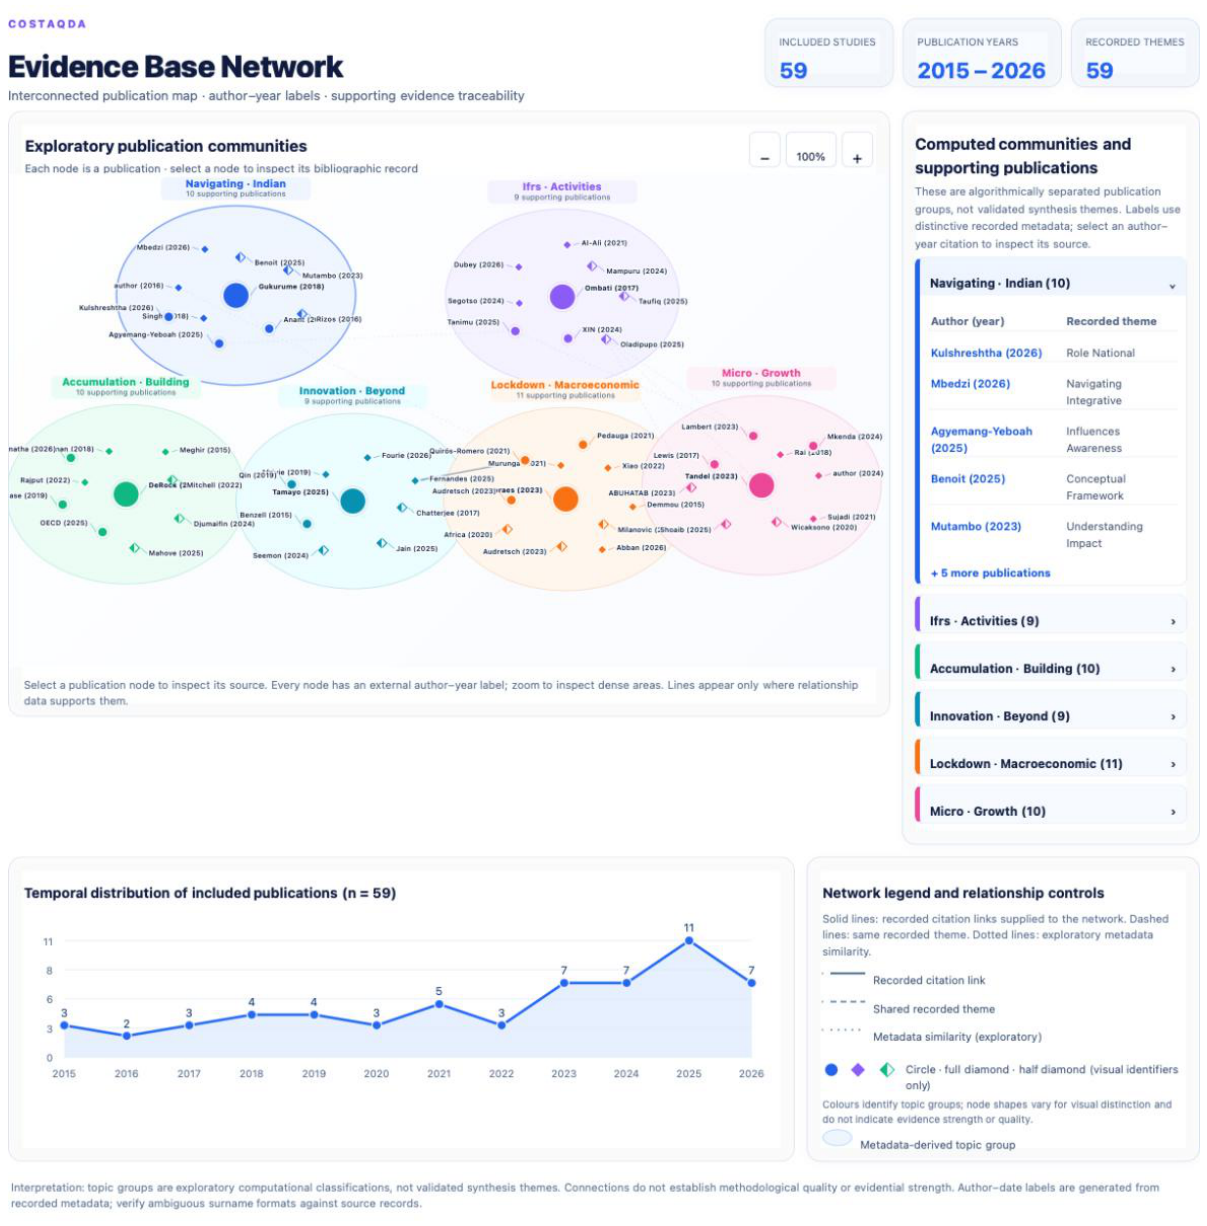
The Local Citation Network maps citation relationships within the included evidence base. It shows how studies connect within the review corpus and supports examination of intellectual connectedness, centrality, bridging, and isolation. These citation relationships describe the structure of the literature and do not, by themselves, establish methodological quality or validity.
Figure 3.
Local Citation Network. Source: COSTAQDA PRISMA Workflow, navigation item 12: Bibliometric Intelligence — Local Citation Network.
Figure 3.
Local Citation Network. Source: COSTAQDA PRISMA Workflow, navigation item 12: Bibliometric Intelligence — Local Citation Network.
3.8.2. Influence Pyramid
The Influence Pyramid represents the distribution of scholarly influence within the included evidence base. It helps identify how bibliometric prominence is distributed across the reviewed studies. Influence is interpreted separately from methodological quality, which is assessed through critical appraisal.
Figure 4.
Influence Pyramid. Source: COSTAQDA PRISMA Workflow, navigation item 12: Bibliometric Intelligence — Influence Pyramid.
Figure 4.
Influence Pyramid. Source: COSTAQDA PRISMA Workflow, navigation item 12: Bibliometric Intelligence — Influence Pyramid.
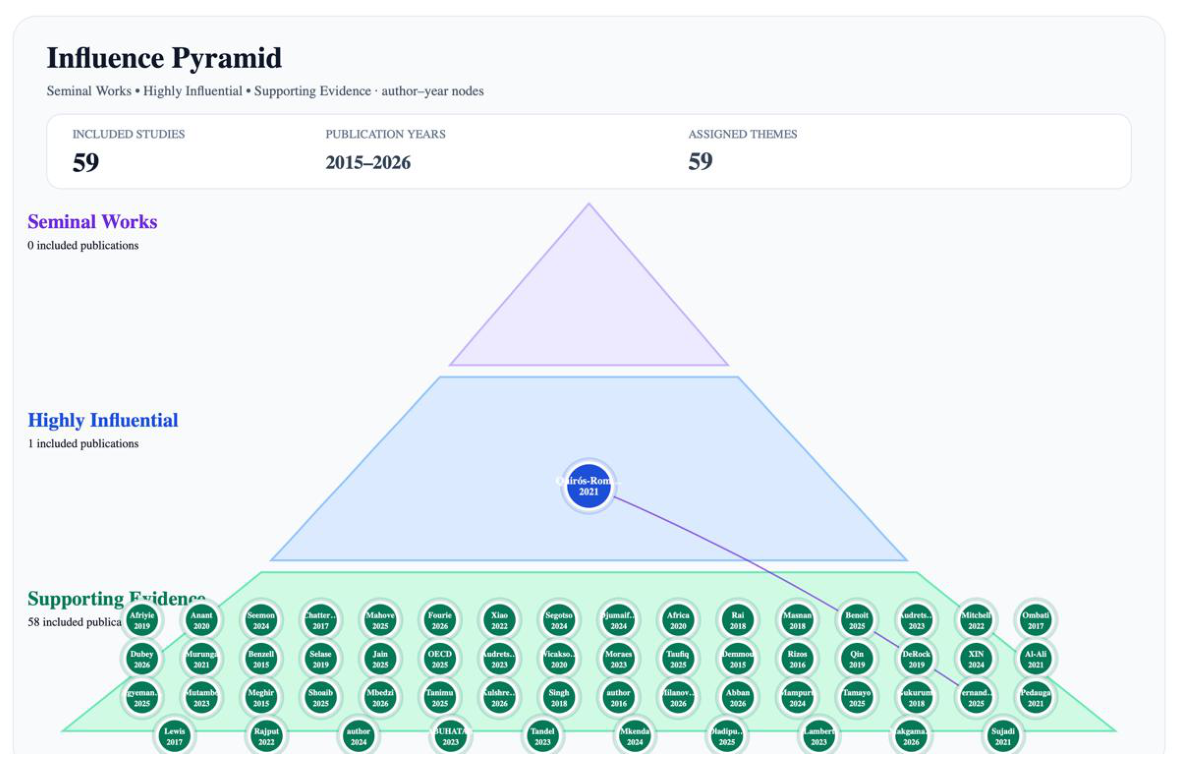
The Influence Pyramid is appropriate as a contextual evidence map because the project supplies study-level OpenAlex citation metadata for 59 included records, including global citation counts, local citation counts and an influenceScore field. The supplied metadata report 2,591 global citations, one local citation and 59 included records. The visualisation can therefore indicate bibliometric prominence within the retrieved evidence ecosystem, but it does not measure methodological quality, relevance, causal influence or consensus (Donthu et al., 2021; Zupic & Čater, 2015).
The strongest observable pattern is that a small number of records have relatively high global citation counts, including Rizos et al(2016)., Rai et al(2018)., Meghir et al(2015)., Pedauga et al(2021). and Afriyie et al(2019)., while many recent records have zero recorded global citations. The metadata also identify a single cluster structure and two named thematic clusters, although the figure-level construction and comparability of the influenceScore are not independently established. Because the influenceScore formula and citation coverage are absent, no ranking or score-based inference should be treated as reproducible.
For the review objectives, the pyramid can show which works are bibliometrically prominent in adjacent debates about informality, sustainability, MSMEs and economic measurement. It cannot show that those works offer the most relevant evidence for GDP rebasing in BRICS economies. Citation coverage may favour older publications, internationally visible outlets or records indexed by OpenAlex, while recent and locally relevant evidence may appear less prominent. Bibliometric prominence must therefore remain separate from CASP appraisal and thematic interpretation.
3.8.3. Evidence Strength
The Evidence Strength analysis examines the structure and strength of relationships within the evidence ecosystem assembled for the review. It complements, but does not replace, CASP methodological appraisal and must not be interpreted as a direct estimate of causal effect.
Figure 5.
Evidence Strength Network. Source: COSTAQDA PRISMA Workflow, navigation item 12: Bibliometric Intelligence — Evidence Strength Network.
Figure 5.
Evidence Strength Network. Source: COSTAQDA PRISMA Workflow, navigation item 12: Bibliometric Intelligence — Evidence Strength Network.
The Evidence Strength Network is appropriate only as a contextual map of recorded relationships among evidence nodes. The supplied workspace reports 59 included nodes and one edge: a direct relationship from Fernandes (2025) to Quirós-Romero et al(2021), with no supplied edge weight. The edge may represent the recorded direct relation in the project metadata, but it does not establish independent corroboration, study quality, causal strength or confidence in a finding.
The network's principal observable pattern is therefore sparse connectivity rather than a substantive hierarchy of evidence. The single displayed relationship links two works concerned with non-observed or informal economic measurement, consistent with the synthesis emphasis on coverage and comparability, but the network cannot show that this relationship validates the corresponding analytical theme. Missing edge semantics, absent weights and incomplete network metadata limit interpretation.
The Evidence Strength Network must not replace CASP appraisal or a finding-level confidence method. It provides an evidence-ecosystem view that may help trace conceptual or bibliographic relations, whereas CASP addresses study-level methodological limitations. Because no validated confidence assessment was recorded, the network should support transparency and auditability rather than assign strength to the review conclusions (Zupic & Čater, 2015).
3.8.4. Knowledge Evolution
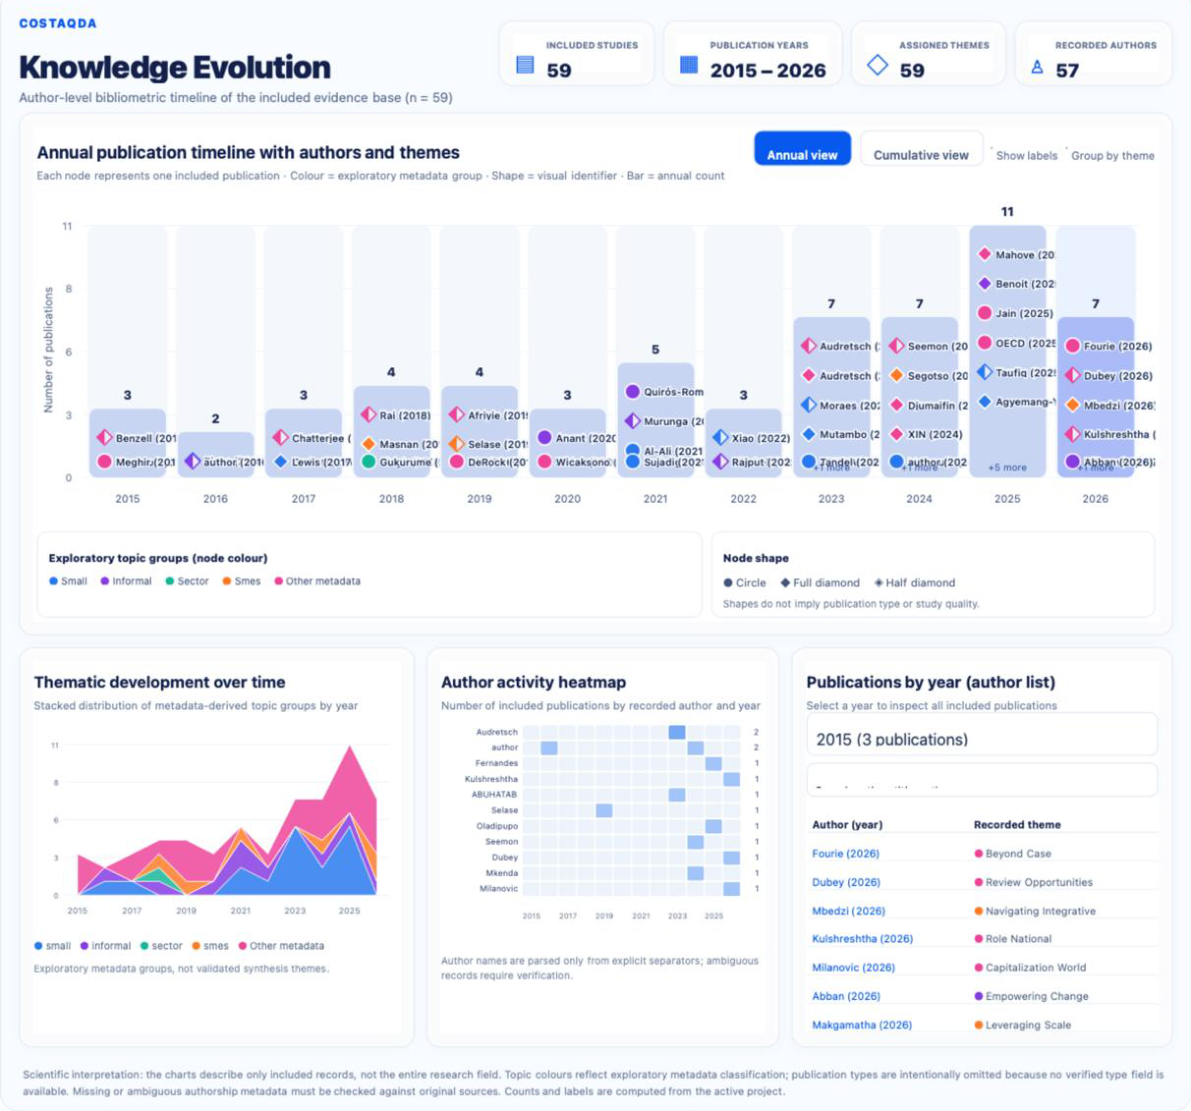
Knowledge Evolution examines the temporal and intellectual development of the included evidence base. It traces how research contributions develop over time and, where supported by the Step 12 data, how later studies extend, connect, challenge or consolidate earlier contributions.
Figure 6.
Knowledge Evolution. Source: COSTAQDA PRISMA Workflow, navigation item 12: Bibliometric Intelligence — Knowledge Evolution.
Figure 6.
Knowledge Evolution. Source: COSTAQDA PRISMA Workflow, navigation item 12: Bibliometric Intelligence — Knowledge Evolution.
3.8.5. Integrated Confidence in the Synthesised Evidence
No separate finding-level confidence method was recorded. CASP methodological appraisal, thematic synthesis and bibliometric description were therefore kept distinct. The Influence Pyramid represents bibliometric prominence or influence, not methodological quality, and the Evidence Strength Network represents the displayed structure of relationships within the evidence ecosystem, not independent corroboration or causal strength. Conclusions were calibrated instead through convergence, divergence, directness, contextual transferability, and the recorded limitations of the evidence base.
4. Findings
4.1. Search and Selection Results
The recorded workflow identified 150 records, removed 62 duplicates, screened 88 records, sought 88 reports, assessed 60 full texts and included 59 records. There were no recorded title/abstract exclusions and one full-text exclusion. Because the screening decision rule was not preserved, the numerical workflow is transparent at the count level but not fully reproducible at the decision-rule level.
4.2. Characteristics of Included Studies
The evidence base was heterogeneous and included national-accounts methodology, informal-sector measurement, MSME performance, accounting-standard adoption, sustainability, empowerment, productivity and policy studies. India and South Africa were more directly represented in the extracted synthesis, while Brazil, Russia and China appeared more often through adjacent evidence. The synthesis used 49 studies and 401 extracted findings, although the overall selection workflow included 59 records. This difference reflects the subset contributing verified extracted findings rather than an additional inclusion decision.
The included records varied in design and evidential status. Examples included econometric analysis of informality in Brazil (Meghir et al., 2015), national-accounts and survey-methodology work in India (Kulshreshtha & Singh, 2026), studies of South African informal enterprises (Mampuru, 2024), extended accounting tables (OECD & Union, 2025), and quantitative MSME performance studies (Tandel, 2023). The record also contains working papers, books, repositories and other sources despite the stated peer-reviewed journal eligibility criterion, which limits confidence in the consistency of study selection.
4.3. Methodological Strengths and Limitations of Included Studies
The main methodological strength was retaining finding-level identifiers and progressing from extracted evidence to codes, categories, and analytical themes. The authors preserved contradictory evidence where identified and did not use bibliometric prominence to create themes. The main limitations were the absence of a recorded extraction procedure, incomplete screening-rule documentation, heterogeneous designs and contexts, truncated findings, uncertain directness to BRICS-wide GDP rebasing, and the lack of a formal finding-level confidence assessment.
CASP appraisals were completed for all 59 included studies, but many records contain criterion-level concerns and “Can't tell” judgments. The reported mean score of 14.98 is not a validated quality threshold and should not be used to order evidence. Some included records are not clearly peer-reviewed journal articles, including working papers, books, repository records and other sources. These issues constrain generalisation and require cautious use of adjacent evidence.
4.4. Thematic Synthesis
Methodological basis: The thematic synthesis approach follows Thomas and Harden (2008), https://doi.org/10.1186/1471-2288-8-45. The study-specific findings and support counts below derive from the included evidence, not from this methodological citation.
Thematic synthesis is a systematic qualitative evidence-synthesis method that integrates findings across multiple studies while maintaining a transparent connection to the underlying evidence. (Flemming & Noyes, 2021) The process moves iteratively from extracted study findings to coding, grouping related codes into descriptive categories or themes, and developing higher-order analytical themes that answer the review question and research objectives. Its purpose is not merely to count how often an idea appears, but to identify patterned meaning across studies, examine convergence and divergence, preserve contextual differences, and develop an auditable interpretation that remains traceable to the contributing evidence.
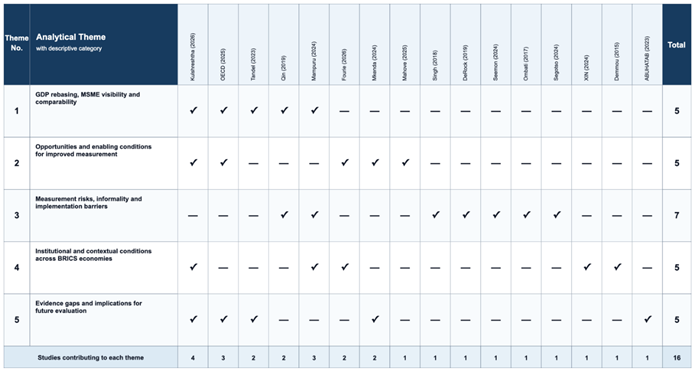
In this review, thematic synthesis was applied to the verified extracted findings retained in the active COSTAQDA project. Findings were compared across eligible studies, coded and grouped according to conceptual similarity, and then developed into 5 analytical themes represented across 16 evidence-contributing studies. The active synthesis retained 27 verified theme-to-study support assignments, keeping the analytical interpretation traceable to the underlying studies rather than reconstructing it from titles or bibliographic prominence. The resulting analytical themes include “GDP rebasing, MSME visibility and comparability”, “Opportunities and enabling conditions for improved measurement”, “Measurement risks, informality and implementation barriers”, “Institutional and contextual conditions across BRICS economies”, with the widest cross-study support recorded for “Measurement risks, informality and implementation barriers” (7 contributing studies). Table 1 therefore operationalises the synthesis as an auditable evidence map linking each analytical theme to the studies that supplied verified supporting findings.
Table 1 presents a thematic synthesis matrix linking verified analytical themes only to studies with verified extracted evidence supporting at least one theme in the matrix. Studies with no verified supporting contribution to any displayed theme are excluded, even if they were included elsewhere in the systematic review or qualitative evidence base. Rows represent analytical themes, and columns represent studies contributing to those themes. A check mark (✓) indicates that at least one verified extracted finding from a study was assigned to the theme; an em dash (—) indicates that the study contributed evidence to the overall synthesis but had no supporting extracted finding assigned to that particular theme. The absence of a supporting assignment should not be interpreted as contradictory evidence. Totals show the number of evidence-contributing studies providing verified support for each theme. The matrix therefore serves as an audit trail linking thematic interpretation to the underlying finding-level evidence, rather than measuring methodological quality or effect size. The most widely supported analytical theme was "Measurement risks, informality and implementation barriers", with verified support from 7 of 16 studies. The least widely distributed theme was "Evidence gaps and implications for future evaluation", with verified support from 5 of 16 studies. Differences in the number of supporting studies indicate the distribution of traceable thematic evidence across the included literature, not the relative importance or quality of a theme. Themes supported by fewer studies may still be analytically important when the underlying findings are conceptually rich, contextually distinctive or directly relevant to the review question. Conversely, wider study support indicates cross-study recurrence but does not by itself establish stronger methodological quality. The thematic patterns in Table 1 should therefore be interpreted alongside critical appraisal, contextual variation, verified contradictory findings, and the detailed theme-led discussion that follows.
4.5. RO1: GDP Rebasing, MSME Visibility and Comparability
The synthesis indicates that GDP rebasing and national accounts revisions can improve MSME visibility by incorporating newer survey rounds, administrative sources, updated classifications and revised estimation procedures. Indian evidence identifies changes associated with the 2011-12 base revision, the use of labour force and enterprise surveys, and the possible incorporation of GST and e-commerce data (Kulshreshtha & Singh, 2026). Extended supply-use and input-output tables can further disaggregate value added, employment, trade exposure and production by enterprise size and sector (OECD & Union, 2025).
The same reforms disrupt simple time-series and cross-country comparisons. A revised series may reflect changes in sources and definitions, as well as shifts in economic activity. The synthesis preserved a divergence between evidence reporting a relatively stable and substantial Indian MSME share of GDP and evidence finding statistically insignificant relationships between MSME size categories and GDP growth (Tandel, 2023; Abuhatab, 2023). These findings are not necessarily incompatible, as they use different outcomes and methods, but they demonstrate that headline MSME-GDP relationships are method-dependent.
Informality exacerbates the problem. Studies of Brazil, China, and South Africa show that unregistered, underground, and informal activities may be omitted or inconsistently accounted for, affecting GDP, employment, and enterprise measures (Meghir et al., 2015; Qin et al., 2019; Mampuru, 2024). The evidence therefore points to a methodological challenge rather than a uniform direction or magnitude of rebasing effects.
4.6. RO2: Opportunities and Enabling Conditions for Improved Measurement
The principal opportunity is to link macroeconomic accounts to enterprise-level detail. Extended accounts can provide size- and sector-sensitive indicators of value added, employment, imports, exports and supply-chain position, enabling policy evaluation to move beyond aggregate GDP (OECD & Union, 2025). Complementary data streams, including household and enterprise surveys, administrative data and more timely indicators, may improve the timeliness and granularity of measurement in settings where conventional GDP sources are delayed or incomplete (Fourie & Fourie, 2026).
The evidence also supports broader performance frameworks. MSME development can be evaluated using indicators such as income, employment creation, business survival, household contribution, productivity, social equity, environmental stewardship and workforce capability. Evidence on women-owned tourism MSMEs shows that income and household-income contribution can be measured directly, while South African supply-chain evidence links economic resilience to social and environmental dimensions (Mkenda, 2024; Mahove & Matope, 2025).
Enabling conditions include clear metadata, documented revisions, secure data sharing, specialist expertise, methodological validation, and open dissemination. The opportunity is therefore both institutional and technical. Without these conditions, new data sources may add complexity without producing comparable or trusted indicators.
4.7. RO3: Measurement Risks, Informality and Implementation Barriers
Informality was the most persistent methodological challenge. Informal and non-observed activities create coverage, valuation and comparability problems for GDP, employment and MSME statistics. Evidence from China identifies regional variation in the underground economy, while South African evidence shows that informal firms differ by age, sector, gender, record-keeping and employment-generating capacity (Qin et al., 2019; Mampuru, 2024). Indian evidence also suggests that women’s unpaid, self-employed and informal work may be underestimated (Singh et al., 2018).
The risks extend beyond statistical omission. Revisions can create discontinuities in time series, obscure whether changes are substantive or definitional, and encourage causal claims that the data cannot support. Environmental and unpaid household activity may also remain outside conventional GDP boundaries, limiting the use of rebased GDP as a welfare or empowerment measure (DeRock, 2019; Rai et al., 2018; Seemon, 2024).
Implementation barriers include shortages of specialist skills, subjectivity in valuation, reporting costs, fragmented institutional responsibility, weak data governance, and difficulties in adapting international standards to national contexts. Accounting-standard evidence from Brazil, India and South Africa shows that formal convergence does not eliminate the need for national interpretation and institutional capacity (XIN, 2024; Segotso et al., 2024).
4.8. RO4: Institutional and Contextual Conditions Across BRICS Economies
The evidence indicates that national statistical capacity, regulatory institutions, data-sharing arrangements and local economic structures shape the adoption and use of revised accounts. In South Africa, proposed real-time measurement depends on trusted custodians, privacy safeguards, metadata standards, validation and phased implementation (Fourie & Fourie, 2026). In India, the usefulness of national accounts depends on the periodicity, coverage and integration of household, labour-force and enterprise surveys (Kulshreshtha & Singh, 2026).
Context also affects what indicators mean. Informal activity varies by region, sector, gender and enterprise structure, while accounting reforms are mediated by national legal and professional systems (Mampuru, 2024; XIN, 2024). Evidence from Russia also shows how institutional and economic conditions shape MSME productivity, innovation support, and informality, although it does not directly evaluate GDP rebasing (Demmou & Wörgötter, 2015).
The evidence provided is insufficiently balanced for a robust country-by-country BRICS comparison. India and South Africa are more directly represented, whereas Brazil, Russia and China appear mainly through adjacent evidence. Consequently, institutional lessons should be transferred cautiously and should not be treated as equivalent national effects.
4.9. RO5: Evidence Gaps and Implications for Future Evaluation
The evidence base contains no findings that directly compare pre- and post-rebasing MSME empowerment outcomes using a consistent design across Brazil, Russia, India, China and South Africa. Measures are not interchangeable: the evidence combines national accounts, enterprise surveys, accounting-standard adoption, informal-sector estimates, sustainability measures and broader welfare indicators (OECD & Union, 2025; Mkenda, 2024).
Many findings are descriptive, associative, methodological, truncated, or drawn from outside BRICS. The evidence therefore supports cautious transfer of methodological lessons rather than strong comparative conclusions. In particular, it cannot determine whether rebasing itself improves MSME performance, empowerment, household welfare, or policy effectiveness.
Future evidence should align base-year revisions with transparent definitions, consistent MSME classifications, repeated measures for enterprises and households, informal-sector coverage, gender-sensitive indicators, and explicit pre- and post-evaluation designs. These are evidence needs derived from the synthesis, not claims that such frameworks are already established.
5. Discussion
The review addressed RO1 by showing that GDP rebasing can improve the visibility of MSME activity while complicating straightforward temporal and cross-country comparisons. Revised base years and additional data sources may yield more complete estimates, but the resulting changes cannot automatically be interpreted as changes in enterprise performance. This interpretation aligns with the contrast between stable reported MSME shares in India and statistically insignificant MSME-GDP relationships in other econometric evidence (Tandel, 2023; Abuhatab, 2023). The divergence reflects different outcomes and methods rather than a simple contradiction.
For RO2, the synthesis identifies extended accounts, integrated survey and administrative data, and multidimensional indicators as the principal opportunities. These approaches can link macroeconomic totals to enterprise size, sector, trade and employment. However, this opportunity is conditional. Metadata, secure data governance, methodological validation and trusted institutions are necessary for users to understand what revised figures include and exclude (OECD & Union, 2025; Fourie & Fourie, 2026).
RO3 is most clearly addressed by the evidence on informality and non-observed activity. The measurement problem is not merely technical: undercounting can affect which enterprises receive recognition, which workers appear in policy statistics, and how empowerment is interpreted. Gendered and unpaid work are particularly important because aggregate GDP may remain insensitive to contributions that matter for welfare and agency (DeRock, 2019; Rai et al., 2018; Singh et al., 2018). The review cannot determine whether particular rebasing exercises corrected these problems because direct pre- and post-outcome comparisons were absent.
The answer to RO4 is contextual and institutional. National statistical capacity, professional expertise, legal frameworks, reporting costs and local patterns of informality shape the implementation of measurement reforms. Evidence from India and South Africa is more directly relevant to the review question, whereas evidence from Brazil, Russia and China often offers adjacent methodological lessons. This unevenness prevents a strong claim that a single BRICS-wide model of rebasing or empowerment evaluation is appropriate.
RO5 is addressed by the identified evidence gap. The literature lacks a common post-rebasing MSME indicator framework and a consistent quasi-experimental design across the five BRICS economies. The review therefore offers a cautious synthesis of the conditions required for credible evaluation rather than an estimate of the effect of rebasing. CASP concerns, incomplete reporting, heterogeneous designs, and the absence of a confidence method further support restraint in interpreting the conclusions.
6. Conclusions
GDP rebasing and national-accounts base-year revisions can improve the visibility and disaggregation of MSME activity, but they also alter the measurement basis used to assess trends and policy effects. The central methodological challenge is that revised GDP does not, by itself, resolve issues such as informality, unpaid work, sectoral heterogeneity, gendered undercounting, or the distinction between statistical change and substantive MSME change. Empowerment evaluation therefore requires complementary indicators covering income, employment, survival, household welfare, productivity, equity and sustainability. Across BRICS economies, the evidence is insufficient to draw direct comparative or causal conclusions about post-rebasing empowerment outcomes. The most defensible conclusion is that the value of rebasing depends on transparent institutional practice, harmonised definitions, robust data governance and evaluation designs that explicitly link statistical revisions to enterprise and household outcomes.
7. Recommendations
Practice: Statistical agencies and policy evaluators should document base-year changes, source revisions, classifications, estimation procedures and metadata, and report continuity or break points in MSME series. Evaluation teams should combine GDP-based measures with enterprise, labour, household, gender and sustainability indicators.
Policy: BRICS policymakers should support secure data-sharing arrangements, interoperable enterprise and household statistics, improved coverage of informal and unregistered activity, and transparent consultation when national accounts methodologies are revised. Policymakers should use revised GDP as one component of policy evaluation, rather than as a standalone empowerment metric.
Future research: Researchers should conduct harmonised pre- and post-rebasing studies across the five BRICS economies, define comparable MSME and empowerment indicators, include informal and unpaid activity where methodologically defensible, and report how revisions affect estimates. Study designs should distinguish the causal effects of policy from changes caused by statistical reclassification or improved coverage.
Funding
This research received no external funding.
Conflicts of Interest
The authors declare no conflict of interest.
AI-assisted Technology and COSTAQDA Declaration
COSTAQDA served as an AI-assisted environment for evidence synthesis and manuscript development. Within the documented COSTAQDA workflow, AI-assisted functions helped organise, synthesise and present verified project evidence and support manuscript preparation. AI did not replace researchers’ responsibility for study selection, eligibility decisions, critical appraisal, verification of extracted evidence, interpretation of findings or final scholarly judgement. The human authors reviewed and approved the final manuscript and remain responsible for its accuracy, integrity, interpretations, citations and conclusions.
References
- Abban, R., & Elliot, E. A(2026). Empowering Change from the Ground Up: Women’s Entrepreneurship in Sub-Saharan Africa’s Informal Sector. Journal of Economics & Management Research. [CrossRef]
- Abuhatab, A(2023). THE ROLE OF MICRO, SMALL AND MEDIUM SIZE ENTERPRISES (MSMEs) IN ECONOMIC GROWTH – DOES IT MATTER?. مجلة جدارا للدراسات والبحوث. [CrossRef]
- Demmou, L., & Wörgötter, A(2015). Boosting Productivity in Russia. OECD Economics Department working papers. [CrossRef]
- DeRock, D(2019). Hidden in Plain Sight: Unpaid Household Services and the Politics of GDP Measurement. New Political Economy. [CrossRef]
- Donthu, N., Kumar, S., Mukherjee, D., Pandey, N., & Lim, W. M(2021). How to conduct a bibliometric analysis: An overview and guidelines. Journal of Business Research, 133, 285–296. [CrossRef]
- Flemming, K., & Noyes, J. (2021). Qualitative evidence synthesis: Where are we at? International Journal of Qualitative Methods, 20. [CrossRef]
- Fourie, H., & Fourie, J(2026). Beyond GDP: the case of real-time barometer of economic activity in South Africa. Working Paper Series. [CrossRef]
- Grant, M. J., & Booth, A(2009). A typology of reviews: An analysis of 14 review types and associated methodologies. Health Information and Libraries Journal, 26(2), 91–108. [CrossRef]
- Kulshreshtha, A., & Singh, G(2026). The Role of National Sample Survey Data in Compiling Indian National Accounts Statistics: Uses, Challenges and Enhancements. Journal of the Indian Society of Agricultural Statistics. [CrossRef]
- Lewin, S., Booth, A., Glenton, C., et al(2018). Applying GRADE-CERQual to qualitative evidence synthesis findings: Introduction to the series. Implementation Science, 13(Suppl 1), Article 2. [CrossRef]
- Long, H. A., French, D. P., & Brooks, J. M(2020). Optimising the value of the critical appraisal skills programme (CASP) tool for quality appraisal in qualitative evidence synthesis. Research Methods in Medicine & Health Sciences, 1(1), 31–42. [CrossRef]
- Mahove, T. T., & Matope, S(2025). Building Resilient Supply Chain Partners: A Framework for Sustainable Contract Manufacturing in a South African SME. Sustainability. [CrossRef]
- Mampuru, P. L. M(2024). Examining activities of youth informal entrepreneurs in South Africa: An analysis using SESE data. University of the Western Cape Electronic Theses and Dissertations Repository (University of the Western Cape).
- Meghir, C., Narita, R. D. T., & Robin, J(2015). Wages and Informality in Developing Countries. American Economic Review. [CrossRef]
- Mkenda, B(2024). Economic Empowerment of Tanzanian Women Through Ownership of Tourism Micro, Small, and Medium Enterprises (MSMEs). Tanzanian Economic Review. [CrossRef]
- Noyes, J., Booth, A., Flemming, K., Garside, R., Harden, A., Lewin, S., Pantoja, T., Hannes, K., Cargo, M., & Thomas, J(2018). Cochrane Qualitative and Implementation Methods Group guidance series—paper 3: Methods for assessing methodological limitations, data extraction and synthesis, and confidence in synthesized qualitative findings. Journal of Clinical Epidemiology, 97, 49–58. [CrossRef]
- OECD, & Union, E(2025). Handbook on Extended Supply and Use Tables and Extended Input-Output Tables. OECD eBooks. [CrossRef]
- Page, M. J., et al(2021). The PRISMA 2020 statement: An updated guideline for reporting systematic reviews. BMJ, 372, n71. [CrossRef]
- Qin, Y., Ren, Z., & Wang, X(2019). Research on the Proportion of Underground Economy in China Based on NIPA Measurement. Journal of Economics and Business. [CrossRef]
- Rai, S. M., Brown, B. D., & Ruwanpura, K. N(2018). SDG 8: Decent work and economic growth – A gendered analysis. World Development. [CrossRef]
- Seemon, A(2024). Redefining GDP: Integrating Carbon Pricing in National Income Accounting. REFLECTION.
- Segotso, T., Mvunabandi, J. D., & Phesa, M(2024). A Systematic Literature Review of the Challenges of Adopting and Implementing IFRS for SMEs in South Africa. International Journal of Economics and Financial Issues. [CrossRef]
- Singh, Y. S. Y., Tyagi, S. T. S., & Tyagi, B. R. T. B. R(2018). Underestimation of Participation of Women Workers in Informal Sector: Understanding the Role of Women Workers in the Informal Sector of the Indian Economy. Journal of Advances and Scholarly Researches in Allied Education.
- Tandel, M. R(2023). Growth and Performance Analysis of the Micro, Small and Medium Enterprises (MSMES) Sector in India. International Journal of Research Publication and Reviews. [CrossRef]
- XIN, W(2024). FOREIGN EXPERIENCES IN IMPROVING ACCOUNTING ON THE BASIS OF IFRS. Scientific Journal of Actuarial Finance and Accounting. [CrossRef]
- Zupic, I., & Čater, T(2015). Bibliometric methods in management and organization. Organizational Research Methods, 18(3), 429–472. [CrossRef]

Table 1.
Thematic Synthesis Matrix. Only studies contributing verified extracted qualitative evidence are displayed. ✓ = verified extracted evidence from the study supports the theme; — = the study contributed to the synthesis but no supporting extracted finding from that study was assigned to this theme. An em dash does not indicate contradictory evidence.
Table 1.
Thematic Synthesis Matrix. Only studies contributing verified extracted qualitative evidence are displayed. ✓ = verified extracted evidence from the study supports the theme; — = the study contributed to the synthesis but no supporting extracted finding from that study was assigned to this theme. An em dash does not indicate contradictory evidence.
Disclaimer/Publisher’s Note: The statements, opinions and data contained in all publications are solely those of the individual author(s) and contributor(s) and not of MDPI and/or the editor(s). MDPI and/or the editor(s) disclaim responsibility for any injury to people or property resulting from any ideas, methods, instructions or products referred to in the content. |
© 2026 by the authors. Licensee MDPI, Basel, Switzerland. This article is an open access article distributed under the terms and conditions of the Creative Commons Attribution (CC BY) license (http://creativecommons.org/licenses/by/4.0/).
Copyright: This open access article is published under a Creative Commons CC BY 4.0 license, which permit the free download, distribution, and reuse, provided that the author and preprint are cited in any reuse.