

Submitted:
03 November 2026
Posted:
04 November 2026
You are already at the latest version
Abstract
Background: In interstitial lung disease (ILD), alveolar macrophage loss and SPP1+ expansion have been described separately; the lost side (the homeostatic reservoir) is rarely quantified on a common scale or at donor level. We tested whether ILD remodels the lung macrophage ecosystem as a bipolar displacement of relative composition.Methods: A 25-module functional/morphological scoring system was applied to three scRNA-seq atlases (Madissoon normal lung, 40,634 myeloid cells; a PBMC reference; the Natri ILD atlas, 175,426 cells, 118 donors, 10 diagnoses, 30 microclusters), normal-lung Visium sections, 195,994 ligand-receptor edges and the independent IPF Cell Atlas (GSE136831), with donor-level statistics as the primary inferential unit.Results: Interstitial macrophages (IMs) were the most reprogrammed compartment, losing complement/phagocytic identity (up to -0.39) while gaining granuloma and matrix-remodelling programmes; sarcoidosis was the exception (complement +0.08; antigen presentation +0.31). C1Q-high reservoir microclusters, CD10/MME-high in their lipid-handling branch, contracted at donor level across all powered diagnoses, with disease-specific expansion of SPP1+ states; in IPF, donor-level tests supported a candidate SPP1/CHIT1-high state (mc26, 5.3% versus 0.39%; p=1.6×10⁻⁹; microcluster boundaries seed-sensitive) and a candidate OCSTAMP+ fusion-primed IM state. Ligand-receptor analysis indicated strengthened FN1-ITGB1/SPP1-CD44 axes and attenuated THBS1-CD36/C3 circuits; spatial data showed dispersed, non-aggregated homeostatic behaviour in normal lung; the expanding pole and the compositional anticorrelation replicated in the independent cohort, whereas programme-level identity loss did not.Conclusions: The ILD macrophage ecosystem exhibits a bipolar displacement of relative composition: a testable model of homeostatic-niche dissolution and pathological-niche construction.
Keywords:
interstitial lung disease
; macrophage
; SPP1
; interstitial macrophage
; single-cell atlas
; granuloma
; ligand-receptor interaction.
Introduction
Single-cell studies of fibrotic and granulomatous lung disease have converged on two recurring observations: expansion of SPP1-expressing monocyte-derived macrophages and contraction of the resident alveolar macrophage (AM) pool [1,2,3,4]. In parallel, the homeostatic lung macrophage compartment has been resolved into ontogenetically and anatomically distinct subsets, including FOLR2+/LYVE1+ interstitial macrophages (IMs) residing in perivascular niches [5,6,7,8], and lineage studies show that recruited monocytes progressively replace embryo-derived macrophages during fibrosis [9,10].
Three gaps remain. First, cross-diagnosis comparisons on a common functional scale are lacking (each lung study applies its own marker sets [36]), so gains and losses cannot be compared across diagnoses. Second, most compositional claims rest on cell-level statistics that treat hundreds of thousands of cells as independent observations; donor-level confirmation remains rare [11]. Third, the field has quantified what is gained (SPP1+ expansion) far better than what is lost; the depleting pole has been characterised mainly for AMs, not for the interstitial reservoir populations whose homeostatic niche biology is well defined [5,6,7,8,12,13]. Whether reservoir depletion is a general feature across ILD diagnoses, and how the two poles relate to intercellular signalling, is unknown.
We hypothesised that the ILD macrophage ecosystem is reorganised as a bipolar displacement of relative composition: contraction of homeostatic reservoir microclusters (the depleting pole) coupled to disease-specific expansion of SPP1+ pathological microclusters (the expanding pole), accompanied by interaction rewiring (recruitment/fate-locking axes strengthened, homeostatic clearance circuits attenuated). To test this, we applied a curated 25-module functional and morphological scoring system uniformly across three single-cell atlases, spatial transcriptomics of normal lung, and a whole-atlas ligand-receptor analysis, with donor-level statistics as the primary inferential unit where sample size allowed. ## Material and methods
Datasets
Three public scRNA-seq resources were analysed (Table 1): the Madissoon lung atlas (myeloid subset, 40,634 cells, 15 subtypes) [14]; a 10x Genomics 10k PBMC reference (1,582 gated CD14/LST1/CSF1R-positive lymphoid-negative monocytes); and the Natri ILD atlas (myeloid subset, 175,426 cells from 118 donors across ten diagnostic groups, merged from two constituent studies; GEO: GSE227136 and GSE135893) [15]; diagnosis labels follow the source atlas, with NSIP denoting a histopathological pattern whose aetiologic composition is not subdivided. Spatial data comprised three normal parenchymal Madissoon Visium sections (7,851 spots, deconvolved to 80 cell types) . The independent IPF Cell Atlas (GEO: GSE136831; 312,928 cells; 32 IPF, 28 Control, 18 COPD donors) provided external cross-validation with author annotations and donor-level inference (supplementary material) [3]. Diagnoses with fewer than four donors (CTD-ILD, CWP, IPAF, cHP, ILD/HP) were treated as exploratory throughout. Full dataset details are in the supplementary material.
Scoring, Clustering and Statistics
We scored 25 curated gene modules (6-20 genes per module; composition in Figure 1c, supplementary Table S1 and Supplementary Data S1) as the sum of log-normalised expression over module genes detected in the dataset, divided by the number of module genes present in the dataset (undetected genes contribute zero; deterministic; GF_unified_scoring.py), with scanpy score_genes [16] (fixed random_state=0) used only for the PBMC analysis; because module scores carry batch effects, comparisons were made within dataset, never across datasets. Leiden clustering [17] of the Madissoon myeloid compartment resolved 43 homeostatic microclusters (median parent-subtype purity 0.76) and, of the Natri myeloid compartment, 30 disease-atlas microclusters. The two microcluster sets are numbered independently; unless stated otherwise, mc numbers refer to the disease-atlas set. Disease enrichment was quantified per microcluster by Fisher odds ratios (cell-level, reported with that caveat) and, as the primary inference, by donor-level composition tests: two-sided Mann-Whitney U tests on per-donor microcluster fractions (IPF: 39 versus 51 donors), restricted to diagnoses with at least four donors, with a Bonferroni sensitivity threshold of 1.7×10⁻³ across the 30 microclusters; the 30-test family covers IPF as the sole confirmatory comparison, the 90 donor-level tests in the other three diagnoses being exploratory. Reservoir contraction was summarised as donor-median (headline) and donor-mean shifts in percentage points. A whole-atlas ligand-receptor screen (113 curated pairs, 106 scored, as raw sender-ligand x receiver-receptor expression products; 195,994 sender-to-receiver edges; deltas are Disease-minus-Control differences of edge scores, reported for macrophage-receiving edges), spatial analyses, and two pre-specified robustness analyses (leave-one-cohort-out scrutiny; detection-rate-matched permutation backgrounds for the six key IM modules) are detailed in the supplementary material (supplementary Tables S3-S4).
Results
Homeostatic Division of Labour and the Blood Baseline
The 25-module system recovered the expected division of labour across the 15 homeostatic lung myeloid subtypes (Figure 1a). CD14+ monocytes were inflammation-poised (ID_Monocyte 1.94) without phagocytic or complement machinery; IMs were the most interferon-primed population (IFN_Response 1.07); intravascular macrophages maximally expressed Complement (1.27) and Phagocytosis (1.25); AMs expressed ID_AM (1.46) and lipid/iron-handling programmes, with a dividing AM subset highest in Proliferation (0.41), matching the self-renewing pool [18,19]. A granuloma-like resident subtype (Macro_CHIT1: Granuloma_Program 1.08, Lipid_Foam 1.33, Morph_LysosomalMass 1.26, Fusion 0.95) was already present in the normal lung, and dendritic cells carried the highest Antigen_Presentation scores (1.77-1.90), a built-in positive control. In blood (Figure 1b), the three gated monocyte subsets reproduced known subset biology [20,21], while tissue-resident programmes (Lipid_Foam 0.06-0.10; Granuloma_Program 0.06-0.13; Fusion 0.01-0.08) were essentially silent, indicating post-entry niche induction of resident identity [12,13].
Disease Reprogramming Is Most Extensive in Interstitial Macrophages, with Sarcoidosis as a Coherent Exception
Across the ten diagnostic groups of the Natri atlas, IMs were the most extensively reprogrammed macrophage compartment (Figure 2a, Table 2). Granuloma_Program increased in all nine ILD diagnoses (largest in cHP, +0.35), and Antigen_Presentation and Matrix_Remodeling increased broadly. Two losses defined the depleting pole at module level: Complement_System fell across fibrotic ILDs (unclassified ILD -0.39; NSIP -0.23; IPF -0.22) and Phagocytosis_Core fell in parallel (unclassified ILD -0.23; IPF -0.16), as did Lipid_Foam. Monocyte-derived macrophages (MoMacs) showed even broader complement attenuation (up to -0.51 in CWP), consistent with incompletely equipped recruited effectors, whereas AM programmes changed modestly (|delta| at most 0.33), in line with the GM-CSF/PPARG-locked alveolar programme [18,19].
Sarcoidosis was the single coherent exception: IMs retained Complement (+0.08) and Phagocytosis (+0.01) while showing the largest Antigen_Presentation gain of any diagnosis (+0.31), consistent with an antigen-presenting hub. Both robustness analyses supported the IPF IM deltas (Figure 2c): all six key module deltas remained directionally unchanged upon leave-one-cohort-out exclusion of either non-primary constituent cohort (12/12 tests; Granuloma_Program +0.293 overall, +0.316 without Habermann 2020), and five of six exceeded detection-matched permutation nulls (supplementary Tables S3-S4).
Microcluster-Level Evidence Supports a Bipolar Displacement of Relative Composition
Clustering resolved the two poles of the model (Figure 3a, Table 3). Four microclusters defined the homeostatic reservoir: mc17 (SERPING1/MFGE8/FABP4/C1Q-high; Control OR=28.7), mc20 (FABP4/C1QA-C/MARCO; OR=5.4), mc15 (CD163/VSIG4/CD81; OR=6.7) and mc9 (FOLR2/LYVE1/SELENOP/MAF, a homeostatic IM-state signature; OR=2.2). Gene-level anchoring (Figure 3d) showed the reservoir to be CD163/C1QA-high (CD163 1.48-1.89; C1QA 1.59-2.38), with MME (CD10) marking its lipid-handling branch (mc17 0.62; mc20 0.39) and, atlas-wide, the AM-like mc27 (1.06) and mc14 (0.97); the IPF-converging SPP1+ microclusters mc26, mc11 and mc29 were uniformly MME-low (0.07-0.10) and C1QA-low. This CD10-high/C1Q-high versus SPP1-high opposition is sharpest in IPF (the NSIP/cHP-converging AM-like mc14 remains MME-high and SPP1-low) and provides the microcluster-level bridge to the CD10 readout.
The depleting pole contracted across the disease spectrum (Figure 3c). By the headline donor-median statistic, all four reservoir microclusters contracted in each of the four diagnoses with at least four donors (ILD, IPF, NSIP, sarcoidosis; descriptive donor-median summary; all shifts negative, -0.3 to -5.7 percentage points of myeloid cells, concordant across correlated clusters and diagnoses). By donor mean, all four clusters likewise fell in all nine ILD diagnoses, a summary inflated by right-skewed donor distributions, reported as skew-sensitive (supplementary material). Where donor numbers permitted formal testing (IPF), all four reservoir microclusters were depleted (mc15 p=1.2×10⁻⁵; mc17 p=1.1×10⁻⁴; mc20 p=4.2×10⁻³; mc9 p=1.1×10⁻²); mc15 and mc17 depletion survive Bonferroni correction (both seed-sensitive across Leiden re-runs; Figure 3f; Limitations), whereas mc20 and mc9 are interpreted as directional. This contraction exceeded a uniform-dilution null model (Figure 3e): monocyte/MoMac fractions did not increase in IPF (57.0% versus 60.4%), yet reservoir fractions fell 2.5- to 10.5-fold more than the null expectation of 1.033 (donor-level paired Wilcoxon p=6.3×10⁻⁶; cluster-label permutation p=0.0042; supplementary material, P3_dilution_null.csv).
The expanding pole was disease-specific (Figure 3b). In IPF, donor-level statistics supported expansion of mc26 (SPP1/CHIT1/GPNMB/CCL18; 5.3% versus 0.39% of myeloid cells, p=1.6×10⁻⁹; boundaries seed-sensitive, programme-level claim — Limitations), mc11 (SPP1/CHI3L1/CHIT1/MMP9/TREM2; 6.6% versus 1.0%, p=1.2×10⁻⁹), mc16 (LGMN/CCL18/GPNMB/SPP1; p=9.0×10⁻¹⁰) and mc29, an OCSTAMP+/SPP1+/MMP9+ IM-identity microcluster (75% IM purity; Fusion 0.95, Granuloma_Program 1.17) essentially absent from controls (0.20% versus 0%, p=1.9×10⁻⁹); all four survive Bonferroni correction. The secondary SPP1+ MoMac microclusters mc22 and mc6 also passed the Bonferroni threshold (Supplementary Data S2). Elsewhere, cell-level enrichment (descriptive; small donor numbers) pointed to mc7 in IPAF (lipid-loaded SPP1+ MoMacs; OR=25.2), mc10 in CWP (OR=7.4) and mc14 in NSIP/cHP (OR=5.1/4.5); the sarcoidosis-enriched mc21 (cholesterol-handling MoMacs; OR=8.3) and mc2 (NLRP3/IL1B inflammatory monocytes; OR=7.7) did not reach donor-level support (four donors) and remain candidates. The remaining microclusters showed no consistent cross-diagnosis directionality (Supplementary Data S2). Together, the data support a bipolar displacement of relative composition — reservoir contraction plus disease-specific expansion — an explicitly relative-composition claim (Limitations).
To test generalisation beyond the Natri atlas [15], we applied the same framework to the independent IPF Cell Atlas (GSE136831) [3], using author annotations with donor-level inference. The expanding pole replicated strongly: SPP1+ cells rose from 9.2% to 42.4% of myeloid cells (FDR q=3.6×10⁻⁸), with Granuloma_Program and Matrix_Remodeling gains in interstitial-like macrophages (+0.47 and +0.33; q<5×10⁻⁹; Natri: +0.29 and +0.18). The depleting pole replicated compositionally: the alveolar-macrophage fraction contracted (median 29.1% to 22.5%; MWU p=0.27, significant only via the anticorrelation) and anticorrelated with the SPP1+ programme across donors (Figure 2e; Spearman rho=-0.40; within IPF rho=-0.59, p=4.1×10⁻⁴). FABP4-CD10/MME covariation within AMs replicated (rho=0.38 versus 0.47 in Natri). The complement-loss pattern was not reproduced (phagocytosis/lipid-foam programmes rose); nor was MME depletion itself (detection rose within IM-like/MoMac-like compartments), so the CD10 anchor of the depleting pole is currently Natri-specific. COPD donors showed the mirror image (SPP1+ depleted, AM fraction increased). The donor-level module deltas are shown in Figure 2d; extended statistics and the COPD exploratory arm are in the supplementary material (supplementary Table S5 and Figure S5).
The Two Poles Are Mirrored by Interaction Rewiring and by Spatial Behaviour
Ligand-receptor deltas across the full disease atlas (curated pair set favouring IPF-literature axes) showed strengthened recruitment/fate-maintenance axes on one pole and attenuated homeostatic clearance circuits on the other (Figure 4a, Table 4). KRT5-/KRT17+ aberrant basaloid epithelium [3] strengthened FN1-ITGB1 signalling toward every macrophage compartment (IMs +1.32; MoMacs +1.33), and MoMacs strengthened SPP1-CD44 signalling toward all myeloid receivers including themselves (+1.06 to +1.23), consistent with an autocrine/paracrine amplifier; SPP1-CD44 signalling also strengthened from IMs toward pericytes (+1.23), coupling the macrophage programme to the perivascular fibrotic niche. Vascular and stromal recruitment cues strengthened in parallel (gCap ANXA1-FPR1 to monocytes +1.63; PLIN2+ fibroblast CXCL12-CXCR4 to inflammatory monocytes +1.18). On the depleting side, THBS1-CD36 signalling toward IMs attenuated from nearly every stromal and myeloid sender (-0.73 to -1.78), epithelial C3 complement circuits to IMs attenuated (C3-ITGAX -1.60; C3-C3AR1 -0.99), as did systemic-venous ICAM1-ITGB2 adhesion (-1.06). Because THBS1-CD36 participates in apoptotic-cell recognition [22] and SPP1-CD44 is an established pair [23], this pattern is consistent with coordinated weakening of efferocytosis/complement circuitry alongside strengthened matrix-adhesion/osteopontin circuitry; the functional direction of the attenuated edges remains open (profibrotic loss-of-function evidence exists for CD36, THBS1 and C1q in mouse [31,32,33]; Discussion).
Spatial analyses supported the same dichotomy (Figure 4b). In normal parenchyma, no cell type showed consistent supra-spot aggregation (nearest-neighbour-distance ratios 0.994-1.047 across all 80 cell types and three sections), and IM-rich spots lay closer to vessels than monocyte-rich or airway-macrophage-rich spots (median 396 versus 601 and 862 µm), supporting a perivascular IM niche; macrophages sat within a dispersed macrophage-DC-effector-lymphocyte co-localisation module (DC_2 rho up to 0.78).
Discussion
Our data support a bipolar displacement model of macrophage ecosystem remodelling in ILD, proceeding in two correlated phases: homeostatic-niche dissolution and pathological-niche construction (Figure 4c). In homeostasis, CD10+/FOLR2+ reservoir populations occupy perivascular niches, run complement/efferocytosis clearance via THBS1-CD36 circuitry [22] within a dispersed macrophage-DC-lymphocyte module. In disease, aberrant epithelial FN1-ITGB1 signalling strengthens while epithelial C3 and stromal THBS1-CD36 signalling attenuate, paralleling complement/phagocytic identity loss in IMs; an SPP1-CD44 autocrine loop strengthens in MoMacs, SPP1+ microclusters expand, and granuloma-like resident states are predicted to aggregate focally. Whether identity loss precedes expansion cannot be resolved cross-sectionally. The closest prior observation is the opposing regional shift of FABP4+ and SPP1+ fractions with pathology severity in the Vannan et al. atlas [29]; we extend this to a donor-level, statistically coupled replacement of reservoir microclusters by SPP1+ clusters across diagnoses, mirrored in interaction polarisation. In the independent IPF Cell Atlas, the expanding SPP1+ pole and its reservoir anticorrelation replicate at donor level, whereas programme-level identity loss is cohort-dependent [3].
Each pole replicates prior reports [1,2,3,4,9,10], and the mc11/mc26 signatures match published profibrotic programmes [2,10,24]. Four contributions go beyond these precedents. First, the 25-module framework makes gains and losses commensurable across ten diagnoses, exposing IMs, not AMs, as the most reprogrammed compartment and revealing the sarcoidosis exception [25,26]. Second, microcluster resolution adds candidate disease-specific states, anchored by the IPF-converging SPP1+ set (candidate mc26; mc11 and mc16 provisional across Leiden re-runs; Limitations) and the candidate IPF-specific OCSTAMP+ fusion-primed IM state mc29. Third, the depleting pole is quantified at donor level, generalising resident loss beyond the alveolar compartment [9]. Fourth, the interaction layer nominates a specific loss-side circuit (THBS1-CD36/C3 attenuation) whose direction is ambiguous [31,32,33] (homeostatic loss, protective adaptation, or both). The strengthened SPP1-CD44 and FN1-ITGB1 axes replicate circuitry reported in IPF and systemic sclerosis [1,2,3,23,24] with quantitative sender-to-receiver resolution; the dispersed-versus-aggregated dichotomy extends recent spatial atlases [27,28,29,30].
The model generates four falsifiable predictions ((i) and (iv) testable with public data): (i) on myeloid pseudotime, reservoir-to-pathology trajectories should show monotone MME/C1Q decline preceding SPP1/CHIT1 induction [10,11]; (ii) mc7 should sit upstream of mc11/mc26 on the monocyte-to-pathology trajectory; (iii) CD44 or ITGB1 blockade in IPF organoid/co-culture should reduce SPP1+CHIT1+ conversion and partially restore THBS1-CD36 communication; and (iv) mc29 (OCSTAMP+) signals should localise to fibroblastic foci and coincide with multinucleated giant cells, while tuberculosis granuloma cores, unlike sarcoidosis, should show a hypoxia-M1-necrosis triad [27,28,29,30,34].
Several limitations qualify these claims. All evidence is computational. Ligand-receptor deltas are correlational and lack resolved sender-versus-receiver attribution; donor-level disease-label permutation (n=200, myeloid 7×7 subset) confirmed the FN1-ITGB1 and SPP1-ITGB1 axes (empirical p=0.005, resolution floor; P3_lr_permutation.csv), but SPP1-CD44 was untested (CD44 outside the panel) and directionality remains descriptive. Compositional fractions are relative: a uniform-dilution null model excluded passive monocyte-influx dilution as the explanation of reservoir contraction (Results; P3_dilution_null.csv), but absolute cell counts remain untestable from fraction data and require flow cytometry; the IPF Cell Atlas anticorrelation likewise couples compositionally dependent quantities (shared denominator), and its control-arm attenuation (rho=-0.27, not significant) suggests a partially mechanical component. Donor age/sex/smoking and biopsy provenance were neither diagnosis-balanced nor adjusted for. Visium deconvolution smooths sub-spot heterogeneity; spatial evidence derives from normal-lung sections only; published IPF atlases [27,28,29,30] could test mc29’s predicted fibroblastic-focus localisation. The Human Lung Cell Atlas disease extension [35] and ILD bronchoalveolar lavage cohorts remain unused. Modules share genes (supplementary Table S2), so correlated shifts may partly reflect a shared resident-versus-monocyte latent axis. Sarcoidosis (four donors), IPAF, cHP and CWP (two-to-three donors) are underpowered at donor level (sarcoidosis also lacks external validation) and the corresponding microclusters remain candidates. The two-pole coupling is correlational; mc29 (343 cells) and homeostatic mc3 (purity 0.57) require doublet/technical-artifact exclusion. Leiden re-runs of the disease-atlas clustering (resolutions 1.0-2.5 x seeds 0-2; Figure 3f, supplementary material) reproduced the published partition exactly (ARI=1.0). Across the remaining re-runs, mc20, mc9 and (by the recall criterion) mc29 recurred in most or all partitions; mc11, mc16 and mc17 were intermediate (strict criterion 5/12, 4/12 and 3/12); mc26, mc15, mc22 and mc6 recovered inconsistently (2/12-3/12 strict; supplementary Figure S6) and treated as candidates. Donor-level effects propagated across re-runs: the four IPF-expansion microclusters and the reservoir supercluster were directionally concordant in 11/11 (supercluster significant in 9/11; P3_stability_inference.csv); mc15 remained partition-specific. Finally, MME concentrates in FABP4+ reservoir MoMacs in Natri but peaks in alveolar/interstitial annotations in Madissoon; cross-atlas reservoir claims require subtype-definition alignment: the reservoir-level contraction and within-compartment MME elevation are distinct quantities.
Conclusions
Across three atlases, spatial sections and a whole-atlas interaction screen, the ILD macrophage ecosystem exhibits a bipolar displacement of relative composition: donor-level contraction of a C1Q-high homeostatic reservoir, CD10/MME-high in its lipid-handling branch, coupled to disease-specific expansion of SPP1+ pathological programmes, with strengthened FN1-ITGB1/SPP1-CD44 axes and attenuated THBS1-CD36/C3 circuits of open functional direction (homeostatic loss versus protective adaptation). Framed as homeostatic-niche dissolution and pathological-niche construction, this model unifies prior single-pole observations and yields falsifiable predictions for lineage tracing and perturbation studies.
Supplementary Materials
The following supporting information can be downloaded at the website of this paper posted on Preprints.org. Supplementary Methods (extended dataset, scoring, clustering, cluster-stability, statistical, ligand-receptor, spatial, dilution-null-model and robustness-analysis details moved from the main text to meet the word limit); Supplementary Table S1: 25-module gene definitions; Supplementary Table S2: pairwise Jaccard overlap matrix of the 25 modules; Supplementary Table S3: leave-one-cohort-out batch scrutiny of IPF IM module deltas; Supplementary Table S4: permutation-background z-scores and empirical p-values for the six key IM modules; Supplementary Table S5: IPF Cell Atlas donor-level module deltas (IPF and COPD versus Control); Supplementary Table S6: donor-level inference propagation across re-run partitions; Supplementary Table S7: ligand-receptor donor-level permutation and direction-swap controls; Supplementary Table S8: uniform-dilution null model for the reservoir contraction; Supplementary Results (per-diagnosis module values, donor-mean reservoir shifts and extended spatial and interaction values moved from the main text); Supplementary Figures S1-S4: extended atlas, microcluster UMAPs, spatial behaviour and interaction heatmaps. Supplementary Figure S5: independent cross-validation of the bipolar displacement in the IPF Cell Atlas (GSE136831; module-delta and bipolar-anticorrelation panels also shown as main-text Figure 2d,e). Supplementary Figure S6: Leiden re-run stability dashboard (microcluster recall/precision across twelve re-run partitions, reproduction counts and stability tiers — the reproduction-count panel also shown as main-text Figure 3f — and donor-level inference propagation). Supplementary Data S1: machine-readable module definitions (macrophage_modules.json). Supplementary Data S2: module scores, microcluster annotations, donor-level enrichment, spatial and ligand-receptor tables (GF_, FI_, P3_, W2_ CSV series), the IPF Cell Atlas donor-level tables (P3_ipfatlas_*) and analysis scripts.
Author Contributions
Chen Shen conceived the study, performed the analyses and wrote the manuscript; Deze Li and Hao Chen contributed to data analysis and interpretation; all authors read and approved the final manuscript.
Funding
This work was supported by the Beijing Science and Technology Nova Program Interdisciplinary Project (20230484439). The funder had no role in study design, data collection, data analysis, data interpretation, or writing of the report.
Ethics Statement
This study is a secondary analysis of publicly available, de-identified datasets; no new human or animal data were collected, and institutional ethics approval was therefore not required.
Data Availability
All analyses use publicly available datasets: the Madissoon lung atlas [14]; the Natri ILD atlas [15] (GEO: GSE227136; the merged analysis object additionally incorporates Habermann 2020, GEO: GSE135893); the 10x Genomics PBMC 10k reference; Module definitions, scores and analysis tables are provided in Supplementary Data S1-S2 and in the analysis scripts archived with this submission (supplementary material).
Acknowledgments
The authors thank the investigators of the Madissoon, Natri and Habermann studies for making their data publicly available.
Conflicts of Interest
C. Shen has nothing to disclose. D. Li has nothing to disclose. H. Chen has nothing to disclose. X. Ni has nothing to disclose.
References
- Morse, C.; Tabib, T.; Sembrat, J.; et al. Proliferating SPP1/MERTK-expressing macrophages in idiopathic pulmonary fibrosis. Eur. Respir. J. 2019, 54, 1802441. [Google Scholar] [CrossRef] [PubMed]
- Reyfman, P.A.; Walter, J.M.; Joshi, N.; et al. Single-cell transcriptomic analysis of human lung provides insights into the pathobiology of pulmonary fibrosis. Am. J. Respir. Crit. Care Med. 2019, 199, 1517–1536. [Google Scholar] [CrossRef] [PubMed]
- Adams, T.S.; Schupp, J.C.; Poli, S.; et al. Single-cell RNA-seq reveals ectopic and aberrant lung-resident cell populations in idiopathic pulmonary fibrosis. Sci. Adv. 2020, 6, eaba1983. [Google Scholar] [CrossRef] [PubMed]
- Habermann, A.C.; Gutierrez, A.J.; Bui, L.T.; et al. Single-cell RNA sequencing reveals profibrotic roles of distinct epithelial and mesenchymal lineages in pulmonary fibrosis. Sci. Adv. 2020, 6, eaba1972. [Google Scholar] [CrossRef] [PubMed]
- Aegerter, H.; Lambrecht, B.N.; Jakubzick, C.V. Biology of lung macrophages in health and disease. Immunity 2022, 55, 1564–1580. [Google Scholar] [CrossRef] [PubMed]
- Chakarov, S.; Lim, H.Y.; Tan, L.; et al. Two distinct interstitial macrophage populations coexist across tissues in specific subtissular niches. Science 2019, 363, eaau0964. [Google Scholar] [CrossRef] [PubMed]
- Schyns, J.; Bai, Q.; Ruscitti, C.; et al. Non-classical tissue monocytes and two functionally distinct populations of interstitial macrophages populate the mouse lung. Nat. Commun. 2019, 10, 3964. [Google Scholar] [CrossRef] [PubMed]
- Evren, E.; Ringqvist, E.; Tripathi, K.P.; et al. Distinct developmental pathways from blood monocytes generate human lung macrophage diversity. Immunity 2021, 54, 259–275. e7. [Google Scholar] [CrossRef] [PubMed]
- Misharin, A.V.; Morales-Nebreda, L.; Reyfman, P.A.; et al. Monocyte-derived alveolar macrophages drive lung fibrosis and persist in the lung over the life span. J. Exp. Med. 2017, 214, 2387–2404. [Google Scholar] [CrossRef] [PubMed]
- Aran, D.; Looney, A.P.; Liu, L.; et al. Reference-based analysis of lung single-cell sequencing reveals a transitional profibrotic macrophage. Nat. Immunol. 2019, 20, 163–172. [Google Scholar] [CrossRef] [PubMed]
- Unterman, A.; Zhao, A.Y.; Neumark, N.; et al. Single-cell profiling reveals immune aberrations in progressive idiopathic pulmonary fibrosis. Am. J. Respir. Crit. Care Med. 2024, 210, 484–496. [Google Scholar] [CrossRef] [PubMed]
- Lavin, Y.; Winter, D.; Blecher-Gonen, R.; et al. Tissue-resident macrophage enhancer landscapes are shaped by the local microenvironment. Cell 2014, 159, 1312–1326. [Google Scholar] [CrossRef] [PubMed]
- Guilliams, M.; De Kleer, I.; Henri, S.; et al. Alveolar macrophages develop from fetal monocytes that differentiate into long-lived cells in the first week of life via GM-CSF. J. Exp. Med. 2013, 210, 1977–1992. [Google Scholar] [CrossRef] [PubMed]
- Madissoon, E.; Oliver, A.J.; Kleshchevnikov, V.; et al. A spatially resolved atlas of the human lung characterizes a gland-associated immune niche. Nat. Genet 2023, 55, 66–77. [Google Scholar] [CrossRef] [PubMed]
- Natri, H.M.; Del Azodi, C.B.; Peter, L.; et al. Cell-type-specific and disease-associated expression quantitative trait loci in the human lung. Nat. Genet 2024, 56, 595–604. [Google Scholar] [CrossRef] [PubMed]
- Wolf, F.A.; Angerer, P.; Theis, F.J. SCANPY: large-scale single-cell gene expression data analysis. Genome Biol. 2018, 19, 15. [Google Scholar] [CrossRef] [PubMed]
- Traag, V.A.; Waltman, L.; van Eck, N.J. From Louvain to Leiden: guaranteeing well-connected communities. Sci. Rep. 2019, 9, 5233. [Google Scholar] [CrossRef] [PubMed]
- Schneider, C.; Nobs, S.P.; Kurrer, M.; et al. Induction of the nuclear receptor PPAR-gamma by the cytokine GM-CSF is critical for the differentiation of fetal monocytes into alveolar macrophages. Nat. Immunol. 2014, 15, 1026–1037. [Google Scholar] [CrossRef] [PubMed]
- Yu, X.; Buttgereit, A.; Lelios, I.; et al. The cytokine TGF-beta promotes the development and homeostasis of alveolar macrophages. Immunity 2017, 47, 903–912.e4. [Google Scholar] [CrossRef] [PubMed]
- Mould, K.J.; Moore, C.M.; McManus, S.A.; et al. Airspace macrophages and monocytes exist in transcriptionally distinct subsets in healthy adults. Am. J. Respir. Crit. Care Med. 2021, 203, 946–956, GEO: GSE151928. [Google Scholar] [CrossRef] [PubMed]
- Hao, Y.; Hao, S.; Andersen-Nissen, E.; et al. Integrated analysis of multimodal single-cell data. Cell 2021, 184, 3573–3587.e29. [Google Scholar] [CrossRef] [PubMed]
- Savill, J.; Hogg, N.; Ren, Y.; et al. Thrombospondin cooperates with CD36 and the vitronectin receptor in macrophage recognition of neutrophils undergoing apoptosis. J. Clin. Invest 1992, 90, 1513–1522. [Google Scholar] [CrossRef] [PubMed]
- Weber, G.F.; Ashkar, S.; Glimcher, M.J.; Cantor, H. Receptor-ligand interaction between CD44 and osteopontin (Eta-1). Science 1996, 271, 509–512. [Google Scholar] [CrossRef] [PubMed]
- Valenzi, E.; Tabib, T.; Papazoglou, A.; et al. Disparate interferon signaling and shared aberrant basaloid cells in single-cell profiling of idiopathic pulmonary fibrosis and systemic sclerosis-associated interstitial lung disease. Front Immunol. 2021, 12, 595811. [Google Scholar] [CrossRef] [PubMed]
- Liao, S.Y.; Atif, S.M.; Mould, K.; et al. Single-cell RNA sequencing identifies macrophage transcriptional heterogeneities in granulomatous diseases. Eur. Respir. J. 2021, PMC: PMC8247459. [Google Scholar] [CrossRef] [PubMed]
- Vukmirovic, M.; Yan, X.; Gibson, K.F.; et al. Transcriptomics of bronchoalveolar lavage cells identifies new molecular endotypes of sarcoidosis. Eur. Respir. J. 2021, PMC: PMC9759791. [Google Scholar] [CrossRef] [PubMed]
- Franzén, L.; Olsson Lindvall, M.; Hühn, M.; et al. Mapping spatially resolved transcriptomes in human and mouse pulmonary fibrosis. Nat. Genet 2024, 56, 1725–1736. [Google Scholar] [CrossRef] [PubMed]
- Mayr, C.H.; Santacruz, D.; et al. Spatial transcriptomic characterization of pathologic niches in idiopathic pulmonary fibrosis. Sci. Adv. 2024, 10, eadl5473. [Google Scholar] [PubMed]
- Vannan, A.; Lyu, R.; Williams, A.L.; et al. Spatial transcriptomics identifies molecular niche dysregulation associated with distal lung remodeling in pulmonary fibrosis. Nat. Genet 2025, 57, 647–658. [Google Scholar] [CrossRef] [PubMed]
- Watanabe, N.; Yoshida, M.; Hirano, Y.; et al. Integrated spatial and single-cell transcriptomics reveal PAK kinase as a therapeutic target in fibroblastic foci and dense fibrosis of idiopathic pulmonary fibrosis. Eur. Respir. J. 2025, 66, 2500022. [Google Scholar] [CrossRef] [PubMed]
- Parks, B.W.; Black, L.L.; Zimmerman, K.A.; et al. CD36, but not G2A, modulates efferocytosis, inflammation, and fibrosis following bleomycin-induced lung injury. J. Lipid Res. 2013, 54, 1114–1123. [Google Scholar] [CrossRef] [PubMed]
- Murphy-Ullrich, J.E.; Poczatek, M. Activation of latent TGF-beta by thrombospondin-1: mechanisms and physiology. Cytokine Growth Factor Rev. 2000, 11, 59–69. [Google Scholar] [CrossRef] [PubMed]
- Ogawa, T.; Shichino, S.; Ueha, S.; Bando, K.; Matsushima, K. Profibrotic properties of C1q+ interstitial macrophages in silica-induced pulmonary fibrosis in mice. Biochem Biophys. Res. Commun. 2022, 599, 113–119. [Google Scholar] [CrossRef] [PubMed]
- McCaffrey, E.F.; Donato, M.; Keren, L.; et al. The immunoregulatory landscape of human tuberculosis granulomas. Nat. Immunol. 2022, 23, 318–329. [Google Scholar] [CrossRef] [PubMed]
- Sikkema, L.; Ramírez-Suástegui, C.; Strobl, D.C.; et al. An integrated cell atlas of the lung in health and disease. Nat. Med. 2023, 29, 1563–1577. [Google Scholar] [CrossRef] [PubMed]
- Xue, J.; Schmidt, S.V.; Sander, J.; et al. Transcriptome-based network analysis reveals a spectrum model of human macrophage activation. Immunity 2014, 40, 274–288. [Google Scholar] [CrossRef] [PubMed]
Figure 1.
A curated 25-module framework resolves homeostatic division of labour and the blood baseline. (a) Module-score heatmap across 15 homeostatic lung myeloid subtypes (Madissoon atlas, 40,634 cells; module names abbreviated: Angio=Angiogenesis_Support, AP=Antigen_Presentation, Chemok=Chemokine_Recruitment, Compl=Complement_System, Effer=Efferocytosis, Granul=Granuloma_Program, Hypox=Hypoxia_Response, IFN=IFN_Response, Inflam=Inflammatory_M1like, Iron=Iron_Handling, Lipid=Lipid_Foam, Matrix=Matrix_Remodeling, Phago=Phagocytosis_Core, Prolif=Proliferation, Resol=Resolution_M2like, Senesc=Senescence_SASP, Fusion=Fusion_Multinucleation, Actin=Morph_ActinAdhesion, Lyso=Morph_LysosomalMass, NucLam=Morph_NuclearLamina, TF=TF_Macrophage): interferon-primed IMs, complement/phagocytosis-high intravascular macrophages, lipid/iron-handling AMs, a granuloma-like Macro_CHIT1 resident subtype, and antigen-presentation-high dendritic cells (positive control). (b) The three gated blood monocyte subsets (1,582 cells) reproduce known subset biology while tissue-resident programmes (Lipid_Foam, Granuloma_Program, Fusion_Multinucleation) are silent, indicating post-entry niche induction. (c) Schematic of the 25-module system: 16 functional programmes, 3 morphology-proxy programmes, 4 identity modules and 1 master-regulator set, with the fusion/multinucleation module dual-classed across the functional and morphology-proxy categories but counted once in the total of 25.
Figure 1.
A curated 25-module framework resolves homeostatic division of labour and the blood baseline. (a) Module-score heatmap across 15 homeostatic lung myeloid subtypes (Madissoon atlas, 40,634 cells; module names abbreviated: Angio=Angiogenesis_Support, AP=Antigen_Presentation, Chemok=Chemokine_Recruitment, Compl=Complement_System, Effer=Efferocytosis, Granul=Granuloma_Program, Hypox=Hypoxia_Response, IFN=IFN_Response, Inflam=Inflammatory_M1like, Iron=Iron_Handling, Lipid=Lipid_Foam, Matrix=Matrix_Remodeling, Phago=Phagocytosis_Core, Prolif=Proliferation, Resol=Resolution_M2like, Senesc=Senescence_SASP, Fusion=Fusion_Multinucleation, Actin=Morph_ActinAdhesion, Lyso=Morph_LysosomalMass, NucLam=Morph_NuclearLamina, TF=TF_Macrophage): interferon-primed IMs, complement/phagocytosis-high intravascular macrophages, lipid/iron-handling AMs, a granuloma-like Macro_CHIT1 resident subtype, and antigen-presentation-high dendritic cells (positive control). (b) The three gated blood monocyte subsets (1,582 cells) reproduce known subset biology while tissue-resident programmes (Lipid_Foam, Granuloma_Program, Fusion_Multinucleation) are silent, indicating post-entry niche induction. (c) Schematic of the 25-module system: 16 functional programmes, 3 morphology-proxy programmes, 4 identity modules and 1 master-regulator set, with the fusion/multinucleation module dual-classed across the functional and morphology-proxy categories but counted once in the total of 25.
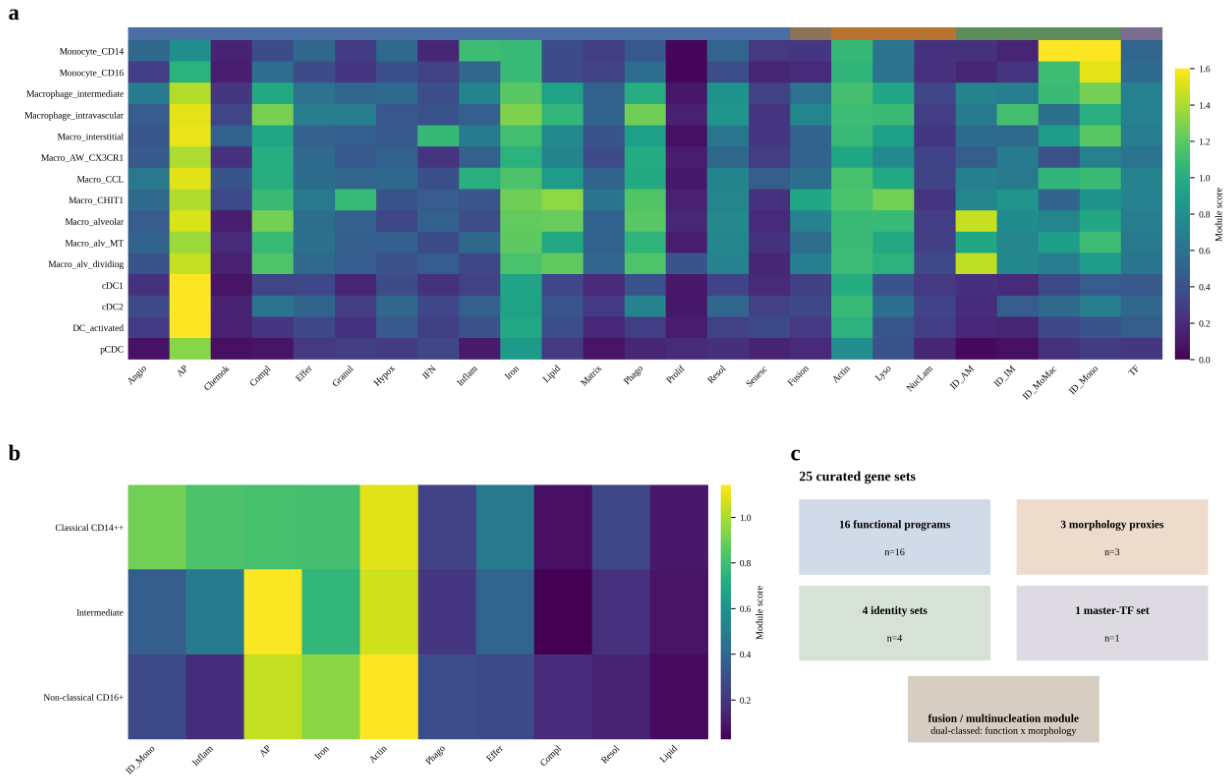
Figure 2.
Disease reprogramming is most extensive in interstitial macrophages. (a) Delta module scores (disease minus within-subtype Control) for the AM, IM and MoMac compartments across eight key modules and nine ILD diagnoses in the Natri atlas (175,426 cells, 118 donors; module abbreviations as in Figure 1a): IMs gain Granuloma_Program in all nine diagnoses and lose Complement_System/Phagocytosis_Core across fibrotic ILDs; MoMacs show broad complement attenuation; AM programmes are comparatively stable. Natri module-level deltas are cell-level descriptive quantities; donor-level inference for the bipolar claim is carried by the independent IPF Cell Atlas (d). (b) The sarcoidosis exception: IMs retain complement (+0.08) and phagocytosis (+0.01) while gaining the most antigen presentation (+0.31). (c) Robustness analyses for the six key IM modules in IPF: leave-one-cohort-out directional concordance (12/12 tests unchanged upon excluding either non-primary constituent cohort; the Habermann 2020 exclusion is the only fully independent-cohort test) and permutation-background z-scores (bars labelled with rounded z and empirical p; asterisks mark empirical p<0.05; exact values in supplementary Table S4). (d) Independent-cohort replication in the IPF Cell Atlas (GSE136831; 32 IPF versus 28 Control donors): donor-level delta z-scores (IPF minus Control) for the 16 functional and 2 identity modules of the framework in all myeloid cells (* BH-FDR q<0.05); in interstitial-like macrophages, Granuloma_Program +0.47 and Matrix_Remodeling +0.33 (all-myeloid +0.33 and +0.24 respectively; FDR q<5×10⁻⁹) replicate the Natri findings, whereas complement loss does not (extended panels in supplementary Figure S5). (e) Donor-level bipolar anticorrelation in the IPF Cell Atlas: per-donor alveolar-macrophage fraction of myeloid cells versus SPP1+ detection rate among non-AM myeloid cells (Spearman rho=-0.40, p=2.5×10⁻⁴, n=78; within IPF rho=-0.59, p=4.1×10⁻⁴); COPD donors occupy the opposite pole (identical data in supplementary Figure S5a).
Figure 2.
Disease reprogramming is most extensive in interstitial macrophages. (a) Delta module scores (disease minus within-subtype Control) for the AM, IM and MoMac compartments across eight key modules and nine ILD diagnoses in the Natri atlas (175,426 cells, 118 donors; module abbreviations as in Figure 1a): IMs gain Granuloma_Program in all nine diagnoses and lose Complement_System/Phagocytosis_Core across fibrotic ILDs; MoMacs show broad complement attenuation; AM programmes are comparatively stable. Natri module-level deltas are cell-level descriptive quantities; donor-level inference for the bipolar claim is carried by the independent IPF Cell Atlas (d). (b) The sarcoidosis exception: IMs retain complement (+0.08) and phagocytosis (+0.01) while gaining the most antigen presentation (+0.31). (c) Robustness analyses for the six key IM modules in IPF: leave-one-cohort-out directional concordance (12/12 tests unchanged upon excluding either non-primary constituent cohort; the Habermann 2020 exclusion is the only fully independent-cohort test) and permutation-background z-scores (bars labelled with rounded z and empirical p; asterisks mark empirical p<0.05; exact values in supplementary Table S4). (d) Independent-cohort replication in the IPF Cell Atlas (GSE136831; 32 IPF versus 28 Control donors): donor-level delta z-scores (IPF minus Control) for the 16 functional and 2 identity modules of the framework in all myeloid cells (* BH-FDR q<0.05); in interstitial-like macrophages, Granuloma_Program +0.47 and Matrix_Remodeling +0.33 (all-myeloid +0.33 and +0.24 respectively; FDR q<5×10⁻⁹) replicate the Natri findings, whereas complement loss does not (extended panels in supplementary Figure S5). (e) Donor-level bipolar anticorrelation in the IPF Cell Atlas: per-donor alveolar-macrophage fraction of myeloid cells versus SPP1+ detection rate among non-AM myeloid cells (Spearman rho=-0.40, p=2.5×10⁻⁴, n=78; within IPF rho=-0.59, p=4.1×10⁻⁴); COPD donors occupy the opposite pole (identical data in supplementary Figure S5a).
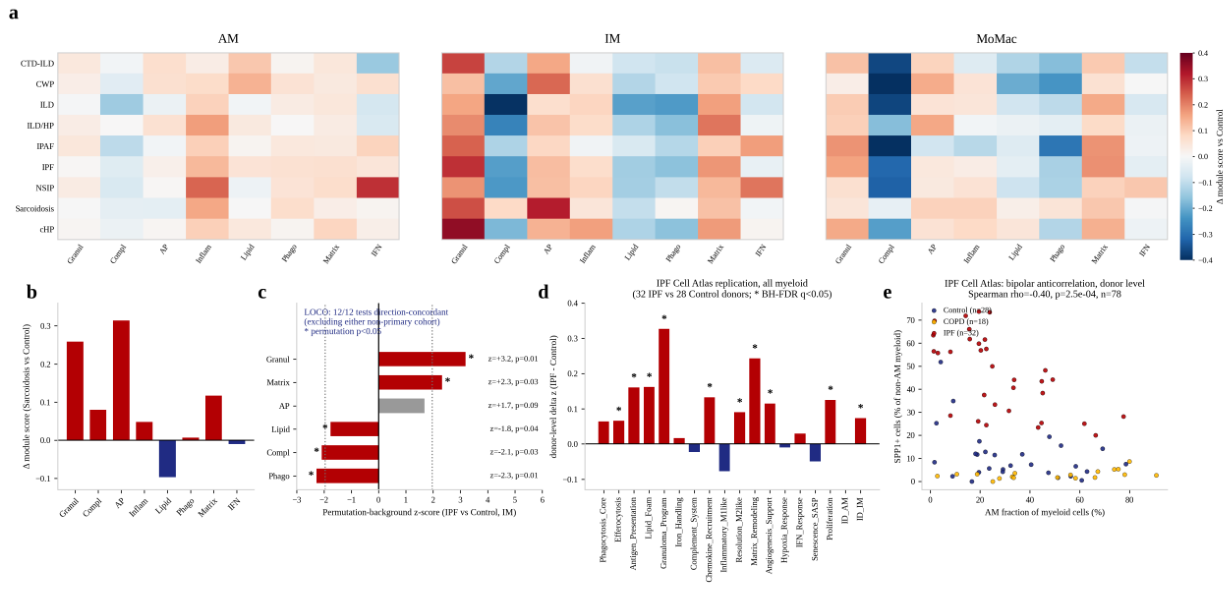
Figure 3.
Microcluster-level bipolar displacement of relative composition. (a) Disease-enrichment map (log2 odds ratio, Fisher) of 30 Natri microclusters across Control and nine ILD diagnoses (rows labelled by microcluster, dominant parent type and top markers): a Control-enriched homeostatic reservoir (mc17/mc20/mc15/mc9) versus disease-specific expansions (IPF mc26/mc11/mc29; IPAF mc7; CWP mc10; NSIP/cHP mc14; candidate sarcoidosis mc21/mc2). (b) Donor-level composition shifts in IPF (39 versus 51 donors): log2 ratio of donor-median fractions (IPF versus Control) for expanding (red) and depleting (blue) microclusters, with Mann-Whitney p-values (labels rounded to one significant digit; exact values in Table 3 and Supplementary Data S2; asterisks mark tests surviving the Bonferroni sensitivity threshold of 1.7×10⁻³); ratios are computed on donor-median fractions with a small pseudocount, and mc29 (Control median 0) is therefore not plotted. Dots show the per-donor log2 ratios underlying each bar (IPF red, Control navy; values beyond the axis limits are drawn as edge triangles). (c) Reservoir contraction: donor-median shift (percentage points of myeloid cells versus Control) for the four reservoir microclusters in the four diagnoses with at least four donors (ILD, IPF, NSIP, sarcoidosis; descriptive donor-median summary); dots show per-donor shifts; all shifts are negative (directionally concordant across correlated clusters and diagnoses). (d) Gene-level opposition of the poles (mean expression): MME/CD163/C1QA high in reservoir microclusters, SPP1/CHIT1/OCSTAMP high in IPF-converging microclusters; atlas-wide, MME is highest in the AM-like mc27 and the NSIP/cHP-converging mc14, qualifying the opposition as IPF-specific. (e) Uniform-dilution null model for the reservoir contraction: observed contraction ratios (IPF/Control donor-median fraction) of the 12 comparison-set microclusters against the null expectation of 1.033 (dashed red line; monocyte/MoMac share did not increase, 57.0% versus 60.4%); reservoir microclusters (teal, 0.098-0.410) contract 2.5- to 10.5-fold beyond the null (donor-level paired Wilcoxon p=6.3×10⁻⁶; cluster-label permutation p=0.0042; Supplementary Table S8). (f) Leiden re-run stability of the headline microclusters (12 re-runs, resolutions 1.0-2.5 x seeds 0-2; the reference run, res 2.0 seed 0, reproduces the published partition exactly, ARI=1.000): reproduction counts under the recall >=0.70 (solid bars) and strict recall >=0.70/precision >=0.50 (hatched bars) criteria, with the candidate-demotion threshold (<=4/12, dashed red line) and the resulting stability tiers; mc26, mc15, mc22 and mc6 fall below the threshold and are treated as candidates at microcluster resolution (identical data in supplementary Figure S6c; the full dashboard with recall/precision matrices and donor-level inference propagation is in supplementary Figure S6).
Figure 3.
Microcluster-level bipolar displacement of relative composition. (a) Disease-enrichment map (log2 odds ratio, Fisher) of 30 Natri microclusters across Control and nine ILD diagnoses (rows labelled by microcluster, dominant parent type and top markers): a Control-enriched homeostatic reservoir (mc17/mc20/mc15/mc9) versus disease-specific expansions (IPF mc26/mc11/mc29; IPAF mc7; CWP mc10; NSIP/cHP mc14; candidate sarcoidosis mc21/mc2). (b) Donor-level composition shifts in IPF (39 versus 51 donors): log2 ratio of donor-median fractions (IPF versus Control) for expanding (red) and depleting (blue) microclusters, with Mann-Whitney p-values (labels rounded to one significant digit; exact values in Table 3 and Supplementary Data S2; asterisks mark tests surviving the Bonferroni sensitivity threshold of 1.7×10⁻³); ratios are computed on donor-median fractions with a small pseudocount, and mc29 (Control median 0) is therefore not plotted. Dots show the per-donor log2 ratios underlying each bar (IPF red, Control navy; values beyond the axis limits are drawn as edge triangles). (c) Reservoir contraction: donor-median shift (percentage points of myeloid cells versus Control) for the four reservoir microclusters in the four diagnoses with at least four donors (ILD, IPF, NSIP, sarcoidosis; descriptive donor-median summary); dots show per-donor shifts; all shifts are negative (directionally concordant across correlated clusters and diagnoses). (d) Gene-level opposition of the poles (mean expression): MME/CD163/C1QA high in reservoir microclusters, SPP1/CHIT1/OCSTAMP high in IPF-converging microclusters; atlas-wide, MME is highest in the AM-like mc27 and the NSIP/cHP-converging mc14, qualifying the opposition as IPF-specific. (e) Uniform-dilution null model for the reservoir contraction: observed contraction ratios (IPF/Control donor-median fraction) of the 12 comparison-set microclusters against the null expectation of 1.033 (dashed red line; monocyte/MoMac share did not increase, 57.0% versus 60.4%); reservoir microclusters (teal, 0.098-0.410) contract 2.5- to 10.5-fold beyond the null (donor-level paired Wilcoxon p=6.3×10⁻⁶; cluster-label permutation p=0.0042; Supplementary Table S8). (f) Leiden re-run stability of the headline microclusters (12 re-runs, resolutions 1.0-2.5 x seeds 0-2; the reference run, res 2.0 seed 0, reproduces the published partition exactly, ARI=1.000): reproduction counts under the recall >=0.70 (solid bars) and strict recall >=0.70/precision >=0.50 (hatched bars) criteria, with the candidate-demotion threshold (<=4/12, dashed red line) and the resulting stability tiers; mc26, mc15, mc22 and mc6 fall below the threshold and are treated as candidates at microcluster resolution (identical data in supplementary Figure S6c; the full dashboard with recall/precision matrices and donor-level inference propagation is in supplementary Figure S6).
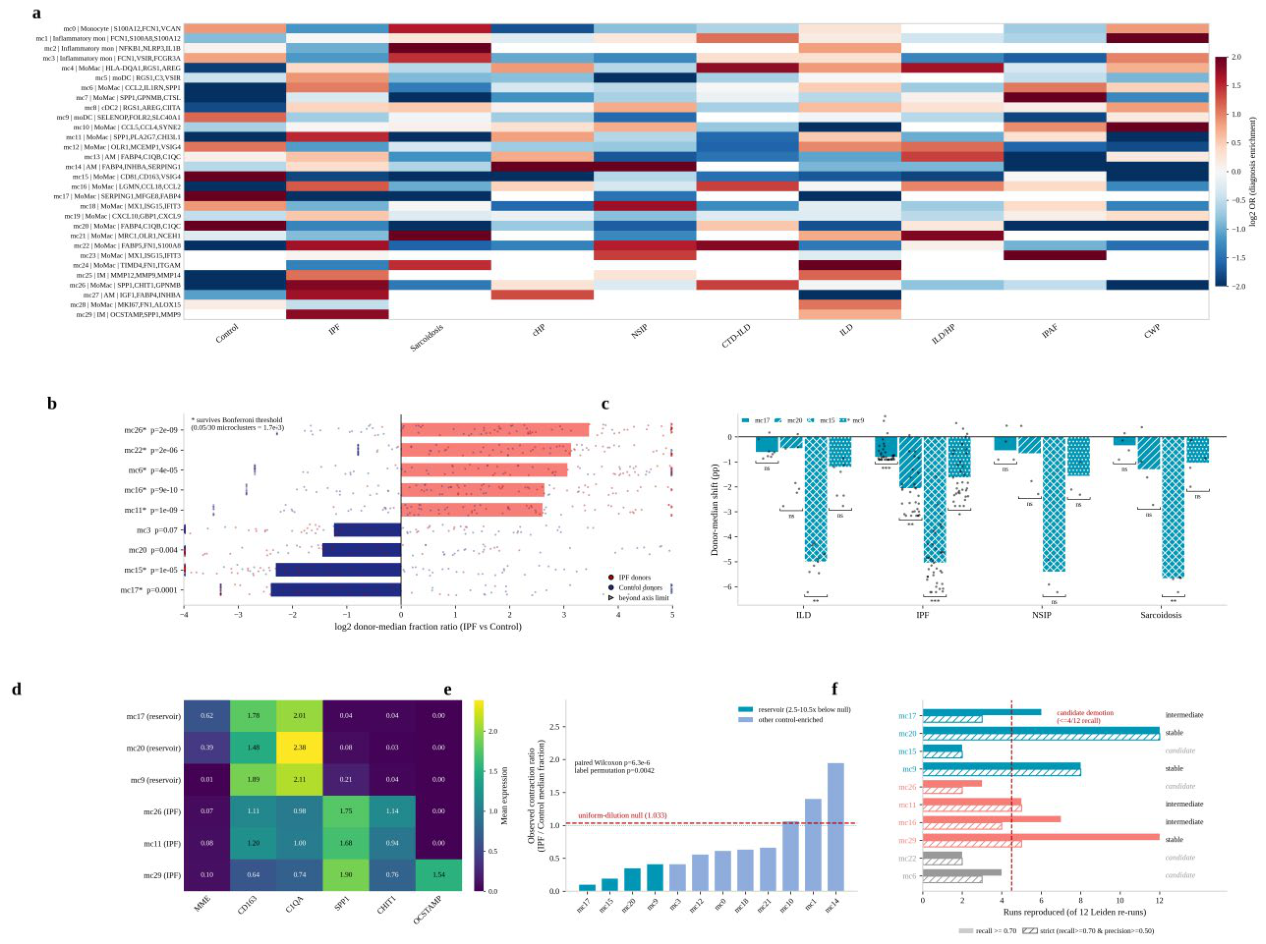
Figure 4.
Interaction rewiring and spatial behaviour mirror the two poles. (a) Disease-minus-Control ligand-receptor deltas for macrophage-receiving edges (195,994 edges screened): strengthened KRT5-/KRT17+ FN1-ITGB1, MoMac SPP1-CD44 (autocrine/paracrine) and gCap ANXA1-FPR1 axes (red); attenuated THBS1-CD36 (multiple senders to IMs), C3-ITGAX/C3-C3AR1 and ICAM1-ITGB2 edges (blue). Deltas are correlational; the permutation-tested control for the myeloid subset is shown in (d) († SPP1-CD44 could not be permutation-tested because CD44 is outside the 264-gene scoring panel). (b) Homeostatic spatial behaviour (three normal parenchyma Visium sections): nearest-neighbour-distance ratios (real/null) near unity across all 80 cell types (no supra-spot aggregation), plotted against mean fraction per spot (grey dots: individual sections; navy dots: three-section means). (c) The bipolar displacement model: a CD10+/C1Q+ homeostatic reservoir (mc17/mc20/mc15/mc9) undergoes displacement by SPP1+ pathological expansion states (mc26/mc11/mc7/mc29), coupled to gained FN1-ITGB1/SPP1-CD44 and weakened THBS1-CD36/C3 interaction axes. (d) Donor-level permutation control (200 disease-label permutations, myeloid 7×7 edge subset): observed deltas versus permutation null means (±1.96 sd) for the FN1-ITGB1 and SPP1-ITGB1 axes (red: empirical p<0.05, the 0.005 resolution floor; grey: not significant; diamonds: axis means, both significant at p=0.005, marked *) — 42/49 FN1-ITGB1 and 49/49 SPP1-ITGB1 edges exceed their nulls (Supplementary Table S7).
Figure 4.
Interaction rewiring and spatial behaviour mirror the two poles. (a) Disease-minus-Control ligand-receptor deltas for macrophage-receiving edges (195,994 edges screened): strengthened KRT5-/KRT17+ FN1-ITGB1, MoMac SPP1-CD44 (autocrine/paracrine) and gCap ANXA1-FPR1 axes (red); attenuated THBS1-CD36 (multiple senders to IMs), C3-ITGAX/C3-C3AR1 and ICAM1-ITGB2 edges (blue). Deltas are correlational; the permutation-tested control for the myeloid subset is shown in (d) († SPP1-CD44 could not be permutation-tested because CD44 is outside the 264-gene scoring panel). (b) Homeostatic spatial behaviour (three normal parenchyma Visium sections): nearest-neighbour-distance ratios (real/null) near unity across all 80 cell types (no supra-spot aggregation), plotted against mean fraction per spot (grey dots: individual sections; navy dots: three-section means). (c) The bipolar displacement model: a CD10+/C1Q+ homeostatic reservoir (mc17/mc20/mc15/mc9) undergoes displacement by SPP1+ pathological expansion states (mc26/mc11/mc7/mc29), coupled to gained FN1-ITGB1/SPP1-CD44 and weakened THBS1-CD36/C3 interaction axes. (d) Donor-level permutation control (200 disease-label permutations, myeloid 7×7 edge subset): observed deltas versus permutation null means (±1.96 sd) for the FN1-ITGB1 and SPP1-ITGB1 axes (red: empirical p<0.05, the 0.005 resolution floor; grey: not significant; diamonds: axis means, both significant at p=0.005, marked *) — 42/49 FN1-ITGB1 and 49/49 SPP1-ITGB1 edges exceed their nulls (Supplementary Table S7).
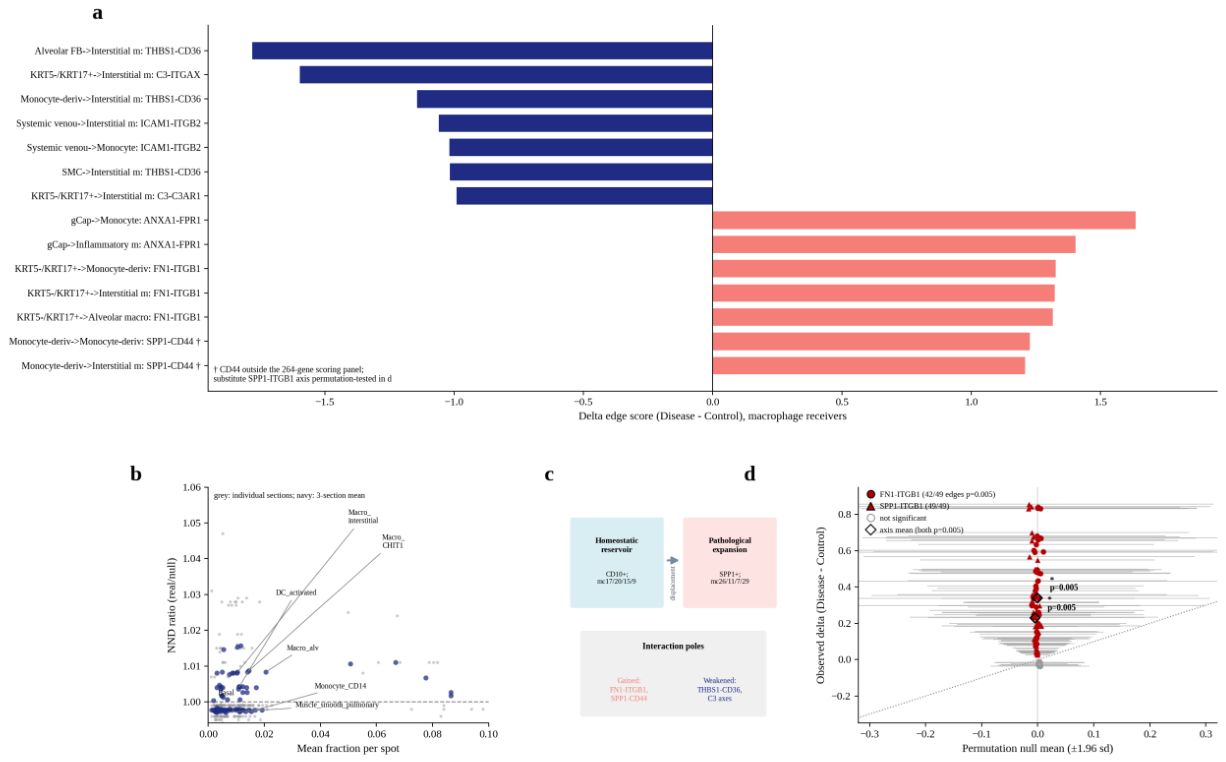

Table 1.
Datasets used in this study.
| Dataset | Type | Scale | Analysis axes | Reference |
|---|---|---|---|---|
| Madissoon lung atlas (myeloid subset) | scRNA-seq, normal lung | 40,634 cells, 15 subtypes | Subtype x 25 modules; 43 microclusters | [14] |
| 10x PBMC 10k (gated monocytes) | scRNA-seq, blood | 1,582 monocytes, 3 subsets | Subset x 25 modules | 10x Genomics |
| Natri ILD atlas (myeloid subset) | scRNA-seq, diseased/control lung | 175,426 cells, 118 donors, 7 myeloid types, 10 diagnostic groups | Type x diagnosis x 25 modules; 30 microclusters; donor-level tests | [15] |
| Madissoon Visium parenchyma | Spatial transcriptomics | 3 sections, 7,851 tissue spots | Spot modules x 80-type deconvolution; NND; co-localisation; anchor distances | [14] |
| Natri full-atlas ligand-receptor screen | scRNA-seq, all cell types | 113 curated ligand-receptor pairs (106 scored), 195,994 edges | Control versus Disease deltas, macrophage receivers | [15] |
Table 2.
Module-level reprogramming of interstitial macrophages across ILD diagnoses (delta versus within-subtype Control; Natri atlas).
Table 2.
Module-level reprogramming of interstitial macrophages across ILD diagnoses (delta versus within-subtype Control; Natri atlas).
| Module | Direction | Largest changes |
|---|---|---|
| Granuloma_Program | Gain, all 9 ILDs | cHP +0.35; IPF +0.29; CTD-ILD +0.27; Sarcoidosis +0.26; IPAF +0.24 |
| Antigen_Presentation | Gain | Sarcoidosis +0.31; CWP +0.23; CTD-ILD +0.16 |
| Matrix_Remodeling | Gain | ILD/HP +0.21; IPF +0.18; cHP +0.17 |
| Complement_System | Loss (fibrotic ILDs) | ILD -0.39; ILD/HP -0.27; NSIP -0.23; IPF -0.22; Sarcoidosis retained +0.08 |
| Phagocytosis_Core | Loss | ILD -0.23; ILD/HP -0.17; cHP -0.16; IPF -0.16; Sarcoidosis retained +0.01 |
| Lipid_Foam | Loss | ILD -0.22; IPF -0.14 |
Note. The Granuloma_Program module denotes a chitinase/lysosomal transcriptional programme enriched in granulomatous tissue (genes: CHIT1, CHI3L1, ACE, MMP9, CTSK, SPP1, PLA2G7, LAMP1, LAMP2, CTSB), not a histological diagnosis; its elevation in non-granulomatous ILDs (e.g., IPF) reflects the shared CHIT1/CHI3L1 scar-associated axis.
Table 3.
Key microclusters: definitions, enrichment and donor-level composition.
| Microcluster | Composition | Top markers | Enrichment (cell-level OR) | Donor-level (disease versus Control; MWU p) |
|---|---|---|---|---|
| mc17 | MoMac 63% | SERPING1, MFGE8, FABP4, C1QB, PPARG | Control OR=28.7 | Depleted in IPF: 0.09% versus 0.90%, p=1.1×10⁻⁴ |
| mc20 | MoMac 66% | FABP4, C1QA/B/C, APOE, MARCO | Control OR=5.4 | Depleted in IPF: 1.09% versus 3.15%, p=4.2×10⁻³ |
| mc15 | MoMac 94% | CD81, CD163, VSIG4, GPNMB, APOE | Control OR=6.7 | Depleted in IPF: 1.18% versus 6.22%, p=1.2×10⁻⁵ |
| mc9 | moDC/IM mix (FOLR2+ homeostatic IM signature; parent purity 0.40) | SELENOP, FOLR2, SLC40A1, LYVE1, MAF | Control OR=2.2 | Depleted in IPF: 1.13% versus 2.76%, p=1.1×10⁻² |
| mc26 | MoMac 71% | SPP1, CHIT1, GPNMB, CCL18, PLA2G7 | IPF OR=3.6 | Expanded in IPF: 5.3% versus 0.39%, p=1.6×10⁻⁹ |
| mc11 | MoMac 51% | SPP1, CHI3L1, CHIT1, MMP9, TREM2 | IPF OR=2.8 | Expanded in IPF: 6.6% versus 1.0%, p=1.2×10⁻⁹ |
| mc16 | MoMac 95% | LGMN, CCL18, CCL2, GPNMB, FOLR2, APOE, SPP1, C1QB | IPF OR=2.3 | Expanded in IPF: 4.4% versus 0.62%, p=9.0×10⁻¹⁰ |
| mc29 | IM 75% | OCSTAMP, SPP1, MMP9, CHI3L1, IL1RN, SERPINE1 | IPF OR=3.5 | Expanded in IPF: 0.20% versus 0%, p=1.9×10⁻⁹ (343 cells; candidate) |
| mc7 | MoMac 95% | SPP1, GPNMB, CTSL, APOE, MARCO, PLIN2, CD9 | IPAF OR=25.2 | 2 IPAF donors; candidate |
| mc10 | MoMac 54% | CCL5, CCL4, MT2A, KLF2 | CWP OR=7.4 | 3 CWP donors; candidate |
| mc14 | AM 56% | FABP4, SCD, LPL, ABCG1, PPARG | NSIP OR=5.1; cHP OR=4.5 | 4/2 donors; candidate |
| mc21 | MoMac 89% | MRC1, OLR1, NCEH1, LRP1, MSR1, TFRC | Sarcoidosis OR=8.3 | Not donor-supported (p=0.66, 4 donors); candidate |
| mc2 | Inflammatory monocyte 67% | NFKB1, NLRP3, IL1B, AREG, EREG | Sarcoidosis OR=7.7 | Not donor-supported (p=0.21, 4 donors); candidate |
Note. MWU p-values are uncorrected; under a Bonferroni threshold of 1.7×10⁻³ (30 microclusters), all four IPF expansions and the mc15/mc17 depletions remain significant, whereas the mc20 and mc9 depletions do not and are interpreted as directional. Leiden re-run scrutiny (resolutions 1.0-2.5 x seeds 0-2; Supplementary Data S2, P3_cluster_stability.csv) recovered mc20, mc9 and (by the recall criterion) mc29 in most or all re-runs but resolved mc26, mc15, mc22 and mc6 inconsistently; microcluster-level identity of the latter is candidate (Limitations).
Table 4.
Key ligand-receptor axes (disease versus Control deltas; macrophage receivers; correlational).
Table 4.
Key ligand-receptor axes (disease versus Control deltas; macrophage receivers; correlational).
| Axis | Sender to receiver | Control to Disease (delta) | Interpretation (model-level) |
|---|---|---|---|
| FN1-ITGB1 | KRT5-/KRT17+ epithelium to IM (+1.32), MoMac (+1.33), AM (+1.32) | 0.76 to 2.08 (IM) | Strengthened matrix-adhesion signalling from aberrant epithelium |
| SPP1-CD44 | MoMac to MoMac (+1.23), IM (+1.21), AM (+1.19); also IM to Pericyte (+1.23), MoMac to Mast (+1.26) | 0.41 to 1.63 (MoMac) | Strengthened autocrine/paracrine osteopontin circuitry |
| ANXA1-FPR1 | gCap to Monocyte (+1.63), Inflammatory monocyte (+1.40) | 1.66 to 3.30 | Strengthened vascular guidance cue |
| CXCL12-CXCR4 | PLIN2+ FB to Inflammatory monocyte (+1.18) | 1.05 to 2.24 | Strengthened stromal recruitment cue |
| MIF-CD74 | Venule to Monocyte (+1.18), IM (+1.06) | 3.12 to 4.31 | Strengthened vascular retention cue |
| THBS1-CD36 | Alveolar FB to IM (-1.78); MoMac to IM (-1.14); SMC to IM (-1.02); PLIN2+ FB to IM (-0.90); MyoFB to IM (-0.73) | 2.61 to 0.83 (Alveolar FB) | Attenuated efferocytosis/clearance circuitry toward IMs; direction open (protective adaptation possible [31,32,33]) |
| C3-ITGAX / C3-C3AR1 | KRT5-/KRT17+ to IM: -1.60 / -0.99 | 2.38 to 0.78 / 1.41 to 0.42 | Attenuated epithelial complement supply to IMs |
| ICAM1-ITGB2 | Systemic venous to IM (-1.06) | 2.64 to 1.58 | Attenuated vascular adhesion |
Disclaimer/Publisher’s Note: The statements, opinions and data contained in all publications are solely those of the individual author(s) and contributor(s) and not of MDPI and/or the editor(s). MDPI and/or the editor(s) disclaim responsibility for any injury to people or property resulting from any ideas, methods, instructions or products referred to in the content. |
© 2026 by the authors. Licensee MDPI, Basel, Switzerland. This article is an open access article distributed under the terms and conditions of the Creative Commons Attribution (CC BY) license.
Copyright: This open access article is published under a Creative Commons CC BY 4.0 license, which permit the free download, distribution, and reuse, provided that the author and preprint are cited in any reuse.