

Submitted:
01 November 2026
Posted:
04 November 2026
You are already at the latest version
Abstract
Background: The King-Devick Test (KDT) is widely used as an adjunct to concussion assessment, yet its measurement properties and diagnostic performance in female athletes from understudied contact sports remain unclear. Purpose: To evaluate the reliability, measurement error, and diagnostic performance of the KDT in women's flat-track roller derby (WFTRD) and women's rugby league (WRL). Study Design: Retrospective cohort study with an exploratory diagnostic comparison against same-day retest pseudo-controls. Methods: Data from 388 preseason baseline assessments (225 WFTRD, 163 WRL) and 52 clinician-diagnosed concussions were analysed across four seasons (2023-2026). Test-retest reliability was assessed using ICC(2,1), standard error of measurement (SEM), and minimal detectable change (MDC). Exploratory discrimination of clinician-confirmed concussion observations from same-day preseason retest variability was evaluated using receiver operating characteristic analysis and worsening thresholds. Results: The KDT demonstrated good test-retest reliability (ICC = 0.83), with similar performance across sports. A consistent practice effect was observed, with second baseline trials completed 2.52 s faster than first trials. The SEM was 3.98 s, corresponding to MDC values of 9.26-11.03 s. An exploratory, data-derived threshold for concussion identification (worsening ≥0.93 s) yielded 92.3% sensitivity (95% CI 81.8-97.0%) and 82.1% specificity (95% CI 77.7-85.9%) relative to same-day preseason retest observations, with a negative likelihood ratio of 0.09. Any worsening from baseline identified all concussion cases but reduced specificity. Continuous KDT worsening discriminated clinician-confirmed concussion cases from same-day preseason retest observations (AUC = 0.917); however, this estimate is exploratory and may be optimistic given the comparator group. In contrast, MDC-derived thresholds demonstrated high specificity but poor sensitivity. Conclusion: The KDT showed good same-day reliability and strong exploratory discrimination between clinician-confirmed concussion observations and same-day retest variability, although diagnostic accuracy estimates should be interpreted cautiously given the comparator group. Small declines from baseline were observed in most confirmed concussion events among athletes removed from play for suspected concussion. The KDT may be a valuable adjunct to multimodal concussion assessment but should not be used in isolation for diagnosis.
Keywords:
King-Devick Test
; concussion
; oculomotor screening
; test-retest reliability
; women's roller derby
; women's rugby league
1. Introduction
Described as “the most complicated disease of the most complex organ of the body”, [1] (p. 1208) concussion has become a major global concern in sport because of its potential long-term effects on brain function [2]. Sports-related concussion (SRC) occurs across a wide range of contact and collision sports, and current international consensus guidelines recommend a multifaceted assessment approach incorporating symptom evaluation, neurocognitive testing, balance assessment, and vestibular/oculomotor screening [3]. In practice, these domains are commonly evaluated using standardized tools such as the Sport Concussion Assessment Tool, 6th Edition (SCAT6) [3], or the more recently developed Brain Injury Screening Tool (BIST), [4,5], that provide a structured assessment of symptoms, cognition, and balance. However, neither tool provides an objective quantification of saccadic eye movement performance. Consequently, vision-based tools that assess saccadic eye movements have gained increasing attention as potential adjuncts to contemporary concussion assessment protocols. This interest stems from the recognition that saccadic control depends on distributed cortical networks that are frequently disrupted following brain trauma [6,7,8]. Oculomotor dysfunction is among the most robust discriminators of mild traumatic brain injury (mTBI), and one of the most commonly reported visual impairments following injury [9,10,11]. Because visual and oculomotor function depend on widely distributed brain networks, assessment of these pathways has been proposed as a means of improving concussion detection following injury [12,13].
One vision-based tool that has received considerable research attention is the King-Devick Test (KDT). Originally developed to assess oculomotor dysfunction and learning disabilities,[14] the KDT requires rapid verbalisation of single-digit numbers presented across a series of progressively more challenging test cards, with performance quantified as the cumulative time required to complete the task [15,16,17], Following validation in collegiate athlete and combat-sport populations, the KDT has subsequently been evaluated across a broad range of contact and collision sports, including several studies in rugby codes [15,18,19,20,21,22]. Collectively, this research supports the KDT as a rapid, low-cost adjunct to sideline concussion assessment, although reported reliability and diagnostic accuracy vary across populations, sports, and testing protocols [16,23]. For example, a recent prospective study of 97 concussed collegiate athletes and 97 matched controls reported test-retest reliability of 0.72, sensitivity of 81%, specificity of 56%, and an AUC of 0.75 for identifying concussion based on any worsening from baseline [24].
Despite the growing evidence base, female athletes remain substantially under-represented in the KDT literature, which has historically been derived predominantly from male cohorts participating in mainstream and comparatively well-resourced sports (e.g., American football, boxing, and rugby codes) [16,25]. This represents an important knowledge gap given documented sex-related differences in concussion incidence, symptom burden, and recovery trajectories [26]. Consequently, reliability estimates and diagnostic thresholds derived from predominantly male populations may not generalise directly to female athletes without independent validation. The gap is even more pronounced in emerging or non-mainstream women's contact sports. To our knowledge, no published study has evaluated KDT performance in flat-track roller derby, a full-contact sport with a predominantly female participant base and a recognised concussion risk profile [27]. Similarly, KDT data in female rugby league cohorts remain sparse compared with the broader male rugby league and rugby union literature [19,20,21,22,28].
A further source of heterogeneity within the KDT literature is the administration platform. The KDT was originally administered using spiral-bound paper test cards, but these are no longer commercially available and testing has progressively shifted toward tablet-based digital administration [23]. Emerging evidence suggests that these formats may not be directly interchangeable, with tablet administration producing systematically slower completion times than card administration in at least one large collegiate cohort [29]. Consistent administration on a single platform across multiple competitive seasons, as implemented in the present study, is uncommon in the existing literature and reduces this source of measurement heterogeneity.
Finally, existing KDT diagnostic studies often fail to distinguish between two conceptually distinct clinical applications: use as an independent screening tool (administered to all athletes regardless of observed signs to identify concussion that might otherwise be missed) and use as a confirmatory adjunct (administered after removal from play has already been triggered by independently observed signs to support a suspected diagnosis). These applications have important implications for the interpretation and clinical utility of diagnostic accuracy measures, including sensitivity, specificity, likelihood ratios, and diagnostic thresholds, yet the distinction is rarely made explicit in KDT literature. Consequently, important questions remain regarding the reliability, measurement error, and clinical interpretation of KDT performance in female contact-sport athletes.
The primary aim of this study was to evaluate the test-retest reliability, measurement error, and diagnostic performance of the King-Devick Test across four consecutive competitive seasons (2023-2026) in two understudied women's contact-sport cohorts, flat-track roller derby and rugby league, using a consistently administered digital platform. Diagnostic performance was evaluated within a confirmatory clinical pathway in which athletes had already been removed from play because of suspected concussion, rather than within a population-based screening context. A secondary aim was to consider the implications of this design for the interpretation and clinical application of KDT diagnostic thresholds and performance metrics.
2. Methods
This retrospective observational study examined King-Devick Test (KDT) results collected across four consecutive competitive seasons (2023-2026) in two women's contact sports, yielding a combined sample of 388 baseline assessments. A subset of athletes (n=52) sustained a clinician-diagnosed concussion during the study period and underwent post-concussion (PC) assessment.
2.1. Study Participants and Ethics
During the study period, 225 women's flat-track roller derby (WFTRD) and 163 women's rugby league (WRL) baseline assessments were completed. Post-concussion assessments were completed following 23 WFTRD and 29 WRL concussion events, with each assessment representing a unique concussion event. All WRL participants identified as female. The WFTRD cohort was drawn from a women's competition that permits participation by cisgender, transgender, intersex, and gender-expansive athletes in accordance with the governing organisation's eligibility policy.
The New Zealand Health and Disability Ethics Committee (HDEC) determined that the study was exempt from HDEC review and did not require HDEC approval (Ref: 2026 OOS 2683). The study was retrospective, was not pre-registered, and used a convenience sample. Therefore, no priori sample size calculation was performed. Injury severity and time-loss data were not collected. BIST and post-concussion KDT data were complete for all 52 concussion events.
Because individual identifiers were not retained in the WFTRD dataset, the number of unique participants, player turnover between seasons, recurrent concussion events, and subsequent new injuries could not be determined. In contrast, WRL roster data were available, with squad sizes of 62 (two teams), 31, 36, and 34 players in 2023, 2024, 2025, and 2026, respectively. Player retention between consecutive seasons was 10 players from 2023 to 2024, six from 2024 to 2025, and eight from 2025 to 2026.
2.2. King-Devick Test Administration
All players completed the King-Devick Test (KDT) during the preseason training period using standardized protocols [30]. The KDT is a rapid number-naming task that takes less than two minutes to administer [31]. Participants read aloud a sequence of single-digit numbers displayed on a screen from left to right that includes one demonstration card and three visually distinct test cards that increase in difficulty [15]. Completion time was recorded for each test card, with the KDT summary score representing the cumulative time required to complete all three test cards [32]. The number of errors made in reading test cards was recorded. The fastest error-free time from two trials conducted 5 minutes apart without errors became the established baseline K-D test time [18]. All baseline assessments were conducted during preseason training using the King-Devick iPad application (v5.6.02; King-Devick Technologies Inc.) in accordance with the manufacturer's recommendations and under standardized testing conditions [30].
2.3. Brain Injury Screening Tool
The Brain Injury Screening Tool (BIST) is a clinical instrument developed by the Auckland University of Technology Traumatic Brain Injury Network for the assessment and management of suspected brain injury in individuals aged ≥8 years [5]. The BIST includes questions relating to medical history, injury risk factors, symptom burden, and functional impact, and provides an indication of risk for prolonged recovery [5]. Previous studies have demonstrated evidence supporting the BIST's factor structure, construct validity, and test-retest reliability in adult populations [4,5]. The BIST was completed after the 10-minute observation period and before the KDT. Its symptom items and the observed signs that prompted review were used to describe the clinical presentation of the concussed athletes and to test whether symptom burden was associated with the magnitude of KDT worsening.
2.4. Concussion Definition
Concussion was defined as "a traumatic brain injury caused by a direct blow to the head, neck, or body resulting in an impulsive force being transmitted to the brain that occurs in sports and exercise-related activities" [3]. Cases were classified as witnessed when a potentially concussive event was observed during match play, resulting in removal from play and subsequent confirmation by clinical assessment.
2.5. Concussion Identification and Confirmatory King-Devick Test Protocol
Removal from play was determined using a multimodal sideline assessment protocol. Athletes were removed from participation when a visually observed impact or fall, player reaction, player movement, or observable clinical signs raised concern for concussion. Observable clinical signs included loss of consciousness, balance impairment, disorientation, confusion, delayed responses, behavioural change, and vacant stare. Following removal, athletes underwent a mandatory 10-minute observation period under the supervision of the team medic.
Identification of suspected concussion was reinforced by multiple independent observers in both sports. In WFTRD, two dedicated spotters and eight scrimmage referees monitored play. In WRL, observations could be reported by team medical staff, head and assistant trainers, the team manager, coach, touch referees, and the match referee.
The KDT was administered only after completion of the observation period and Brain Injury Screening Tool (BIST) assessment and was used solely as an adjunct to, rather than a determinant of, clinical decision-making. KDT performance did not trigger removal from play, and no athlete in this dataset was removed from participation or underwent post-injury testing in the absence of independently observed signs or symptoms consistent with suspected concussion. Consequently, the diagnostic analyses reported in this study reflect a confirmatory assessment pathway rather than a screening application of the KDT.
The results of the BIST and KDT were provided to participants, who were advised to share these findings with their general practitioner. Concussion diagnoses were subsequently made by the participant's general practitioner based on their own clinical assessment and management procedures.
Post-concussion KDT testing was completed on the day of injury following the observation period and BIST assessment. Consequently, the interval between baseline and post-concussion testing reflects the time elapsed between preseason assessment and injury occurrence. All post-concussion assessments were conducted by the team medic, who had access to baseline scores on a fully charged 9th-generation iPad that was routinely backed up. For each concussion event, BIST symptom data and the observed signs prompting clinical review were extracted for analysis.
2.6. Outcome Measures
The primary outcomes were: (1) Test-retest reliability of baseline KDT performance; (2) Measurement error, quantified as the standard error of measurement (SEM) and minimal detectable change (MDC) at the 90% (MDC90) and 95% (MDC95) confidence levels; and (3) Diagnostic performance of KDT worsening (post-concussion minus baseline score) against a reference standard of independently confirmed clinician-diagnosed concussion.
2.7. Statistical Analyses
2.7.1. Baseline Performance, Practice effects, Reliability, and Agreement
Descriptive statistics were calculated for Baseline 1 (BL1), BL2, and BL2 - BL1 difference scores. Normality was assessed using Shapiro-Wilk tests together with inspection of histograms and Q-Q plots (see Supplemental Table S1). Because several cohorts demonstrated departures from normality, both parametric (paired-samples t-tests) and non-parametric (Wilcoxon signed-rank tests) analyses were performed [33,34]. Data are summarised as mean ±SD and median [IQR]. Practice effects between BL1 and BL2 were quantified using paired-samples t-tests and Wilcoxon signed-rank tests. Standardised mean differences were expressed as Cohen's dz, interpreted using conventional thresholds proposed by Cohen [35]. Ninety-five percent confidence intervals for dz were calculated using the standard analytic approximation [36,37]. Holm-Bonferroni correction was applied to control the familywise error rate [38].
Reliability was assessed using a two-way random-effects, absolute-agreement, single-measures intraclass correlation coefficient [ICC(2,1)] [39,40]. ICCs are reported with corresponding F-statistics, degrees of freedom, and 95% confidence intervals. Between-sport reliability was compared using Feldt's test and bootstrap resampling (10,000 iterations) [41,42]. Measurement error was quantified using the standard error of measurement (SEM = SDpooled × √(1 − ICC)) and minimal detectable change (MDC) at the 90% and 95% confidence levels [43]. Confidence intervals for SEM and MDC estimates were obtained using non-parametric bootstrap resampling (3,000 iterations) [42]. Agreement between BL1 and BL2 was evaluated using Bland-Altman analysis, reporting mean bias and 95% limits of agreement [44]. Proportional bias was assessed using linear regression of the difference score on the mean score, with regression-based limits of agreement calculated where appropriate [45,46].
2.7.2. Longitudinal and Between-Sport Comparisons
Between-sport comparisons were performed using Welch's unequal-variance t-tests because group sizes differed between sports and heterogeneity of variance was anticipated [47,48]. Equality of variance was assessed using Levene's test, and Brown-Forsythe tests were used where appropriate [47,49]. Linear trends in reliability (Fisher z-transformed ICCs) and practice-effect magnitude (cohort mean differences) across the four competitive seasons were assessed using inverse-variance-weighted linear regression, with season coded as a continuous predictor (1-4) [50].
For pooled "TOTAL" and "Combined" estimates, heterogeneity across yearly cohorts was evaluated using Cochran's Q and I² statistics following Fisher z-transformation of cohort ICCs [51]. Where heterogeneity was present, DerSimonian-Laird random-effects pooled estimates were calculated as sensitivity analyses [52]. The same heterogeneity framework was applied to cohort-level practice-effect estimates. Holm-Bonferroni correction was applied where appropriate [38].
2.7.3. Diagnostic Accuracy
Diagnostic accuracy of KDT worsening (post-concussion minus baseline score) was evaluated using four pre-specified thresholds: MDC90, MDC95, and fixed thresholds of 3 s and 5 s. Comparator observations comprised same-day BL2-BL1 change scores from 336 baseline assessments without a linked concussion event. Because these observations represented test-retest variability rather than post-impact non-concussion controls, analyses were interpreted as exploratory discrimination of confirmed concussion observations from same-day retest variability rather than conventional diagnostic accuracy. Accordingly, specificity reflects the proportion of retest changes below each threshold.
Sensitivity, specificity, positive and negative predictive values, overall accuracy, likelihood ratios, and Youden's J were calculated for each threshold, with 95% confidence intervals estimated using the Wilson score method [53,54,55]. Any worsening (>0 s) and a Youden-optimal threshold were also evaluated. Because the Youden-optimal threshold was derived and tested within the same dataset, its performance was considered exploratory and internally validated using bootstrap optimism correction (2,000 stratified resamples) and repeated stratified 10-fold cross-validation (100 repetitions). Threshold stability was assessed from the distribution of bootstrap-derived thresholds. Predictive values are reported for completeness only because concussion prevalence was determined by the dataset rather than representative sampling.
Threshold classifications were compared using McNemar's test, with Holm-Bonferroni correction for multiple comparisons [56]. ROC analyses were performed using continuous KDT worsening scores. Areas under the curve (AUCs) and 95% confidence intervals were estimated using the DeLong method and tested against 0.50 [57,58,59]. AUCs were compared between sports using independent-sample z-tests based on DeLong standard errors.
All analyses treated baseline assessments and concussion events as independent observations. Because some athletes may have contributed assessments across multiple seasons and athlete identifiers were unavailable, confidence intervals may be underestimated and clustering by athlete could not be performed. To assess sensitivity to shared testing conditions, confidence intervals for reliability, measurement error, and discrimination were additionally estimated using a cluster bootstrap with testing session (sport × baseline date; 47 sessions) as the resampling unit (2,000 resamples). Diagnostic analyses were repeated after excluding 0-day and >150-day baseline-to-post-concussion intervals, stratified by interval tertile, and associations between interval and KDT worsening were examined using Spearman's rank correlation and the Kruskal-Wallis test.
2.7.4. Additional Analyses
For the concussed subgroup, the interval (days) between baseline and post-concussion assessment was compared with the same-day BL1-BL2 interval using a one-sample t-test [60]. Between-sport differences in testing intervals were assessed using Welch's t-tests, Mann-Whitney U tests, Brown-Forsythe tests, and Shapiro-Wilk tests as appropriate [47,48,49,61,62].
Concussion incidence was expressed per 1000 player-exposure hours (PEH), with 95% confidence intervals calculated using the exact Poisson method [63]. Match exposure was calculated from all competition matches completed during the study period (see Table 1), and all recorded concussion events occurred during these matches. Between-sport incidence was compared using incidence rate ratios (IRRs) with exact conditional confidence intervals. To facilitate risk communication, Poisson models were used to estimate the probability of sustaining at least one concussion during a match and across a typical season of participation.[64] These scenario estimates assume a constant hazard, independent events, and full participation and should not be interpreted as observed athlete risk.
Frequencies of BIST symptoms, symptom domains, and reasons for review were compared between sports using Fisher's exact tests with Holm-Bonferroni correction applied for multiple comparisons [38,65]. The number of symptoms endorsed, total symptom severity, and number of review reasons were compared using Mann-Whitney U tests, with Holm-Bonferroni correction applied across these comparisons [61]. Associations between BIST measures and KDT worsening (post-concussion minus baseline time) were assessed using Spearman rank correlation coefficients [66].
2.7.5. Software
All statistical analyses were conducted in Python (version 3.12.3; Python Software Foundation, 2025; www.python.org), using the NumPy [67], OpenPyXL [68], and SciPy [69] libraries and custom scripts. Statistical significance was set at p<0.05. Exact p-values are reported to three decimal places; values below 0.001 are reported as p<0.001
3. Results
After application of inclusion criteria, 388 baseline assessments were available for analysis. Of these tests, 203 were registered for one year, 85 were registered for two years, 54 were registered for three years and 46 were registered for four years. The combined scores for BL1 (mean: 52.08 ±10.01 s; median: 50.87 [46.01 to 56.45] s) were significantly slower than BL2 (mean 49.56 ±9.27 s; median 48.62 [43.47 to 53.72] s; t(387)=9.639; p<0.001). The representative baseline score for the combined sample was 48.86 ±9.16 s (median 47.71 [43.18 to 53.06] s) (see Table 2).
3.1. Practice Effect
A significant practice effect (BL2 faster than BL1) was observed in the combined sample (mean difference = -2.52 ±5.15 s; t(387)=9.64, p<0.001; Wilcoxon p<0.001) and in both pooled sport samples (WFTRD: -2.58 s; WRL: -2.44 s; both p<0.001) (see Table 2). Shapiro-Wilk testing indicated departures from normality in seven of the eight yearly cohorts (all except Rugby League 2024) and in all pooled samples (see Supplemental Table S1) therefore, both paired t-tests and Wilcoxon signed-rank tests were examined. Following Holm-Bonferroni correction, significant practice effects remained evident across all eight yearly cohorts. Practice-effect magnitude ranged from small to moderate (Cohen's dz = -0.298 to -0.655). No significant linear trends in reliability or practice-effect magnitude were observed across seasons in either sport (all p>0.34), indicating temporal stability across the four-year study period.
3.2. Reliability and Measurement Error
Test-retest reliability, assessed using ICC(2,1), ranged from moderate-to-excellent across all eight yearly cohorts (ICC(2,1)=0.709 to 0.956) (see Table 3). Pooled reliability estimates were similar between sports (WFTRD: ICC(2,1)=0.832 [95% CI: 0.710 to 0.890]; WRL: ICC(2,1)=0.822 [95% CI: 0.700 to 0.890]) and in the combined sample (ICC(2,1)=0.830 [95% CI: 0.710 to 0.890]). SEM ranged from 2.15 s to 4.75 s across cohorts, whereas MDC95 ranged from 5.96 s to 13.16 s. For the combined sample, SEM was 3.98 s (95% CI: 3.53 to 4.45), MDC90 was 9.26 s (95% CI: 8.20 to10.35), and MDC95 was 11.03 s (95% CI: 9.77 to 12.34). Pearson correlations between BL1 and BL2 were moderate-to-strong across all cohorts (r=0.740 to 0.964; all p<0.001). Significant heterogeneity in reliability was observed across rugby league cohorts (I²=85.2%, p=0.001) and across all cohorts combined (I²=73.9%, p<0.001), although random-effects pooled estimates were like primary pooled estimates (see Supplemental Table S2). In contrast, no significant heterogeneity was observed for practice-effect magnitude (all p>0.05). Session-clustered bootstrap confidence intervals were like the primary estimates (ICC(2,1): 0.769 to 0.875; SEM: 3.51 to 4.43 s; MDC90: 8.16 to 10.31 s; MDC95: 9.72 to 12.29 s), suggesting negligible influence of session-level clustering.
3.3. Agreement Analysis
Bland-Altman bias was negative across all cohorts, consistent with the observed practice effect (range: -1.38 to -3.05 s) (see Figure 1). In the combined sample, mean bias was −2.52 s with 95% limits of agreement ranging from -12.60 to 7.57 s. Proportional bias was identified in Roller Derby 2026, Roller Derby TOTAL, and the combined sample (all p<0.05), indicating greater disagreement at slower completion times.
Heteroscedasticity-adjusted limits of agreement demonstrated substantially wider disagreement among slower-performing athletes than among faster-performing athletes. In the combined sample, estimated limits widened from -7.47 to 5.49 s at the fastest observed scores to -19.16 to 7.24 s at the slowest. Similar findings were observed in Roller Derby 2026. These results indicate that test-retest variability was not constant across the range of KDT performance.
3.4. Between-Sport Comparisons
No significant between-sport differences were observed for test-retest reliability (Feldt p=0.714; bootstrap ICC difference = -0.009 [95% CI: -0.132 to 0.092]), practice-effect magnitude (corrected p=0.790), post-concussion worsening (corrected p=0.251), or diagnostic discrimination (p=0.304). Although WFTRD athletes demonstrated nominally faster baseline performance than WRL athletes, no between-sport differences remained significant following Holm-Bonferroni correction (all corrected p≥0.073; see Supplemental Table S3). These analyses did not detect a between-sport difference in KDT performance characteristics; they do not establish equivalence.
3.5. Confirmatory Concordance Between KDT and Clinical Assessment
BIST data were available for all 52 concussed athletes, who endorsed a mean of 5.2 ±2.0 symptoms and a total symptom severity score of 13.2 ±3.5 (see Supplemental Table S4). Headache (76.9%), neck pain (61.5%), loss of balance (53.8%), difficulty concentrating (51.9%), and confusion (51.9%) were the most reported symptoms, with cognitive symptoms present in 96.2% of athletes. WRL athletes reported a greater number of symptoms than WFTRD athletes (5.8 ±2.0 vs 4.5 ±1.9, Holm-adjusted p=0.0379), although total symptom severity and individual symptom domains did not differ significantly between sports after correction. Athletes were reviewed for a mean of 2.9 ± 1.0 observed signs, most commonly concern raised by others (48.1%), holding/shaking the head, balance difficulties, and being slow to get up (42.3% each), with no sport-specific differences and no association between symptom burden or severity and the magnitude of KDT worsening. All 52 athletes removed from play under the independent sideline protocol demonstrated worsening KDT performance relative to baseline (see Figure 2). All were subsequently diagnosed with concussion following independent medical assessment, indicating complete concordance between sideline removal and final clinical diagnosis. As the analysed dataset comprised only confirmed concussion events, this finding reflects concordance between removal and diagnosis rather than sensitivity among all athletes evaluated for suspected concussion.
3.6. Diagnostic Accuracy
Diagnostic performance of KDT worsening thresholds is summarised in Table 4. In the combined sample (52 concussion observations and 336 same-day retest pseudo-control observations), the in-sample Youden-optimal threshold (≥0.93 s worsening from baseline) yielded the highest Youden index (J=0.745 [95% CI: 0.661 to 0.828]), with sensitivity of 92.3% (95% CI: 81.8% to 97.0%), specificity of 82.1% (77.7%-85.9%), and a negative likelihood ratio of 0.09 (95% CI: 0.04 to 0.24). Any worsening (>0 s) identified all 52 concussion events (sensitivity 100%) but reduced specificity to 69.3%. Increasing the threshold improved specificity at the expense of sensitivity. MDC90 and MDC95 achieved the highest specificity (98.5% for both) but identified only 28.8% and 17.3% of concussion events, respectively. Fixed 3-s and 5-s thresholds produced intermediate performance (see Table 4). Similar patterns were observed within each sport, although sensitivity declined more markedly in rugby league than roller derby at higher thresholds.
Receiver operating characteristic analysis of continuous KDT worsening scores yielded an AUC of 0.917 (95% CI: 0.883 to 0.942) relative to the same-day retest comparator distribution (see Figure 3). Discrimination estimates were similar in roller derby (AUC=0.934) and rugby league (AUC=0.904), with no significant between-sport difference (ΔAUC=0.030, p=0.304). On internal validation, optimism in the Youden-optimal threshold was small. The bootstrap optimism-corrected sensitivity and specificity were 89.7% and 81.9% (Youden J=0.716; optimism 0.029) and repeated 10-fold cross-validation yielded mean sensitivity and specificity estimates of 90.3% (range 86.5% to 92.3%) and 81.9% (79.5% to 82.7%), respectively. The re-derived threshold varied across bootstrap resamples (median 0.93 s; 95% range 0.12 to 1.98 s) but was ≤2 s in 98.9% of resamples. Session-clustered bootstrap confidence intervals were like the primary estimates (AUC: 0.885 to 0.941; sensitivity at ≥0.93 s: 83.3% to 98.2%; specificity: 77.8% to 86.1%).
3.7. Comparison of Diagnostic Thresholds
McNemar analyses demonstrated significant differences between several threshold-based classification strategies. MDC90 and the fixed 3-s threshold produced significantly different classifications for both sensitivity and specificity following Holm-Bonferroni correction (both corrected p<0.001). MDC90 and the fixed 5-s threshold also differed significantly for sensitivity (corrected p=0.020) but not specificity. In contrast, the fixed 3-s and 5-s thresholds did not differ significantly with respect to sensitivity following correction, although specificity remained significantly different (corrected p<0.001). MDC90 and MDC95 produced discordant classifications in six concussion events but did not differ significantly following multiplicity adjustment (corrected p=0.125). These findings show that threshold selection materially influences diagnostic classification
3.8. Testing Interval Analysis
BL1 and BL2 were administered on the same calendar day for all 388 baseline assessments. Among the 52 concussion events, the interval between baseline and post-concussion assessment averaged 76.0 ±58.0 days and differed significantly from the same-day BL1-BL2 interval (p<0.001) (see Table 5). Similar findings were observed in both sports. Although mean testing intervals did not differ significantly between roller derby and rugby league (p=0.161), variability was substantially greater in roller derby (Brown-Forsythe p<0.001). The baseline-to-post-concussion interval was not associated with the magnitude of KDT worsening (Spearman's ρ=0.005, p=0.974), and KDT worsening did not differ across interval tertiles (0 to 47, 51 to 73, and 74 to 245 days; Kruskal-Wallis p=0.328). Excluding the single 0-day interval and eight intervals exceeding 150 days (43 concussion events remaining) produced similar results, with an AUC of 0.915 (95% CI: 0.884 to 0.943) and sensitivity of 93.0% (95% CI: 81.4% to 97.6%) at the ≥0.93 s threshold. Sensitivity within interval tertiles ranged from 88.2% to 94.4%.
3.9. Concussion Incidence and Risk Communication
Using recorded player-exposure totals, concussion incidence was 66.7 (95% CI: 42.3 to 100.0) and 70.8 (95% CI: 47.4 to 101.7) per 1,000 player-exposure hours (PEH) in roller derby and rugby league, respectively, with no significant between-sport difference (IRR=0.94 [95% CI: 0.52 to 1.69]) (Table 1). Across both sports, the combined incidence rate was 68.9 (95% CI: 51.5 to 90.4) per 1,000 PEH. The estimated probability of sustaining at least one concussion was approximately 1 in 16 matches in roller derby and 1 in 13 matches in rugby league. Under a scenario assuming a constant hazard, independent events, and full participation, the modelled probability of sustaining at least one concussion across a season was approximately 59%. This scenario calculation does not represent observed athlete risk.
4. Discussion
This study evaluated the test-retest reliability, measurement error, and diagnostic performance of the King-Devick Test (KDT) across four consecutive competitive seasons in two understudied women's contact sports, using 388 baseline assessments and 52 clinician-diagnosed concussion events. To our knowledge, this is the first investigation of KDT performance in flat-track roller derby and one of the most comprehensive evaluations in women's rugby league. The principal findings were good and comparable reliability across both sports (ICC(2,1)=0.830), a consistent practice effect of approximately 2.5 s, a minimal detectable change (MDC) of approximately 9 to 11 s, and strong discrimination between clinician-confirmed concussion observations and same-day retest observations (AUC=0.917). When evaluated using the in-sample Youden-optimal threshold (≥0.93 s worsening from baseline), sensitivity was 92.3% and specificity relative to retest variability was 82.1%, whereas any worsening from baseline identified all concussion events but reduced specificity. Concussion incidence was similar between sports.
These findings should be interpreted within the context of the study design. The KDT was administered only after athletes had been removed from play through an independent multimodal sideline assessment protocol, and the non-concussed comparator group was derived from same-day repeat baseline testing. Consequently, the present findings describe KDT performance as a confirmatory adjunct to clinically suspected concussion rather than as an independent screening tool. Because every concussion event was first identified through independently observed signs and symptoms, the concussion cohort was enriched with clinically apparent injuries, a recognised source of spectrum bias that may inflate estimates of diagnostic performance [70,71]. Similarly, the observed AUC of 0.917 should be regarded as an exploratory estimate of discrimination between clinician-confirmed concussion observations and same-day retest variability. Because the comparator group did not comprise post-impact non-concussed athletes, the estimate is likely to be optimistic and should not be interpreted as evidence that the KDT can independently identify concussion in athletes who would otherwise escape clinical detection.
4.1. Reliability, Practice Effects, Measurement Error, and Agreement
Test-retest reliability of baseline KDT performance was good overall (combined ICC(2,1)=0.830) and comparable between roller derby and rugby league. Reliability across the eight yearly cohorts ranged from moderate to excellent (0.709 to 0.956), consistent with previous KDT studies in collegiate and rugby populations [15,19,21,31]. Reliability heterogeneity was significant in rugby league (I² = 85.2%), driven primarily by the highest- and lowest-performing cohorts. However, random-effects pooled estimates were like the primary pooled estimates, and no significant seasonal trends were observed, indicating that the overall conclusion of good reliability was robust to between-cohort variability.
A significant practice effect was observed in both sports, with the second same-day administration approximately 2.5 s faster than the first. This is comparable to the mean improvement of 2.4 s reported in collegiate athletes [23]. Although small relative to the MDC, this learning effect is clinically relevant because it indicates that a first administration is likely to overestimate an athlete's typical performance. Defining baseline as the faster of two administrations [21] (p. 59), as used in the present study, minimises this effect and provides a more conservative reference value when the objective is to detect post-injury deterioration.
A high ICC does not necessarily imply small measurement error because the coefficient depends partly on between-athlete variability, whereas agreement parameters expressed in the original units of measurement are more informative for individual clinical decision-making [72,73]. The SEM of 3.98 s and MDC values of 9.26 s (90% confidence) and 11.03 s (95% confidence) indicate that changes smaller than approximately 9 to 11 s cannot be distinguished from measurement error with the stated degree of confidence [43,74,75]. Given a mean baseline performance of approximately 49 s, this corresponds to a change of about 20% in completion time. Statistically defined real change is therefore considerably larger than the commonly used 3-s and 5-s thresholds, an observation with important implications for concussion classification.
Bland-Altman analysis demonstrated a systematic bias of -2.52 s attributable to the practice effect, with 95% limits of agreement of -12.60 to 7.57 s in the combined sample [44,46,76]. Proportional bias was observed in roller derby and in the combined sample, and heteroscedasticity-adjusted limits widened substantially at slower completion times. These findings indicate that test-retest variability was not constant across the range of KDT performance and suggest that a single fixed threshold may overestimate precision in slower athletes and underestimate precision in faster athletes. However, the most extreme regression-based limits were derived from relatively few observations at the tails of the distribution and should therefore be interpreted cautiously. Importantly, the observed practice effect was substantially smaller than the combined-sample MDC95 (11.03 s), indicating that expected learning effects alone are unlikely to account for the magnitude of deterioration observed following clinician-confirmed concussion.
4.2. Diagnostic Performance
The in-sample Youden-optimal cutoff (worsening of ≥0.93 s from baseline) was the only threshold that combined high sensitivity (92.3%) with a negative likelihood ratio sufficiently low (0.09) to meaningfully reduce the probability of concussion following a negative result [77]. Its positive likelihood ratio (LR+ = 5.17 [95% CI: 4.06 to 6.59]) was moderate, indicating that worsening KDT performance increases the probability of concussion but is not, in isolation, sufficient to confirm the diagnosis. Because this threshold was derived and evaluated within the same dataset, internal validation was performed. Optimism was small (corrected sensitivity 89.7% and specificity 81.9%), although the re-derived threshold ranged from 0.12 to 1.98 s across bootstrap resamples, indicating considerable uncertainty around the exact cut-point and the need for external validation. Any worsening from baseline (>0 s) identified all 52 concussion events (sensitivity 100% [95% CI: 93.1% to 100.0%]), but this additional sensitivity came at the expense of lower specificity (69.3%) and a reduced positive likelihood ratio (LR+ = 3.26). This pattern of very high sensitivity and modest specificity is consistent with previous reports in contact-sport athletes and pooled estimates from the meta-analytic literature, although direct comparisons are limited by differences in comparator groups, baseline definitions, and the timing of post-injury assessment [15,16,18,19,21]. Notably, a prospective study using concurrent matched controls reported substantially lower specificity (56%) and discrimination (AUC = 0.75) for any worsening from baseline [24] (p. 391), consistent with the expectation that comparisons against same-day retest variability, rather than post-impact non-concussed athletes, inflate estimates of specificity and discrimination.
Increasing the threshold improved specificity at the expense of sensitivity. The MDC thresholds achieved a specificity of 98.5% but identified only 28.8% (MDC90) and 17.3% (MDC95) of concussion events, indicating that a change large enough to exceed expected retest variability is greater than the magnitude of deterioration observed in many concussed athletes. McNemar analyses confirmed that the MDC-derived thresholds classified significantly fewer concussion events than the fixed 3-s threshold, despite their superior specificity, highlighting the trade-off between rule-in and rule-out performance. Taken together, these findings suggest that no single threshold is universally optimal; rather, threshold selection should reflect the intended clinical purpose. Lower thresholds maximise case detection and reduce the likelihood of missed concussion, whereas MDC-derived thresholds provide stronger confirmatory evidence that meaningful deterioration has occurred.
Estimated discrimination across the full range of worsening scores was similar in both sports (AUC=0.934 and 0.904) and did not differ significantly (p=0.304). However, in the context of the design limitations described above, these AUC estimates are likely to be optimistic and should be interpreted cautiously [78,79]. Predictive values are also dependent on prevalence, and the 13% proportion of concussed athletes observed in the present dataset reflects the study sample rather than the true underlying prevalence of concussion. Consequently, sensitivity, specificity, and likelihood ratios are likely to be the most transferable measures of diagnostic performance.
4.3. Confirmatory Versus Screening Use
Screening seeks to identify disease in individuals without recognised signs or symptoms, whereas confirmatory testing supports diagnostic decision-making in individuals already suspected of having the condition [80]. In the present study, the KDT was administered only after a mandatory observation period and completion of the Brain Injury Screening Tool (BIST), and was not used to determine removal from play. Consequently, the pre-test probability of concussion among tested athletes was high, concussion events were clinically apparent, and athletes with subtle, delayed, or otherwise unrecognised presentations that a true screening application would need to detect were not systematically represented. Differences in patient spectrum between a study sample and the intended clinical population are well known to influence estimates of diagnostic accuracy, typically in the direction of overestimating performance [70,71].
This interpretation is consistent with current international consensus guidance, which positions oculomotor and vestibular assessments as components of a multimodal concussion evaluation rather than as stand-alone diagnostic instruments [3]. A worsened KDT score should therefore increase concern in an athlete who already demonstrates signs or symptoms consistent with concussion, whereas a score at or better than baseline should not override clinical judgement given that sensitivity remained below 100%. Similarly, a worsened KDT score in an athlete without independently observed signs should prompt further assessment but should not, by itself, be considered diagnostic of concussion, particularly given the modest specificity of the Youden-optimal cutoff (82.1%). Establishing the screening performance of the KDT will require prospective studies in which all athletes are assessed irrespective of observed signs, with an independent reference standard applied blind to KDT performance and reported in accordance with STARD and QUADAS-2 recommendations [80,81].
4.4. Female Athletes and Understudied Sports
Women remain under-represented in sport and exercise science research, limiting the evidence base on which clinical assessment tools are validated and applied in female athletes [82,83]. This is particularly relevant to concussion because sex-related differences in incidence, symptom burden, and recovery trajectories have been reported, raising the possibility that reliability estimates, measurement error characteristics, and diagnostic thresholds derived from predominantly male populations may not generalise directly to women [26,84]. The present reliability estimates in women (ICC(2,1)=0.83) were similar to those reported in mixed-sex and predominantly male cohorts and extend previous KDT research in women's rugby union and soccer populations [15,23,30,85]. Direct comparison with male athletes assessed under the same protocol would be required before concluding that KDT performance is independent of sex.
Evidence in roller derby remains limited and is derived primarily from survey studies reporting a substantial lifetime concussion burden [27]. The present study provides the first exposure-based concussion incidence estimate for flat-track roller derby. The rugby league incidence rate was considerably higher than previously reported pooled estimates in women's rugby league [86] (p. 1756), although differences in case ascertainment, exposure denominators, and injury definitions likely account for much of this discrepancy. Consequently, direct comparison should be made cautiously. Finally, the roller derby cohort included both female and transgender participants, reflecting the participant base of the sport, although numbers were insufficient to permit subgroup analyses.
4.5. Between-Sport Comparisons
Despite substantial differences in game structure and contact mechanisms, no between-sport differences in KDT performance were detected. No significant between-sport differences were observed for reliability, practice-effect magnitude, post-concussion worsening, diagnostic discrimination, or concussion incidence. Although roller derby athletes demonstrated nominally faster baseline performance, this difference did not remain significant following multiplicity correction. Collectively, these findings suggest that the psychometric and diagnostic characteristics of the KDT were comparable across the two sports. However, the absence of statistically significant differences should not be interpreted as evidence of equivalence given the relatively small sport-specific concussion samples and correspondingly wide confidence intervals.
Testing intervals between baseline and post-concussion assessment were substantially more variable in roller derby than rugby league, although mean interval duration did not differ significantly. Differences in competition scheduling, access to medical follow-up, or return-to-play practices may contribute to this variability. Because longer post-concussion intervals introduce sources of variation absent from the same-day BL1-BL2 comparison, the greater interval dispersion observed in roller derby may have introduced additional noise into diagnostic comparisons. Overall, KDT reliability, measurement error, and diagnostic performance were not detectably different across these two women's contact sports despite differences in post-injury testing intervals.
4.6. Injury Incidence and Risk Communication
Concussion incidence was 66.7 (95% CI: 42.3 to 100.0) per 1000 player-exposure hours in roller derby and 70.8 (95% CI: 47.4 to 101.7) in rugby league, with no meaningful between-sport difference. To our knowledge, this study provides the first exposure-based concussion incidence estimate reported for flat-track roller derby. These rates are higher than previously reported match-based estimates in women's rugby codes [86] (p. 1757), although differences in case ascertainment, exposure denominators, and injury definitions likely contribute to this discrepancy. The confidence intervals overlapped substantially, and the study was not powered to detect modest between-sport differences in incidence.
Expressing concussion incidence as the probability of sustaining at least one concussion over a defined exposure period provides a more intuitive measure for athletes, coaches, and administrators than rates expressed per 1000 player-exposure hours [64]. Based on these data, the estimated probability of concussion was approximately 1 in 16 matches in roller derby and 1 in 13 matches in rugby league, increasing to approximately 59% over a season of participation. These estimates assume a constant hazard, independent events, and full participation in all matches and should therefore be interpreted cautiously. They represent scenario calculations rather than observed athlete risk, particularly because recorded exposure was substantially below the theoretical maximum (by factors of 1.51 and 1.63 in roller derby and rugby league, respectively; see Table 1). Nevertheless, the high incidence observed in both sports reinforces the importance of baseline testing programmes, concussion education, and access to appropriately trained medical personnel during competition.
4.7. Strengths
Strengths of this study include the collection of data across four consecutive competitive seasons using a single digital platform and a standardised preseason testing protocol. The cohorts were drawn from two women's contact sports for which KDT evidence is scarce or absent. Reliability, measurement error, agreement, and diagnostic performance were evaluated using multiple complementary psychometric approaches, including ICCs, SEM/MDC estimates, Bland-Altman analyses, heterogeneity testing, ROC analysis, and threshold comparisons. The concussion identification pathway was independent of the KDT, all concussion events received follow-up assessment, and the limitations inherent to the confirmatory diagnostic design were explicitly identified and discussed [80].
4.8. Limitations
The main limitation is the diagnostic design. Entry to the concussed group depended on independently observed signs, producing spectrum bias, and the KDT result may have contributed to the final clinical diagnosis, so the index test was not fully independent of the reference standard (incorporation bias) [70,81]. Non-concussed athletes were represented by same-day BL2 − BL1 difference from baseline assessments and it differs from the concussed comparison in time interval (0 versus approximately 76 days), testing conditions (preseason versus after a suspected injury) and the nature of the change being measured. Specificity therefore describes test-retest variability and not the false-positive rate in athletes who are assessed after head contact and subsequently found not to be concussed. Prevalence in the sample was determined by data availability rather than by sampling, so predictive values are not generalisable. Accordingly, the diagnostic findings should be interpreted as estimates of KDT performance within a confirmatory clinical context rather than as measures of population-level screening accuracy.
The study was retrospective, and pooled analyses treated repeated assessments and concussion events from some athletes as independent observations, which may have narrowed confidence intervals. Athlete identifiers were not available, precluding clustering by athlete or restriction to a single observation per participant, although confidence intervals were similar when estimated using a cluster bootstrap based on testing session. The Youden-optimal threshold showed little optimism on internal validation but has not been externally validated, and post-injury KDT reading errors were not analysed. The number of concussion events was modest (23 and 29 per sport), limiting precision for sport-specific and threshold-specific estimates. Exposure was calculated assuming full-match participation, individual athlete-minutes were not recorded, and unwitnessed cases identified through post-match symptom change were not analysed separately. Baseline-to-post-concussion intervals were long and variable, although sensitivity analyses indicated little effect on discrimination or threshold sensitivity. Finally, participants were amateur club-level athletes from New Zealand, and findings may not generalise to elite athletes, other sporting or cultural contexts, or male athletes.
4.9. Clinical Implications
The KDT is a brief adjunct to concussion assessment and should be interpreted relative to an individual's own preseason baseline rather than population norms. Two same-day baseline administrations are recommended, with the faster score retained as baseline to minimise the influence of practice effects. The MDC of approximately 9 to 11 s reflects statistically certain change, although smaller deteriorations may remain clinically meaningful. Symptom burden and symptom severity on the BIST were not associated with the magnitude of KDT worsening. The absence of a detected association does not establish independence or incremental clinical value; the modest sample and restricted concussion-only range may have limited power. Lower thresholds, including any worsening or the exploratory Youden-optimal cutoff, appear most useful for identifying athletes who require further assessment, whereas MDC-derived thresholds provide stronger confirmatory evidence of meaningful deterioration. The KDT should always be interpreted alongside symptom assessment, balance testing, and clinical examination, and should not be used in isolation to diagnose concussion, clear an athlete for participation, or guide return-to-play decisions.[3]
5. Conclusions
The King-Devick Test demonstrated good test-retest reliability that was comparable between sports and stable across four competitive seasons, a consistent practice effect of approximately 2.5 s, and measurement error corresponding to an MDC of 9-11 s. Continuous KDT worsening differentiated clinician-confirmed concussion observations from same-day preseason retest observations (AUC=0.917), although this exploratory estimate is likely optimistic given the comparator design. In athletes already removed from play for suspected concussion, an exploratory, in-sample worsening threshold of ≥0.93 s from baseline identified more than nine in ten concussion events, whereas MDC-derived thresholds were highly specific but insensitive. These findings suggest that lower thresholds may be most useful for identifying athletes who require further assessment, whereas MDC-derived thresholds may be more useful as confirmatory evidence of meaningful deterioration.
Because athletes were tested only after independent clinical removal and the reference scores were derived from same-day baseline retest differences, these findings support the KDT as a confirmatory adjunct within a multimodal concussion assessment framework rather than as a stand-alone screening or diagnostic tool. Prospective studies that assess all athletes irrespective of clinical signs, apply a blinded reference standard, and include matched post-impact non-concussed controls are required before the KDT can be recommended as a screening tool in these sports.
Supplementary Materials
The following supporting information can be downloaded at Preprints.org, Supplementary Tables S1 to S3.
Author Contributions
Conceptualization: DAK; Methodology, DAK, TNC; Software: DK, AJP; Validation: n/a; Formal analysis: DAK, AJP; Investigation, DAK; Resources: DAK; Data curation: DAK; Writing-original draft preparation: DK; Writing-review and editing, DK, PH, TNC, AJP, MH; Visualization: DK; Supervision, n/a; Project administration: DK; Funding acquisition, n/a. All authors have read and agreed to the published version of the manuscript.
Funding
This research received no external funding.
Institutional Review Board Statement
The study was conducted in accordance with the Declaration of Helsinki. The New Zealand Health and Disability Ethics Committee (HDEC) determined that the study was exempt from HDEC review and did not require HDEC approval (Ref: 2026 OOS 2683). due to the use of deidentified previously recorded data.
Informed Consent Statement
Patient consent was waived due to the participants being unable to be identified.
Data Availability Statement
Data is available upon reasonable request to the lead author.
Conflicts of Interest
AJP is a non-executive director for the Concussion Legacy Foundation Australia (unpaid position) and Adjunct research manager for the Australian Sports Brain Bank (unpaid position). He is remunerated for expert advice to medico-legal practices. DAK has been remunerated for expert advice to medico-legal practices. He has no direct connection with, or is part of, King-Devick technologies.
AI statement
This manuscript was prepared with assistance from M365 Copilot (GPT-5 chat model) by Microsoft for initial journal article screening, editing, proofreading, and improving clarity and structure of the text. The authors take full responsibility for the content and have carefully reviewed the parts developed with M365 Copilot, confirming that it is factually accurate and does not affect the results or conclusions of the manuscript. All references and statistical results were checked by the lead author prior to inclusion in the manuscript.
Abbreviations
The following abbreviations are used in this manuscript:
| AUC | Area under the receiver operating characteristic curve |
| BIST | Brain Injury Screening Tool |
| BL | Baseline (representative baseline = faster of BL1 and BL2) |
| BL1, BL2 | First and second same-day baseline trials |
| CI | Confidence interval |
| dz | Cohen's standardized mean difference for paired comparisons |
| df | Degrees of freedom |
| HDEC | Health and Disability Ethics Committee (New Zealand) |
| I² | Percentage of total variability attributable to between-cohort heterogeneity |
| ICC(2,1) | Intraclass correlation coefficient (two-way random-effects, absolute-agreement, single-measures model) |
| IQR | Interquartile range |
| IRR | Incidence rate ratio |
| J | Youden's J index (sensitivity + specificity − 1) |
| KDT | King-Devick Test |
| LR+, LR− | Positive and negative likelihood ratios |
| MDC, MDC90, MDC95 | Minimal detectable change; at the 90% and 95% confidence levels |
| mTBI | Mild traumatic brain injury |
| NPV | Negative predictive value |
| PC | Post-concussion |
| PEH | Player-exposure hours |
| PPV | Positive predictive value |
| Q | Cochran's Q heterogeneity statistic |
| QUADAS-2 | Quality Assessment of Diagnostic Accuracy Studies, version 2 |
| RE | Random-effects |
| ROC | Receiver operating characteristic |
| SD | Standard deviation |
| SEM | Standard error of measurement |
| SRC | Sports-related concussion |
| STARD | Standards for Reporting of Diagnostic Accuracy |
| WFTRD | Women's flat-track roller derby |
| WRL | Women's rugby league |
| τ² | Estimated between-cohort variance |
References
- Marklund, N.; Hillered, L. Animal modelling of traumatic brain injury in preclinical drug development: Where do we go from here? Br. J. Pharmacol. 2011, 164, 1207–1229. [Google Scholar] [CrossRef]
- Stein, T.D.; Alvarez, V.E.; McKee, A.C. Chronic traumatic encephalopathy: A spectrum of neuropathological changes following repetitive brain trauma in athletes and military personnel. Alzheimers Res. Ther. 2014, 6, 4–4. [Google Scholar] [CrossRef]
- Patricios, J.S.; Schneider, K.J.; Dvorak, J.; Ahmed, O.H.; Blauwet, C.; Cantu, R.C.; Davis, G.A.; Echemendia, R.J.; Makdissi, M.; McNamee, M.; et al. Consensus statement on concussion in sport: The 6th International Conference on Concussion in Sport–Amsterdam, October 2022. Br. J. Sports Med. 2023, 57, 695–711. [Google Scholar] [CrossRef]
- Shaikh, N.; Theadom, A.; Siegert, R.; Hardaker, N.; King, D.; Hume, P. Rasch analysis of the Brain Injury Screening Tool (BIST) in mild traumatic brain injury. BMC Neurol. 2021, 21, 376. [Google Scholar] [CrossRef]
- Theadom, A.; Hardaker, N.; Bray, C.; Siegert, R.; Henshall, K.; Forch, K.; Fernando, K.; King, D.; Fulcher, M.; Jewell, S.; et al. The Brain Injury Screening Tool (BIST): Tool development, factor structure and validity. PLoS ONE 2021, 16, e0246512. [Google Scholar] [CrossRef]
- Ventura, R.; Balcer, L.; Galetta, S. The concussion toolbox: The role of vision in the assessment of concussion. Semin Neurol. 2015, 35, 599–606. [Google Scholar] [CrossRef]
- Ventura, R.E.; Balcer, L.J.; Galetta, S.L.; Rucker, J.C. Ocular motor assessment in concussion: Current status and future directions. J. Neurol. Sci. 2016, 361, 79–86. [Google Scholar] [CrossRef]
- Ventura, R.E.; Jancuska, J.M.; Balcer, L.J.; Galetta, S.L. Diagnostic tests for concussion: Is vision part of the puzzle? J. Neuro-Ophthalmol. 2015, 35, 73–81. [Google Scholar] [CrossRef]
- Heitger, M.; Jones, R.; Anderson, T. A new approach to predicting postconcussion syndrome after mild traumatic brain injury based upon eye movement function. In Proceedings of the Conference Proceedings of the IEEE Engineering in Medicine and Biology Society, Vancouver, BC, 2008; pp. 3570–3573. [Google Scholar]
- Ciuffreda, K.J.; Kapoor, N.; Rutner, D.; Suchoff, I.B.; Han, M.E.; Craig, S. Occurrence of oculomotor dysfunctions in acquired brain injury: a retrospective analysis. Optometry 2007, 78, 155–161. [Google Scholar] [CrossRef]
- Goodrich, G.L.; Flyg, H.M.; Kirby, J.E.; Chang, C.Y.; Martinsen, G.L. Mechanisms of TBI and visual consequences in military and veteran populations. Optom. Vis. Sci. 2013, 90, 105–112. [Google Scholar] [CrossRef]
- Ventura, R.E.; Balcer, L.J.; Galetta, S.L. The neuro-ophthalmology of head trauma. Lancet Neurol. 2014, 13, 1006–1016. [Google Scholar] [CrossRef]
- Felleman, D.J.; Van Essen, D.C. Distributed hierarchical processing in the primate cerebral cortex. Cereb. Cortex 1991, 1, 1–47. [Google Scholar] [CrossRef]
- Oride, M.K.; Marutani, J.K.; Rouse, M.W.; DeLand, P.N. Reliability study of the Pierce and King-Devick saccade tests. Am. J. Optom. Physiol. Opt. 1986, 63, 419–424. [Google Scholar] [CrossRef]
- Galetta, K.; Brandes, L.; Maki, K.; Dziemianowicz, M.; Laudano, E.; Allen, M.; Lawler, K.; Sennett, B.; Wiebe, D.; Devick, S.; et al. The King-Devick test and sports-related concussion: Study of a rapid visual screening tool in a collegiate cohort. J. Neurol. Sci. 2011, 309, 34–39. [Google Scholar] [CrossRef]
- Galetta, K.; Liu, M.; Leong, D.; Ventura, R.; Galetta, S.; Balcer, L. The King-Devick test of rapid number naming for concussion detection: Meta-analysis and systematic review of the literature. Concussion 2015, 1, CNC8. [Google Scholar] [CrossRef]
- Leong, D.; Balcer, L.; Galetta, S.; Evans, G.; Gimre, M.; Watt, D. The King-Devick test for sideline concussion screening in collegiate football. J. Optom. 2015, 8, 131–139. [Google Scholar] [CrossRef]
- Galetta, K.; Barrett, J.; Allen, M.; Madda, F.; Delicata, D.; Tennant, A.; Branas, C.; Maguire, M.; Messner, L.; Devick, S.; et al. The King-Devick test as a determinant of head trauma and concussion in boxers and MMA fighters. Neurology 2011, 76, 1456–1462. [Google Scholar] [CrossRef]
- King, D.; Brughelli, M.; Hume, P.; Gissane, C. Concussions in amateur rugby union identified with the use of a rapid visual screening tool. J. Neurol. Sci. 2013, 326, 59–63. [Google Scholar] [CrossRef]
- King, D.; Clark, T.; Gissane, C. Use of a rapid visual screening tool for the assessment of concussion in amateur rugby league: a pilot study. J. Neurol. Sci. 2012, 320, 16–21. [Google Scholar] [CrossRef]
- King, D.; Gissane, C.; Hume, P.A.; Flaws, M. The King-Devick test was useful in management of concussion in amateur rugby union and rugby league in New Zealand. J. Neurol. Sci. 2015, 351, 58–64. [Google Scholar] [CrossRef]
- King, D.; Hume, P.; Gissane, C.; Clark, T. Use of the King-Devick test for sideline concussion screening in junior rugby league. J. Neurol. Sci. 2015, 357, 75–79. [Google Scholar] [CrossRef]
- Breedlove, K.M.; Ortega, J.D.; Kaminski, T.W.; Harmon, K.G.; Schmidt, J.D.; Kontos, A.P.; Clugston, J.R.; Chrisman, S.P.D.; McCrea, M.A.; McAllister, T.W.; et al. King-Devick Test reliability in National Collegiate Athletic Association Athletes: A National Collegiate athletic Association-Department of Defense concussion assessment, research and education report. J. Ath Train. 2019, 54, 1241–1246. [Google Scholar] [CrossRef]
- Harmon, K.G.; Whelan, B.M.; Aukerman, D.F.; Poddar, S.K.; DeLeo, A.; Elkington, H.A.; Garruppo, G.; Holliday, M.; Hwang, C.E. Validity of the King-Devick test for acute diagnosis of concussion in NCAA Division I Athletes. Sports Health 2026, 18, 391–400. [Google Scholar] [CrossRef]
- D'Lauro, C.; Jones, E.R.; Swope, L.M.; Anderson, M.N.; Broglio, S.; Schmidt, J.D. Under-representation of female athletes in research informing influential concussion consensus and position statements: An evidence review and synthesis. Br. J. Sports Med. 2022, 56, 981–987. [Google Scholar] [CrossRef]
- Covassin, T.; Moran, R.; Elbin, R., III. Sex differences in reported concussion injury rates and time loss from participation: An update of the National Collegiate Athletic Association injury surveillance program from 2004–2005 through 2008–2009. J. Ath Train. 2016, 51. [Google Scholar] [CrossRef]
- Stockbridge, M.D.; Keser, Z.; Newman, R.S. Concussion in women's flat-track roller derby. Front Neurol. 2022, 13, 809939. [Google Scholar] [CrossRef]
- Molloy, J.H.; Murphy, I.; Gissane, C. The King-Devick (K-D) test and concussion diagnosis in semi-professional rugby union players. J. Sci. Med. Sport 2017, 20, 708–711. [Google Scholar] [CrossRef]
- Clugston, J.R.; Chrisman, S.P.D.; Houck, Z.M.; Asken, B.M.; Boone, J.K.; Buckley, T.A.; Hoffman, N.L.; Schmidt, J.D.; Kontos, A.P.; Jaffee, M.S.; et al. King-Devick test time varies by testing modality. Clin. J. Sport Med. 2020, 30, e139–e142. [Google Scholar] [CrossRef]
- King, D.; Hume, P.A.; Clark, T.N.; Pearce, A.J. Use of the King-Devick test for the identification of concussion in an amateur domestic women's rugby union team over two competition seasons in New Zealand. J. Neurol. Sci. 2020, 418, 117162. [Google Scholar] [CrossRef]
- Dessy, A.M.; Yuk, F.J.; Maniya, A.Y.; Gometz, A.; Rasouli, J.J.; Lovell, M.R.; Choudhri, T.F. Review of assessment scales for diagnosing and monitoring sports-related concussion. Cureus 2017, 9, e1922–e1922. [Google Scholar] [CrossRef]
- Nguyen, M.Q.; King, D.; Pearce, A.J. A reliability and comparative analysis of the new randomized King-Devick test. J. Neuroophthalmol. 2020, 40, 207–212. [Google Scholar] [CrossRef]
- Shapiro, S.S.; Wilk, M.B. An analysis of variance test for normality (complete samples). Biometrika 1965, 52, 591–611. [Google Scholar] [CrossRef]
- Wilcoxon, F. Individual comparisons by ranking methods. Biom. Bull. 1945, 1, 80–83. [Google Scholar] [CrossRef]
- Cohen, J. Statistical power analysis for the behavioural sciences, 2nd ed.; Lawrence Erlbaum Associates: New York, New York, 1988. [Google Scholar]
- Hedges, L.V. Distribution theory for Glass's estimator of effect size and related estimators. J. Educ. Stat. 1981, 6, 107–128. [Google Scholar] [CrossRef]
- Goulet-Pelletier, J.-C.; Cousineau, D. A review of effect sizes and their confidence intervals, Part 1: The Cohen’s d family. Quant. Meth Psychol. 2018, 14, 242–265. [Google Scholar] [CrossRef]
- Holm, S. A simple sequentially rejective multiple test procedure. Scand. J. Stat. 1979, 6, 65–70. [Google Scholar] [CrossRef]
- Shrout, P.E.; Fleiss, J.L. Intraclass correlations: Uses in assessing rater reliability. Psychol. Bull. 1979, 86, 420–428. [Google Scholar] [CrossRef]
- Koo, T.K.; Li, M.Y. A guideline of selecting and reporting intraclass correlation coefficients for reliability research. J. Chiropr. Med. 2016, 15, 155–163. [Google Scholar] [CrossRef]
- Feldt, L.S. The approximate sampling distribution of Kuder-Richardson reliability coefficient twenty. Psychometrika 1965, 30, 357–370. [Google Scholar] [CrossRef]
- Efron, B.; Tibshirani, R.J. An introduction to the Bootstrap, 1st ed.; Chapman and Hall / CRC: New York, 1994. [Google Scholar]
- Weir, J. Quantifying test-retest reliability using the intraclass correlation coefficient and the SEM. J. Ath Train. 2005, 19, 231–240. [Google Scholar] [CrossRef]
- Bland, J.; Altman, D. Statistical methods for assessing agreement between two statistical methods of clinical measurement. Lancet 1986, i, 307–310. [Google Scholar] [CrossRef]
- Draper, N.; Smith, H.C. Applied regression analysis, 3rd ed.; Wiley: New York, 1998. [Google Scholar]
- Bland, J.; Altman, D. Measuring agreement in method comparison studies. Stat. Methods Med. Res. 1999, 8, 135–160. [Google Scholar] [CrossRef]
- Brown, M.; Forsythe, A. Robust tests for the equality of variances. J. Am. Stat. Assoc. 1974, 69, 364–367. [Google Scholar] [CrossRef]
- Welch, B.L. The generalisation of "Student's" problems when several different population variances are involved. Biometrika 1947, 34, 28–35. [Google Scholar] [CrossRef]
- Levene, H. Robust tests for equality of variances. In Contributions to Probability and Statistics; Olkin, I., Ed.; Stanford University Press: Stanford, CA, 1960; pp. 278–292. [Google Scholar]
- Borenstein, M.; Hedges, L.; Higgins, J.; Rothstein, H. Introduction to Meta-Analysis, 2nd ed.; CPI Group (UK) Ltd: Croydon, CR0 4YY, 2021; p. 387. [Google Scholar]
- Higgins, J.P.; Thompson, S.G. Quantifying heterogeneity in a meta-analysis. Stat. Med. 2002, 21, 1539–1558. [Google Scholar] [CrossRef]
- DerSimonian, R.; Laird, N. Meta-analysis in clinical trials. Control Clin. Trials 1986, 7, 177–188. [Google Scholar] [CrossRef]
- Wilson, E.B. Probable inference, the law of succession, and statistical inference. J. Am. Stat. Assoc. 1927, 22, 209–212. [Google Scholar] [CrossRef]
- McGee, S. Simplifying likelihood ratios. J. Gen. Intern Med. 2002, 17, 646–649. [Google Scholar] [CrossRef]
- Youden, W.J. Index for rating diagnostic tests. Cancer 1950, 3, 32–35. [Google Scholar] [CrossRef]
- Edwards, A.L. Note on the correction for continuity in testing the significance of the difference between correlated proportions. Psychometrika 1948, 13, 185–187. [Google Scholar] [CrossRef]
- DeLong, E.R.; DeLong, D.M.; Clarke-Pearson, D.L. Comparing the areas under two or more correlated receiver operating characteristic curves: A nonparametric approach. Biometrics 1988, 44, 837–845. [Google Scholar] [CrossRef]
- Hanley, J.A.; McNeil, B.J. The meaning and use of the area under a receiver operating characteristic (ROC) curve. Radiology 1982, 143, 29–36. [Google Scholar] [CrossRef]
- Hajian-Tilaki, K. Receiver Operating Characteristic (ROC) curve analysis for medical diagnostic test evaluation. Casp. J. Intern Med. 2013, 4, 627–635. [Google Scholar]
- Student. The probable error of a mean. Biometrika 1908, 6, 1–25. [Google Scholar] [CrossRef]
- Mann, H.B.; Whitney, D.R. On a test of whether one of two random variables is stochastically larger than the other. Ann. Math. Stat. 1947, 18, 50–60. [Google Scholar] [CrossRef]
- Fritz, C.; Morris, P.; Richler, J. Effect size estimates: current use, calculations, and interpretation. J. Exp. Psychol. Gen. 2012, 141, 2–18. [Google Scholar] [CrossRef]
- Ulm, K. A simple method to calculate the confidence interval of a standardized mortality ratio (SMR). Am. J. Epidemiol. 1990, 131, 373–375. [Google Scholar] [CrossRef]
- Parekh, N.; Hodges, S.; Pollock, A.; Kirkwood, G. Communicating the risk of injury in schoolboy rugby: Using Poisson probability as an alternative presentation of the epidemiology. Br. J. Sports Med. 2012, 46, 611–613. [Google Scholar] [CrossRef]
- Fisher, R.A. On the Interpretation of χ2 from Contingency Tables, and the Calculation of P. J. R Stat. Soc. 1922, 85, 87–94. [Google Scholar] [CrossRef]
- Spearman, C. The proof and measurement of association between two things. Int. J. Epidemiol. 2010, 39, 1137–1150. [Google Scholar] [CrossRef]
- Harris, C.R.; Millman, K.J.; van der Walt, S.J.; Gommers, R.; Virtanen, P.; Cournapeau, D.; Wieser, E.; Taylor, J.; Berg, S.; Smith, N.J.; et al. Array programming with NumPy. Nature 2020, 585, 357–362. [Google Scholar] [CrossRef]
- Gazoni, E.; Clark, C. OpenPyXL — A Python library to read/write Excel 2010 xlsx/xlsm files. Available online: https://openpyxl.readthedocs.io/en/stable/.
- Virtanen, P.; Gommers, R.; Oliphant, T.E.; Haberland, M.; Reddy, T.; Cournapeau, D.; Burovski, E.; Peterson, P.; Weckesser, W.; Bright, J.; et al. SciPy 1.0: Fundamental algorithms for scientific computing in Python. Nat. Methods 2020, 17, 261–272. [Google Scholar] [CrossRef]
- Ransohoff, D.; Feinstein, A. Problems of spectrum and bias in evaluating the efficacy of diagnostic tests. N Engl. J. Med. 1978, 299, 926–930. [Google Scholar] [CrossRef]
- Mulherin, S.A.; Miller, W.C. Spectrum bias or spectrum effect? Subgroup variation in diagnostic test evaluation. Ann. Intern Med. 2002, 137, 598–602. [Google Scholar] [CrossRef]
- Atkinson, G.; Nevill, A.M. Statistical methods for assessing measurement error (reliability) in variables relevant to sports medicine. Sports Med. 1998, 26, 217–238. [Google Scholar] [CrossRef]
- de Vet, H.C.W.; Terwee, C.B.; Mokkink, L.B.; Knol, D.L. Meas. Med. A Pract. Guide 2011, 1–338.
- Beckerman, H.; Roebroeck, M.E.; Lankhorst, G.J.; Becher, J.G.; Bezemer, P.D.; Verbeek, A.L. Smallest real difference, a link between reproducibility and responsiveness. Qual. Life Res. 2001, 10, 571–578. [Google Scholar] [CrossRef]
- Hopkins, W. Measures of reliability in sports medicine and science. Sports Med. 2000, 30, 1–15. [Google Scholar] [CrossRef]
- Giavarina, D. Understanding Bland Altman analysis. Biochem Med. 2015, 25, 141–151. [Google Scholar] [CrossRef]
- Deeks, J.J.; Altman, D.G. Diagnostic tests 4: likelihood ratios. BMJ 2004, 329, 168–169. [Google Scholar] [CrossRef]
- Šimundić, A.M. Measures of diagnostic accuracy: Basic definitions. EJIFCC 2009, 19, 203–211. [Google Scholar]
- Fawcett, T. Introduction to ROC analysis. Pattern Recognit. Lett. 2006, 27, 861–874. [Google Scholar] [CrossRef]
- Bossuyt, P.M.; Reitsma, J.B.; Bruns, D.E.; Gatsonis, C.A.; Glasziou, P.P.; Irwig, L.; Lijmer, J.G.; Moher, D.; Rennie, D.; de Vet, H.C.W.; et al. STARD 2015: An updated list of essential items for reporting diagnostic accuracy studies. BMJ 2015, 351, h5527. [Google Scholar] [CrossRef]
- Whiting, P.F.; Rutjes, A.W.S.; Westwood, M.E.; Mallett, S.; Deeks, J.J.; Reitsma, J.B.; Leeflang, M.M.G.; Sterne, J.A.C.; Bossuyt, P.M.M. QUADAS-2: A revised tool for the QUality Assessment of Diagnostic Accuracy Studies. Ann. Int. Med. 2011, 155, 529–536. [Google Scholar] [CrossRef]
- Cowley, E.; Olenick, A.; McNulty, K.; Ross, E. “Invisible sportswomen”: The sex data gap in sport and exercise science research. Women Sport Phys. Act. J. 2021, 29, 1–6. [Google Scholar] [CrossRef]
- Emmonds, S.; Heyward, O.; Jones, B. The challenge of applying and undertaking research in female sport. Sports Med. Open 2019, 5, 51. [Google Scholar] [CrossRef]
- Dick, R. Is there a gender difference in concussion incidence and outcomes? Br. J. Sports Med. 2009, 43, i46–i50. [Google Scholar] [CrossRef]
- King, D.; Hume, P.; Clark, T.; Wethe, J. Use of the concussion check protocol for concussion assessment in a female soccer team over two consecutive seasons in New Zealand. J. Neurol. Sci. 2024, 460, 123011. [Google Scholar] [CrossRef]
- King, D.A.; Hume, P.A.; Hind, K.; Clark, T.N.; Hardaker, N. The incidence, cost, and burden of concussion in women’s rugby league and rugby union: A systematic review and pooled analysis. Sports Med. 2022, 52, 1751–1764. [Google Scholar] [CrossRef]
Figure 1.
Bland-Altman plots of test-retest agreement (BL1 vs. BL2). A: Roller Derby TOTAL; B: Rugby League TOTAL; C: Both Sports Combined. Solid line = mean bias; dashed lines = 95% limits of agreement.
Figure 1.
Bland-Altman plots of test-retest agreement (BL1 vs. BL2). A: Roller Derby TOTAL; B: Rugby League TOTAL; C: Both Sports Combined. Solid line = mean bias; dashed lines = 95% limits of agreement.
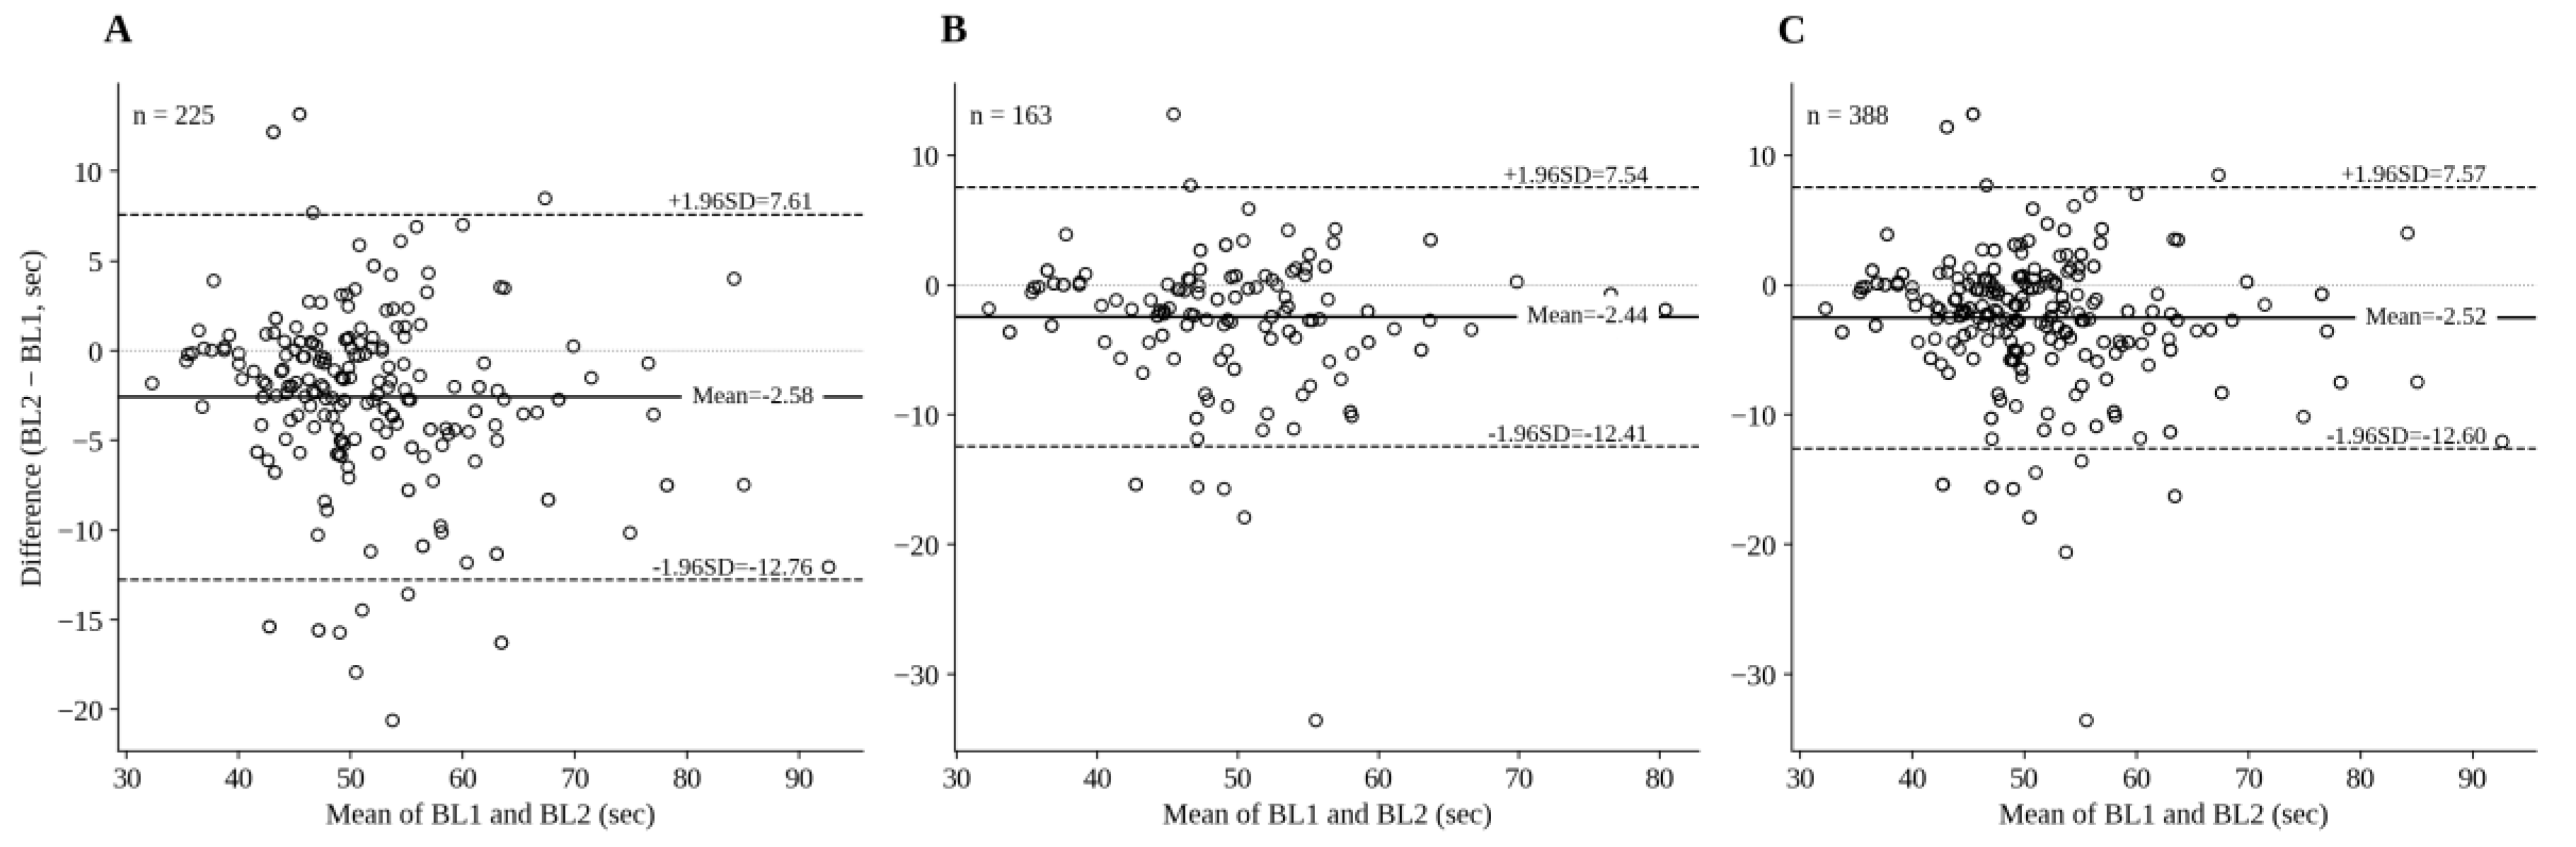
Figure 2.
Paired individual trajectories from Baseline to Post-Concussion (PC) retest. A: Roller Derby TOTAL; B: Rugby League TOTAL; C: Both Sports Combined. Diamond markers and bold line indicate group mean trajectory. Solid thin lines represent individual athletes; bold line and diamonds represent the cohort mean. Only confirmed concussion events are shown; the figure does not represent sensitivity among all athletes with a suspected injury.
Figure 2.
Paired individual trajectories from Baseline to Post-Concussion (PC) retest. A: Roller Derby TOTAL; B: Rugby League TOTAL; C: Both Sports Combined. Diamond markers and bold line indicate group mean trajectory. Solid thin lines represent individual athletes; bold line and diamonds represent the cohort mean. Only confirmed concussion events are shown; the figure does not represent sensitivity among all athletes with a suspected injury.
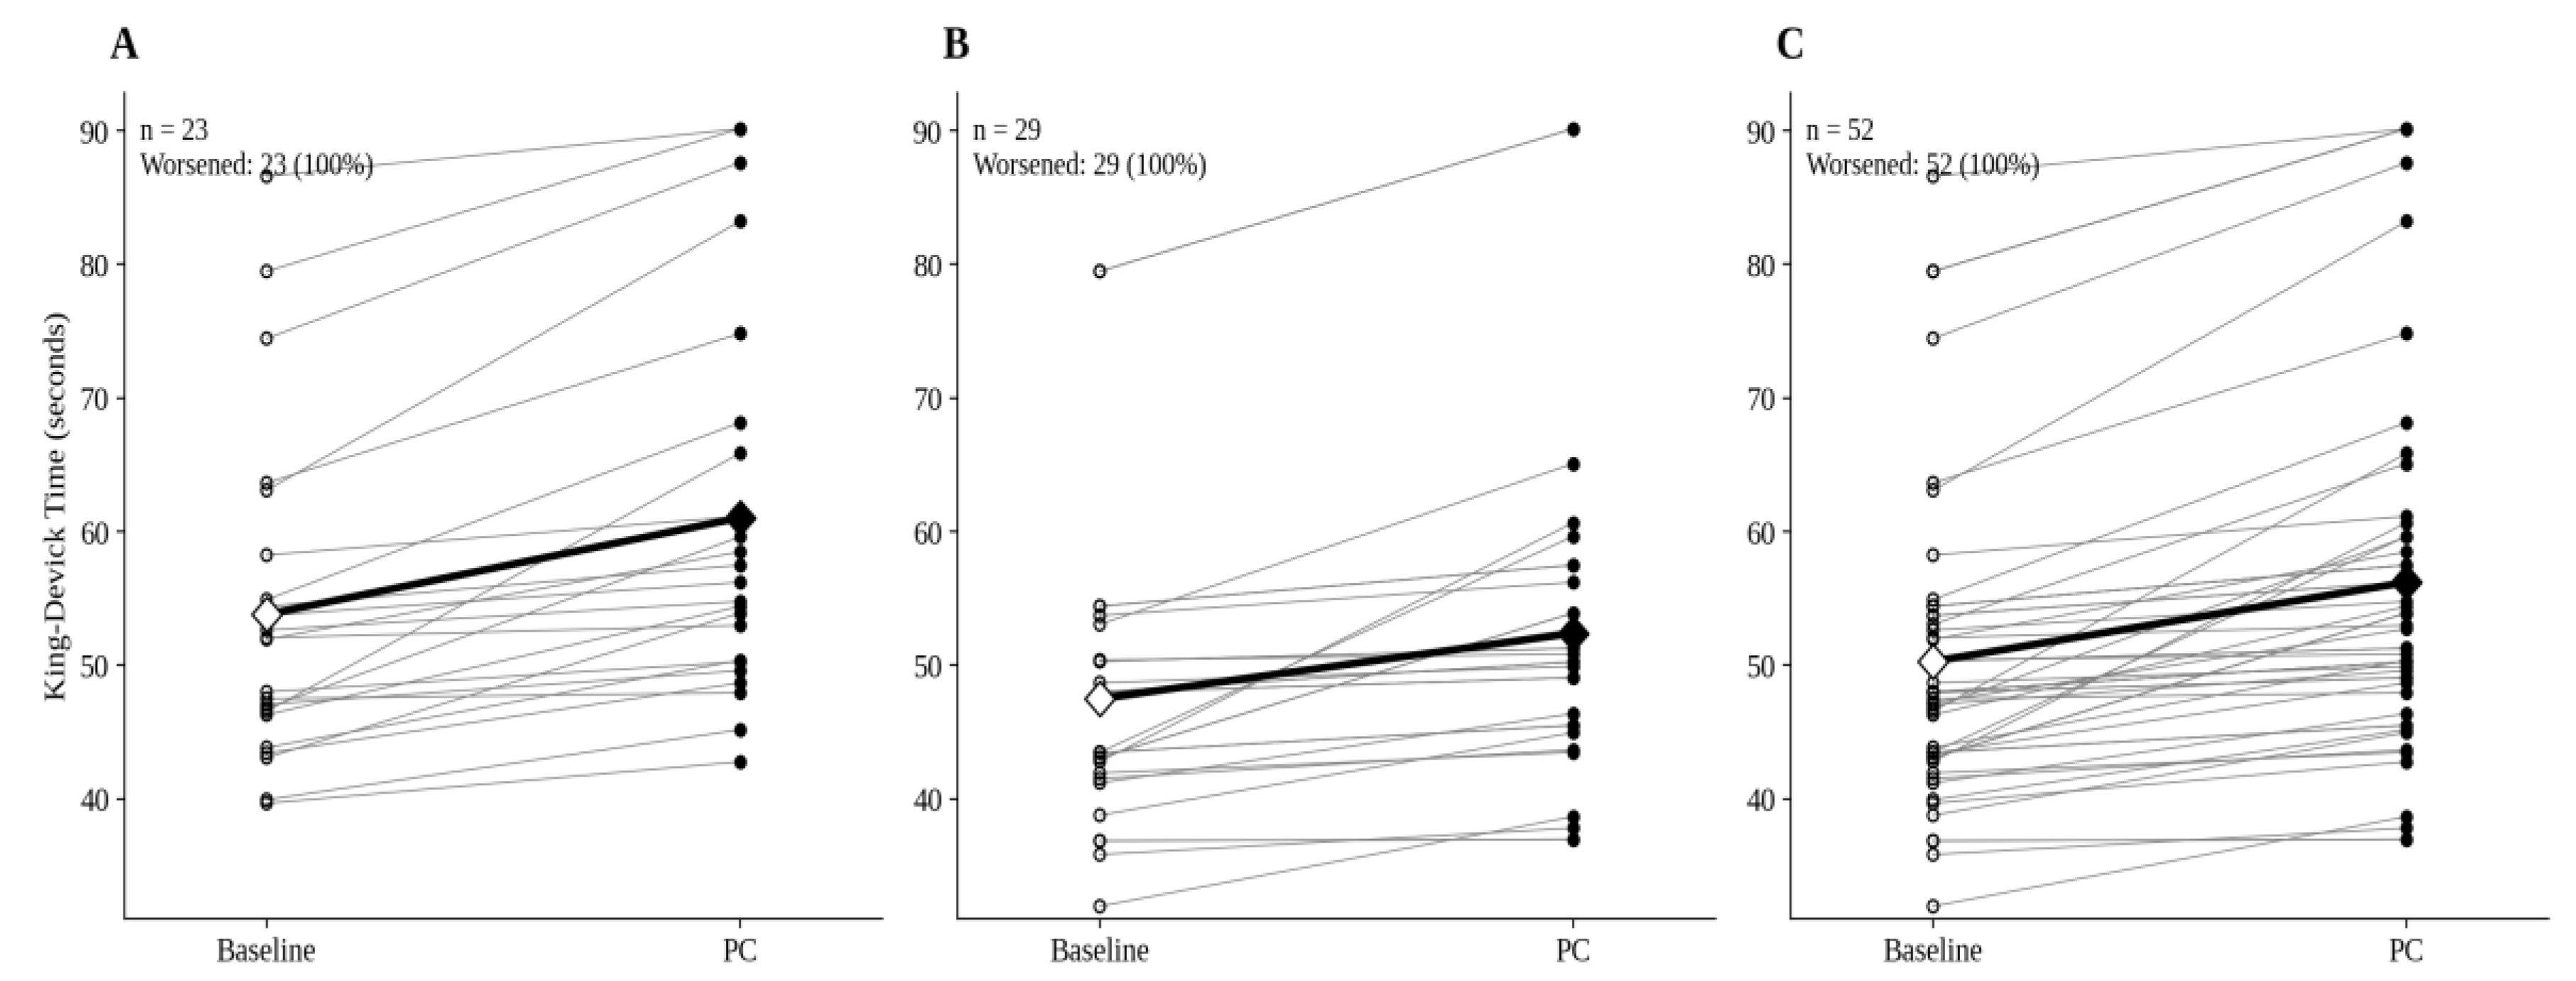
Figure 3.
Exploratory receiver operating characteristic (ROC) curves for the KDT worsening score. A: Roller Derby; B: Rugby League; C: Both Sports Combined. Markers show the sensitivity and false-positive rate at the MDC90 (9.26 s), MDC95 (11.03 s), fixed 3-second and fixed 5-second thresholds. The dashed diagonal denotes chance discrimination (AUC = 0.5). Non-concussed athletes were assessed with a same-day BL2 − BL1 pseudo-retest; AUC values are therefore regarded as optimistic and exploratory.
Figure 3.
Exploratory receiver operating characteristic (ROC) curves for the KDT worsening score. A: Roller Derby; B: Rugby League; C: Both Sports Combined. Markers show the sensitivity and false-positive rate at the MDC90 (9.26 s), MDC95 (11.03 s), fixed 3-second and fixed 5-second thresholds. The dashed diagonal denotes chance discrimination (AUC = 0.5). Non-concussed athletes were assessed with a same-day BL2 − BL1 pseudo-retest; AUC values are therefore regarded as optimistic and exploratory.
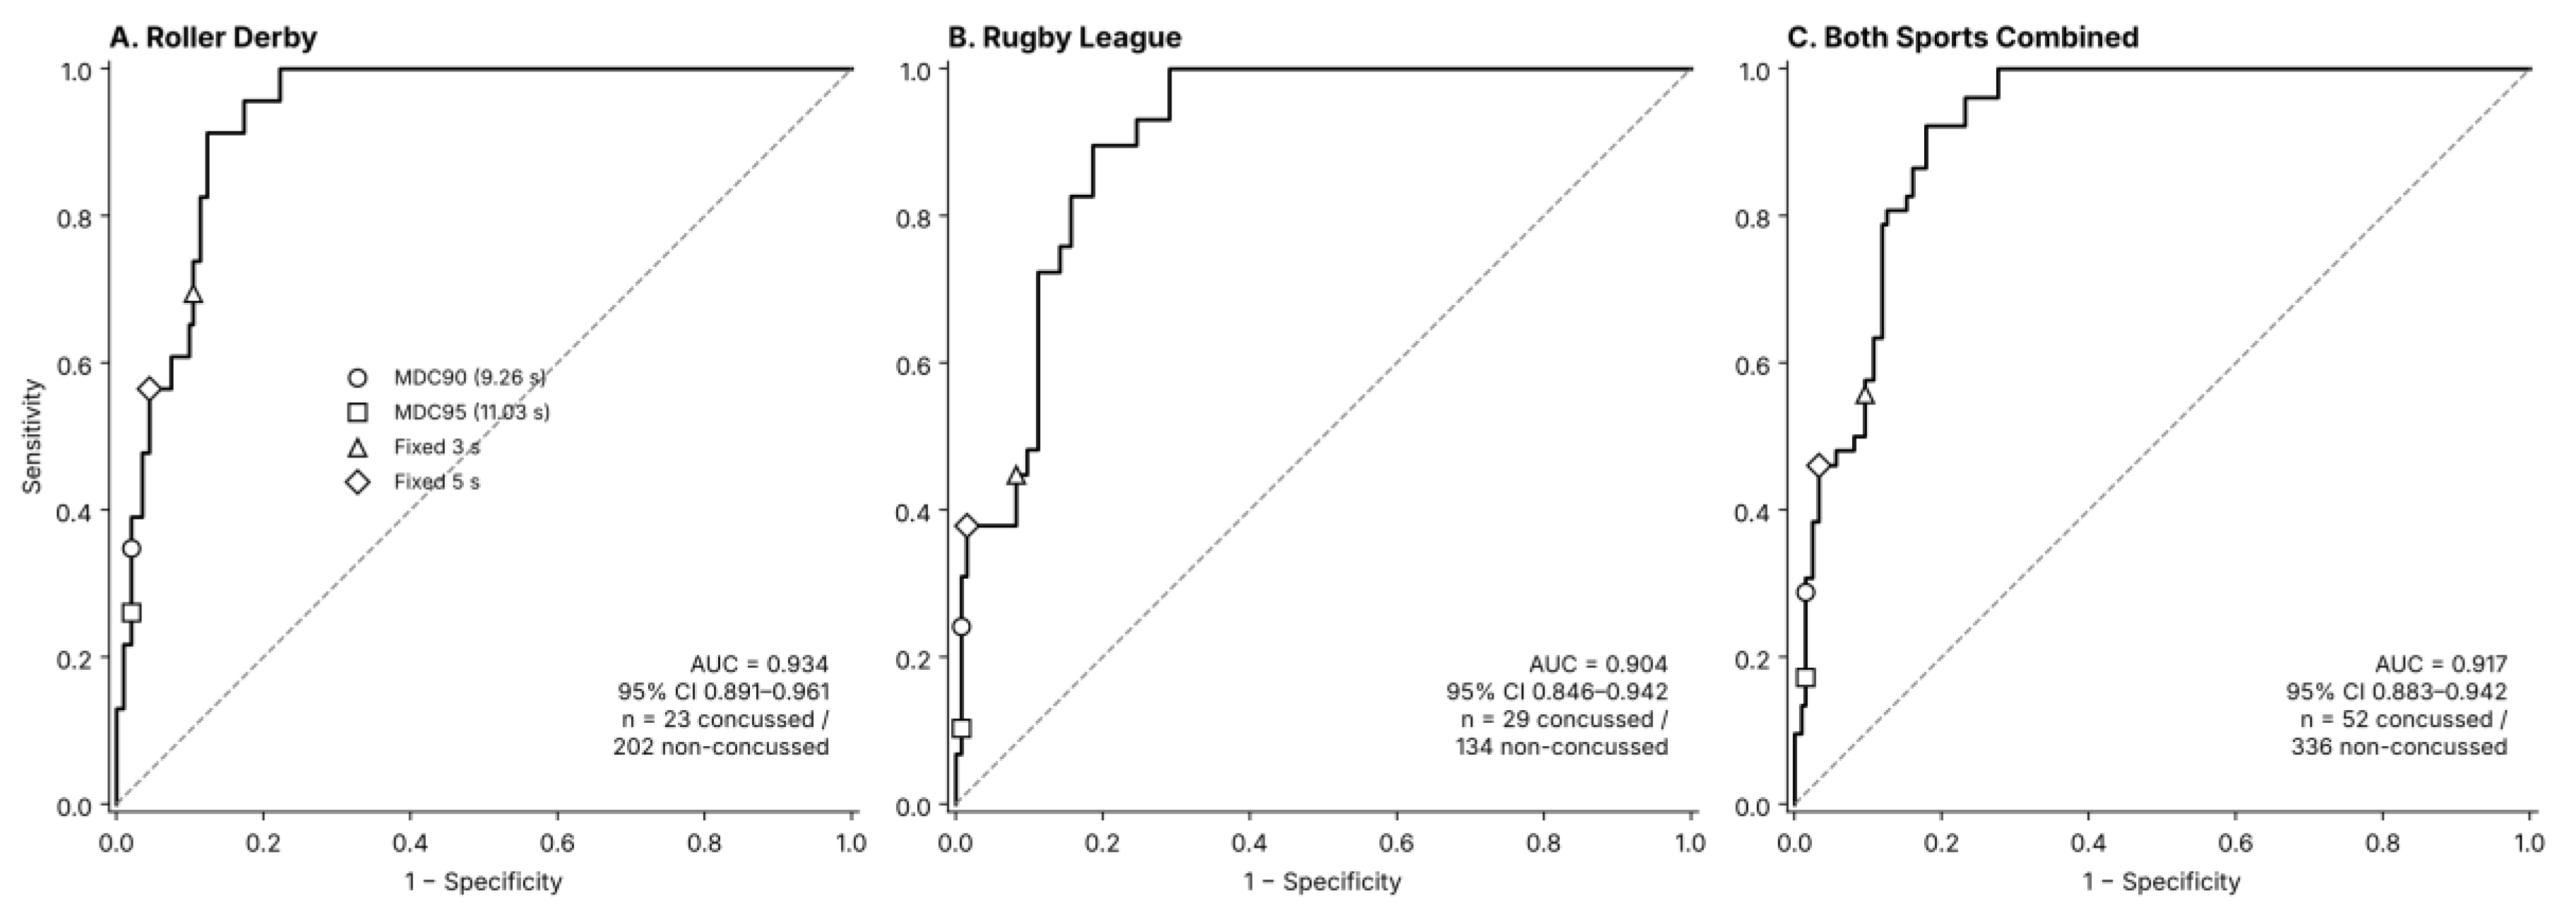

Table 1.
Concussion incidence rates and estimated concussion risk by sport and pooled sample.
| Metric | Roller Derby | Rugby League | Both Sports Combined |
|---|---|---|---|
| Squad size (players) | 10 | 13 | - |
| Match duration | 2×30 min = 1.00 hr | 2×35 min = 1.167 hr | 1.076 hr†† |
| Total matches (2023–2026) | 52 (10, 18, 10, 14) | 44 (11, 11, 10, 12) | 96 |
| Mean matches/season | 13.0 | 11.0 | - |
| Recorded exposure (hours) | 345.0 | 409.5 | 754.5 |
| Concussions (n=) | 23 | 29 | 52 |
| Incidence rate (per 1000 PEH) | 66.7 [42.3-100.0] | 70.8 [47.4-101.7] | 68.9 [51.5-90.4] |
| Incidence Rate Ratio (RD:RL) | - | - | 0.941 [0.520-1.685] |
| P(≥1 concussion) per match | 6.5% (1 in 16) | 7.9% (1 in 12.6) | 7.2% (1 in 14.0) |
| Est. exposure/player/season (hours) | 13.00 | 12.83 | 12.92†† |
| λ (expected concussions/player/season) | 0.867 | 0.909 | 0.891 |
| P(≥1 concussion) per season | 57.96% (1 in 1.7) | 59.69% (1 in 1.7) | 58.95% (1 in 1.7) |
| Theoretical max exposure (hours) | 520.0 | 667.33 | - |
| Theoretical : recorded exposure ratio | 1.51× | 1.63× | - |
PEH = player-exposure hours; Incidence rate 95% CI calculated using the exact Poisson method [63]; Per-season exposure estimated assuming an athlete plays all matches for the full match duration each season; Theoretical maximum exposure = squad size × match duration × total matches, without adjustment for substitution/interchange patterns. Per-match and per-season probabilities are scenario calculations assuming a constant hazard, independent events and full participation, and do not represent observed athlete risk. †† = Combined match duration and per-player season exposure are matches-weighted averages across the two sports (weighted by total matches, 52 and 44 respectively), since match duration and season structure differ between sports and cannot be pooled directly.
Table 2.
Baseline King-Devick Test performance and practice effects by cohort, sport and pooled sample.
Table 2.
Baseline King-Devick Test performance and practice effects by cohort, sport and pooled sample.
| Mean and standard deviation (SD) | Median (IQR] | ||||||||||
|---|---|---|---|---|---|---|---|---|---|---|---|
| Cohort | n= | BL1 | BL2 | Diff | Baseline | BL1 | BL2 | Diff | Baseline | Cohen’s dz (95% CI) | |
| Roller Derby 2023 | 80 | 54.00 ±9.31b | 51.00 ±8.56a | -3.01 ±5.64 | 50.19 ±8.63 | 52.19 [47.96-59.10]b | 50.55 [45.85-54.80]a | -2.70 [-5.70-0.03] | 49.07 [44.90-54.22] | -0.534 (-0.768 to -0.299) | |
| Roller Derby 2024 | 47 | 53.35 ±11.96b | 50.82 ±10.81a | -2.52 ±4.64 | 50.28 ±10.82 | 52.99 [46.20-58.17]b | 49.34 [43.84-55.71]a | -1.89 [-4.27-0.51] | 47.99 [43.84-54.16] | -0.544 (-0.850 to -0.238) | |
| Roller Derby 2025 | 49 | 53.64 ±10.79b | 50.70 ±10.22a | -2.94 ±4.91 | 49.99 ±10.04 | 50.81 [47.06-58.15]b | 48.53 [44.61-54.90]a | -2.78 [-5.40- -0.29] | 48.42 [43.74-52.75] | -0.599 (-0.903 to -0.295) | |
| Roller Derby 2026 | 49 | 50.73 ±9.60 | 49.17 ±8.01 | -1.56 ±5.24 | 48.12 ±7.57 | 49.34 [44.46-53.82] | 49.96 [43.47-52.90] | -0.92 [-2.94-0.52] | 48.12 [43.07-51.93] | -0.298 (-0.584 to -0.012) | |
| Roller Derby TOTAL† | 225 | 53.07 ±10.31b | 50.50 ±9.30a | -2.58 ±5.20 | 49.71 ±9.22 | 51.59 [46.62-58.15]b | 49.62 [44.34-54.42]a | -2.03 [-4.93-0.17] | 48.42 [43.74-53.71] | 0.496 (-0.634 to -0.357) | |
| Rugby League 2023 | 62 | 51.32 ±8.98b | 48.62 ±8.61a | -2.70 ±6.36 | 47.82 ±8.51 | 51.20 [46.09-54.79]b | 48.27 [43.46-52.78]a | -1.94 [-4.12-0.35] | 47.16 [42.71-52.28] | -0.424 (-0.684 to -0.164) | |
| Rugby League 2024 | 31 | 52.94 ±10.45b | 51.55 ±10.03a | -1.38 ±2.77 | 50.93 ±10.07 | 53.61 [46.63-57.84]b | 50.28 [45.61-56.67]a | -1.82 [-3.01-0.69] | 50.28 [45.61-54.79] | -0.500 (-0.874 to -0.127) | |
| Rugby League 2025 | 36 | 50.39 ±9.76b | 48.08 ±9.41a | -2.31 ±4.58 | 47.63 ±9.16 | 50.58 [45.34-54.94]b | 46.79 [41.81-53.27]a | -0.48 [-3.24-0.16] | 46.69 [41.81-53.21] | -0.506 (-0.852 to -0.159) | |
| Rugby League 2026 | 34 | 47.93 ±8.73b | 44.88 ±7.91a | -3.05 ±4.66 | 44.54 ±7.73 | 47.76 [39.30-52.06]b | 44.30 [37.88-50.67]a | -2.19 [-5.74-0.13] | 44.30 [37.86-49.42] | -0.655 (-1.026 to -0.285) | |
| Rugby League TOTAL† | 163 | 50.71 ±9.45b | 48.28 ±9.11a | -2.44 ±5.09 | 47.68 ±8.97 | 50.43 [45.86-55.04]b | 47.93 [42.26-52.85]a | -1.87 [-3.88-0.32] | 46.87 [41.92-52.73] | -0.479 (-0.641 to -0.317) | |
| Both Sports Combined† | 388 | 52.08 ±10.01b | 49.56 ±9.27a | -2.52 ±5.15 | 48.86 ±9.16 | 50.87 [46.01-56.45]b | 48.62 [43.47-53.72]a | -1.99 [-4.41-0.20] | 47.71 [43.18-53.06] | -0.489 (-0.595 to -0.384) | |
†=Pooled aggregate, not an independent sample; BL1 = Baseline 1; BL2 = Baseline 2; Diff = Difference between BL1 and BL2; Negative values indicate the BL2 was faster (better) than BL1; Cohen’s dz = mean difference / SD of the paired differences (equivalent to paired t/√N); Significant (p<0.05) pairwise difference between (a) = BL1 and (b) = BL2 following Holm-Bonferroni correction.
Table 3.
Reliability, measurement error, and association statistics for King-Devick Test performance.
Table 3.
Reliability, measurement error, and association statistics for King-Devick Test performance.
| Cohort | n= | ICC(2,1) (95% CI) | F= (df1, df2) | SEM (s) | MDC90 (s) | MDC95 (s) | Pearson r | |
|---|---|---|---|---|---|---|---|---|
| Roller Derby 2023 | 80 | 0.760 (0.560-0.860) | 9.058 (79,79) | 4.38 (3.60-5.07) | 10.19 (8.36-11.80) | 12.14 (9.97-14.06) | 0.804 | |
| Roller Derby 2024 | 47 | 0.897 (0.770-0.950) | 23.117 (46,46) | 3.66 (2.30-4.88) | 8.52 (5.35-11.34) | 10.16 (6.37-13.52) | 0.922 | |
| Roller Derby 2025 | 49 | 0.859 (0.670-0.930) | 17.313 (48,48) | 3.95 (3.03-4.80) | 9.18 (7.04-11.16) | 10.94 (8.39-13.30) | 0.892 | |
| Roller Derby 2026 | 49 | 0.815 (0.690-0.890) | 10.399 (48,48) | 3.81 (2.73-4.77) | 8.85 (6.36-11.09) | 10.55 (7.58-13.21) | 0.838 | |
| Roller Derby TOTAL† | 225 | 0.832 (0.710-0.890) | 13.269 (224,224) | 4.03 (3.52,4.50) | 9.37 (8.19-10.47) | 11.16 (9.76-12.47) | 0.864 | |
| Rugby League 2023 | 62 | 0.709 (0.520-0.820) | 6.660 (61,61) | 4.75 (3.14-6.36) | 11.05 (7.30-14.80) | 13.16 (8.70-17.63) | 0.740 | |
| Rugby League 2024 | 31 | 0.956 (0.890-0.980) | 53.878 (30,30) | 2.15 (1.73-2.56) | 5.00 (4.01-5.96) | 5.96 (4.78-7.10) | 0.964 | |
| Rugby League 2025 | 36 | 0.864 (0.700-0.930) | 16.564 (35,35) | 3.54 (2.20-4.70) | 8.23 (5.13-10.93) | 9.81 (6.11-13.02) | 0.887 | |
| Rugby League 2026 | 34 | 0.794 (0.490-0.910) | 11.784 (33,33) | 3.78 (2.48-4.73) | 8.80 (5.78-11.01) | 10.48 (6.88-13.12) | 0.848 | |
| Rugby League TOTAL† | 163 | 0.822 (0.700-0.890) | 12.313 (162,162) | 3.91 (3.08-4.83) | 9.11 (7.16-11.23) | 10.85 (8.54-13.39) | 0.850 | |
| Both Sports Combined† | 388 | 0.830 (0.710-0.890) | 13.068 (387,387) | 3.98 (3.53-4.45) | 9.26 (8.20-10.35) | 11.03 (9.77-12.34) | 0.860 | |
†=Pooled aggregate rather than an independent sample. ICC = intraclass correlation coefficient (ICC(2,1), two-way random-effects, absolute-agreement, single-measures model); SEM = standard error of measurement; MDC = minimal detectable change at the 90% (MDC90) and 95% (MDC95) confidence levels; Values in brackets for SEM, MDC90, and MDC95 represent bootstrap 95% confidence intervals (3,000 resamples); Pearson r is reported as a descriptive measure of association between BL1 and BL2 (all p<0.001).
Table 4.
Diagnostic accuracy of King-Devick Test worsening thresholds for clinician-confirmed concussion (exploratory; comparator = same-day preseason retest observations).
Table 4.
Diagnostic accuracy of King-Devick Test worsening thresholds for clinician-confirmed concussion (exploratory; comparator = same-day preseason retest observations).
| Threshold | Conc. / non-conc. | Sensitivity (95% CI) | Specificity (95% CI) | PPV (95% CI) | NPV (95% CI) | LR+ (95% CI) | LR− (95% CI) | Youden J (95% CI) | |
|---|---|---|---|---|---|---|---|---|---|
| Roller Derby (WFTRD)† | |||||||||
| MDC90 | 23 / 202 | 34.8% (18.8-55.1%) | 98.0% (95.0-99.2%) | 66.7% (39.1-86.2%) | 93.0% (88.7-95.7%) | 17.57 (5.73-53.84) | 0.67 (0.49-0.90) | 0.328 (0.132-0.524) | |
| MDC95 | 26.1% (12.5-46.5%) | 98.0% (95.0-99.2%) | 60.0% (31.3-83.2%) | 92.1% (87.7-95.0%) | 13.17 (4.01-43.28) | 0.75 (0.59-0.96) | 0.241 (0.061-0.422) | ||
| Fixed 3 s | 69.6% (49.1-84.4%) | 89.6% (84.6-93.1%) | 43.2% (28.7-59.1%) | 96.3% (92.5-98.2%) | 6.69 (4.11-10.89) | 0.34 (0.18-0.63) | 0.592 (0.399-0.784) | ||
| Fixed 5 s | 56.5% (36.8-74.4%) | 95.5% (91.8-97.6%) | 59.1% (38.7-76.7%) | 95.1% (91.2-97.3%) | 12.69 (6.10-26.39) | 0.46 (0.29-0.73) | 0.521 (0.316-0.725) | ||
| Total | 91.3% (73.2-97.6%) | 87.6% (82.4-91.5%) | 45.7% (32.2-59.8%) | 98.9% (96.0-99.7%) | 7.38 (5.00-10.87) | 0.10 (0.03-0.37) | 0.789 (0.665-0.913) | ||
| Rugby League (WRL)† | |||||||||
| MDC90 | 29 / 134 | 24.1% (12.2-42.1%) | 99.3% (95.9-99.9%) | 87.5% (52.9-97.8%) | 85.8% (79.4-90.4%) | 32.34 (4.14-252.89) | 0.76 (0.62-0.94) | 0.234 (0.077-0.390) | |
| MDC95 | 10.3% (3.6-26.4%) | 99.3% (95.9-99.9%) | 75.0% (30.1-95.4%) | 83.6% (77.1-88.6%) | 13.86 (1.49-128.57) | 0.90 (0.80-1.02) | 0.096 (-0.016-0.208) | ||
| Fixed 3 s | 44.8% (28.4-62.5%) | 91.8% (85.9-95.4%) | 54.2% (35.1-72.1%) | 88.5% (82.1-92.8%) | 5.46 (2.72-10.95) | 0.60 (0.43-0.84) | 0.366 (0.179-0.553) | ||
| Fixed 5 s | 37.9% (22.7-56.0%) | 98.5% (94.7-99.6%) | 84.6% (57.8-95.7%) | 88.0% (81.8-92.3%) | 25.41 (5.95-108.58) | 0.63 (0.47-0.84) | 0.364 (0.187-0.542) | ||
| Total | 89.7% (73.6-96.4%) | 81.3% (73.9-87.0%) | 51.0% (37.7-64.1%) | 97.3% (92.4-99.1%) | 4.81 (3.30-6.99) | 0.13 (0.04-0.37) | 0.710 (0.581-0.839) | ||
| Both Sports Combined† | |||||||||
| MDC90 | 52 / 336 | 28.8% (18.3-42.3%) | 98.5% (96.6-99.4%) | 75.0% (53.1-88.8%) | 89.9% (86.4-92.6%) | 19.38 (7.36-51.09) | 0.72 (0.61-0.86) | 0.274 (0.150-0.397) | |
| MDC95 | 17.3% (9.4-29.7%) | 98.5% (96.6-99.4%) | 64.3% (38.8-83.7%) | 88.5% (84.9-91.4%) | 11.63 (4.06-33.35) | 0.84 (0.74-0.95) | 0.158 (0.055-0.262) | ||
| Fixed 3 s | 55.8% (42.3-68.4%) | 90.5% (86.9-93.2%) | 47.5% (35.5-59.8%) | 93.0% (89.7-95.3%) | 5.86 (3.89-8.81) | 0.49 (0.36-0.66) | 0.462 (0.324-0.601) | ||
| Fixed 5 s | 46.2% (33.3-59.5%) | 96.7% (94.2-98.2%) | 68.6% (52.0-81.4%) | 92.1% (88.8-94.5%) | 14.10 (7.35-27.04) | 0.56 (0.43-0.72) | 0.429 (0.292-0.566) | ||
| Total | 92.3% (81.8-97.0%) | 82.1% (77.7-85.9%) | 44.4% (35.4-53.8%) | 98.6% (96.4-99.4%) | 5.17 (4.06-6.59) | 0.09 (0.04-0.24) | 0.745 (0.661-0.828) | ||
Conc. / non-con = Concussed / non-concussed; †=Pooled aggregate, not an independent sample; Worsening score = post-concussion minus baseline time (concussed) or BL2 − BL1 (same-day pseudo-retest; non-concussed); The MDC90 (9.26 s) and MDC95 (11.03 s) thresholds are those derived in the Both-Sports-Combined sample and are applied unchanged to every sample; 95% CIs: Wilson score (sensitivity, specificity, PPV, NPV, accuracy); log method (LR+, LR−); Wald (Youden J); PPV = positive predictive value; NPV = negative predictive value; LR+ = positive likelihood ratio; LR− = negative likelihood ratio; Youden J = sensitivity + specificity − 1. PPV, NPV and accuracy depend on each sample’s own concussion prevalence and are not comparable across samples; “Total” = Youden-optimal cutoff for each sample (Both Sports Combined ≥0.93 s; Roller Derby ≥2.14 s; Rugby League ≥0.98 s).
Table 5.
Baseline-to-post-concussion assessment intervals by cohort.
| Days | ||||||||
|---|---|---|---|---|---|---|---|---|
| Cohort | n= | Mean (SD) | Median [IQR] | Range | t | p | ||
| Roller Derby 2023 | 7 | 128.0 (105.4) | 200.0 [25.5-200.0] | 0-245 | 3.213 | 0.018 | ||
| Roller Derby 2024 | 8 | 28.4 (23.3) | 18.0 [12.0-40.25] | 9-77 | 3.447 | 0.011 | ||
| Roller Derby 2025 | 3 | 153.7 (74.6) | 165.0 [119.5-193.5] | 74-222 | 3.566 | 0.070 | ||
| Roller Derby 2026 | 5 | 98.2 (62.3) | 65.0 [47.0-166.0] | 47-166 | 3.523 | 0.024 | ||
| Roller Derby TOTAL† | 23 | 90.2 (82.6) | 47.0 [20.5-166.0] | 0-245 | 5.237 | <0.001 | ||
| Rugby League 2023 | 15 | 66.4 (21.8) | 59.0 [54.0-76.0] | 30-107 | 11.802 | <0.001 | ||
| Rugby League 2024 | 7 | 71.3 (20.4) | 72.0 [61.5-83.5] | 39-98 | 9.256 | <0.001 | ||
| Rugby League 2025 | 3 | 40.0 (16.7) | 37.0 [31.0-47.5] | 25-58 | 4.148 | 0.053 | ||
| Rugby League 2026 | 4 | 65.0 (17.1) | 65.0 [59.8-70.3] | 44-86 | 7.582 | 0.005 | ||
| Rugby League TOTAL† | 29 | 64.7 (21.3) | 60.0 [53.0-73.0] | 25-107 | 16.312 | <0.001 | ||
| Both Sports Combined† | 52 | 76.0 (58.0) | 59.5 [40.8-88.0] | 0-245 | 9.452 | <0.001 | ||
†=Pooled aggregate, not an independent sample; One-sample t-test of the Baseline-to-PC interval against 0 days (the BL1–BL2 interval observed in all 388 records without exception).
Disclaimer/Publisher’s Note: The statements, opinions and data contained in all publications are solely those of the individual author(s) and contributor(s) and not of MDPI and/or the editor(s). MDPI and/or the editor(s) disclaim responsibility for any injury to people or property resulting from any ideas, methods, instructions or products referred to in the content. |
© 2026 by the authors. Licensee MDPI, Basel, Switzerland. This article is an open access article distributed under the terms and conditions of the Creative Commons Attribution (CC BY) license (http://creativecommons.org/licenses/by/4.0/).
Copyright: This open access article is published under a Creative Commons CC BY 4.0 license, which permit the free download, distribution, and reuse, provided that the author and preprint are cited in any reuse.