

Submitted:
03 November 2026
Posted:
04 November 2026
You are already at the latest version
Abstract
Coconut shell is a lignin-rich agro-waste. In this study, lignin was extracted from coconut shell by ethanol organosolv catalyzed by hydrochloric acid (HCl). The effects of ethanol concentration (50 to 90%, v/v), time (15 to 90 min), temperature (100 to 190 °C) and HCl loading (0.4 to 4%, w/w) on yield were modeled with a Box–Behnken design. Temperature, time and HCl loading were sig-nificant (R² = 0.95, predicted R² = 0.70). The highest yield (18.6%) was obtained with 70% ethanol and 2.2% HCl at 190 °C for 90 min. This lignin (HCl-Ethanosolv-CSL) was compared with com-mercial alkaline lignin (AlkL). HCl-Ethanosolv-CSL contained 91.7% total lignin and 0.35% ash. FT-IR and NMR showed a G-rich GS-type lignin (S/G = 0.23) with p-hydroxybenzoate esters and ethoxyl groups introduced by HCl-catalyzed reaction with ethanol. Its total phenolic content was 785.9 mg gallic acid equivalent g−1, compared with 580.6 mg g−1 for AlkL. HCl-Ethanosolv-CSL scavenged radicals more effectively than AlkL (in-well IC50 11.6 vs 16.7 µg mL−1 for ABTS). This activity is attributed to free phenolic hydroxyl groups and to ortho-methoxyl groups that stabilize the phenoxyl radical. HCl-Ethanosolv-CSL showed weak, strain-dependent antibacterial activity, mainly against Bacillus species. GPC showed a large apparent molecular size, which indicates strong association of the lignin chains in solution.
Keywords:
ethanosolv
; coconut shell lignin
; HCl-Ethanosolv-CSL
; Box-Behnken design
; HCl catalyst
; antiox-idant
; antibacterial activity
1. Introduction
The rapid expansion of agro-industrial activities has amplified global bio-waste generation to 2 billion tons annually, spotlighting lignin, a structurally complex biopolymer with untapped potential as a critical target for sustainable bioactive compound recovery. Coconut shells, a lignin-rich feedstock, stand out among these byproducts, offering a renewable alternative to conventional lignin sources like wood pulp. In Asian countries, where food industries generate massive quantities of coconut byproducts, this material represents a substantial opportunity. Thailand’s coconut milk production alone yielded ~858,000 tons of fruit in 2018, leaving nearly 200,000 tons of shells as residue [1]. Yet, disposal practices like open burning squander this resource and contribute to 21% of greenhouse gas emissions [2]. Coconut shells consist mainly of cellulose (25-30.58%), hemicellulose (26.70-27%), lignin (33.30-46%), and ash (0.1 to 0.56%). Their lignin content is higher than that of many woody biomasses. This makes them a promising raw material for producing biofuels, biomaterials, and fine chemicals [3]. Despite this substantial lignin content, they are largely underutilized in biorefinery systems. Few studies have provided deeper insights into the functional properties of this aromatic backbone, even though such investigations could diversify lignin supply chains and unlock future high-value, sustainable materials. Lignin is the primary organic building block in the coconut endocarp, which protects the fruit from bacterial and pathogenic attacks due to its dense and hydrophobic nature. This protective function may also have broader applications outside the plant. The native polymer is built from three types of phenylpropane units and carries functional groups capable of absorbing UV irradiation and scavenging free radicals [4]. However, deconstructing the native structural network of lignin into useful bioactive molecules remains a research priority. In coconut, the common monolignols are p-coumaryl (H), coniferyl (G), and sinapyl (S), with a high proportion of G-lignin units (S/G ratio of 0.23). This dominance, combined with a high degree of polymerization, presents unique challenges for recovering lignin from coconut shells compared with herbaceous biomass. The highly reactive G units contribute to a densely cross-linked and compact lignin structure that requires advanced technology to break down C-C bonds and access bioactive compounds, consequently limiting valorization to low-value activated carbon for rubber composites [5]. These resistant carbon-carbon linkages exhibit a strong bond dissociation energy ranging from 226 to 494 kJ mol−1 [6], requiring harsh conditions to initiate lignin depolymerization.
Still, organic solvents that form a single homogeneous phase with water, especially polar protic solvents like ethanol, are considered effective and inexpensive agents for lignin solubilization. These binary systems contain nucleophilic species with the ability to cleave α- and β-aryl ether linkages present in lignin and effectively dissolve lignin fragments by enhancing mass transfer between the extraction medium and the substrate [7]. Generally, water solubilizes hydrophilic lignin fractions with polar functional groups. In contrast, with its polar hydroxyl group (–OH) and non-polar hydrocarbon tail, ethanol can interact with both hydrophilic and hydrophobic regions of lignin [8]. Previous research has shown that autocatalytic organosolv is an environmentally friendly method for lignin extraction since acids released from biomass act, in turn, as natural catalysts; thus, omitting the need for chemical catalyst addition. However, this process requires high temperatures (185–210 °C) to initiate the reaction [9]. This temperature range may be economically infeasible due to high energy consumption and can cause marked molecular alterations to the lignin (e.g., reactivity and solubility). Thus, adding the acid-catalytic agent to the ethanol/water system can increase the reaction rate and make fractionation more selective.
Acid-catalyzed organosolv, such as HCl-assisted protocols, offers selective β-O-4 cleavage (C–O: 209–348 kJ mol−1) via protonation and carbocation intermediates, generating bioactive phenolic derivatives [10]. However, a critical trade-off exists that harsh extraction conditions may increase the output but significantly lower its bioactivity by promoting condensation of the aromatic units or char formation. Conversely, milder conditions preserve lignin’s native structural motifs, critical for antioxidant and antimicrobial functions, at the expense of lower yields. A recent study has highlighted this concern. da Mata et al. [11] introduced an acetosolv method to enhance coconut lignin acetylation, improving yield, solubility, and UV-blocking performance. However, this approach has shown some limitations. Although the study reported an IC50 of 46.6–67.5 μg/mL in DPPH assays, the acetylation process altered lignin’s native phenolic hydroxyl groups critical for antioxidant activity, leading to approximately a 40% reduction in free radical scavenging capacity compared to unmodified lignin, as observed in other studies where phenolic groups were preserved [12,13]. Statistical optimization of the process parameters can lower the cost and, simultaneously, achieve high lignin recovery from laboratory to industrial level application. The optimization of parameters significantly influencing lignin extraction is thus necessary to fully capitalize on the benefits of organosolv.
This study used a Box-Behnken design (BBD) to optimize lignin extraction from coconut shell by HCl-catalyzed ethanol organosolv. Four factors (time, temperature, HCl concentration and ethanol concentration) were studied at three levels each. The objective was to maximize lignin yield. The lignin obtained under the selected condition (HCl-Ethanosolv-CSL) was then compared with commercial alkaline lignin (AlkL). We compared their composition, structure, total phenolic content, antioxidant activity and antibacterial activity. The aim was to relate the structure of the lignin to its biological activity.
2. Results and Discussion
2.1. Model Adequacy for Lignin Yield
In this study, we aimed to maximize lignin fractionation from coconut shell by acid-assisted organosolv. The Box-Behnken design (BBD) was employed to study the interaction of the HCl catalyst with the other ethanosolv process variables on coconut shell lignin yield (YCSL). The specified ranges of independent variables, i.e., ethanol concentration (50-90%), temperature (100-190 °C), HCl concentration (0.4-4% w/w), and time (15-90 min) were chosen based on the literature (Table 1). The advantage of using this RSM technique in our research is that it avoids conducting experiments under extreme conditions. The BBD does not include runs in which all factors are at their extreme levels at the same time. However, it still shows how the extraction parameters interact and affect the response. A quadratic model was fitted to describe these interactions. The results of the lignin extraction yield (response) recovered from twenty-nine runs according to the experimental matrix are summarized in Table S1. The yield of extracted lignin varied from 0.5 to 18.6%. The maximum lignin yield (18.6%) was achieved in run no. 19, using 70% (v/v) ethanol and 2.2% (w/w) HCl at 190 °C for 90 min. In contrast, the lowest yield, only 0.5%, was recorded in run no. 26 (90% ethanol, 2.2% HCl, 145 °C, 15min). Lignin has multiple functional groups with different pKa values. It will coagulate in solution depending on other extraction conditions such as temperature and pH. This phenomenon occurs due to attractive collision forces between particles, such as van der Waals forces, hydrogen bonding, and ionic interactions. When these forces become stronger than the repulsive forces, lignin particles aggregate [15]. Our yield range agrees with earlier studies. Choi et al.[16] conducted a response-surface-methodology study on ethanol organosolv extraction of lignin from Jolcham oak (Quercus serrata), using 65–93.6% v/v ethanol, 0.16–1.84% w/v H₂SO₄, and temperatures ranging from 126–193.6 °C for 40 min. They reported ethanol organosolv lignin (EOL) yields varying from 6.90% under mild conditions (126.4 °C, 1% H₂SO₄, 60% EtOH) to a maximum of 22.79% at 193.6 °C, 1% H₂SO₄, and 60% EtOH.
Multiple regression analysis was used to analyze experimental data to fit a second-order polynomial equation (Equation (1)). Positive terms in the equation designate effects that enhance YCSL, while negative terms indicate antagonistic effects on YCSL. The coefficients refer to coded factor levels (−1, 0, +1), and YCSL is expressed as g of lignin per g of coconut shell.
Among the four parameters examined, temperature had the strongest effect on lignin yield (p < 0.05), followed by residence time and acid catalyst concentration (Table 2, Figure 1b). The developed regression model effectively captured these relationships, demonstrating strong predictive power with high coefficient of determination (R² = 0.95) and adjusted R² (0.89) values, both above 0.80. This indicates good agreement between the experimental and predicted yields. A higher R² value signifies a better model fit, while adjusted R² accounts for the number of predictors in the model, providing a more accurate measure of fit when multiple variables are involved.
The model accuracy was further confirmed by the low RMSE (0.0164 g), indicating excellent agreement between predicted and experimental yields.
The lack of fit was significant (F = 134.59, p = 0.0001). The five center-point runs were very close to each other (4.0 to 4.4%), so the pure error was very small (Table 3). However, the lack of fit also shows that a second-order model cannot fully describe the steep, non-linear rise in yield at high temperature and long time. The predicted R2 was 0.70. This is lower than the adjusted R2 (0.89) but still acceptable for describing trends. The residuals were normally distributed (Shapiro–Wilk p = 0.22). Run 29 (90% ethanol, 4% HCl, 145 °C, 52.5 min) had the largest externally studentized residual (4.66, above the Bonferroni limit of 3.93) and a Cook’s distance of 0.82. A model fitted to log10-transformed yield gave the same R2 (0.95), no outlying runs (largest residual 2.78) and a smaller lack of fit (F = 87.3). Model predictions near the edges of the design space should therefore be treated with caution.
The ANOVA showed that the model was significant (F = 18.01, p < 0.0001) (Table 3).
2.2. Effect of Independent Variables on Coconut Shell Lignin Yield
The extraction of coconut lignin was studied by analyzing the interactive effects of the experimental variables (ethanol concentration, HCl concentration, reaction temperature, and residence time). Contour plots were used to visualize the significant two-factor interactions (Figure 2). Each plot shows the predicted yield for one pair of factors, with the other factors held at their center levels. The regressive analysis showed that temperature (XTp), time (XTm), and acid concentration (XAc), except ethanol concentration (XEt), were individually significant (p < 0.05) in maximizing the lignin yield (Table 2). Darker zones indicate higher predicted yield.
The prediction profiler plot visually explains this trend, serving as an important tool for identifying the optimal value of each independent variable on the response of interest (Figure S1). The reaction temperature critically influenced the lignin extraction yield according to the regression analysis (Table 2). An increase in temperature causes particles in the reaction system to move faster as they gain more kinetic energy. In other words, higher temperatures provide more thermal energy, increasing lignin particles’ molecular mobility. This enhanced mobility facilitates the cleavage of lignin bonds, such as α- and β-aryl ether linkages, subsequently increasing lignin solubilization [17]. The results obtained in this study are consistent with earlier research conducted by Adamcyk et al. [18] on organosolv extraction of lignin from wheat straw. They observed a substantial increase in lignin yield, from 34% at 20 °C to 46% at a higher temperature, i.e., 180 °C. However, the reaction at temperatures above a certain level directly affects the trend of lignin yield and functional properties. Reactive lignin intermediates undergo electrophilic aromatic substitution, forming insoluble C–C networks that reduce free phenolic hydroxyl content, even when mass recovery remains high [19]. Chotirotsukon et al. [20] observed this trade-off in ethanosolv extraction of sugarcane bagasse at 150–175 °C, followed by additional thermal treatments of the recovered lignin up to 230 °C. The phenolic OH groups peaked near 190 °C but declined at higher temperatures due to irreversible C–C bond formation, as confirmed by ³¹P-NMR.
The lignin yield was also highly dependent on reaction time. Increasing the extraction time from 15 to 90 min showed an improved trend, as it favors solvent penetration through the dense lignocellulosic matrix by weakening the integrity of the coconut cell wall and cleaving aryl ether bonds in lignin. However, prolonged exposure may involve the possibility of thermal degradation and oxidation of sensitive lignin functional compounds due to overheating. HCl was introduced as a catalyst to address these limitations while improving process efficiency. The linear effect of HCl concentration was significant (p = 0.0011). Its interactions with temperature (p = 0.0006) and time (p = 0.0030) were also significant. Within the tested range, the model predicted that yield would keep increasing up to 4% HCl. Although the acid catalyst’s impact on yield was less significant than that of temperature (XTp) and time (XTm), it played a crucial role in protonating lignin molecules through the disruption of lignin-carbohydrate complexes (LCCs), thereby enhancing their solvent solubility. The catalytic mechanism of hydrochloric acid (HCl) in lignin depolymerization is significant as it involves specific actions targeting ether linkages, specifically α-O-4 and β-O-4. The role of HCl in reducing the activation energy necessary for bond cleavage is documented in the literature. HCl acts as a strong Brønsted acid, generating hydronium ions (H₃O⁺) that play crucial roles in enhancing depolymerization efficiency. These protons increase the electrophilicity of ether sites in lignin, making them more susceptible to hydrolysis, thereby facilitating bond cleavage. Protonation of the ether oxygen also weakens the adjacent C–O bond and promotes its cleavage [10]. In acidic conditions, β-O-4 bond cleavage is initiated via protonation and subsequent dehydration of the benzylic OH group, resulting in a benzylic carbocation. This ion can either undergo proton abstraction or Cβ–Cγ bond cleavage, which in both cases leads to the formation of an enol-ether. HCl’s higher acidity increased the reactivity of α-O-4 and β-O-4 ether groups to nucleophilic attack, promoting hydrolysis. Moreover, the chloride ion (Cl⁻) helps move a proton from the β-carbon to the α-carbon in the lignin side chain, especially in the C6-C3 parts, making the acidolysis reaction faster and more controlled [21]. No uncatalyzed control was run at the run 19 conditions (70% ethanol, 190 °C, 90 min). Acetic acid released from hemicellulose can also catalyze organosolv fractionation at this temperature, so the share of autocatalysis at run 19 cannot be separated from that of HCl. However, the significant linear HCl term and its interactions with temperature and time show that added HCl increased yield across the design space.
Ethanol concentration itself had no significant effect on the lignin extraction yield because the linear term XEt (p = 0.0837) and quadratic term XEt*XEt (p = 0.8402) were not significant (Table 2). However, XEt within the study range had a significant interaction with temperature (XEt×XTp, p = 0.0386). Similar behavior was also reported by Hamzah et al. (2020) [22] who found that the percentage of lignin recovery from Miscanthus x giganteus using 25% ethanol concentration (71.4%) did not differ significantly from the 10% ethanol concentration (75.8%), at a 95% confidence level. Solvation of ethanol and water creates non-covalent interactions, such as hydrogen, Van der Waals, and hydrophobic bonding, that strongly tend to form aggregates with other molecules [23] . Moreover, ethanol has a lower dielectric constant than water. This favors its interaction with large, less polar molecules such as lignin. The electrostatic nature of lignin’s dipole moment is influenced by the polarizability of OH-groups in the solvents to induce ether linkage cleavage [24]. These collective effects explain why ethanol concentration exhibits temperature-dependent behavior rather than an isolated impact, a critical consideration for optimizing organosolv processes targeting recalcitrant feedstocks like coconut shells.
2.3. Impact of the Interactive Variable on Lignin Yield
The significant interaction terms show that temperature, acid concentration and time act together on the lignin network of coconut shell. Higher temperature increases the rate of proton-catalyzed β-O-4 cleavage by supplying the activation energy for benzylic carbocation formation. This effect is stronger at higher acid concentration, because more protons are available to start the cleavage. The significant XEt×XTp interaction shows that ethanol concentration improves yield mainly at high temperature. At high temperature, the cell wall swells, which improves solvent penetration and α-alkoxylation of cleaved lignin fragments [25]. In Figure 2a, the contours slope only slightly with ethanol concentration, so temperature controls yield. This agrees with the small linear and quadratic effects of ethanol and its weak interactions with acid (p = 0.3924) and time (p = 0.2436). Ethanol can therefore be fixed at its center level (70%, v/v), while acid, temperature and time are adjusted to maximize yield. In contrast, acid concentration, temperature and time must be optimized together. Raising one without adjusting the others can leave the catalyst under-used or cause excessive side reactions. This is shown by the curved contours in Figure 2b to d and by the significant XAc×XTp, XAc×XTm and XTp×XTm terms in Table 2.
The positive quadratic coefficient for temperature (p = 0.0223) shows that yield increased more steeply at higher temperatures. No decline in yield was observed within the tested range. At temperatures above 190 °C, however, condensation of reactive intermediates into C–C-linked networks and pseudo-lignin could lower both yield and quality. Most earlier studies on organosolv delignification of coconut shell varied one parameter at a time, such as temperature or catalyst loading. This approach cannot reveal the interactions shown by our regression model. For example, Avelino et al. [26] studied microwave-assisted organosolv extraction of coconut shell lignin with Brønsted and Lewis acid catalysts. They varied treatment time (5 to 30 min) and acid concentration (0.5 to 2.0%, v/v) at a fixed temperature of 110 °C. They obtained the highest lignin yield with 2.0% catalyst after 20 min. However, because temperature was fixed, they could not identify the point at which condensation begins to outweigh depolymerization.
2.4. Selection and Confirmation of the Extraction Condition
The fitted model predicted the highest yield at the corner of the design space (90% ethanol, 4% HCl, 190 °C and 90 min), with a predicted value of 0.317 g/g (31.7%). This corner point was not tested experimentally and lies outside the region in which the model was validated. Such severe conditions are also expected to promote fragmentation and condensation of lignin, with loss of β-O-4′ linkages and free phenolic groups. We therefore selected run 19 (70% ethanol, 2.2% HCl, 190 °C and 90 min), which gave the highest measured yield (18.6%). This condition uses the center levels of ethanol and HCl, so it needs less acid and solvent than the predicted optimum. The model predicted a yield of 0.187 g/g (18.7%) for this condition. Three replicate runs at this condition gave 18.4%, 18.5% and 18.8% (mean 18.6 ± 0.2%). The difference between the predicted and measured means was approximately 0.001 g/g, which is a relative error of less than 1%. These results confirm that the model predicts yield well at this condition. TPC and bioactivity were measured only for the lignin from run 19, so a multi-response (desirability) optimization was not possible. Run 19 is therefore described as the selected condition, not as a model-derived optimum. A validation run at a model-predicted optimum remains to be done. The lignin produced under this condition (HCl-Ethanosolv-CSL) was used for all further analyses.
2.5. Characterization of HCl-Ethanosolv-CSL
2.5.1. Lignin Purity and Sugar Content
The raw coconut shell biomass exhibited a highly lignified composition, containing 56.82% acid-insoluble lignin (AIL) and 4.09% acid-soluble lignin (ASL), giving 60.91% total lignin (Table 4). This confirms its recalcitrant nature and suitability for lignin-focused extraction.
HCl-Ethanosolv-CSL contained 87.63% AIL and 4.07% ASL, giving a total lignin content of 91.70% (Table 4). This purity is similar to that of ethanol organosolv lignins from poplar (89.12%) and walnut shell (88.25%) [27]. The ash content was low (0.35%). Residual carbohydrates (1.59% cellulose and 6.32% hemicellulose, 7.91% in total) were present mainly as hemicellulose. This level is slightly above the range reported for other ethanol organosolv lignins (6.2 to 7%). The solid residue after extraction (CS-SR) was enriched in cellulose (43.87%) and contained 5.01% hemicellulose, 43.62% AIL and 4.08% ASL (47.70% total lignin). Its lignin content was lower than that of the raw shell (60.91%), which confirms partial delignification. These results show that the process gives a lignin with a high total lignin content and low ash, together with a cellulose-rich residue. This residue could be used for enzymatic saccharification or nanocellulose production.
2.5.2. Scanning Electron Microscopy (SEM)
SEM was used to compare the morphology of HCl-Ethanosolv-CSL and AlkL (Figure 3). HCl-Ethanosolv-CSL consisted of compact, angular particles with smooth fracture faces (Figure 3a). At higher magnification, the particles appeared as dense blocks without large pores (Figure 3b). Their surface consisted of fine granules fused into a continuous layer (Figure 3c). This condensed morphology suggests strong association of the lignin chains during precipitation. It agrees with the large apparent molecular size measured by GPC (Section 2.6.5). In contrast, AlkL formed loose, porous agglomerates of irregular granules (Figure 3d). The backscattered electron image of AlkL also showed bright particles. These indicate heavier inorganic species and agree with the sodium sulfate detected by XRD [28].
2.5.3. X-Ray Diffraction (XRD) Analysis of HCl-Ethanosolv-CSL
XRD was used to compare the crystalline structure of the two lignins. HCl-Ethanosolv-CSL showed only one broad amorphous halo centered at approximately 21.5° (2θ) (Figure 4). This pattern is typical of amorphous lignin. In contrast, AlkL showed several sharp peaks at 2θ = 18.89°, 23.05°, 27.95°, 32.01°, 33.78°, 38.50° and 48.65°. These peaks do not belong to lignin. Their positions match the main reflections of anhydrous sodium sulfate (thenardite, Na2SO4), a common by-product of kraft pulping [31,32].
No sharp cellulose reflection was observed near 22.5° in HCl-Ethanosolv-CSL. This agrees with its low cellulose content (1.59%, Table 4). These results show that alkaline pulping leaves crystalline inorganic salts in commercial lignin. In contrast, the HCl-catalyzed ethanosolv process gave an amorphous lignin without detectable crystalline impurities.
2.6. Structure Elucidation of HCl-Ethanosolv-CSL
2.6.1. Fourier Transform Infrared Spectroscopy (FTIR)
FTIR spectroscopy was used to identify the functional groups of HCl-Ethanosolv-CSL and to compare them with those of AlkL (Figure 5). Band assignments were based on the literature (Table S2). Both lignins showed the main bands of lignin, but they differed in band intensity and in a few specific bands. Both samples showed a broad O–H stretching band from phenolic and aliphatic hydroxyl groups, centered at 3357 cm−1 in HCl-Ethanosolv-CSL and 3345 cm−1 in AlkL [27,33,34,35,36]. This band was much stronger and broader in HCl-Ethanosolv-CSL. Acid-catalyzed cleavage of α- and β-aryl ether bonds releases new free phenolic hydroxyl groups, which may explain this difference. This agrees with the higher total phenolic content of HCl-Ethanosolv-CSL (Section 2.6.6). The C–H stretching bands of methyl, methylene and methoxyl groups appeared at 2937 and 2843 cm−1 in HCl-Ethanosolv-CSL. AlkL showed the band at 2936 cm−1 but not the methoxyl C–H band near 2843 cm−1. A similar loss of this band has been linked to demethylation during alkaline treatment [37]. HCl-Ethanosolv-CSL also showed a C=O stretching band at 1695 to 1704 cm−1 from unconjugated ketones, aldehydes and carboxyl groups. This band was weak in AlkL. Aromatic skeletal vibrations appeared at 1593 to 1607, 1514 and 1461 cm−1 in HCl-Ethanosolv-CSL and at 1592, 1512 and 1455 cm−1 in AlkL. The band at 1425 cm−1 (1420 cm−1 in AlkL) arises from aromatic skeletal vibrations combined with C–H in-plane deformation. These differences show that the structure of HCl-Ethanosolv-CSL differs from that of AlkL.
Bands of syringyl (S) units were present only in HCl-Ethanosolv-CSL. These were the S ring breathing band with C–O stretching at 1327 cm−1 and the aromatic C–H in-plane deformation of S units at 1115 cm−1. Bands of guaiacyl (G) units appeared in both lignins, at 1270 and 1218 cm−1 (1264 and 1212 cm−1 in AlkL), at 1036 cm−1 (1031 cm−1 in AlkL) and at 852 cm−1 (854 cm−1 in AlkL). The band at 1164 cm−1 in HCl-Ethanosolv-CSL is typical of conjugated ester C=O groups, as found in lignins acylated with p-hydroxybenzoate. It supports the presence of p-hydroxybenzoate (PB) esters. The band at 828 cm−1 corresponds to C–H out-of-plane vibrations of S units and PB esters. Overall, FTIR indicates that HCl-Ethanosolv-CSL is a GS-type lignin carrying PB esters, whereas AlkL is mainly a G-type lignin.
2.6.2. One-Dimensional (1D) 1H and 13C Nuclear Magnetic Resonance Spectra
1H and 13C NMR were used to identify the main functional groups and aromatic units of the two lignins. Signal assignments are listed in Table 5 and Table S3. The 1H NMR spectrum of HCl-Ethanosolv-CSL showed aromatic proton signals of p-hydroxybenzoate (PB) esters at approximately 7.8 ppm, guaiacyl (G) units at 6.8 ppm and syringyl (S) units at 6.6 ppm (Figure 6). In AlkL, no S or PB signals were detected, which indicates a G-type lignin. Both samples showed a strong methoxyl (–OCH3) proton signal at 3.7 ppm. Water and DMSO gave signals at 3.3 to 3.4 ppm and 2.5 ppm, respectively. HCl-Ethanosolv-CSL also showed sharp signals at 1.1 to 1.3 ppm. These arise mainly from the CH3 protons of ethoxyl groups (1.14 ppm), as confirmed by HSQC (Section 2.6.3). These results show that the main functional groups of lignin were preserved during extraction.
13C NMR gives better resolution than 1H NMR because of its wider chemical shift range (Table 5, Figure S1). The region from 103 to 160 ppm was assigned to aromatic carbons. The signal at 103.5 ppm, assigned to C2/C6 of S units, was detected only in HCl-Ethanosolv-CSL. Both lignins showed the G5 signal at approximately 115.5 to 116.5 ppm. AlkL also showed G2 (110.8 ppm) and G6 (119.5 ppm) signals. A strong signal at 56 ppm, assigned to methoxyl groups of G and S units, was found in both samples. HCl-Ethanosolv-CSL also showed signals at 131.6 ppm (C2/C6 of p-hydroxybenzoate, PB) and 167.3 ppm (ester C=O). In addition, signals at 15.1 ppm (CH3) and 65.7 ppm (OCH2) show ethoxyl groups, which were absent in AlkL. These results show that HCl-Ethanosolv-CSL is a GS-type lignin with a predominance of G units. The PB units are not part of the lignin backbone. They are pendant groups esterified to the side chains, as is typical of palm lignins, including coconut coir lignin [5].
2.6.3. Heteronuclear Single Quantum Coherence (HSQC-2D NMR)
HSQC NMR was used to obtain more detail on the interunit linkages and aromatic units of HCl-Ethanosolv-CSL and AlkL. Cross-peak assignments are listed in Table S4, and the spectra are shown in Figure 7. Both lignins showed a strong methoxyl cross-peak (δC/δH 55.6/3.73). This agrees with the FTIR results. The Cα–Hα and Cβ–Hβ correlations of β-O-4′ substructures (Aα, 71.8/4.86, and Aβ, 83.8/4.30) and the Cα–Hα correlation of phenylcoumaran substructures (Bα, 87.1/5.45) were below the detection limit in both lignins. This shows that most β-O-4′ and β-5′ linkages were cleaved, during acidic ethanosolv extraction and during alkaline pulping. Signals were found in the Cγ region (δC/δH 59 to 66/3.2 to 3.8), where Aγ and Bγ overlap with the C5 signals of xylan and with ethoxyl OCH2 groups. Phenylcoumaran units contain a cyclic α-aryl ether and are more resistant to cleavage during organosolv extraction [39]. HCl-Ethanosolv-CSL also showed xylan cross-peaks at δC/δH 70 to 77/3.0 to 3.5, which agrees with its residual hemicellulose content (6.32%, Table 4). The most distinctive signals of HCl-Ethanosolv-CSL were from ethoxyl groups (CH3 at 14.8/1.13 and OCH2 at 62 to 66/3.4 to 3.6) and ethyl ester groups (CH3 at 14.0/1.28 and OCH2 at 60.2/4.2). These signals were absent in AlkL. They show that ethanol was incorporated into the lignin during HCl-catalyzed extraction. Under acidic conditions, the benzylic carbocation formed from β-O-4′ units can be trapped by ethanol (α-ethoxylation) [29]. This reaction stabilizes the fragments and limits their condensation. Acid-catalyzed esterification or transesterification with ethanol can explain the ethyl ester groups. A contribution from ethyl glycosides of residual xylan cannot be excluded. In the aromatic region, HCl-Ethanosolv-CSL showed the S2,6 cross-peak at δC/δH 103.9/6.6, which was absent in AlkL. A weaker S′2,6 cross-peak at δC/δH 106.3/7.2 indicates some Cα-oxidized S units. The absence of S signals in AlkL confirms that AlkL is a G-type lignin, as is typical of softwood kraft lignin. Both samples showed the G2, G5 and G6 cross-peaks. No H units (H2,6, 127.8/7.2) were detected in either sample. HCl-Ethanosolv-CSL also showed the PB2,6 cross-peak at δC/δH 131.3/7.7. p-Hydroxybenzoate units are pendant groups esterified to the lignin side chain and are characteristic of coconut and other palm lignins [26].
Table 6 compares the relative abundance of the aromatic units and linkages of HCl-Ethanosolv-CSL and AlkL with those of other coconut lignins, estimated by volume integration of the HSQC contours. The S/G ratio of HCl-Ethanosolv-CSL was low (0.23) and equal to that of coconut coir lignin isolated with dioxane–water [5]. HCl-Ethanosolv-CSL was rich in G units (81.30%) and contained 18.69% S units, with PB esters equal to 10.21% of S + G. AlkL, in contrast, contained only G units. The S units, PB esters and ethoxyl groups give HCl-Ethanosolv-CSL more chemical diversity than AlkL. The PB ester and phenolic groups also provide reactive sites for chemical modification. Overall, HCl-Ethanosolv-CSL combines a G-rich backbone, similar to softwood lignin, with S units and PB esters typical of palm lignins.
2.6.4. Thermal Behavior of HCl-Ethanosolv-CSL
Lignin is thermally stable because of its cross-linked aromatic structure. Its stability depends on its interunit linkages, functional groups and molecular weight. We used TGA and DTG to compare the thermal degradation of HCl-Ethanosolv-CSL and AlkL from approximately 35 to 900 °C (Figure 8). Both lignins degraded in several overlapping stages. The first stage, below approximately 150 °C, is mainly due to loss of moisture and light volatiles [41]. Mass loss in this stage was 3.9% for HCl-Ethanosolv-CSL (up to 114 °C) and 9.7% for AlkL (up to 150 °C). The higher moisture content of AlkL reflects its more hydrophilic surface. Kraft lignin carries more polar groups and inorganic salts from alkaline pulping, which bind water through hydrogen bonding and ionic interactions [42]. The second stage, from approximately 150 to 500 °C, involves cleavage of side-chain linkages and aryl ether bonds and release of phenolic monomers [43]. HCl-Ethanosolv-CSL showed two DTG peaks in this stage, at approximately 266 °C and 350 °C. AlkL showed one main peak at approximately 348 °C. The early peak at 266 °C, absent in AlkL, indicates that part of HCl-Ethanosolv-CSL is more thermally labile. This fraction may include residual hemicellulose (6.32%, Table 4) and ethoxylated side chains. Between 150 and 300 °C, HCl-Ethanosolv-CSL lost 19.9% of its mass, compared with 10.0% for AlkL. Above 500 °C, the aromatic rings slowly condense into char, and methoxyl groups are released as methane and other volatiles. AlkL showed a further mass loss between approximately 700 and 750 °C (DTG peak at 742 °C). This is likely due to reactions of its inorganic salts, such as carbothermal reduction of sodium sulfate. The residue at 900 °C was 37.7% for HCl-Ethanosolv-CSL and 29.6% for AlkL. The higher char yield of HCl-Ethanosolv-CSL agrees with its G-rich aromatic structure. In summary, HCl-Ethanosolv-CSL had low moisture uptake, an early degradation step related to labile structures and a high char yield. These properties make it a suitable feedstock for carbon materials and aromatic chemicals.
2.6.5. Molecular Weight Distribution (GPC)
GPC was used to compare the molecular size of HCl-Ethanosolv-CSL and AlkL (Figure 9, Table 7). The narrow polystyrene (PS) standards eluted between 7.0 and 9.6 min, which corresponds to approximately 7 × 10³ to 3.7 × 10⁵ g mol−1 (Figure 9a). The broad PS standard gave similar values in the two sequences (Mw = 2.87 × 10⁵ and 2.83 × 10⁵ g mol−1; Đ = 2.06 and 2.17). This shows that the system performed consistently, so the two lignins can be compared.
HCl-Ethanosolv-CSL eluted between 4.5 and 7.2 min, earlier than the largest PS standard (7.04 min). More than 98% of its distribution therefore lay above the calibrated range (Figure 9b). Its apparent Mw was 5.5 × 10⁷ g mol−1 at 1 mg mL−1 and 1.7 × 10⁷ g mol−1 at 5 mg mL−1 (Table 7). AlkL eluted over a wider range (4.0 to 9.3 min). Approximately 39% of its distribution fell within the calibrated range. AlkL also showed resolved low-molecular-weight populations at approximately 1.4 × 10⁴ and 2.5 × 10⁴ g mol−1, which were absent in HCl-Ethanosolv-CSL. AlkL had a lower apparent Mw (5.1 × 10⁶ g mol−1) but a much higher dispersity (Đ = 32.7) than HCl-Ethanosolv-CSL (Đ = 2.4 to 7.2).
These apparent values are much higher than expected for single lignin chains. They lie beyond the calibrated range, and they changed strongly with sample concentration. They should therefore not be read as true molecular weights. In DMF without added salt, lignin chains associate through hydrogen bonds between hydroxyl groups and through π–π stacking of aromatic rings. The early elution of HCl-Ethanosolv-CSL therefore indicates a large hydrodynamic volume caused mainly by intermolecular association. Its high content of free phenolic hydroxyl groups (Section 2.6.6) and its ester and ethoxyl groups favour this association. The GPC results thus compare the apparent size of the two lignins in solution, not their absolute molecular weights. GPC in DMF containing LiBr, or of acetylated samples, is recommended to obtain true molecular weights.
2.6.6. Total Phenolic Content of HCl-Ethanosolv-CSL
Phenolic hydroxyl groups are the main source of the antioxidant activity of lignin. Each H, G and S unit carries a free phenolic hydroxyl group when it is not linked through its 4-O position. Total phenolic content (TPC) was measured with the Folin–Ciocalteu method. HCl-Ethanosolv-CSL had a TPC of 785.9 ± 18.5 mg GAE/g (approximately 4.62 mmol GAE/g). This was significantly higher than that of AlkL (580.6 ± 12.0 mg GAE/g, p < 0.001) (Figure 10). During acid-catalyzed ethanosolv extraction, cleavage of β-O-4′ bonds converts etherified phenolic units into units with free phenolic hydroxyl groups. This reaction also lowers the degree of polymerization. The lower TPC of AlkL may be partly due to its inorganic content. XRD showed that AlkL contains crystalline sodium sulfate, which dilutes the lignin and lower its phenolic content per gram. Harsh alkaline conditions can also cause condensation reactions that consume phenolic sites [44]. The TPC of HCl-Ethanosolv-CSL was also higher than values reported for coconut shell lignin from HCl-assisted acetosolv (0.73 mmol/g) [26] and MgCl2/HCl acetosolv (3.34 mmol/g) [11]. However, these studies used different methods, so this comparison is only indicative.
The Folin–Ciocalteu reagent is a phosphotungstate–phosphomolybdate complex. Phenolic hydroxyl groups reduce it to a blue complex that is measured at 760 nm [45].
The high total lignin content, low ash and high TPC of HCl-Ethanosolv-CSL make it a promising renewable source of phenolic antioxidants.
2.6.7. Antioxidant Activity and Mechanism of Action
The antioxidant activity of lignin depends mainly on its phenolic hydroxyl groups. Other structural features also matter, including methoxyl, carbonyl and carboxyl groups, side-chain double bonds, the proportion of H, G and S units, and molecular weight [46]. We measured the radical-scavenging activity of HCl-Ethanosolv-CSL and AlkL with the ABTS and DPPH assays (Figure 11). HCl-Ethanosolv-CSL was more active than AlkL in both assays. Its in-well IC50 values were 11.6 ± 0.3 µg mL−1 for ABTS and 28.4 ± 1.3 µg mL−1 for DPPH. AlkL gave 16.7 ± 0.4 µg mL−1 for ABTS, but it did not reach 50% DPPH scavenging in the tested range. At the highest in-well concentration (39.2 µg mL−1), AlkL scavenged 39.3 ± 2.3% of DPPH radicals, compared with 65.7 ± 1.0% for HCl-Ethanosolv-CSL. This ranking agrees with the TPC results. For example, Wei et al. [47] found that the fraction of eucalyptus kraft lignin with the highest phenolic hydroxyl content also had the strongest radical-scavenging activity. However, TPC alone does not predict antioxidant activity. For example, organosolv coconut lignins with more linear structures, more S units and lower molecular weight have shown strong activity even with lower TPC [12]. Direct comparison with literature IC50 values is difficult, because many studies do not state whether IC50 refers to the stock or the final in-well concentration. Lignin scavenges radicals by two main mechanisms. In hydrogen atom transfer (HAT), a phenolic hydroxyl group gives its hydrogen atom to the radical (ArOH + R• → ArO• + RH). In single electron transfer followed by proton transfer (SET-PT), the phenol first gives an electron and then loses a proton. ABTS•⁺ and DPPH• can react by both routes, depending on the solvent. Both routes produce a phenoxyl radical (ArO•). This radical is stabilized by resonance over the aromatic ring and by ortho-methoxyl groups, which donate electrons and hinder further reactions [48]. HCl-Ethanosolv-CSL contains G units with one ortho-methoxyl group and S units with two. Both types stabilize the phenoxyl radical and lower the O–H bond dissociation enthalpy.
AlkL contains only G units and more inorganic salts, which explains its weaker activity. The strong O–H band of HCl-Ethanosolv-CSL in the FTIR spectrum (Section 2.6.1) also supports a high density of free phenolic groups. However, not all phenolic groups are equally reactive. Some are sterically hindered or engaged in intramolecular hydrogen bonds, and PB esters lack an ortho-methoxyl group. Ascorbic acid was much more active than both lignins (in-well IC50 = 2.6 µg mL−1 for ABTS and 7.8 µg mL−1 for DPPH). Ascorbic acid donates two electrons from its 2,3-enediol group. It first forms the ascorbyl radical and then dehydroascorbic acid, which degrades within minutes depending on pH and temperature [49]. Lignin is less active per gram, but it is more stable to heat and chemical treatment. It may therefore be a more durable antioxidant than ascorbic acid in materials processed or stored under harsh conditions.
Moreover, the GPC results help to explain the biological activity of HCl-Ethanosolv-CSL (Figure 9c). HCl-Ethanosolv-CSL scavenged radicals more effectively than AlkL, although it had a larger apparent size and lacked the low-molecular-weight fraction of AlkL. Radical scavenging was therefore governed mainly by the number of accessible phenolic hydroxyl groups (Section 2.6.6), not by molecular size.
2.6.8. Antibacterial Activity of HCl-Ethanosolv-CSL
The antibacterial activity of HCl-Ethanosolv-CSL depended on the bacterial strain (Table 8, Figure 12). The inhibition zone index (IZ) was highest against B. subtilis (0.31 ± 0.05), followed by B. cereus (0.25 ± 0.00), E. coli (0.14 ± 0.05) and Klebsiella sp. (0.11 ± 0.05). S. aureus was not inhibited. DMSO alone gave no inhibition, so the activity came from the lignin and not from the solvent.
HCl-Ethanosolv-CSL was the only sample that inhibited B. cereus. Against B. subtilis, E. coli and Klebsiella sp., the IZ values of HCl-Ethanosolv-CSL and AlkL did not differ significantly (p > 0.05, Table 8). The clear zone extended less than 2 mm beyond the 6-mm disc for all samples, so the activity at 10 mg/mL was weak to moderate. This strain- and lignin-dependent activity agrees with previous reports that link antibacterial activity to botanical source, extraction route and accessible functional groups [50,51]. The activity of HCl-Ethanosolv-CSL against Bacillus species can be related to its structure as determined by HSQC NMR (Table 6, Figure 7). HCl-Ethanosolv-CSL is rich in G units (81.30%), contains PB esters (10.21%) and has a high content of free phenolic hydroxyl groups (Section 2.6.6). Free phenolic groups are thought to play a central role in damaging bacterial membranes [52].
In addition, based on GPC results, HCl-Ethanosolv-CSL is a large, associated species that diffuses slowly through agar. This can limit the inhibition zones in the disc diffusion assay and may partly explain the weak inhibition observed. Large species also pass poorly through the outer membrane of Gram-negative bacteria, so HCl-Ethanosolv-CSL probably acts mainly at the cell surface. The strong association agrees with the compact, condensed particles observed by SEM (Figure 4)
Several mechanisms may explain this activity. The first is the action of phenolic hydroxyl groups. They can form hydrogen bonds with membrane proteins and lipids and can carry protons across the membrane. This may disturb the proton motive force and increase membrane permeability, which leads to leakage of ions and cell contents. The second is amphiphilicity. Residual aliphatic side chains (Cγ,Aγ), methoxyl groups (O − CH3) and the ethoxyl groups introduced during extraction (Figure 7b) make the lignin fragments amphiphilic. This may help them insert into the porous peptidoglycan wall of Gram-positive Bacillus species [50]. The third is oxidative stress. Phenoxyl radicals and quinone methides formed from phenolic units may react with thiol groups of bacterial enzymes. These mechanisms are proposed contributors only, because membrane damage was not measured in this study. Gram-negative bacteria have an outer membrane containing lipopolysaccharides, which restricts the entry of hydrophobic and high-molecular-weight compounds [50]. However, the Gram type alone cannot explain our results. HCl-Ethanosolv-CSL inhibited Gram-negative E. coli and Klebsiella sp., while Gram-positive S. aureus was resistant. Further work, such as minimum inhibitory concentration and membrane integrity assays, is needed to confirm the mechanism. These results show that the extraction method and the resulting lignin structure influence antibacterial activity.
3. Materials and Methods
3.1. Source of Chemicals and Analytical Reagents
Hydrochloric acid (~37%, HCl), methanol (99.9%, CH3OH), ethanol (95%, C2H5OH), dimethyl sulfoxide (DMSO) and DMSO-d6 were purchased from RCI Labscan Limited, Thailand. The analytical antioxidant reagents: 2,2′-azino-bis(3-ethylbenzothiazoline-6-sulfonic acid) (ABTS), 2,2-diphenyl-1-picrylhydrazyl-hydrate (DPPH), and Folin-Ciocalteu reagent were procured from Sigma Aldrich Chemicals P Ltd., USA. Gallic acid was obtained from Sisco Research Laboratories (India); ascorbic acid from Chem-Supply Pty Ltd. (Australia); potassium persulfate (98%) from Loba Chemie Pvt. Ltd. (India); and commercial alkaline lignin (AlkL, product no. [to be completed]) from Sigma-Aldrich (USA).
3.2. Preparation of Coconut Shell
The coconut shell chips purchased from the local market (Thailand, Bangkok) were washed and dried in a hot air oven at 50 °C to lower the moisture content. The dried coconut shells were ground using Retsch Jaw Crushers (Retsch GmbH, Germany) to get small particle sizes of approximately less than 1mm. A self-made filter thimble (Cytiva Whatman 1, China) was loaded with 35 grams of the material and then placed inside the Soxhlet apparatus. The still pot was filled with 450 mL of 95% ethanol for the extractive removal. The extraction was run for 6 h under reflux (approximately 78 °C). This step removes ethanol-soluble extractives, such as waxes, fatty acids, tannins and free phenolics. Otherwise, these compounds would co-precipitate with the lignin and raise both the apparent yield and the TPC. The yields refer to extractive-free coconut shell. A rotary evaporator (BÜCHI Rotavapor R-300, BÜCHI Labortechnik, Switzerland) was used to recycle the solvent once the step was completed.
3.3. Ethanosolv Extraction of Coconut Shell Lignin
Lignin extraction was carried out using a Teflon-lined hydrothermal autoclave reactor, with a total volume of 500 mL (see Figure 13). For each reaction, 1 g (dry weight) of extractive-free coconut shell powder was mixed with 10 mL of aqueous ethanol. Concentrated HCl (approximately 37%) was then added to this mixture. The amount of HCl added corresponded to concentrations of 0.4%, 2.2%, or 4.0% w/w HCl based on the dry biomass weight (Table 1). Experiments were conducted under controlled time (min) and temperature (°C), with uncontrolled pressure. The reactor was heated in [heating device, to be completed], and the reaction time was counted from [when the set temperature was reached, to be confirmed]. At the end of the reaction, the vessel was cooled to approximately 25 °C by immersion in water. The hydrolyzed mixture (consisting of lignin concentrate and solid residues) was filtered after centrifugation at 2000 × g for 15 min at 4 °C. The collected lignin supernatant was diluted with three volumes of distilled water and allowed to settle for 24 h to facilitate lignin precipitation. The precipitated coconut shell lignin was recovered by centrifugation at 4000 × g and 4 °C for 5 min. The lignin pellet was washed with [washing solvent and volume, to be completed] and then dried in a hot air oven (Heratherm OMH100, Thermo Scientific, Germany) at 50 °C until it reached a constant weight. The final products were stored in resealable plastic bags at ambient temperature. To obtain enough lignin for characterization, run 19 was repeated [number, to be completed] times and the products were pooled. The recovered lignin was weighed, and the yield was calculated using Equation (2), where mlignin is the mass of recovered lignin (g) and mCS is the dry mass of extractive-free coconut shell (g).
3.4. Design of Experiments and Statistical Analysis
The process parameters of the acid-assisted ethanolic organosolv method were optimized using a Box-Behnken design (BBD) to maximize the yield of coconut shell lignin. A four-variable Box-Behnken design was chosen to estimate the optimum level and interactive effects of ethanol concentration (XEt.% in v/v), concentration of hydrochloric acid (XAc.% in w/w), temperature (XTp in °C), and time (XTm in min), as listed in Table 1. The factor ranges were chosen from previous ethanol organosolv studies and preliminary tests. The design comprised 29 runs with five replicates at the center point (Table S1, Supporting Information), and the runs were performed in randomized order [to be confirmed].
The experimental data were fitted to the second-order polynomial in Equation (3), where YCSL is the response (lignin yield), A0 is the constant term, Ai denotes the linear coefficients, Aii signifies the coefficients of the squared terms, Aij represents the coefficients of the cross-term products, and Xi and Xj are the coded independent variables.
Analysis of Variance (ANOVA) was a statistical tool to investigate how independent variables (XEt., XAc., XTm, and XTp) influenced YCSL. The suitability of the models was evaluated by examining the p-values (p < 0.05), the lack of fit (LoF), the coefficients of determination (R2), the adjusted coefficient of determination (R2adj), the predicted R2 (from the PRESS statistic) and residual diagnostics (normal probability plot, Shapiro–Wilk test, externally studentized residuals and Cook’s distance). The ratio of solid to liquid, specifically 1 g of coconut powder to 10 mL of aqueous ethanol (1:10, w/v), was maintained constant in all tests. Statistical analysis of the data and response surface plots was performed using JMP Software version 13 (SAS Institute Inc., USA).
3.5. Characterization of Lignin from the Selected Condition
The lignin with the highest yield (run 19) was used to determine purity, structure, total phenolic content, antioxidant activity and antibacterial activity. This lignin is referred to as HCl-Ethanosolv-CSL. Commercial alkaline lignin from Sigma-Aldrich (AlkL) was used as a reference lignin in all analyses.
3.5.1. Chemical Composition Analysis
The chemical composition of HCl-Ethanosolv-CSL was assessed using the two-stage acid hydrolysis based on the National Renewable Laboratory’s (NREL) standard analytical procedure [14] with a minor modification. The total lignin content was calculated as the total amount of the acid-insoluble lignin (Klason lignin) plus the acid-soluble lignin. Approximately 0.2 g of sample was mixed with 2 mL of 72% (w/w) H2SO4, agitated at 150 rpm in an incubator shaker for 1 h at 30 °C. The hydrolysate was diluted with 56 mL of deionized water to 4% (w/w) H2SO4 final concentration and then autoclaved at 121 °C for 1 h. Once the system cooled down, the acid-insoluble lignin (AIL) was collected by vacuum filtration using a 47-mm filter paper (Grade 4, Whatman, GE Healthcare Life Science, China), dried in an air circulation oven at 105 °C overnight, cooled, and weighed. The acid-insoluble residue was incinerated in a furnace for 6 h at 575 °C to obtain ash. The filtrate was diluted with distilled water and used for the determination of acid-soluble lignin (ASL) at 280nm using a UV spectrophotometer. The monosaccharide content was determined by high-performance liquid chromatography (HPLC) (Thermo Scientific, USA). A solution of 5 mM H2SO4 was used as the mobile phase with a flow rate of 0.6 mL/min. Before injection, the acidic filtrate was diluted to pH ~5 to 6 by adding calcium carbonate (CaCO3) powder, then filtered through 0.2 μm nylon filters. Twenty microliters of lignin filtrate were injected into the HPLC column (Aminex® HPX-87H) and detected using a refractive index detector (RID detector). The calibration was performed using different standards: glucose (Sigma-Aldrich, US), arabinose (Sigma-Aldrich, US), and xylose (Thermo Fisher Scientific, Belgium). All experiments were conducted in triplicate.
3.5.2. X-Ray Diffraction (XRD)
The crystallographic structure of lignin samples was analyzed by the X-ray diffractometer (Rigaku Miniflex 600, Japan). The diffractometer was equipped with a copper radiation source (Cu Kα-radiation λ = 0.154186 nm, operating at 30 kV/30 mA). The data were recorded with a locked-coupled scan from 3° to 50°(2θ), a step size of 0.01° and a scan speed of 12°/min.
3.5.3. Scanning Electron Microscopy (SEM)
The surface morphology of the lignin samples was examined with a scanning electron microscope (JSM6610-LV Model, JEOL company, Japan). The surface imaging of the samples was accomplished under low vacuum or variable pressure modes at room temperature, allowing for observation of the non-conductive samples (HCl-Ethanosolv-CSL and AlkL) after gold coating. AlkL was imaged with a desktop SEM (Phenom, Thermo Fisher Scientific) at 5 kV in backscattered electron mode [model and coating to be confirmed].
3.5.4. Fourier Transform Infrared Spectroscopy (FTIR)
Fourier transform infrared (FTIR) spectroscopy was employed to characterize the absorption bands corresponding to functional groups in HCl-Ethanosolv-CSL and AlkL. FTIR spectra were acquired on a PerkinElmer Spectrum spectrometer (UATR Version Two, UK) equipped with a diamond attenuated total reflectance (ATR) crystal accessory. The recorded FTIR spectra covered a wavenumber range from 550 to 4000 cm−1, with a resolution of 4 cm−1, and a total of 4 scans were recorded. Available reference spectra were used to confirm the appearance of specific chemical bonds.
3.5.5. Nuclear Magnetic Resonance (NMR)
The modifications of the functional groups and the bonding connections between lignin subunits were analyzed by NMR spectroscopy using the following: 54 Ascend 400 MHz, AVANCE III HD 500 MHz, Bruker Biospin, Germany for 1H NMR; Bruker AVANCE III spectrometer (Germany) for 13C NMR; and AVANCE III HD 54 Ascend 400 MHz Digital NMR Spectrometer (Bruker Biospin, Switzerland) for HSQC NMR.
3.5.5.1. 1H NMR Analysis
After dissolving 20 mg of lignin in 0.6 mL DMSO-d6, the 1H NMR spectra at room temperature (20 ± 1 °C) and a frequency of 500 MHz were recorded. The spectral parameters used included 16 scan numbers (NS), a relaxation delay of 2s, spin rate of 25 Hz, 16K spectral size, and 32 K time-domain size.
3.5.5.2. Quantitative 13C NMR Spectroscopy
For molecular structure characterization by quantitative 13C NMR using a Bruker Avance III 400 spectrometer equipped with a 5 mm broadband (BB) probe, HCl-Ethanosolv-CSL powder (20 mg) was dissolved in 0.6 mL of DMSO-d6 at 25 °C. Then, the total volume of 40μL of chromium(III) acetylacetonate (0.01 M) was added to facilitate the relaxation of magnetization of all nuclei. The quantitative 13C NMR spectra were recorded in the FT mode at 100.6 MHz. The inverse gated decoupling sequence, which allows quantitative analysis and comparison of signal intensities, was used with the following parameters: 30° pulse angle; 1.4s acquisition time; 2s relaxation delay; 64K data points, and 30000 scans.
3.5.5.3. 2D HSQC NMR Analysis
HSQC NMR analysis was also employed to acquire additional structural information on the extracted lignin. Twenty milligrams of lignin were dissolved in 0.6 mL DMSO-d6, and spectra were acquired using a standard Bruker TopSpin NMR software. The spectral widths were 5000 and 20000 Hz for the 1H and 13C dimensions, respectively. The number of collected complex points was 2048 for the 1H dimension with a recycling delay of 1.5s. The number of transients was 256 time increments in the 13C dimension. The 1JCH used was 145 Hz. The central solvent (DMSO) peak was used as an internal chemical shift reference point (δC/δH 39.5/2.5). The percentage of interunit linkages and the S/G ratio were obtained by calculating the relative integrations of each contour in 2D HSQC spectra of HCl-Ethanosolv-CSL and AlkL using Topspin software. In the aromatic region, the C9 unit was located between δC/δH 90–150/5.5–8, and in the oxygenated aliphatic side chain, was located in δC/δH 20–85/2.0–5.0. The following equations were employed to calculate the C9 (the total nine-carbon phenylpropanoid units) and Ix%:
where Ix is the value of the integral of β-O-4, β-β, and β-5 in the γ-position. S₂,₆, G₂ and H₂,₆ are the integrated cross-peak volumes for syringyl (C₂/C₆), guaiacyl (C₂), and p-hydroxyphenyl (C₂/C₆) units in the 2D HSQC spectrum.
3.5.6. Thermogravimetric Analysis
The thermal stability of HCl-Ethanosolv-CSL and AlkL was assessed using a TGA/DTG 3+ analyzer (Mettler Toledo TGA2, Switzerland). The samples were analyzed under a nitrogen (N2) atmosphere with a flow rate of 50 mL/min and a heating rate of 10 °C/min, with temperatures ranging from 30 °C to 900 °C.
3.5.7. Gel Permeation Chromatography (GPC)
The molecular weight distributions of HCl-Ethanosolv-CSL and AlkL were determined by GPC on an Agilent system with a refractive index detector, using N,N-dimethylformamide (DMF) as the eluent [column set, flow rate, column temperature and injection volume to be completed]. HCl-Ethanosolv-CSL was analyzed at 1 and 5 mg mL−1, and AlkL at 10 mg mL−1 [concentrations to be confirmed]. The two lignins were analyzed in separate sequences. The columns were calibrated with narrow PS standards (three standard vials, seven peaks, approximately 7 × 10³ to 3.7 × 10⁵ g mol−1), and a broad PS standard was run in each sequence as a control. The peak (Mp), number-average (Mn) and weight-average (Mw) molecular weights and the dispersity (Đ = Mw/Mn) are reported as PS-equivalent values.
3.5.8. Total Phenolic Content
The total phenolic content (TPC) of HCl-Ethanosolv-CSL and AlkL was measured colorimetrically using the Folin–Ciocalteu (FC) method. Five microliters of the HCl-Ethanosolv-CSL sample dissolved in DMSO (1:1, w/v) or gallic acid as a standard was deposited in the 96-well microplate. Sixty microliters of 7.5%(w/v) sodium carbonate (Na2CO3)(Kemaus, Australia), 15 μL of 0.2 N Folin–Ciocalteu reagent, and 200 μL of distilled water were added to each well, then incubated at 60℃ for 5 min before measuring the absorbance at 760 nm with a spectrophotometer (Multiskan Sky, Thermo Scientific). The studied concentrations ranged from 0–1 mg/ml for gallic acid and 2 mg/ml for lignin. The intensity of the blue color formed during the reaction is proportional to the amount of phenolic hydroxyl groups that reduce the FC reagent. The tests were done in four replicates. The content of phenolic hydroxyl compounds of HCl-Ethanosolv-CSL was quantified according to the established gallic acid standard calibration curve. The results were expressed as milligrams of gallic acid equivalent (GAE) per gram of lignin (on a dry basis) and were calculated as follows:
where C is the gallic acid equivalent concentration (mg mL−1) obtained from the calibration curve, V is the volume of the lignin solution (mL) and m is the mass of lignin (g).
3.5.9. Antioxidant Activity
The antiradical capability of HCl-Ethanosolv-CSL and AlkL was assessed with two radical-scavenging assays, ABTS (2,2’-azinobis(3-ethylbenzothiazoline)-6-sulfonic) and DPPH (2,2-diphenyl-1-picrylhydrazyl) in 96-well microplates. Ascorbic acid was used as a reference antioxidant.
3.5.9.1. ABTS Radical Cation Scavenging Assay
A solution containing the radical ABTS•⁺ cation was generated by the chemical reaction between 7 mM ABTS stock solution and 2.45 mM potassium persulfate prepared in the dark at room temperature. Before use, the ABTS•⁺ solution was diluted with DMSO to achieve an absorbance of 0.7 ± 0.02 at 734 nm. Then, 200 µL of the ABTS•⁺ solution was mixed with 2 μl lignin (prepared at the desired concentration mg/ml) or control (ascorbic acid) and incubated in the dark for 4 min to complete the reaction. The absorbance of the reactive mixture was measured at 734 nm. All experiments were performed in four replicates (n=4) to ensure statistical reliability.
3.5.9.2. DPPH Radical Scavenging Assay
The DPPH radical (2,2-diphenyl-1-picrylhydrazyl) was also used. Four microliters of lignin solution (0-2 mg/mL) in DMSO were combined with 200 µl of 0.1 mM DPPH in methanol at 25 °C for 1 hour in the dark. The absorbance of the mixture was recorded at 517 nm using a UV/VIS spectrometer. Each experiment was performed in four replicates. The radical scavenging capabilities of the ABTS and the DPPH of coconut lignin samples were calculated as follows (Equation (7)):
where A0 is the control absorbance (blank containing radicals without sample), and A1 is the sample absorbance (containing radicals + lignin extract). The IC50 value was determined as the concentration of lignin (mg/ml) required to scavenge 50% of the initial ABTS•+ or DPPH radicals.
Six stock concentrations of lignin (0, 0.4, 0.8, 1.2, 1.6 and 2.0 mg mL−1) were tested. IC50 was obtained by linear regression of scavenging (%) against concentration, for each replicate. Because the sample was diluted in the well (2 µL in 202 µL for ABTS and 4 µL in 204 µL for DPPH), IC50 values are given as final in-well concentrations (dilution factors of 101 and 51, respectively). When 50% scavenging was not reached within the tested range, the scavenging at the highest concentration is reported instead.
3.6. Antibacterial Activity
The antibacterial activity of HCl-Ethanosolv-CSL and AlkL was examined against five bacterial strains: Escherichia coli, Bacillus subtilis, Bacillus cereus, Klebsiella sp., and Staphylococcus aureus. The test was performed following the disc diffusion assay. The bacterial strains were activated in Luria Bertani Broth (LB)(HIMEDIA, Mumbai, India) media, and afterwards incubated at 37 °C, 150 rpm agitation for 18 to 24 h. Inoculum of each indicated isolate was adjusted to an optical density of 0.5 at 600 nm using 0.82% NaCl solution. A sterilized filter paper disc (6 mm in diameter) inoculated with 10 µl of lignin solution (10 mg/ml concentration) initially dissolved in DMSO was placed on a freshly prepared Luria Bertani agar (LBA) seeded with 1mL of bacteria. The Petri dishes were kept at 37 °C for 24h. Blank filter paper discs and discs loaded with 10 µL of pure DMSO were used as negative and positive controls. After 24h incubation at 37 °C, the potency of HCl-Ethanosolv-CSL against the tested bacteria was observed as the “inhibition zone (IZ)” around the filter paper disc (Equation (8)). All experiments were carried out in triplicate. The antibacterial activity was expressed as the inhibition zone index (IZ), calculated from the diameter of the clear zone using Equation (8).
where diz is the diameter of the inhibition zone (mm) and dd is the disc diameter (6 mm). IZ is dimensionless.
4. Conclusions
A Box-Behnken design was used to study HCl-catalyzed ethanosolv extraction of lignin from coconut shell. Temperature, time and HCl concentration were the main factors affecting yield (model p < 0.0001, R² = 0.95). The highest measured yield (18.6%) was obtained with 70% (v/v) ethanol and 2.2% (w/w) HCl at 190 °C for 90 min, and replicate runs agreed with the model prediction. The resulting lignin, HCl-Ethanosolv-CSL, had a total lignin content of 91.7% and a low ash content (0.35%). It was a G-rich GS-type lignin (S/G = 0.23) with PB esters. Most β-O-4′ and β-5′ linkages were cleaved, and ethoxyl groups were introduced by HCl-catalyzed reaction with ethanol. HCl-Ethanosolv-CSL had a higher total phenolic content (785.9 mg GAE/g) than commercial alkaline lignin (AlkL, 580.6 mg GAE/g). It also scavenged ABTS and DPPH radicals more effectively (in-well IC50 11.6 and 28.4 µg mL−1). This activity is explained by its free phenolic hydroxyl groups and by the radical-stabilizing effect of ortho-methoxyl groups. GPC indicated a large apparent molecular size caused mainly by association of the lignin chains, which agrees with its condensed morphology. HCl-Ethanosolv-CSL showed weak, strain-dependent antibacterial activity, mainly against Bacillus species. These results show that HCl-catalyzed ethanosolv can convert coconut shell residues into a low-ash, phenol-rich lignin. This lignin is a promising renewable antioxidant and functional additive for materials.
Supplementary Materials
The following supporting information can be downloaded at website of this paper posted on Preprints.org, Table S1: Box–Behnken design matrix and lignin yield of the 29 runs; Table S2: FTIR band assignments; Table S3: 1H and 13C NMR signal assignments; Table S4: HSQC cross-peak assignments; Figure S1: Prediction profiler of the lignin yield model.
Author Contributions
Conceptualization, P.P. and C.I.; methodology, C.I. and P.P.; formal analysis, C.I.; investigation, C.I.; resources, L.S., SS.T., K.R., K.W., N.L. and T.W.; data curation, C.I.; writing—original draft preparation, C.I., S.A.; writing—review and editing, P.P.; supervision, P.P., Y-S.T.; funding acquisition, P.P,N.L., C-D.D.. All authors have read and agreed to the published version of the manuscript.
Funding
This research was funded by the Petchra Pra Jom Klao Doctoral Scholarship of King Mongkut’s University of Technology Thonburi (KMUTT), Thailand; the Japan-ASEAN Science, Technology and Innovation Platform (JASTIP); the National Research Council of Thailand (NRCT-FF69); and This research has received funding support from The Office of the Permanent Secretary of the Ministry of Higher Education, Science, Research and Innovation; and the NSRF via the Research and Innovation Acceleration Agency for Competitiveness and Area Development (Program Management Unit for Frontier Brainpower and Future Industries) (B42G680040)
Data Availability Statement
The data presented in this study are available on request from the corresponding author.
Acknowledgments
During the preparation of this manuscript, the authors used Claude (Anthropic) for the purposes of English-language editing. The authors have reviewed and edited the output and take full responsibility for the content of this publication.
Conflicts of Interest
The authors declare no conflicts of interest.
Abbreviations
The following abbreviations are used in this manuscript:
| AIL | Acid-insoluble lignin |
| AlkL | Commercial alkaline lignin |
| ASL | Acid-soluble lignin |
| BBD | Box–Behnken design |
| CSL | Coconut shell lignin |
| DMF | N,N-Dimethylformamide |
| DTG | Derivative thermogravimetry |
| FTIR | Fourier transform infrared spectroscopy |
| GAE | Gallic acid equivalent |
| GPC | Gel permeation chromatography |
| HCl-Ethanosolv-CSL | Lignin from HCl-catalyzed ethanosolv extraction of coconut shell (run 19) |
| HSQC | Heteronuclear single quantum coherence |
| IC50 | Half-maximal inhibitory concentration |
| IZ | Inhibition zone index |
| Mn | Number-average molecular weight |
| Mw | Weight-average molecular weight |
| PB | p-Hydroxybenzoate |
| PS | Polystyrene |
| RSM | Response surface methodology |
| SEM | Scanning electron microscopy |
| TGA | Thermogravimetric analysis |
| TPC | Total phenolic content |
| XRD | X-ray diffraction |
| Đ | Dispersity (Mw/Mn) |
References
- Watcharawitthaya, A.; Srisawat, N.; Chiarakorn, S. Wood Substitute Material from Coconut Shell Waste and Green Adhesive. Environ. Nat. Resour. J. 2024, 22(1). [Google Scholar] [CrossRef]
- Diemuodeke, E.; et al. Agricultural Waste-Derived Management for Bioenergy: A Paradigm Shift in the Waste Perceptions, in Handbook of Waste Biorefinery: Circular Economy of Renewable Energy; Springer, 2022; pp. 345–367. [Google Scholar]
- Anuchi, S.O.; Campbell, K.L.S.; Hallett, J.P. Effective pretreatment of lignin-rich coconut wastes using a low-cost ionic liquid. Sci. Rep. 2022, 12(1), 6108. [Google Scholar] [CrossRef]
- Wu, X.; et al. Whiten Lignin-Based Sunscreen via Fractionation and Ultrasonic Cavitation. ACS Sustain. Chem. Eng. 2024, 12(17), 6539–6546. [Google Scholar] [CrossRef]
- Rencoret, J.; et al. Structural characterization of lignin isolated from coconut (Cocos nucifera) coir fibers. J. Agric. Food Chem. 2013, 61(10), 2434–2445. [Google Scholar] [CrossRef]
- Guadix-Montero, S.; et al. Ruthenium ion catalysed C–C bond activation in lignin model compounds–towards lignin depolymerisation. Catal. Sci. Technol. 2023, 13(20), 5912–5923. [Google Scholar] [CrossRef]
- Jahan, N.; et al. Effect of solvent quality on structure and dynamics of lignin in solution. J. Phys. Chem. B 2022, 126(31), 5752–5764. [Google Scholar] [CrossRef]
- Rabelo, S.C.; et al. Organosolv pretreatment for biorefineries: Current status, perspectives, and challenges. Bioresour. Technol. 2023, 369, 128331. [Google Scholar] [CrossRef]
- Zhao, X.; Cheng, K.; Liu, D. Organosolv pretreatment of lignocellulosic biomass for enzymatic hydrolysis. Appl. Microbiol. Biotechnol. 2009, 82, 815–827. [Google Scholar] [CrossRef]
- Sturgeon, M.R.; et al. A mechanistic investigation of acid-catalyzed cleavage of aryl-ether linkages: implications for lignin depolymerization in acidic environments. ACS Sustain. Chem. Eng. 2014, 2(3), 472–485. [Google Scholar] [CrossRef]
- da Mata, A.K.A.; et al. Development of an eco-friendly acetosolv protocol for tuning the acetylation of coconut shell lignin: Structural, antioxidant, solubility and UV-blocking properties. Int. J. Biol. Macromol. 2022, 211, 271–280. [Google Scholar] [CrossRef]
- Avelino, F.; et al. Unraveling the structural aspects of microwave-assisted OrganoCat-based coconut shell lignins: An eco-friendly route for obtaining bio-based antioxidants. Int. J. Biol. Macromol. 2024, 274, 133349. [Google Scholar] [CrossRef]
- Lôbo, L.N.; et al. Obtaining Nanolignin from Green Coconut Shell and Fiber by the Acetosolv Method with Subsequent Ultrasonication. Reactions 2025, 6(1), 7. [Google Scholar] [CrossRef]
- Sluiter, A.; et al. Determination of structural carbohydrates and lignin in biomass. Lab. Anal. Proced. 2008, 1617(1), 1–16. [Google Scholar]
- Lobato-Peralta, D.R.; et al. A review on trends in lignin extraction and valorization of lignocellulosic biomass for energy applications. J. Clean. Prod. 2021, 293, 126123. [Google Scholar] [CrossRef]
- Choi, J.-H.; et al. Thermal properties of ethanol organosolv lignin depending on its structure. ACS Omega 2021, 6(2), 1534–1546. [Google Scholar] [CrossRef]
- Kai, D.; Chow, L.P.; Loh, X.J. Lignin and its properties, in Functional materials from lignin: methods and advances; World Scientific, 2018; pp. 1–28. [Google Scholar]
- Adamcyk, J.; Beisl, S.; Friedl, A. High Temperature Lignin Separation for Improved Yields in Ethanol Organosolv Pre-Treatment. Sustainability 2023, 15(4), 3006. [Google Scholar] [CrossRef]
- Ou, J.; et al. Revealing the structural influence on lignin phenolation and its nanoparticle fabrication with tunable sizes. ACS Sustain. Chem. Eng. 2022, 10(45), 14845–14854. [Google Scholar] [CrossRef]
- Chotirotsukon, C.; et al. Effects of thermal and physical modification on functional properties of organosolv lignin from sugarcane bagasse and its application in cosmeceutical products. In Frontiers in Chemical Engineering; 2023; Volume 5 - 2023. [Google Scholar]
- Zhang, Z.; et al. Chemicals from lignin by diol-stabilized acidolysis: reaction pathways and kinetics. Green Chem. 2022, 24(8), 3193–3207. [Google Scholar] [CrossRef]
- Hamzah, M.H.; Bowra, S.; Cox, P. Effects of ethanol concentration on organosolv lignin precipitation and aggregation from Miscanthus x giganteus. Processes 2020, 8(7), 845. [Google Scholar] [CrossRef]
- Hamzah, M.H.; Bowra, S.; Cox, P. Organosolv lignin aggregation behaviour of soluble lignin extract from Miscanthus x giganteus at different ethanol concentrations and its influence on the lignin esterification. Chem. Biol. Technol. Agric. 2021, 8(1), 65. [Google Scholar] [CrossRef]
- Farid, M.A.A.; et al. Effect of solvent and acid catalyst selection on lignin recovery and purity in autoclave-assisted organosolv extraction. Bioresour. Technol. Rep. 2023, 24, 101622. [Google Scholar] [CrossRef]
- Yong, K.J.; Wu, T.Y. Recent advances in the application of alcohols in extracting lignin with preserved β-O-4 content from lignocellulosic biomass. Bioresour. Technol. 2023, 384, 129238. [Google Scholar] [CrossRef]
- Avelino, F.; et al. Microwave-assisted organosolv extraction of coconut shell lignin by Brønsted and Lewis acids catalysts. J. Clean. Prod. 2018, 189, 785–796. [Google Scholar] [CrossRef]
- Sheng, Y.; et al. Ethanol organosolv lignin from different agricultural residues: Toward basic structural units and antioxidant activity. Food Chem. 2022, 376, 131895. [Google Scholar] [CrossRef]
- Hararak, B.; et al. Production of UV-shielded spherical lignin particles as multifunctional bio-additives for polyvinyl alcohol composite films. J. Nanoparticle Res. 2021, 23(8), 193. [Google Scholar] [CrossRef]
- Zijlstra, D.S.; et al. Mild organosolv lignin extraction with alcohols: the importance of benzylic alkoxylation. ACS Sustain. Chem. Eng. 2020, 8(13), 5119–5131. [Google Scholar] [CrossRef]
- Afrane, G.; Achaw, O.-W. Effect of the concentration of inherent mineral elements on the adsorption capacity of coconut shell-based activated carbons. Bioresour. Technol. 2008, 99(14), 6678–6682. [Google Scholar] [CrossRef]
- Ndung’u, S.N.; Nthiga, E.W.; Wanjau, R. Characterization of amorphous silicon nitride prepared from sand and coffee husk wastes by carbothermal reduction-nitridation. 2023. [Google Scholar] [CrossRef]
- Santos, P.S.B.d.; et al. Characterisation of Kraft lignin separated by gradient acid precipitation. Ind. Crops Prod. 2014, 55, 149–154. [Google Scholar] [CrossRef]
- Wang, G.; et al. Lignin as a novel tyrosinase inhibitor: Effects of sources and isolation processes. ACS Sustain. Chem. Eng. 2018, 6(7), 9510–9518. [Google Scholar] [CrossRef]
- dos Santos, P.S.; et al. Characterisation of Kraft lignin separated by gradient acid precipitation. Ind. Crops Prod. 2014, 55, 149–154. [Google Scholar] [CrossRef]
- Zakaria, S.M.; Idris, A.; Alias, Y. Lignin extraction from coconut shell using aprotic ionic liquids. BioResources 2017, 12(3), 5749–5774. [Google Scholar] [CrossRef]
- Mota, I.F.; et al. High value-added lignin extracts from sugarcane by-products. Int. J. Biol. Macromol. 2023, 230, 123144. [Google Scholar] [CrossRef]
- Ratanasumarn, N.; Chitprasert, P. Cosmetic potential of lignin extracts from alkaline-treated sugarcane bagasse: Optimization of extraction conditions using response surface methodology. Int. J. Biol. Macromol. 2020, 153, 138–145. [Google Scholar] [CrossRef]
- Yue, F.; et al. Structural modifications of sugarcane bagasse lignins during wet-storage and soda-oxygen pulping. ACS Sustain. Chem. Eng. 2016, 4(10), 5311–5318. [Google Scholar] [CrossRef]
- Meyer, J.R.; et al. Kinetics of secondary reactions affecting the organosolv lignin structure. ChemSusChem 2020, 13(17), 4557–4566. [Google Scholar] [CrossRef]
- He, C.; et al. Glycol-based Alkaline Deep Eutectic Solvents for “Lignin-First” Dissolution from Coconut Shells. ACS Sustain. Chem. Eng. 2024, 12(30), 11327–11337. [Google Scholar] [CrossRef]
- Watkins, D.; et al. Extraction and characterization of lignin from different biomass resources. J. Mater. Res. Technol. 2015, 4(1), 26–32. [Google Scholar] [CrossRef]
- Gordobil, O.; et al. Kraft lignin as filler in PLA to improve ductility and thermal properties. Ind. Crops Prod. 2015, 72, 46–53. [Google Scholar] [CrossRef]
- Tejado, A.; et al. Physico-chemical characterization of lignins from different sources for use in phenol–formaldehyde resin synthesis. Bioresour. Technol. 2007, 98(8), 1655–1663. [Google Scholar] [CrossRef]
- Dhara, S.; et al. High-purity alkaline lignin extraction from Saccharum ravannae and optimization of lignin recovery through response surface methodology. Int. J. Biol. Macromol. 2023, 234, 123594. [Google Scholar] [CrossRef]
- Andrianto, D.; Nurcholis, W.; Ghifari, M.N. Improvement of iron content, total phenolic, and antioxidant activity of green spinach (Amaranthus tricolor L.) with maggot fertilizer. Indones. J. Agron. Agron. Indones. 2024, 52(2). [Google Scholar] [CrossRef]
- Li, K.; et al. Recent advances in lignin antioxidant: Antioxidant mechanism, evaluation methods, influence factors and various applications. Int. J. Biol. Macromol. 2023, 251, 125992. [Google Scholar] [CrossRef]
- Wei, X.; et al. Effect of organosolv extraction on the structure and antioxidant activity of eucalyptus kraft lignin. Int. J. Biol. Macromol. 2021, 187, 462–470. [Google Scholar] [CrossRef]
- del Río, J.C.; et al. Lignin monomers from beyond the canonical monolignol biosynthetic pathway: another brick in the wall. ACS Sustain. Chem. Eng. 2020, 8(13), 4997–5012. [Google Scholar] [CrossRef]
- Padayatty, S.J.; et al. Vitamin C as an antioxidant: evaluation of its role in disease prevention. J. Am. Coll. Nutr. 2003, 22(1), 18–35. [Google Scholar] [CrossRef]
- Li, K.; et al. Antibacterial mechanism of lignin and lignin-based antimicrobial materials in different fields. Int. J. Biol. Macromol. 2023, 126281. [Google Scholar] [CrossRef]
- Alzagameem, A.; et al. Antimicrobial activity of lignin and lignin-derived cellulose and chitosan composites against selected pathogenic and spoilage microorganisms. Polymers 2019, 11(4), 670. [Google Scholar] [CrossRef]
- Kianian, S.; Nejad, M.; Hegg, E.L. Structure-bioactivity relationships in lignins: A multivariate analysis. Int. J. Biol. Macromol. 2026, 373, 153074. [Google Scholar] [CrossRef]
Figure 1.
Model adequacy. (a) Experimental versus predicted lignin yield for the 29 BBD runs. The shaded band shows ±t·RMSE, and the circled point is run 19. (b) Pareto chart of the standardized effects (|t|) of the model terms. Bars beyond the dashed line (t = 2.14) are significant (p < 0.05), and the signs show the direction of each effect.
Figure 1.
Model adequacy. (a) Experimental versus predicted lignin yield for the 29 BBD runs. The shaded band shows ±t·RMSE, and the circled point is run 19. (b) Pareto chart of the standardized effects (|t|) of the model terms. Bars beyond the dashed line (t = 2.14) are significant (p < 0.05), and the signs show the direction of each effect.
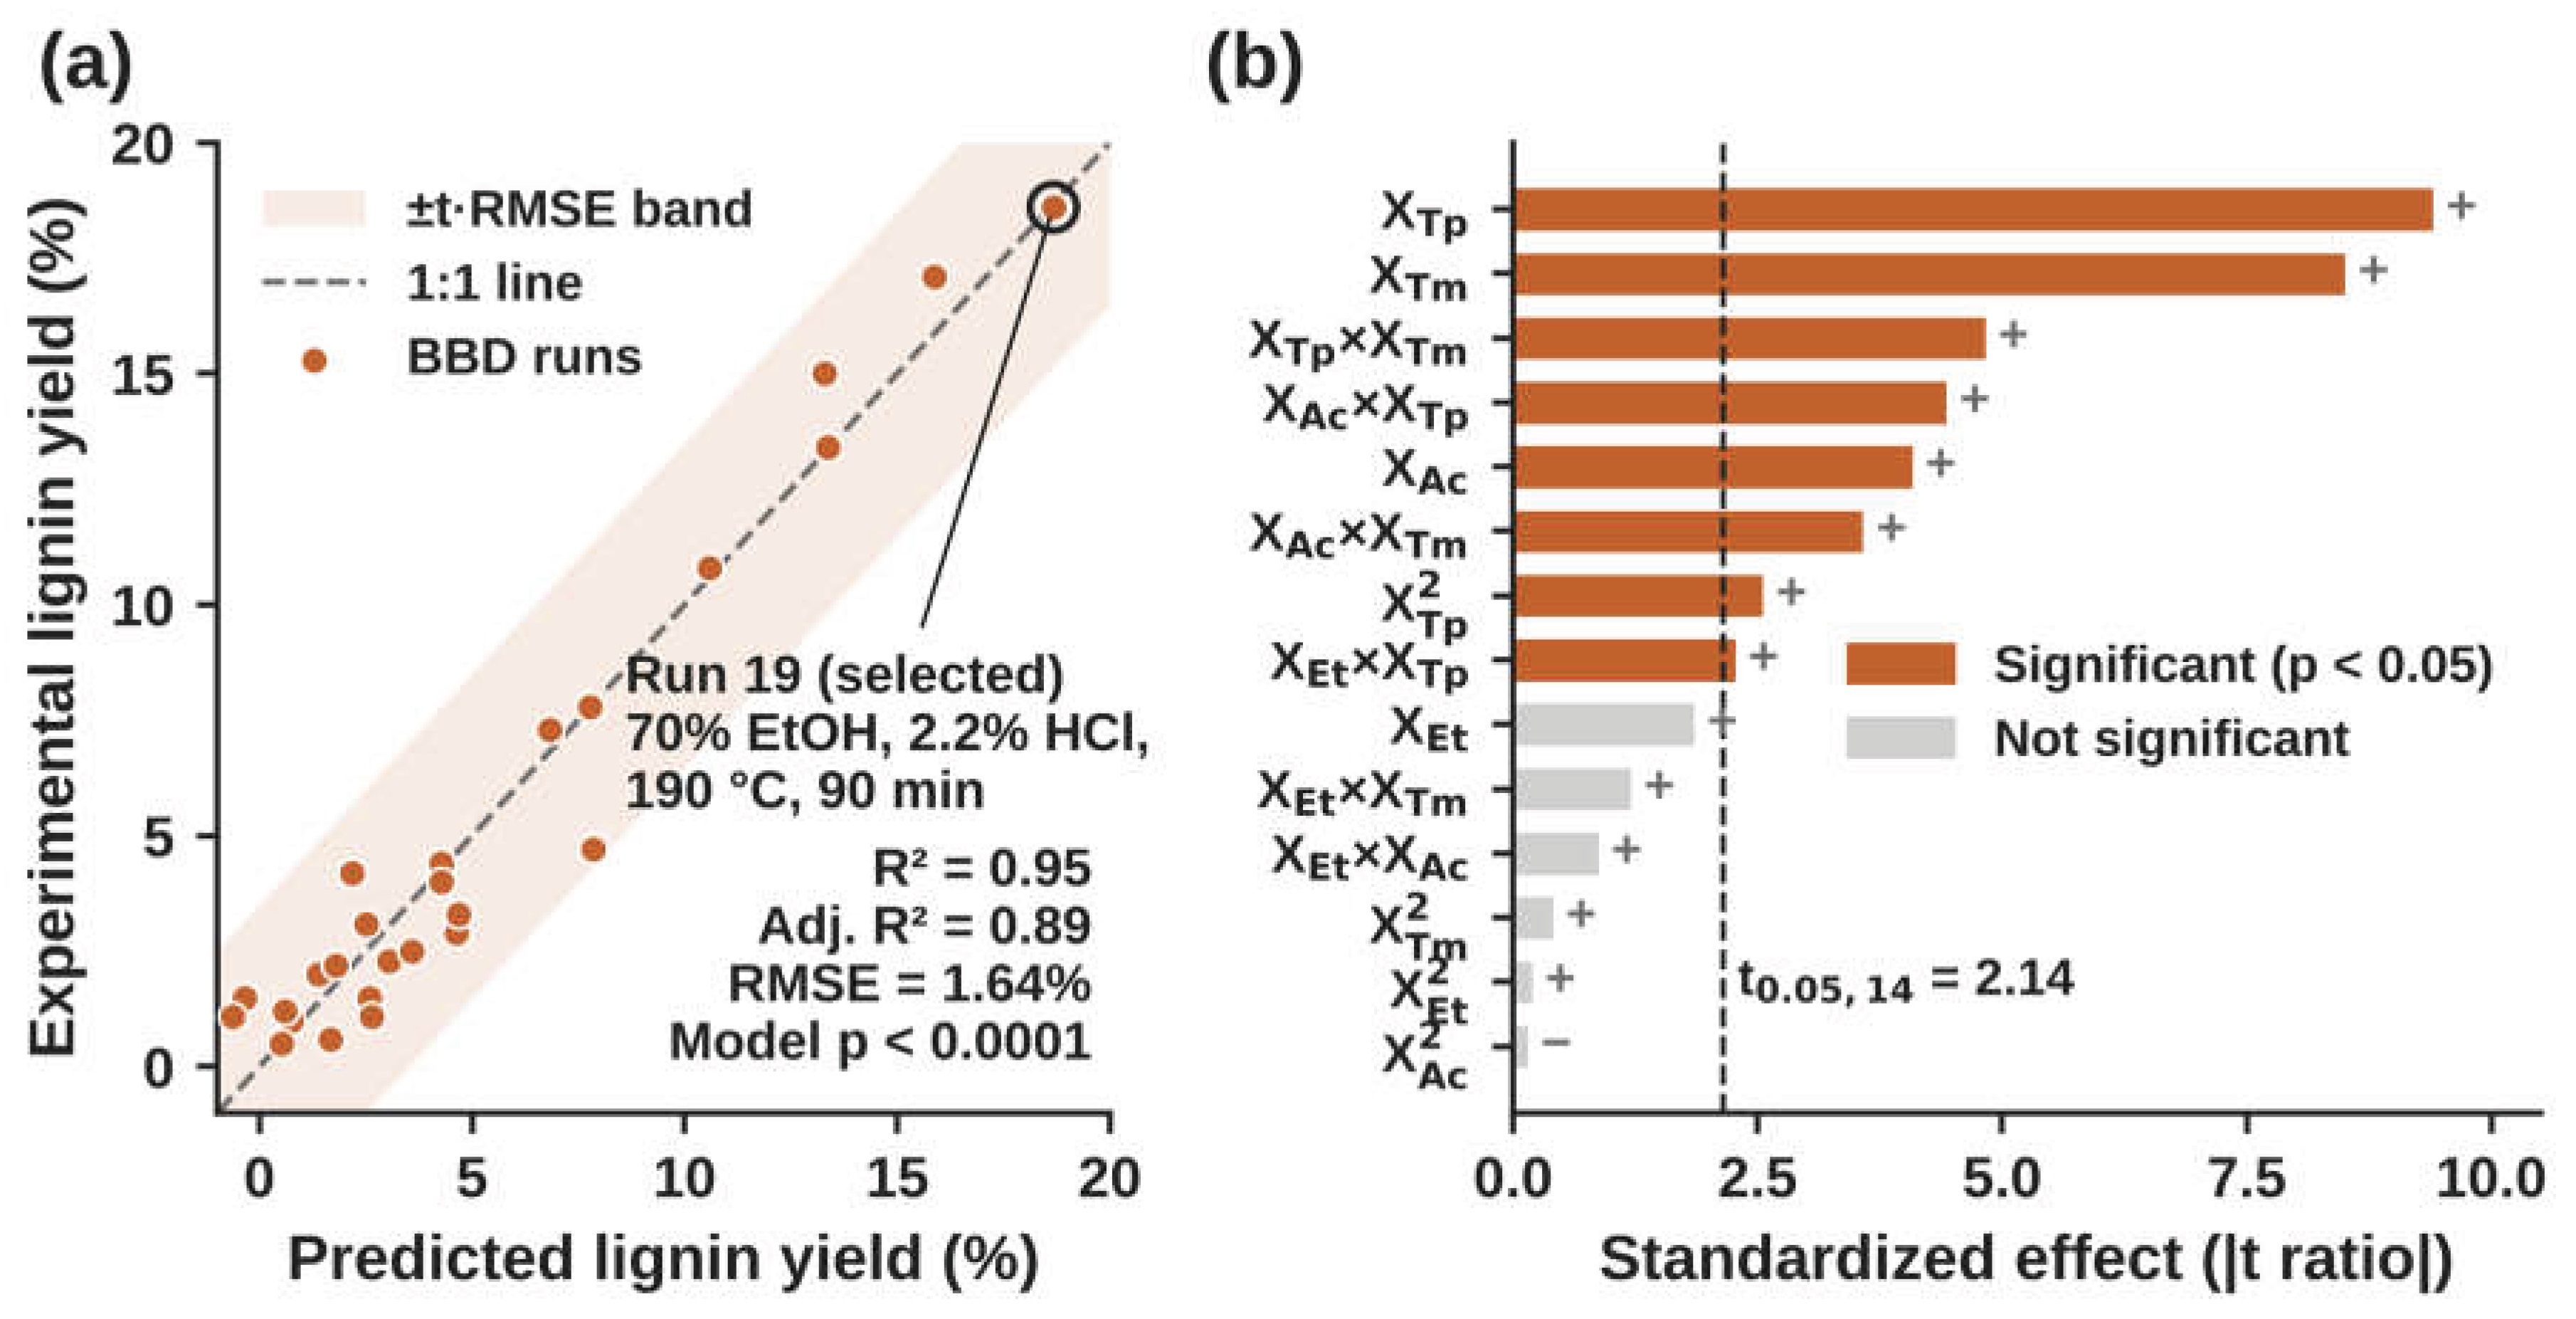
Figure 2.
Contour plots of predicted lignin yield for the significant two-factor interactions: (a) ethanol × temperature, (b) HCl × temperature, (c) HCl × time and (d) temperature × time. Factors not shown are held at their center levels. The star in (d) marks run 19, the selected condition.
Figure 2.
Contour plots of predicted lignin yield for the significant two-factor interactions: (a) ethanol × temperature, (b) HCl × temperature, (c) HCl × time and (d) temperature × time. Factors not shown are held at their center levels. The star in (d) marks run 19, the selected condition.
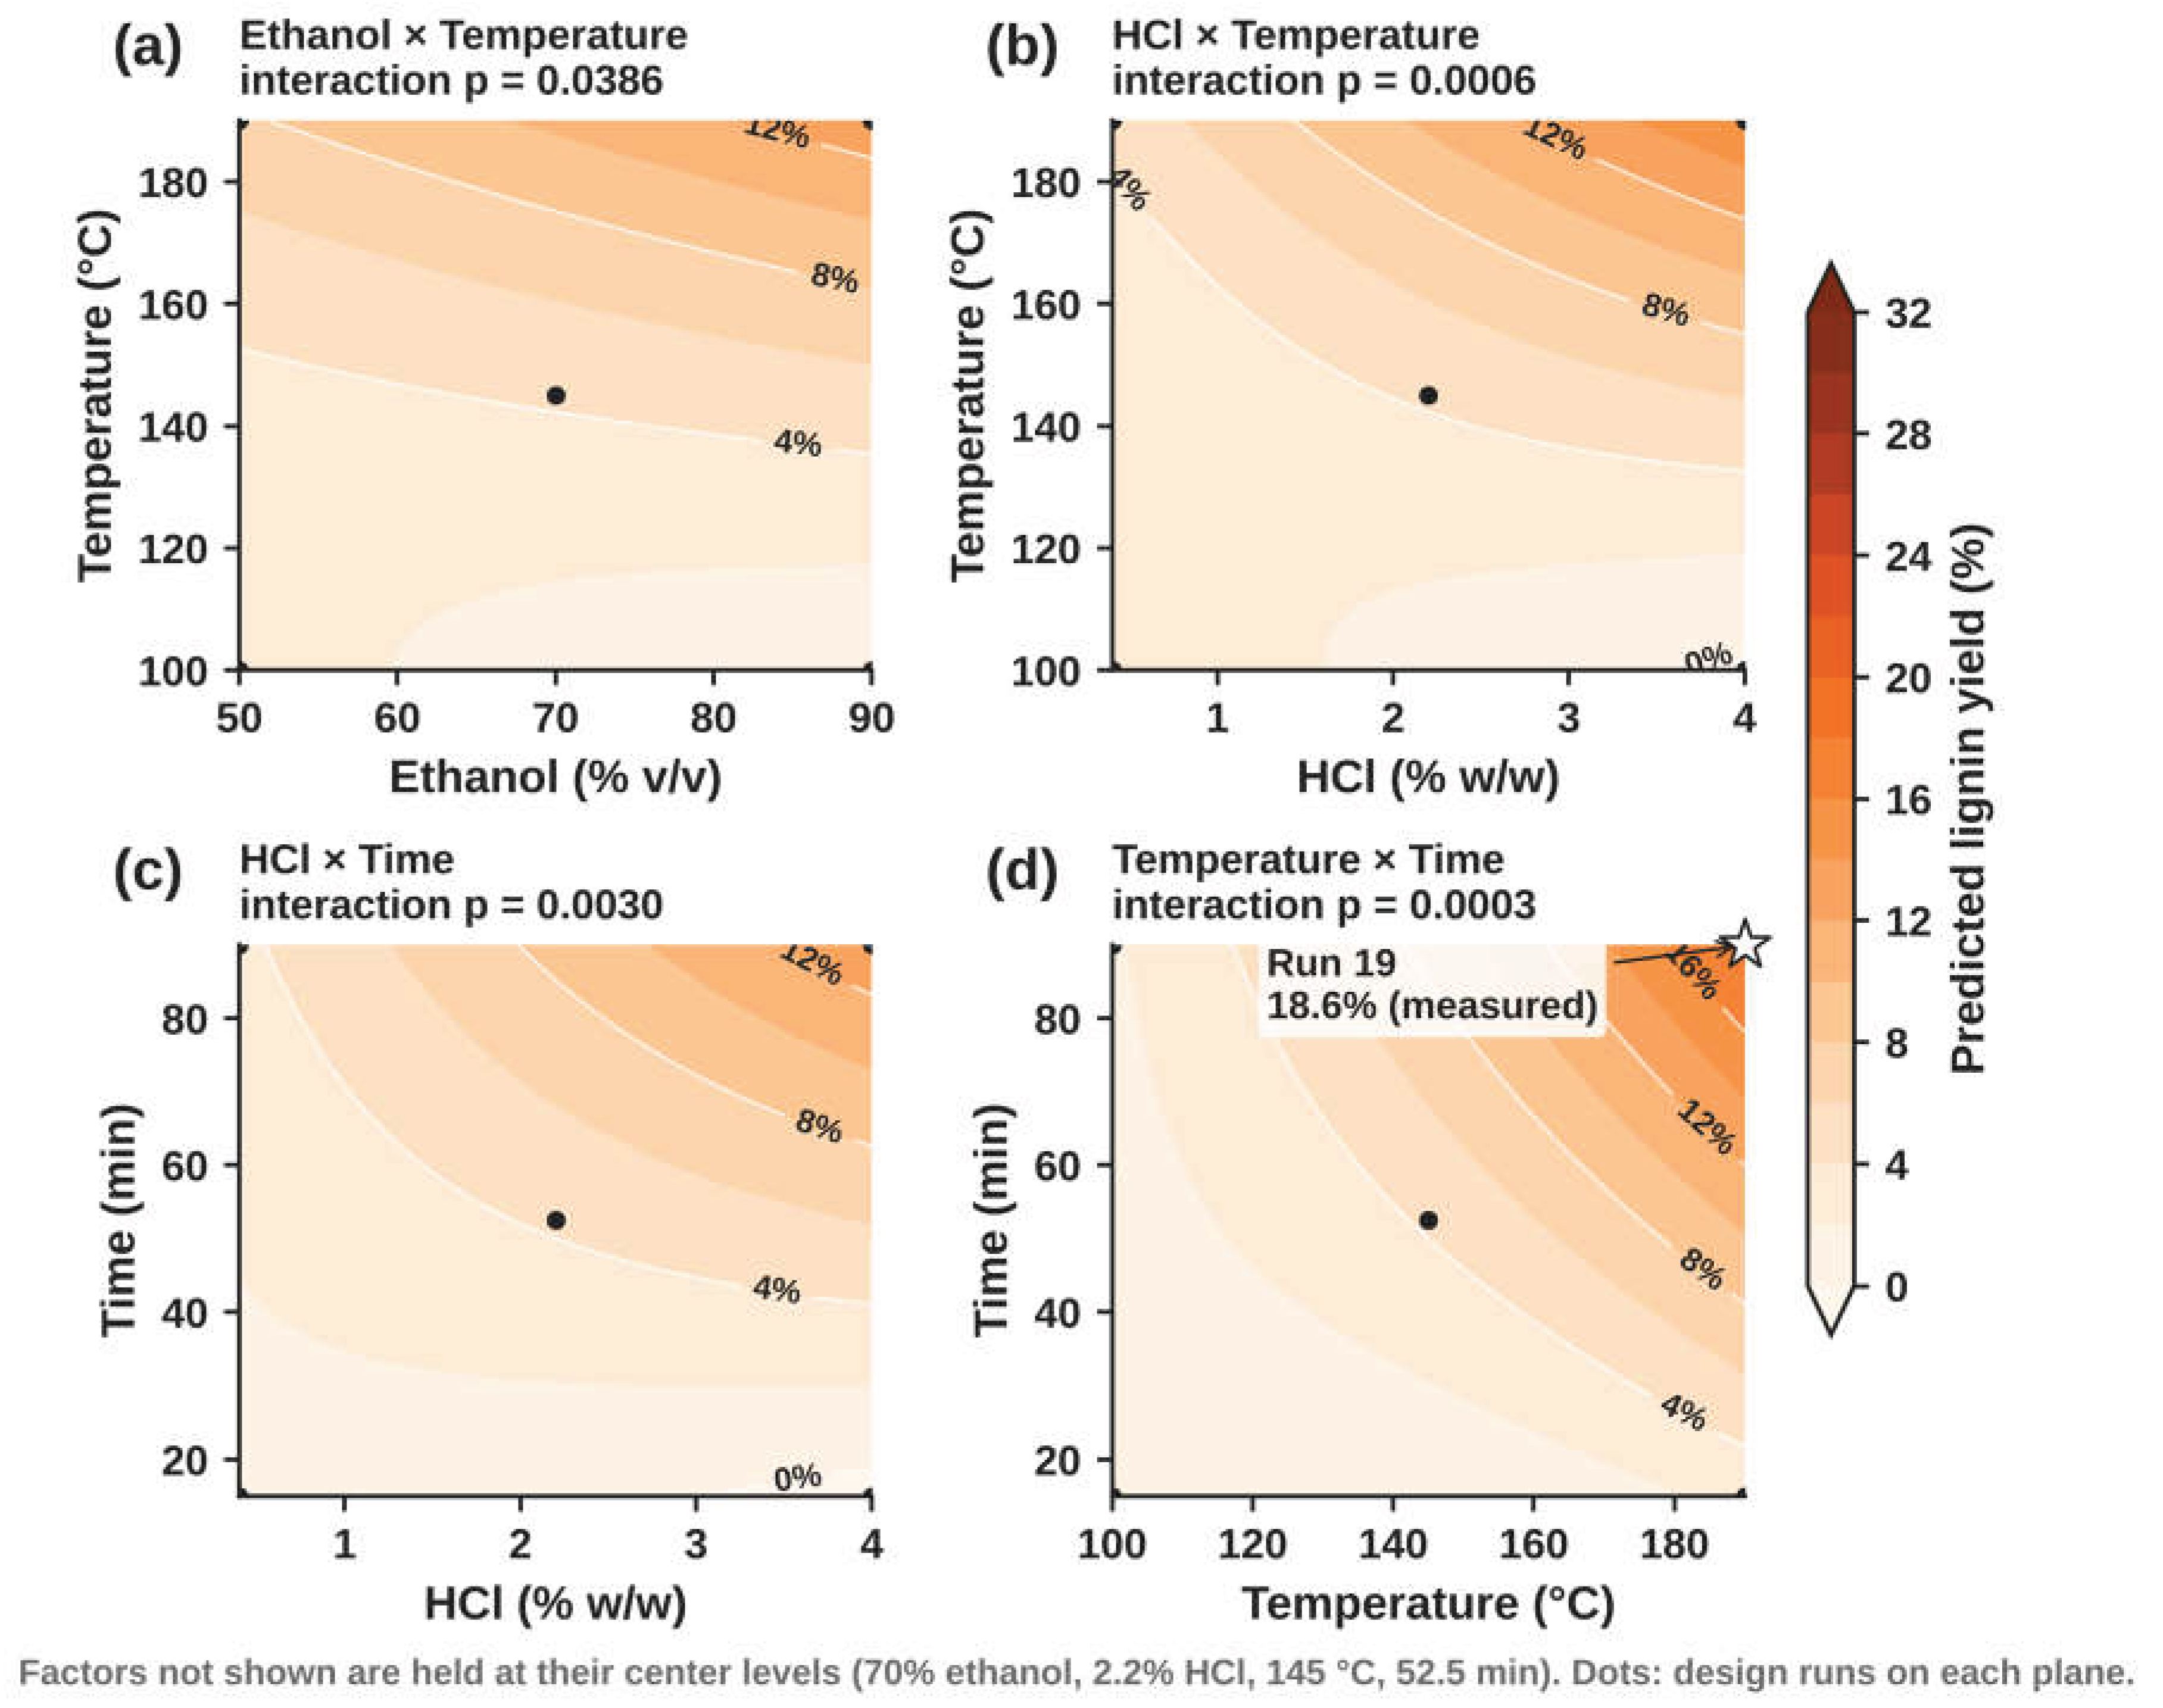
Figure 3.
SEM images of HCl-Ethanosolv-CSL at (a) 500×, (b) 1000× and (c) 5000× (secondary electrons, 10 kV), and (d) AlkL at 2500× (backscattered electrons, 5 kV).
Figure 3.
SEM images of HCl-Ethanosolv-CSL at (a) 500×, (b) 1000× and (c) 5000× (secondary electrons, 10 kV), and (d) AlkL at 2500× (backscattered electrons, 5 kV).
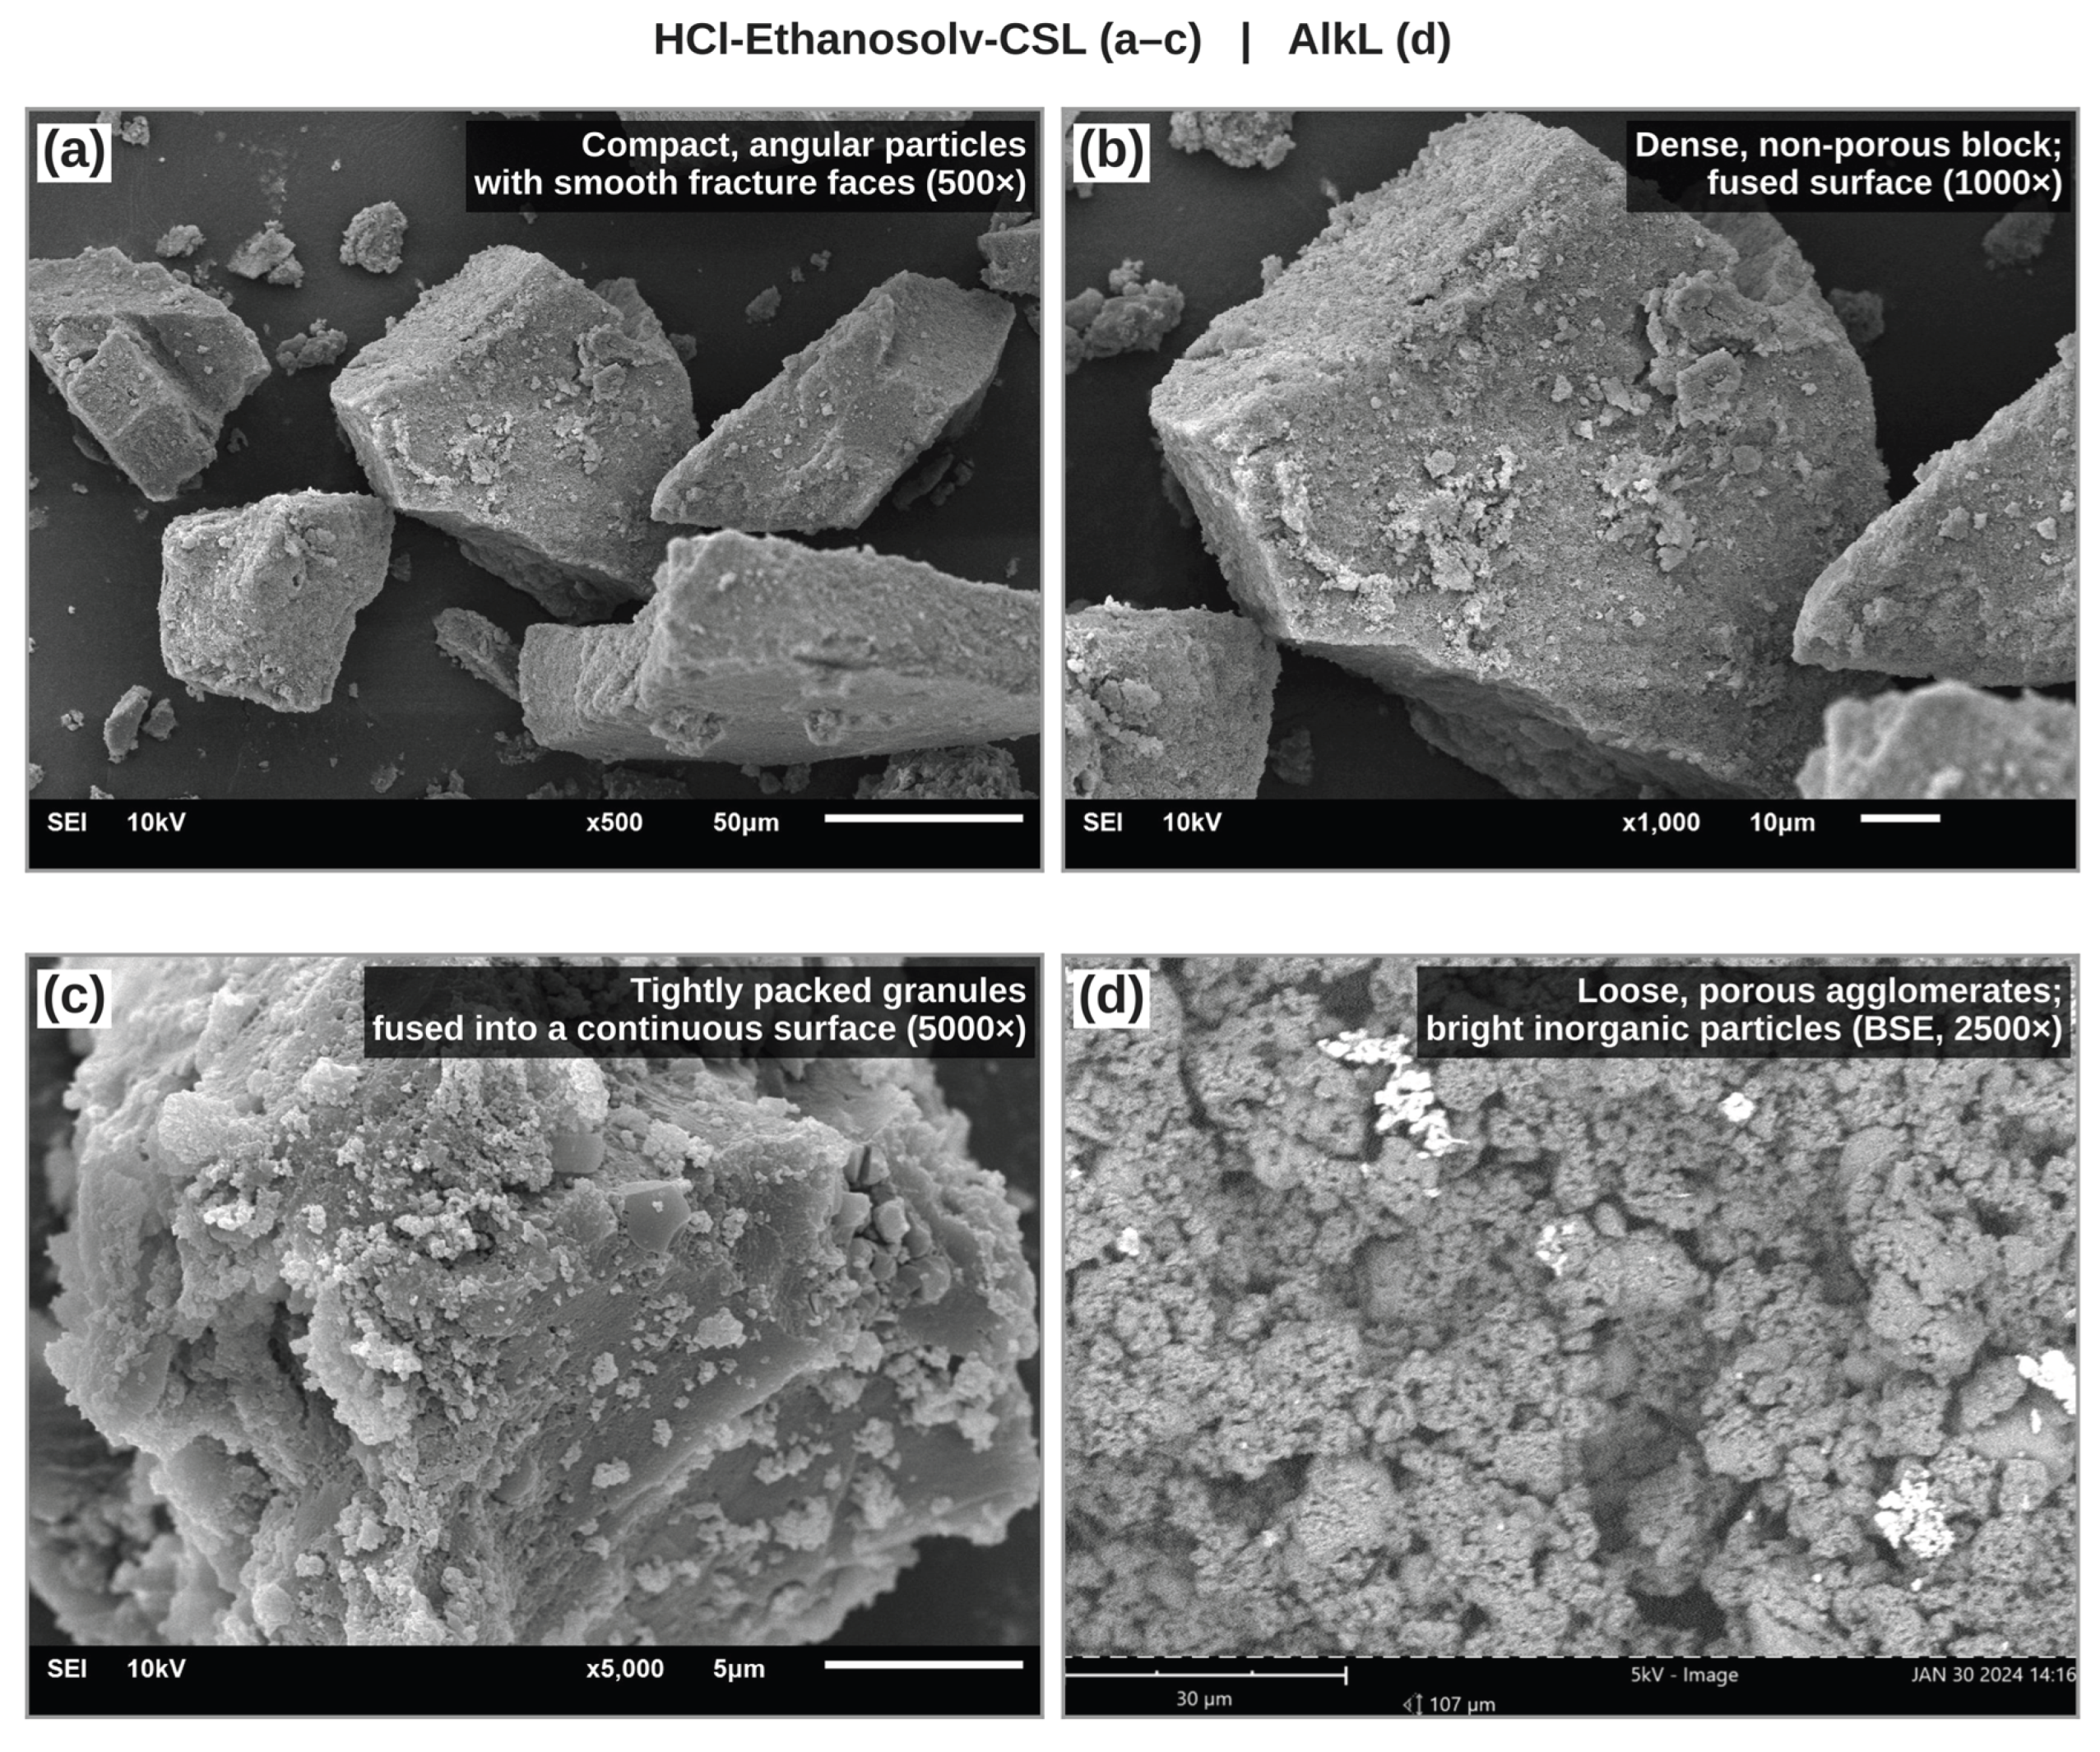
Figure 4.
XRD patterns of HCl-Ethanosolv-CSL and AlkL. Triangles mark the reflections of sodium sulfate (thenardite) in AlkL.
Figure 4.
XRD patterns of HCl-Ethanosolv-CSL and AlkL. Triangles mark the reflections of sodium sulfate (thenardite) in AlkL.
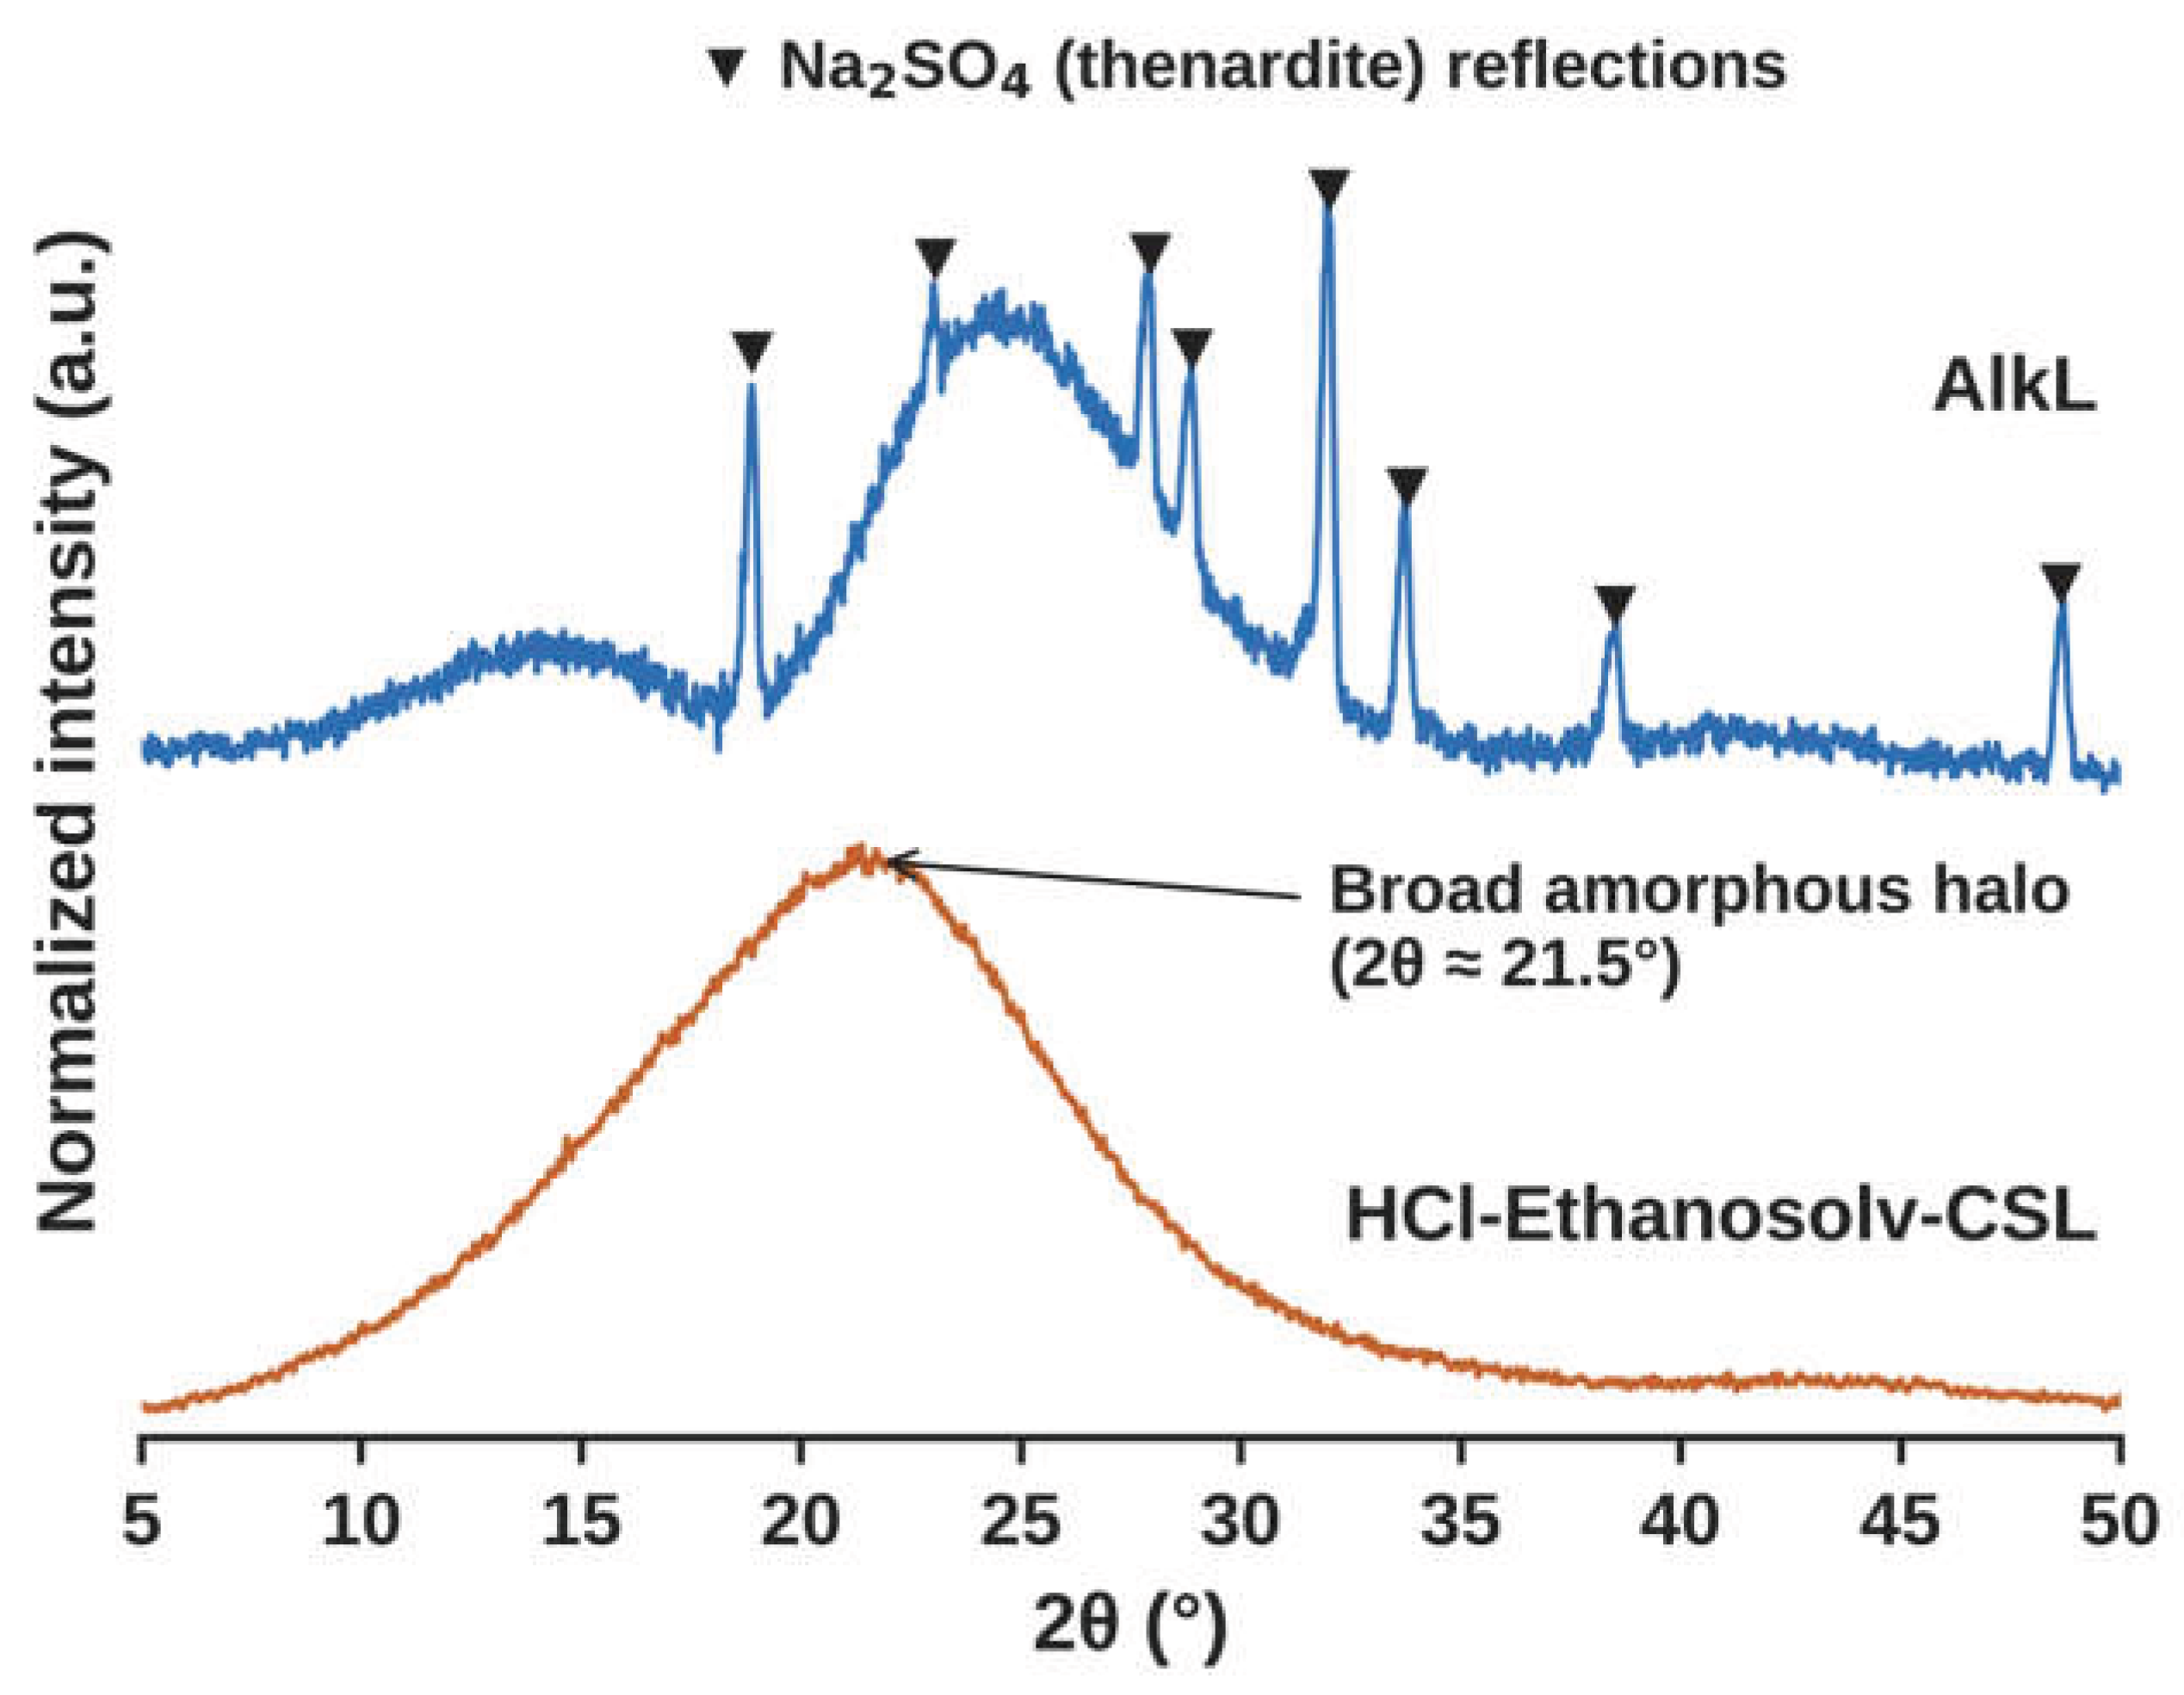
Figure 5.
FTIR spectra of HCl-Ethanosolv-CSL and AlkL. Orange bands are present only in, or are stronger in, HCl-Ethanosolv-CSL. Grey bands are common lignin bands.
Figure 5.
FTIR spectra of HCl-Ethanosolv-CSL and AlkL. Orange bands are present only in, or are stronger in, HCl-Ethanosolv-CSL. Grey bands are common lignin bands.
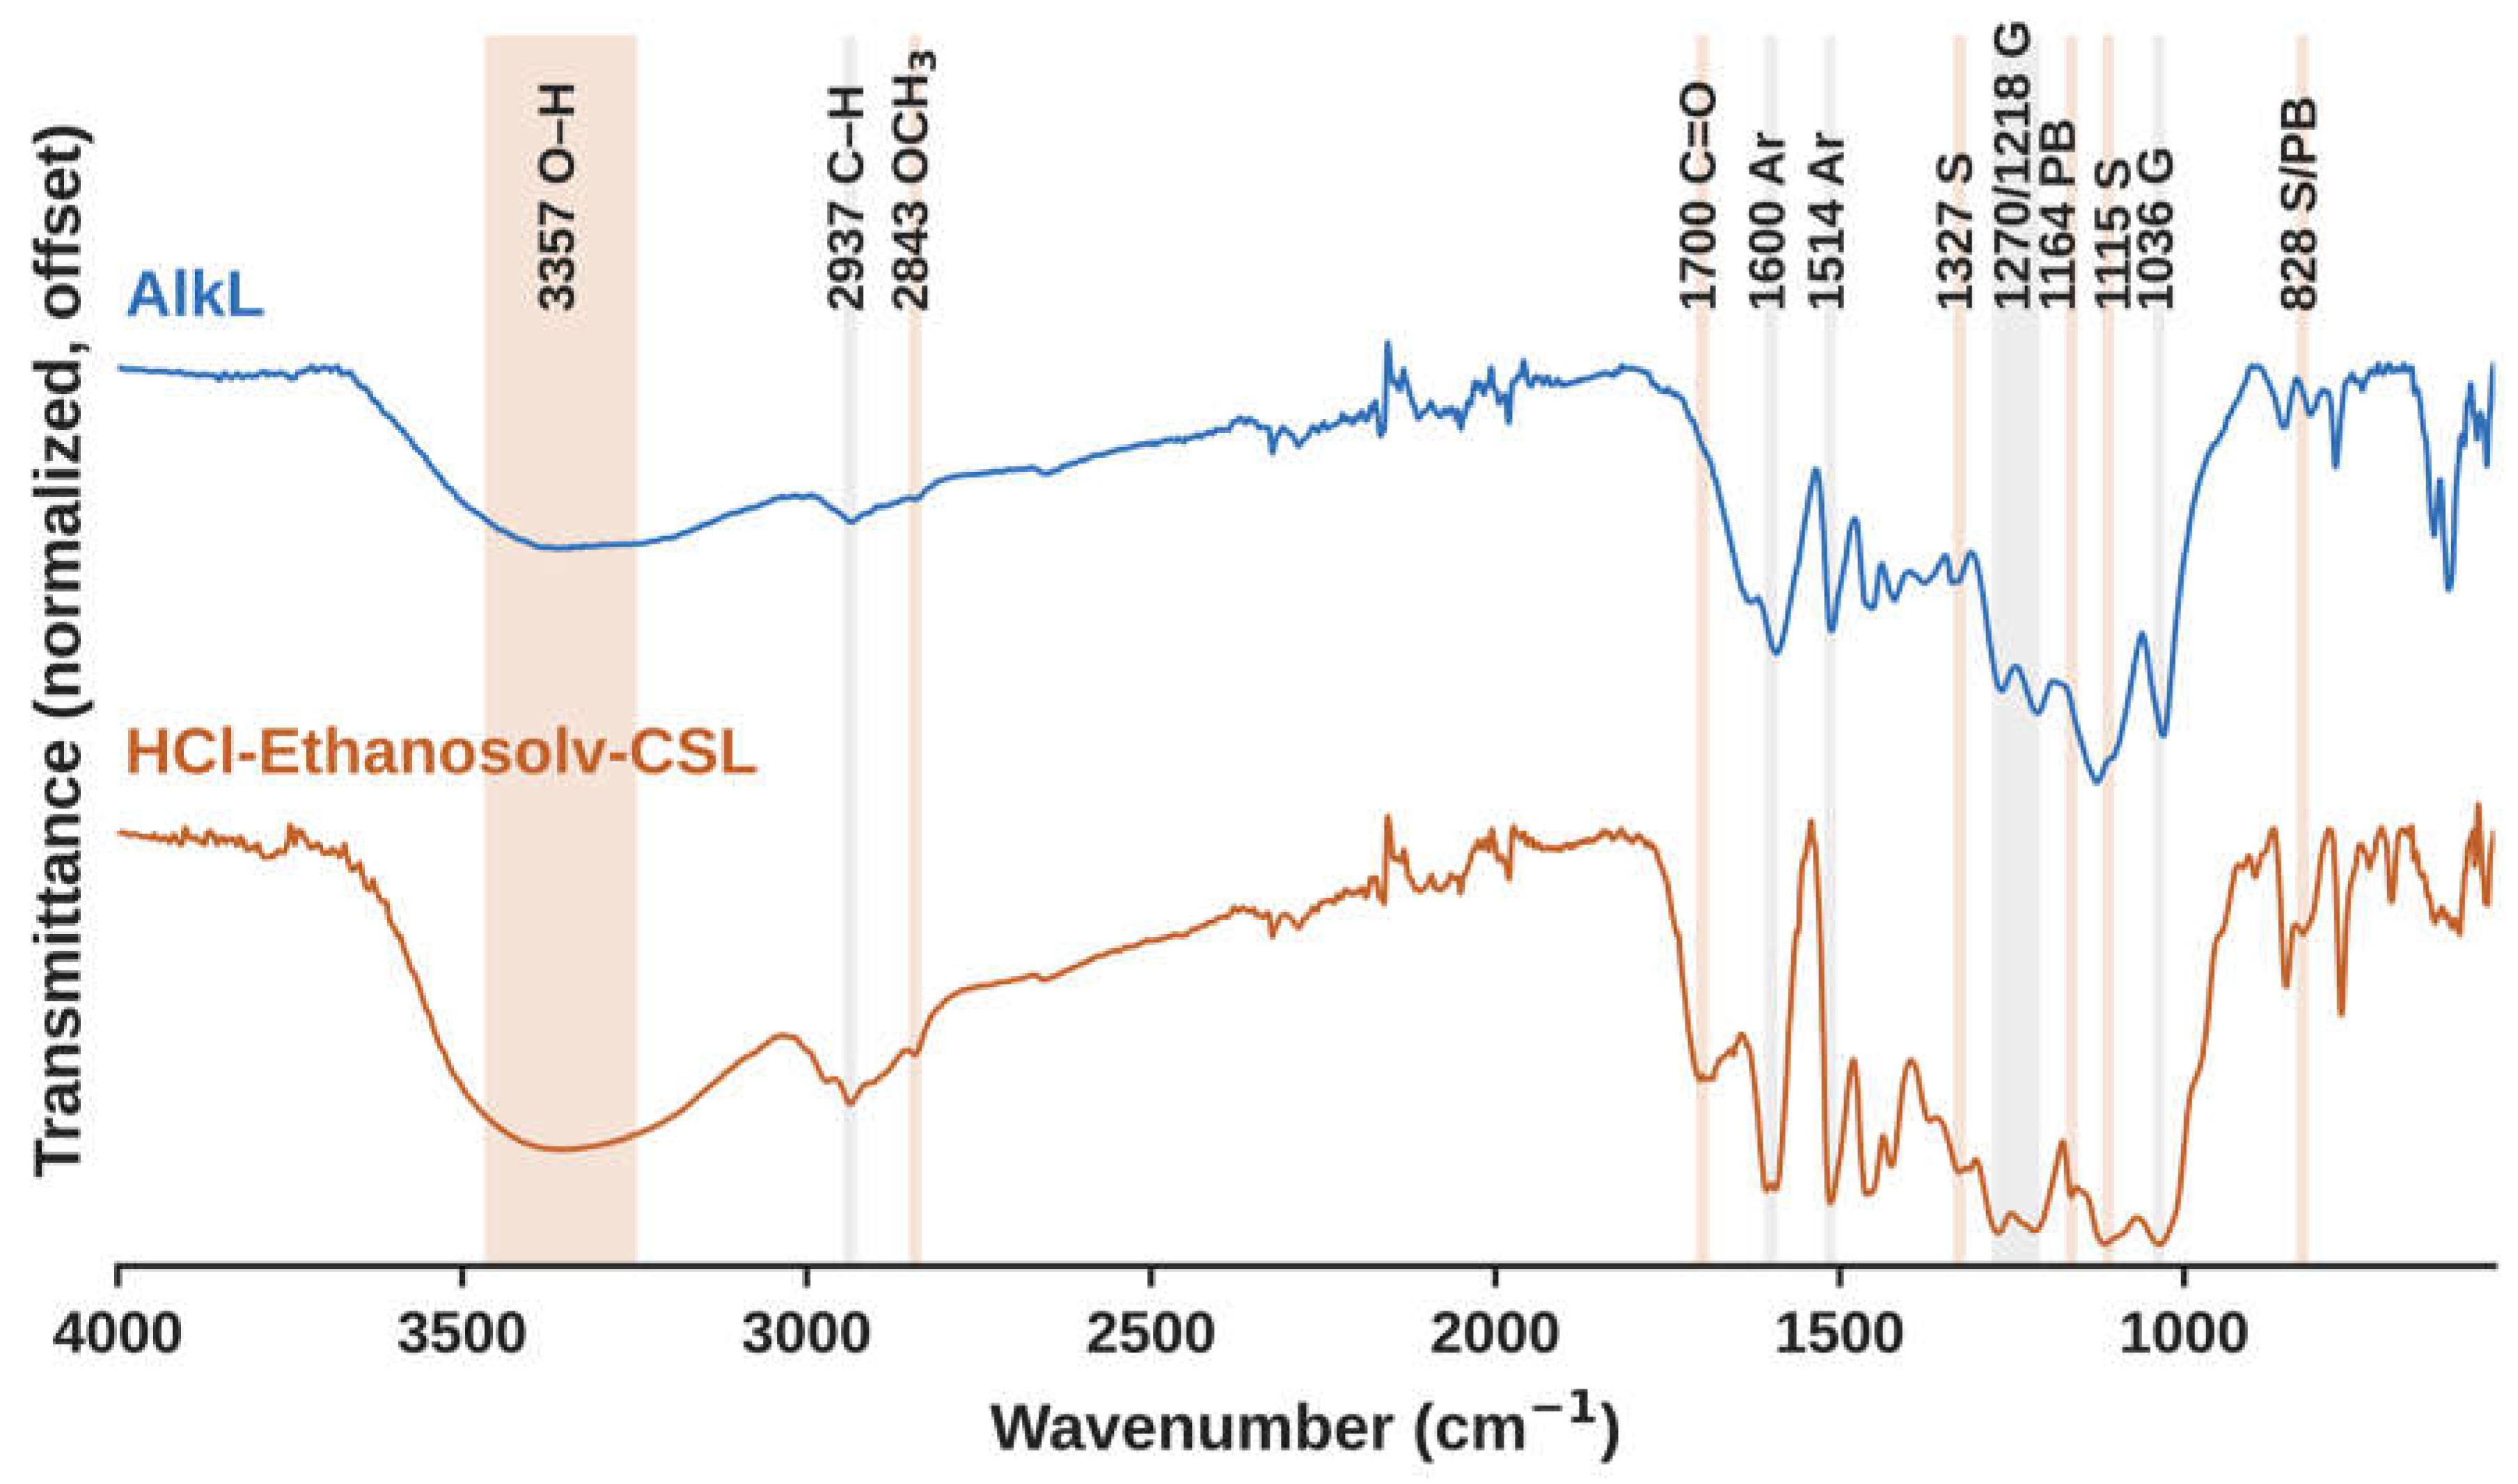
Figure 6.
1H NMR spectra of HCl-Ethanosolv-CSL and AlkL in DMSO-d6. Shaded regions mark the main proton types. Spectra are normalized to the methoxyl signal.
Figure 6.
1H NMR spectra of HCl-Ethanosolv-CSL and AlkL in DMSO-d6. Shaded regions mark the main proton types. Spectra are normalized to the methoxyl signal.
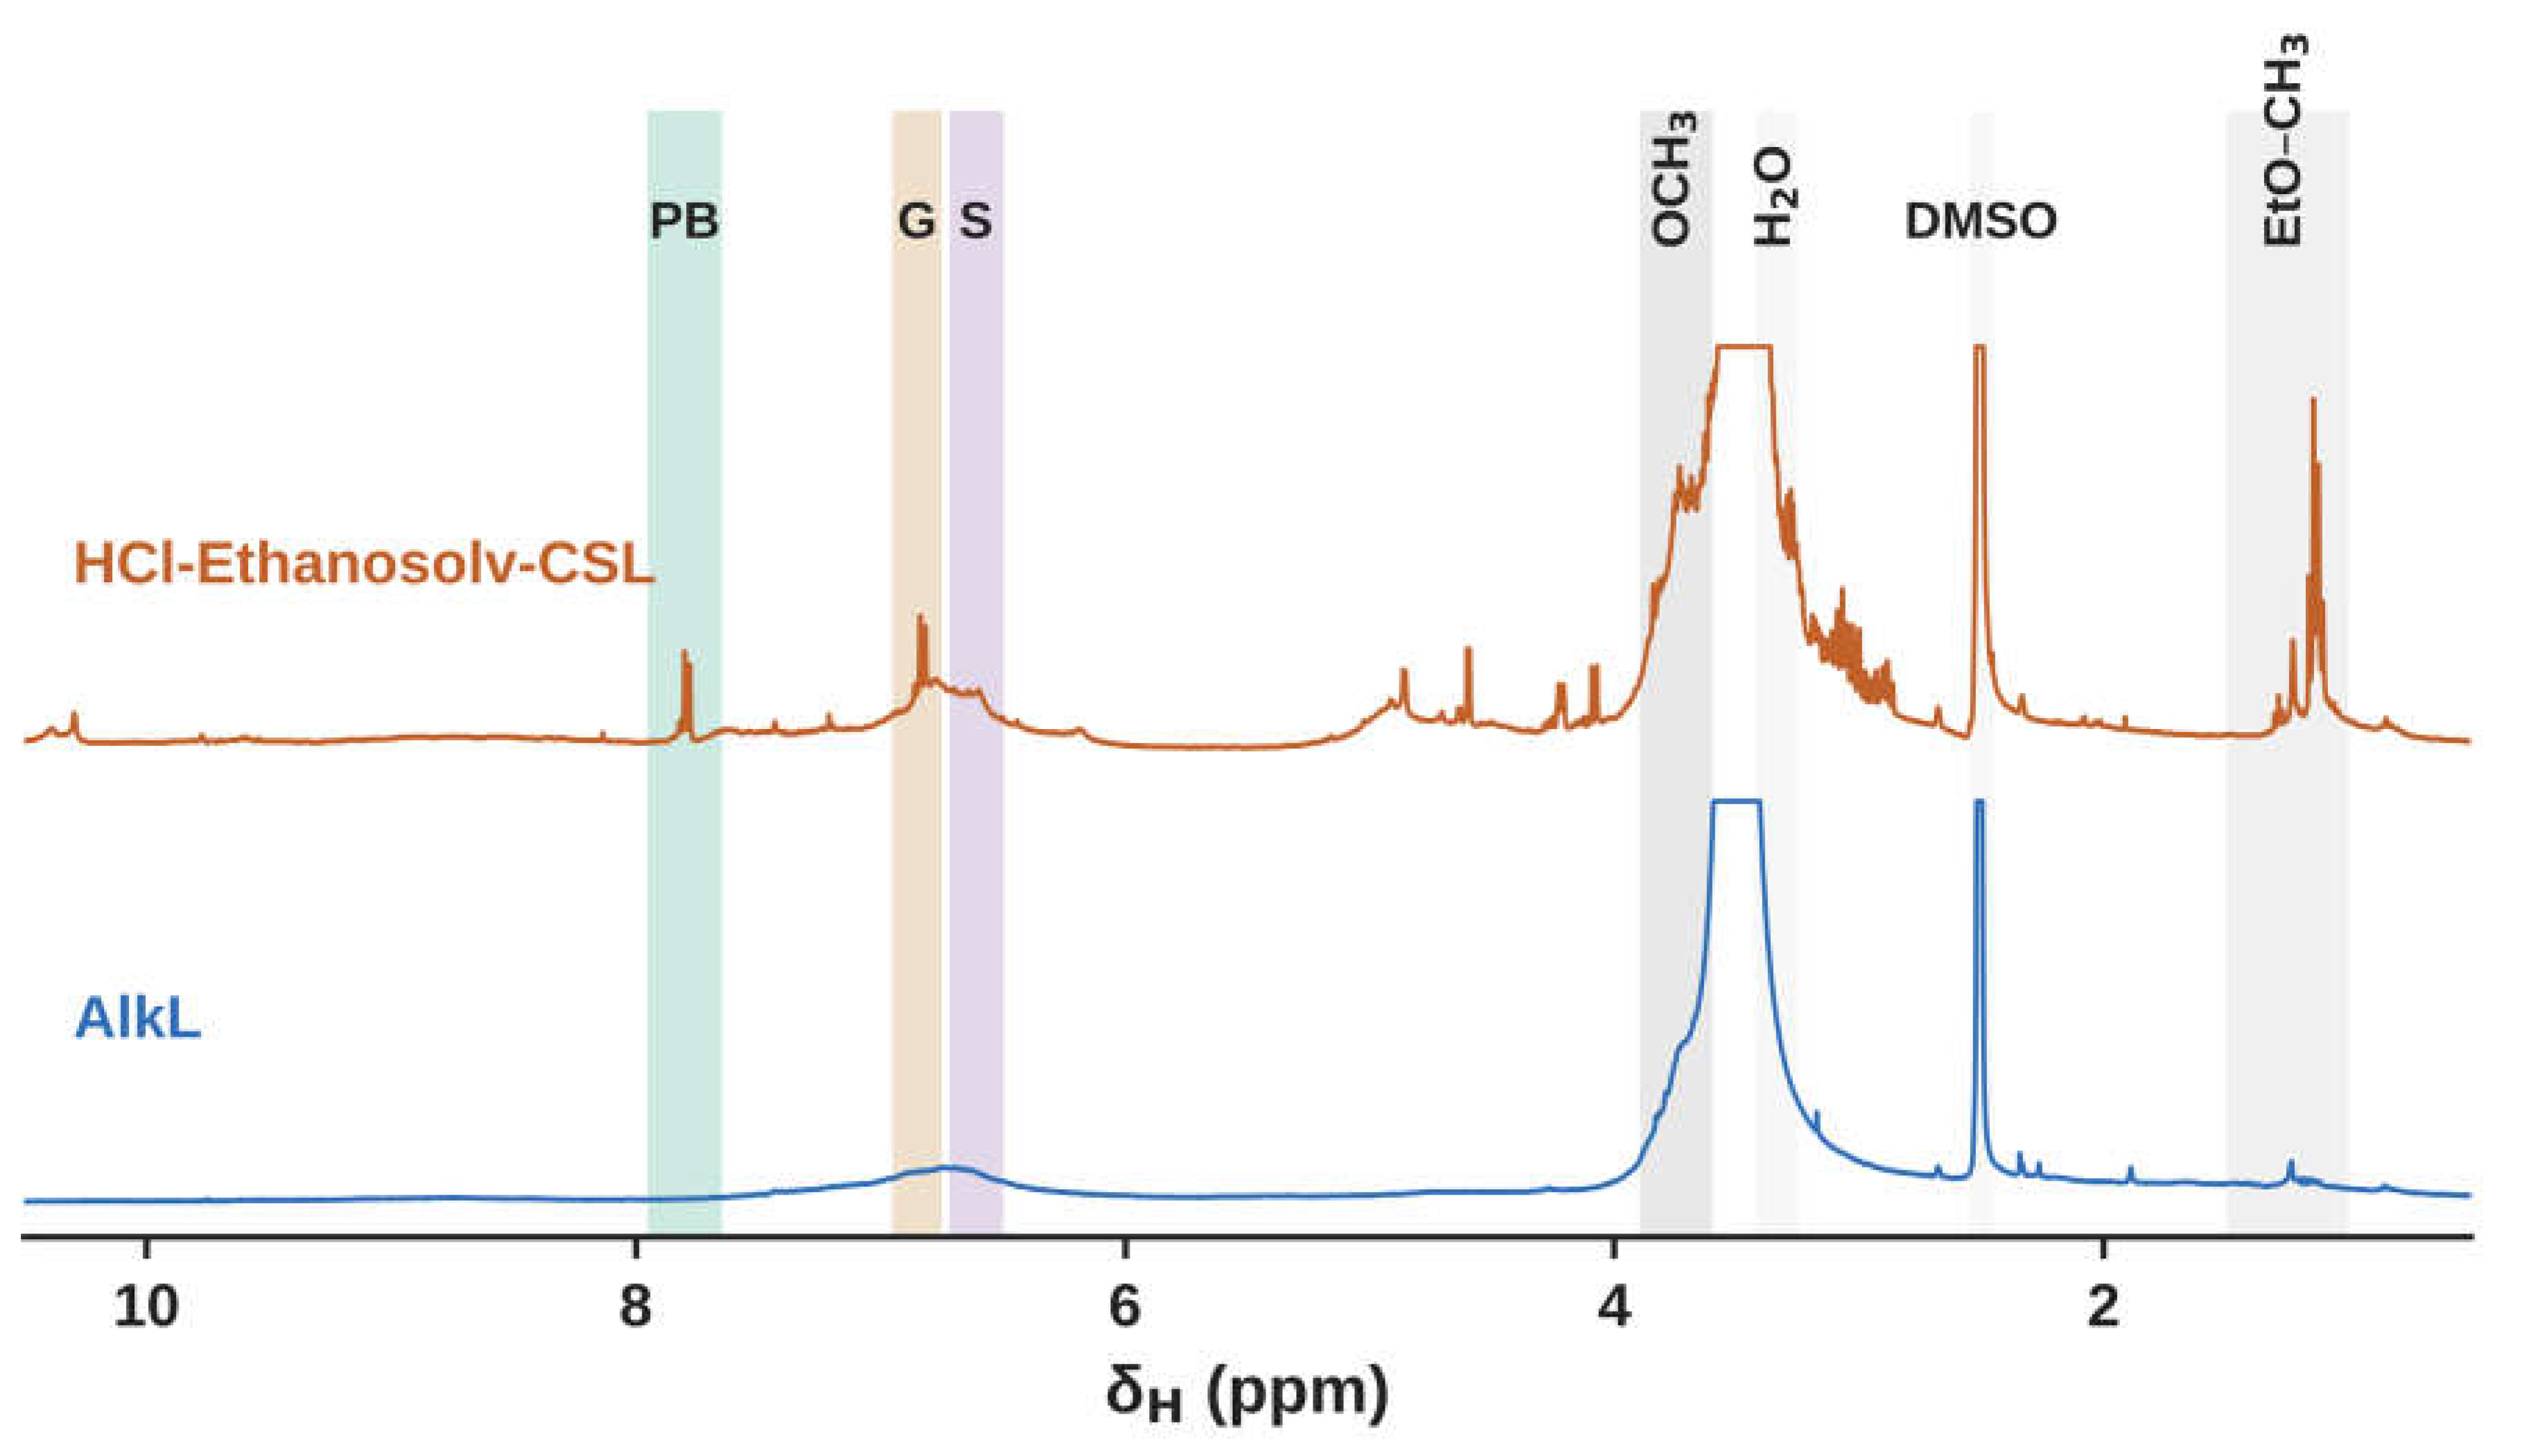
Figure 7.
2D HSQC NMR spectra of HCl-Ethanosolv-CSL and AlkL: (a, c) aromatic regions and (b, d) side-chain regions (a, b) HCl-Ethanosolv-CSL and (c, d) AlkL. S, syringyl. S′, Cα-oxidized syringyl. G, guaiacyl. PB, p-hydroxybenzoate ester. EtO, ethoxyl. EtOOC, ethyl ester. X, xylan. n.d., not detected. The dashed box marks the Cγ region, where Aγ/Bγ, xylan C5 and ethoxyl OCH2 signals overlap. The inset in (b) shows the ethoxyl and ethyl ester CH3 region. Colored contours show assigned cross-peaks, and grey contours are unassigned.
Figure 7.
2D HSQC NMR spectra of HCl-Ethanosolv-CSL and AlkL: (a, c) aromatic regions and (b, d) side-chain regions (a, b) HCl-Ethanosolv-CSL and (c, d) AlkL. S, syringyl. S′, Cα-oxidized syringyl. G, guaiacyl. PB, p-hydroxybenzoate ester. EtO, ethoxyl. EtOOC, ethyl ester. X, xylan. n.d., not detected. The dashed box marks the Cγ region, where Aγ/Bγ, xylan C5 and ethoxyl OCH2 signals overlap. The inset in (b) shows the ethoxyl and ethyl ester CH3 region. Colored contours show assigned cross-peaks, and grey contours are unassigned.
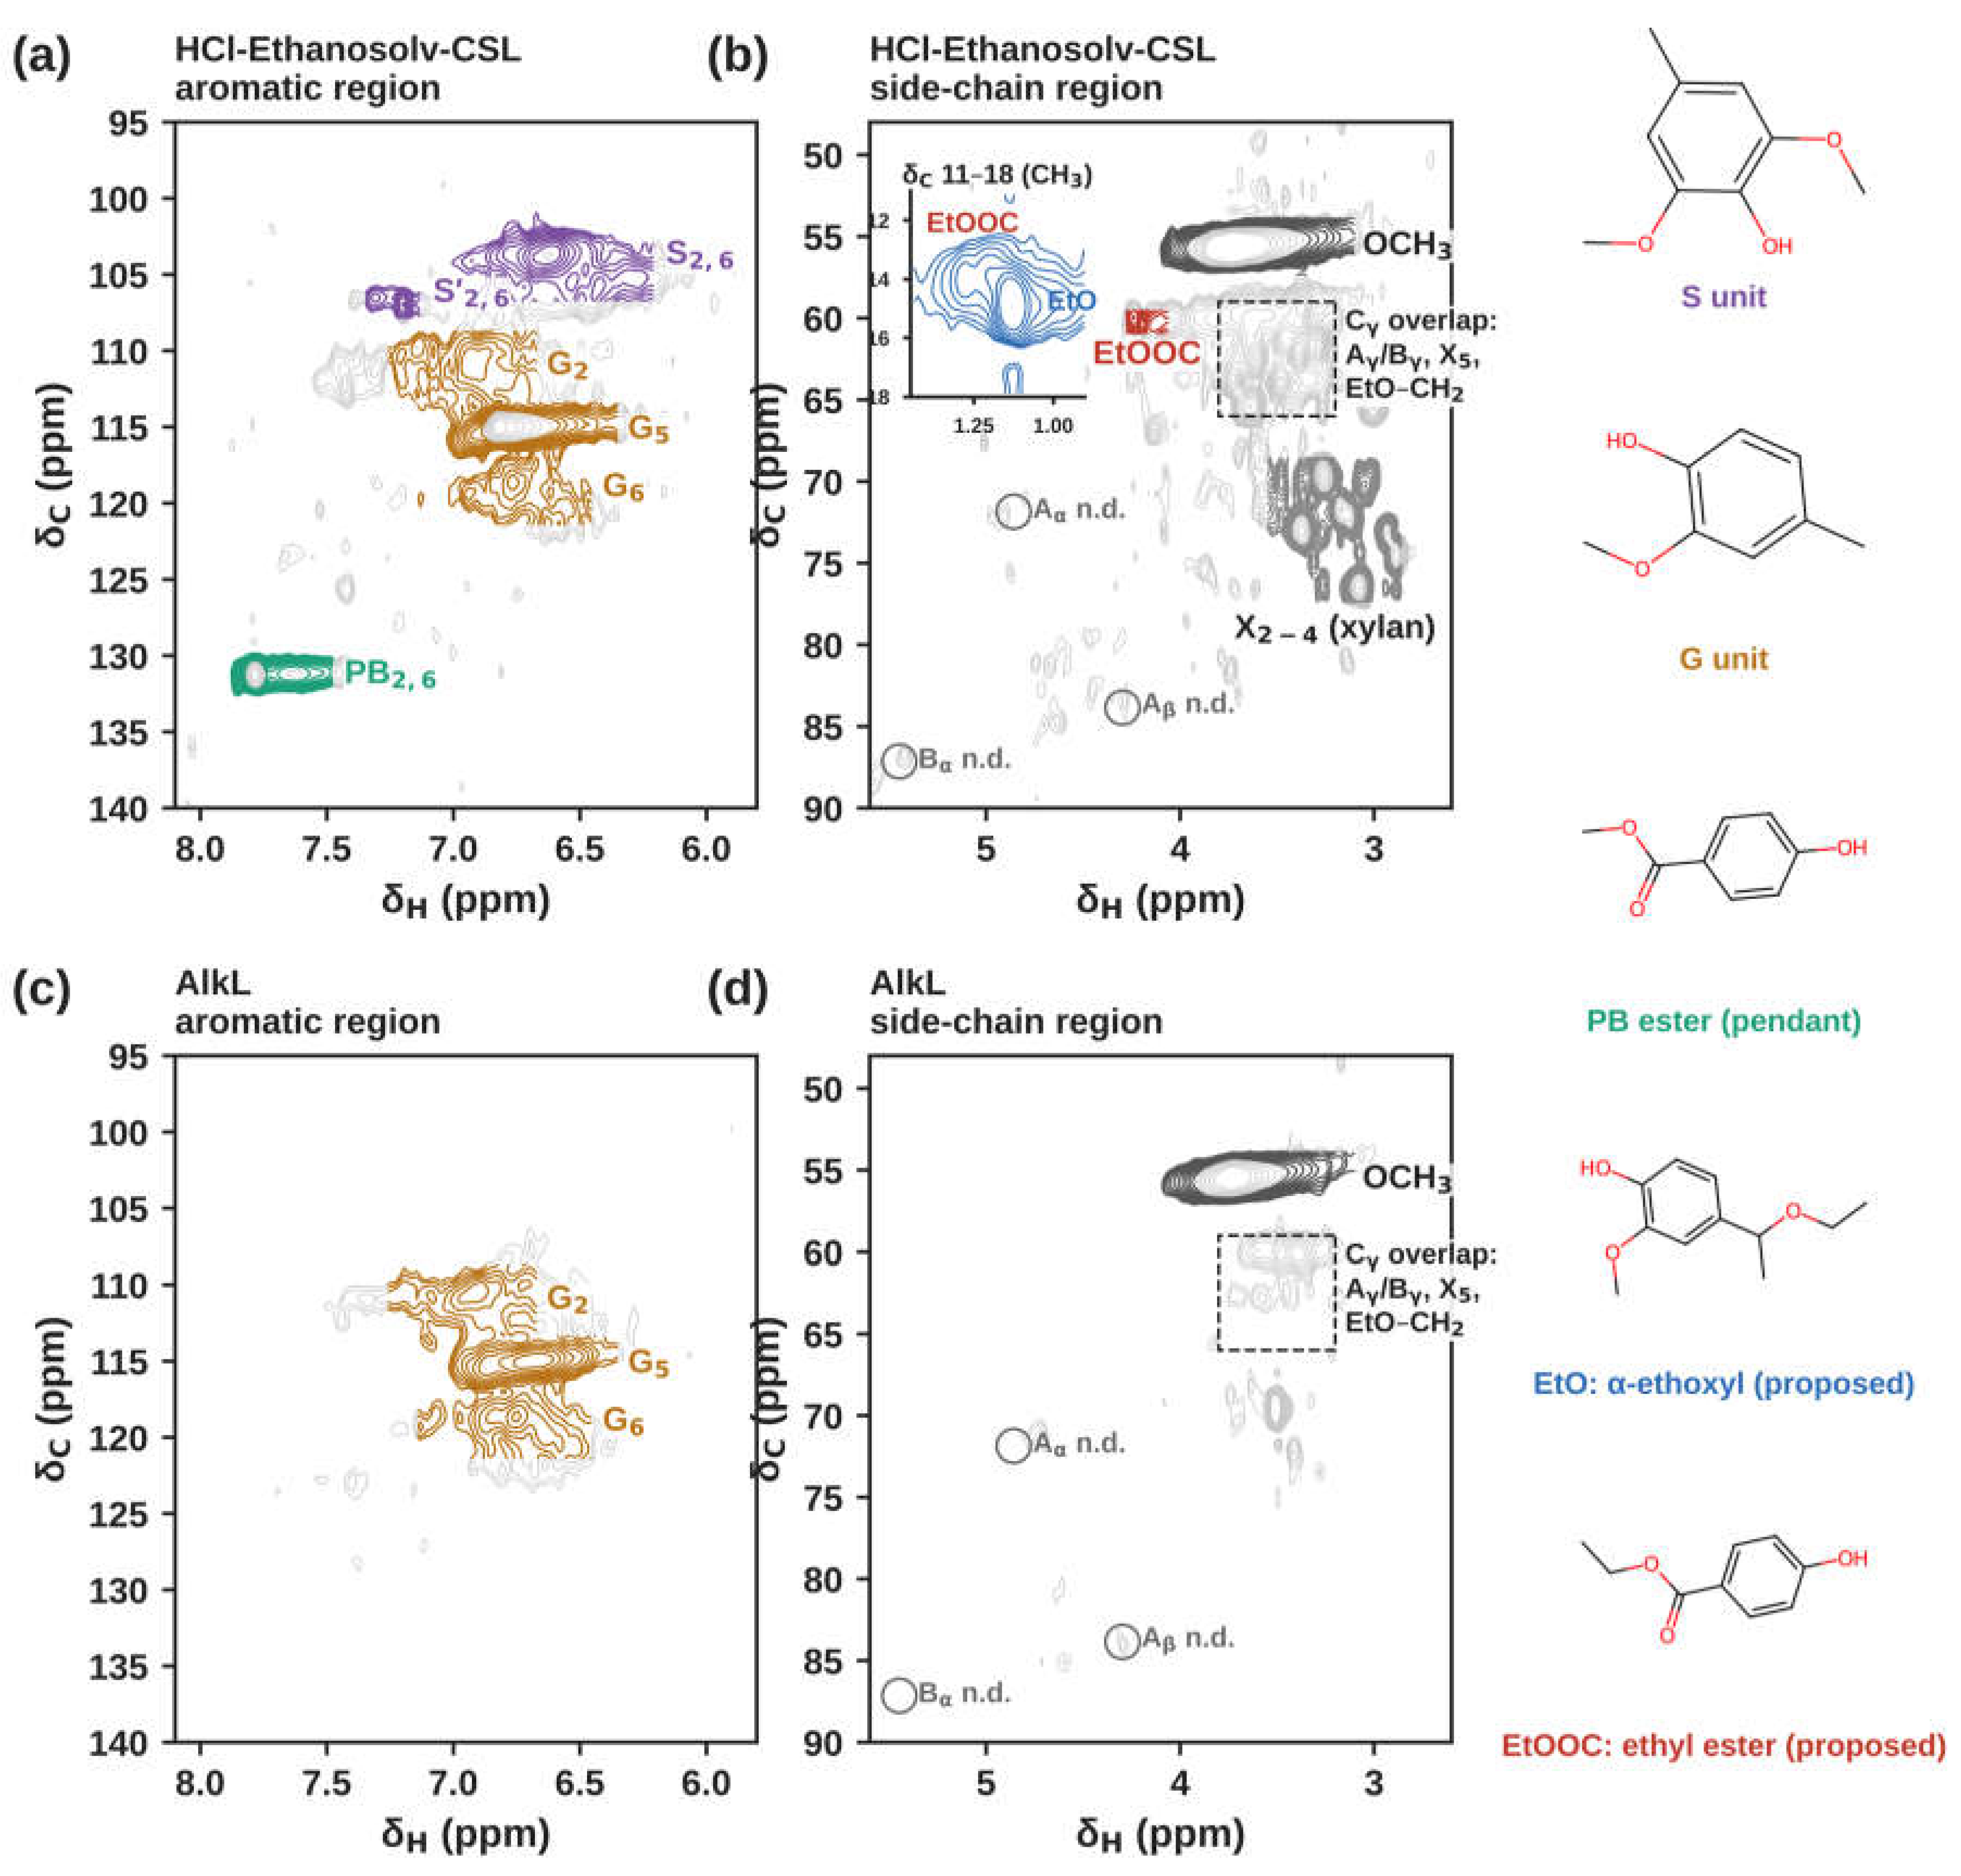
Figure 8.
(a) TGA and (b) DTG curves of HCl-Ethanosolv-CSL and AlkL. Shaded areas mark the three degradation stages.
Figure 8.
(a) TGA and (b) DTG curves of HCl-Ethanosolv-CSL and AlkL. Shaded areas mark the three degradation stages.
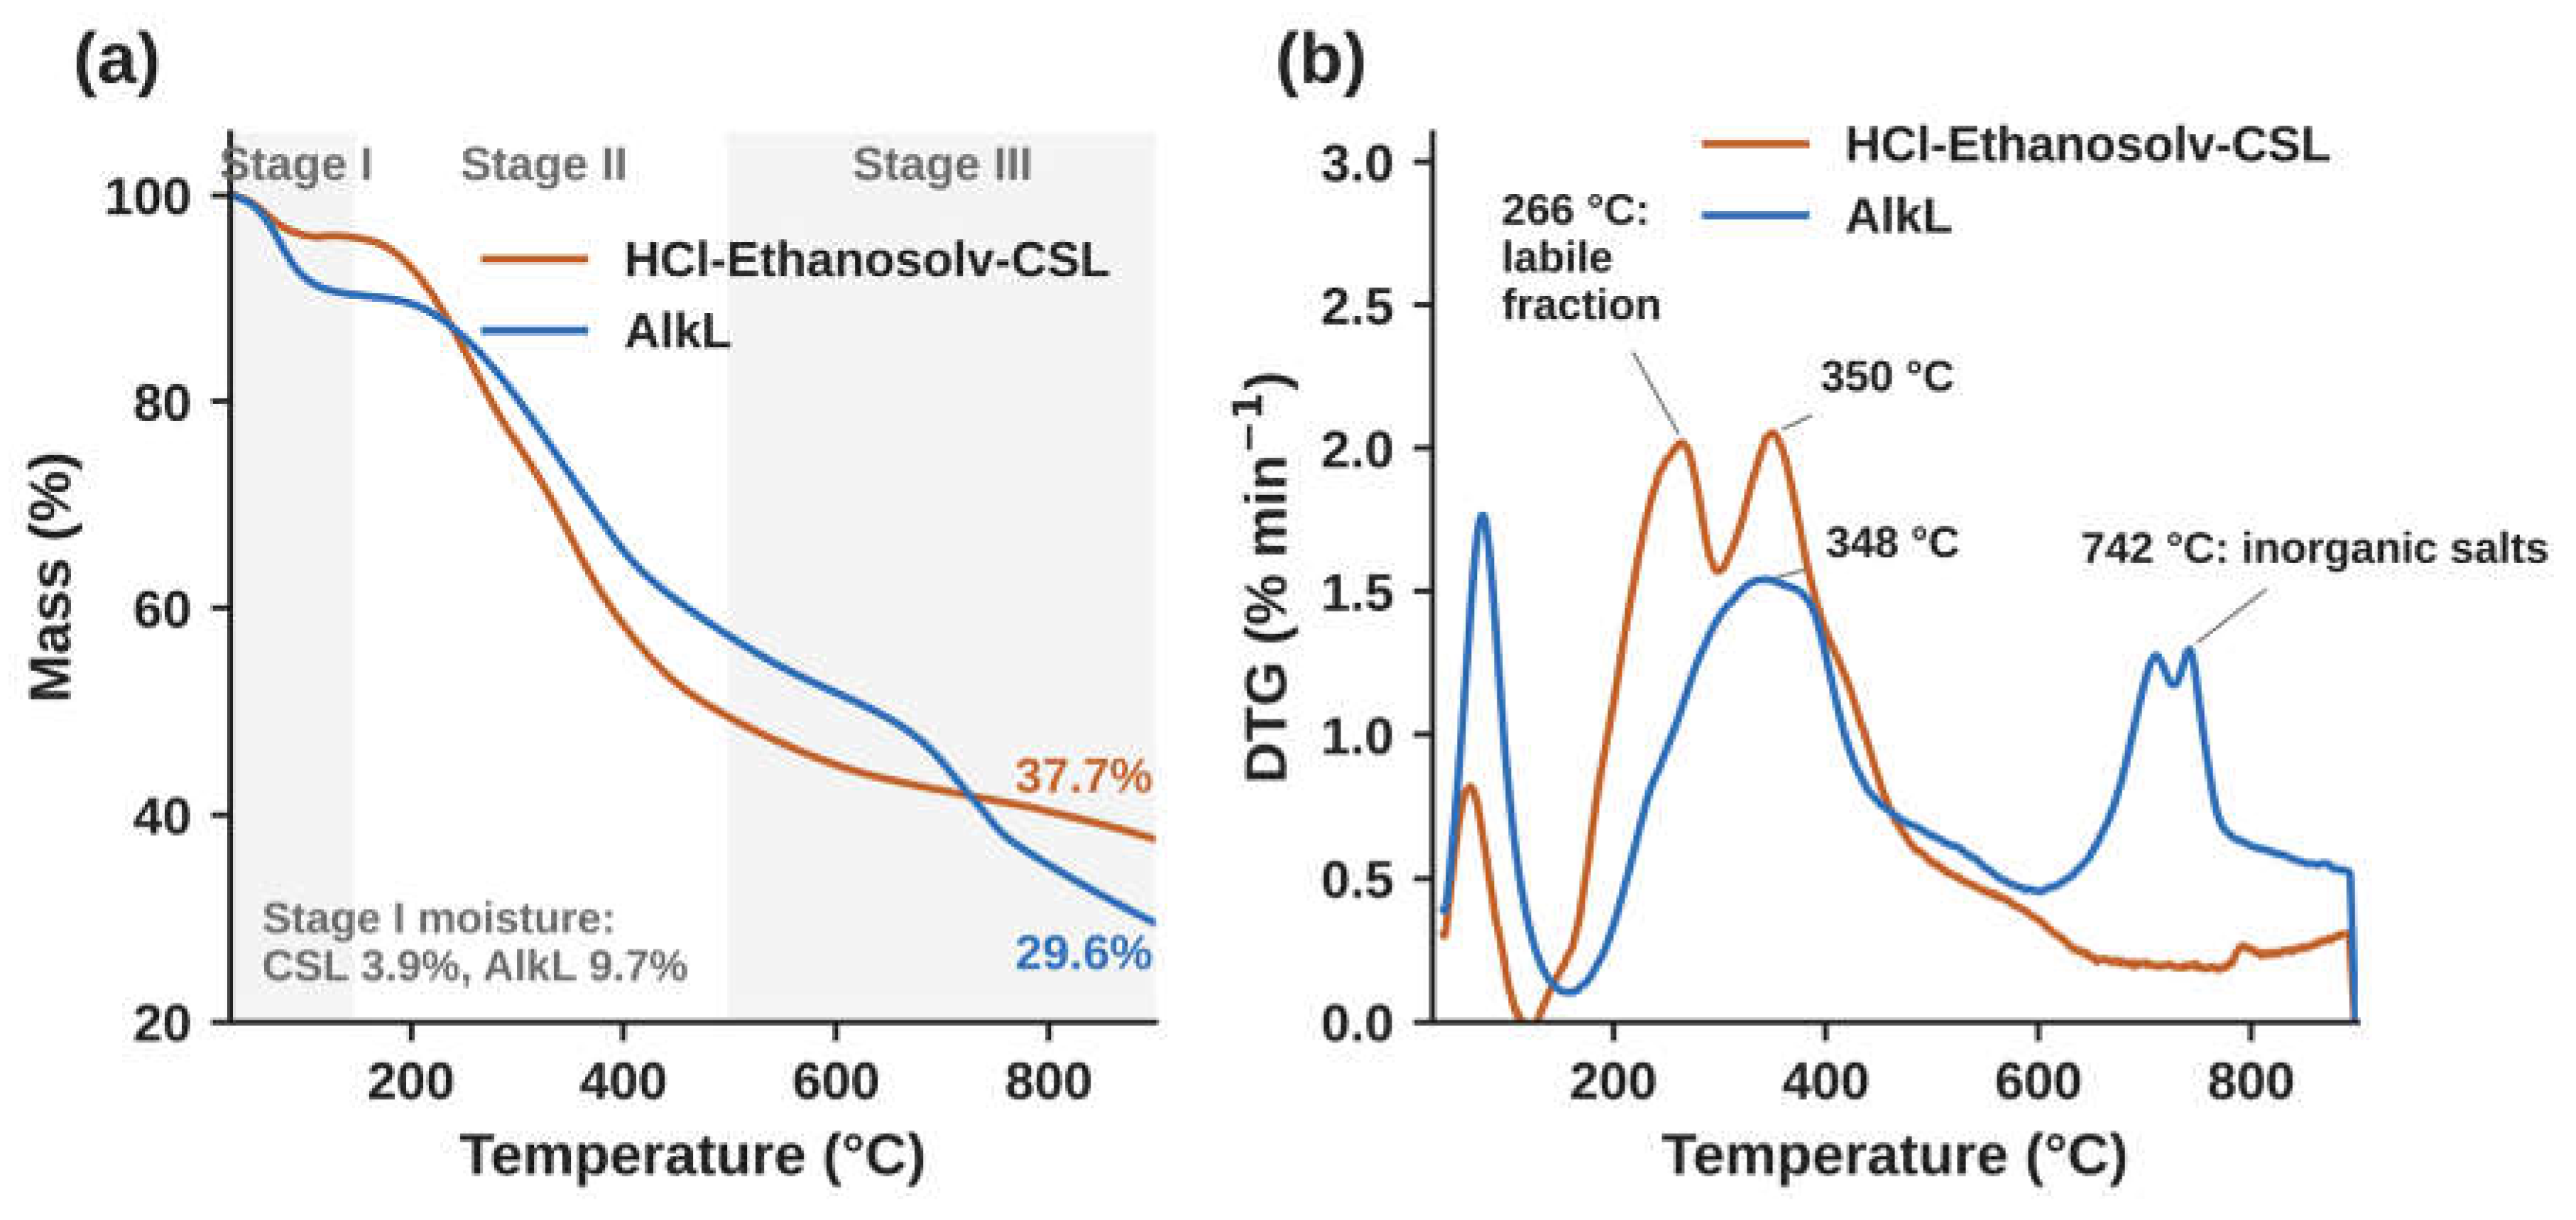
Figure 9.
GPC analysis of HCl-Ethanosolv-CSL and AlkL in DMF. (a) Calibration with narrow PS standards (three vials, seven peaks) and the broad PS standard. The dotted line shows the extrapolation of the calibration to earlier retention times, where HCl-Ethanosolv-CSL eluted. (b) Normalized molecular weight distributions of HCl-Ethanosolv-CSL (1 and 5 mg mL−1), AlkL (10 mg mL−1) and the broad PS standard. The grey band marks the calibrated range. (c) Proposed association of HCl-Ethanosolv-CSL in solution and its links to bioactivity (conceptual).
Figure 9.
GPC analysis of HCl-Ethanosolv-CSL and AlkL in DMF. (a) Calibration with narrow PS standards (three vials, seven peaks) and the broad PS standard. The dotted line shows the extrapolation of the calibration to earlier retention times, where HCl-Ethanosolv-CSL eluted. (b) Normalized molecular weight distributions of HCl-Ethanosolv-CSL (1 and 5 mg mL−1), AlkL (10 mg mL−1) and the broad PS standard. The grey band marks the calibrated range. (c) Proposed association of HCl-Ethanosolv-CSL in solution and its links to bioactivity (conceptual).
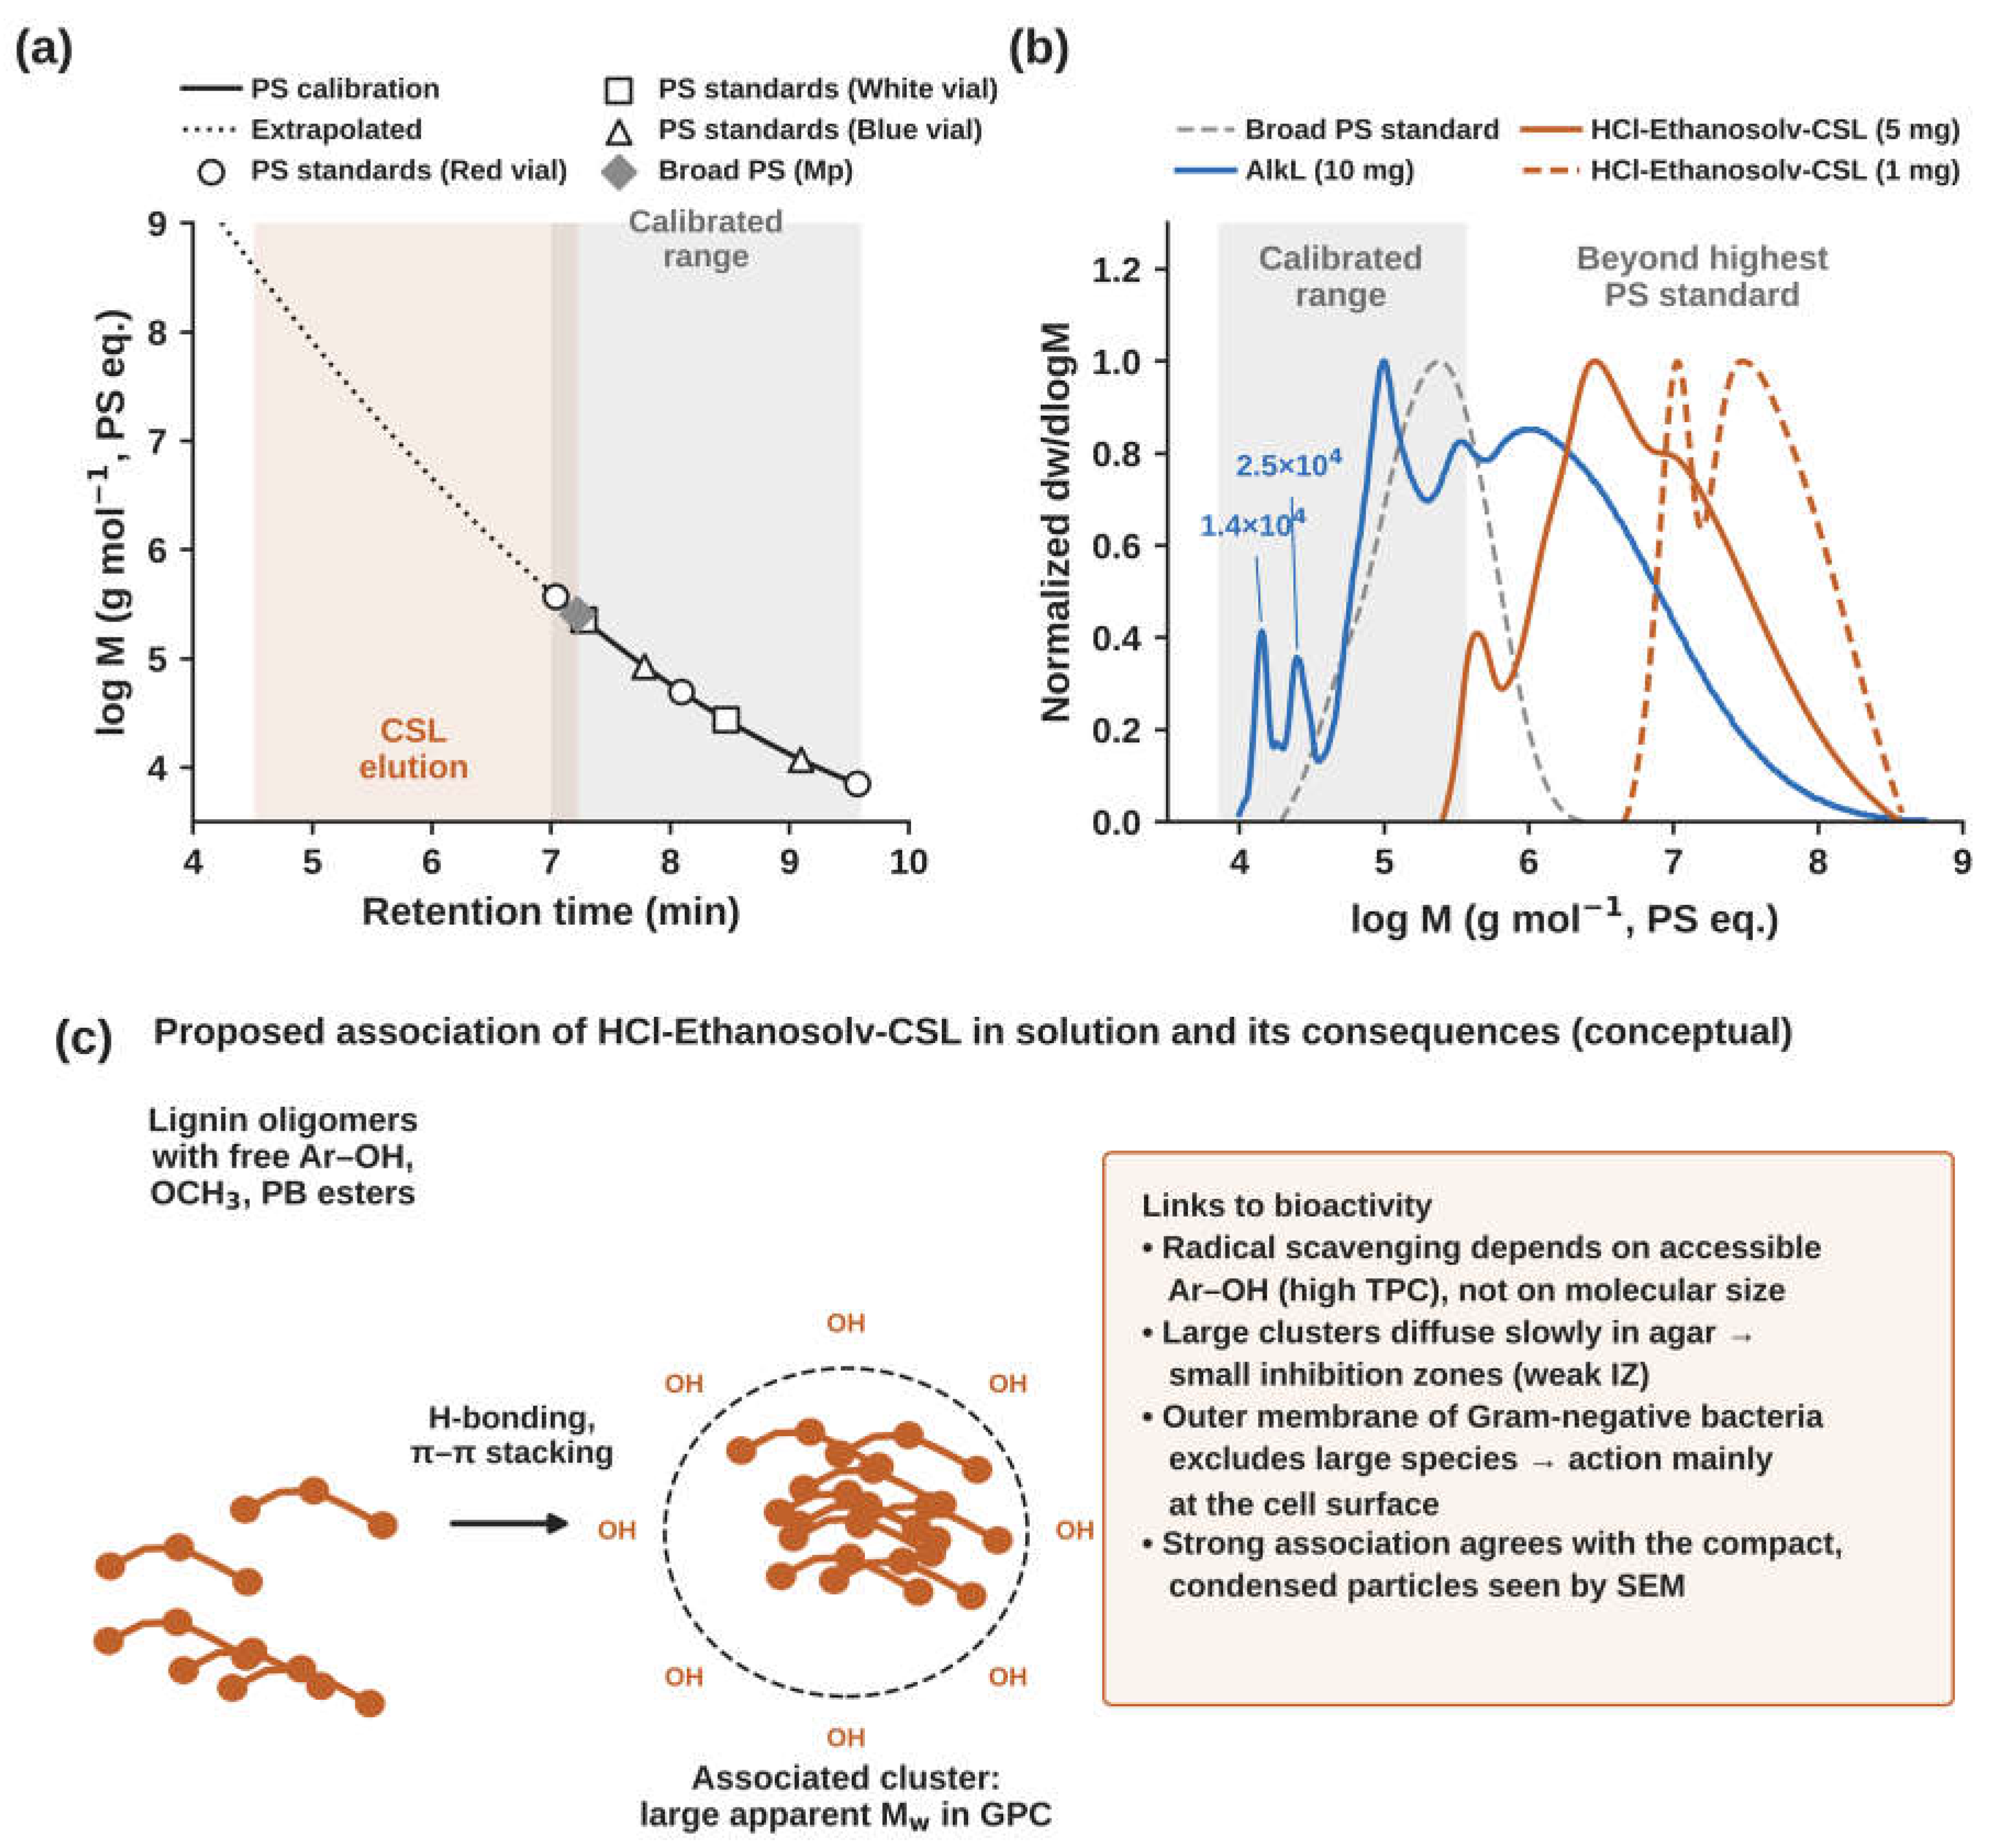
Figure 10.
(a) Total phenolic content of HCl-Ethanosolv-CSL and AlkL (mean ± SD, n = 4, open circles are replicates). (b) Proposed origin of the higher TPC: acid-catalyzed cleavage of β-O-4′ ether bonds releases units with free phenolic OH groups. The p-value is from a two-tailed t-test.
Figure 10.
(a) Total phenolic content of HCl-Ethanosolv-CSL and AlkL (mean ± SD, n = 4, open circles are replicates). (b) Proposed origin of the higher TPC: acid-catalyzed cleavage of β-O-4′ ether bonds releases units with free phenolic OH groups. The p-value is from a two-tailed t-test.
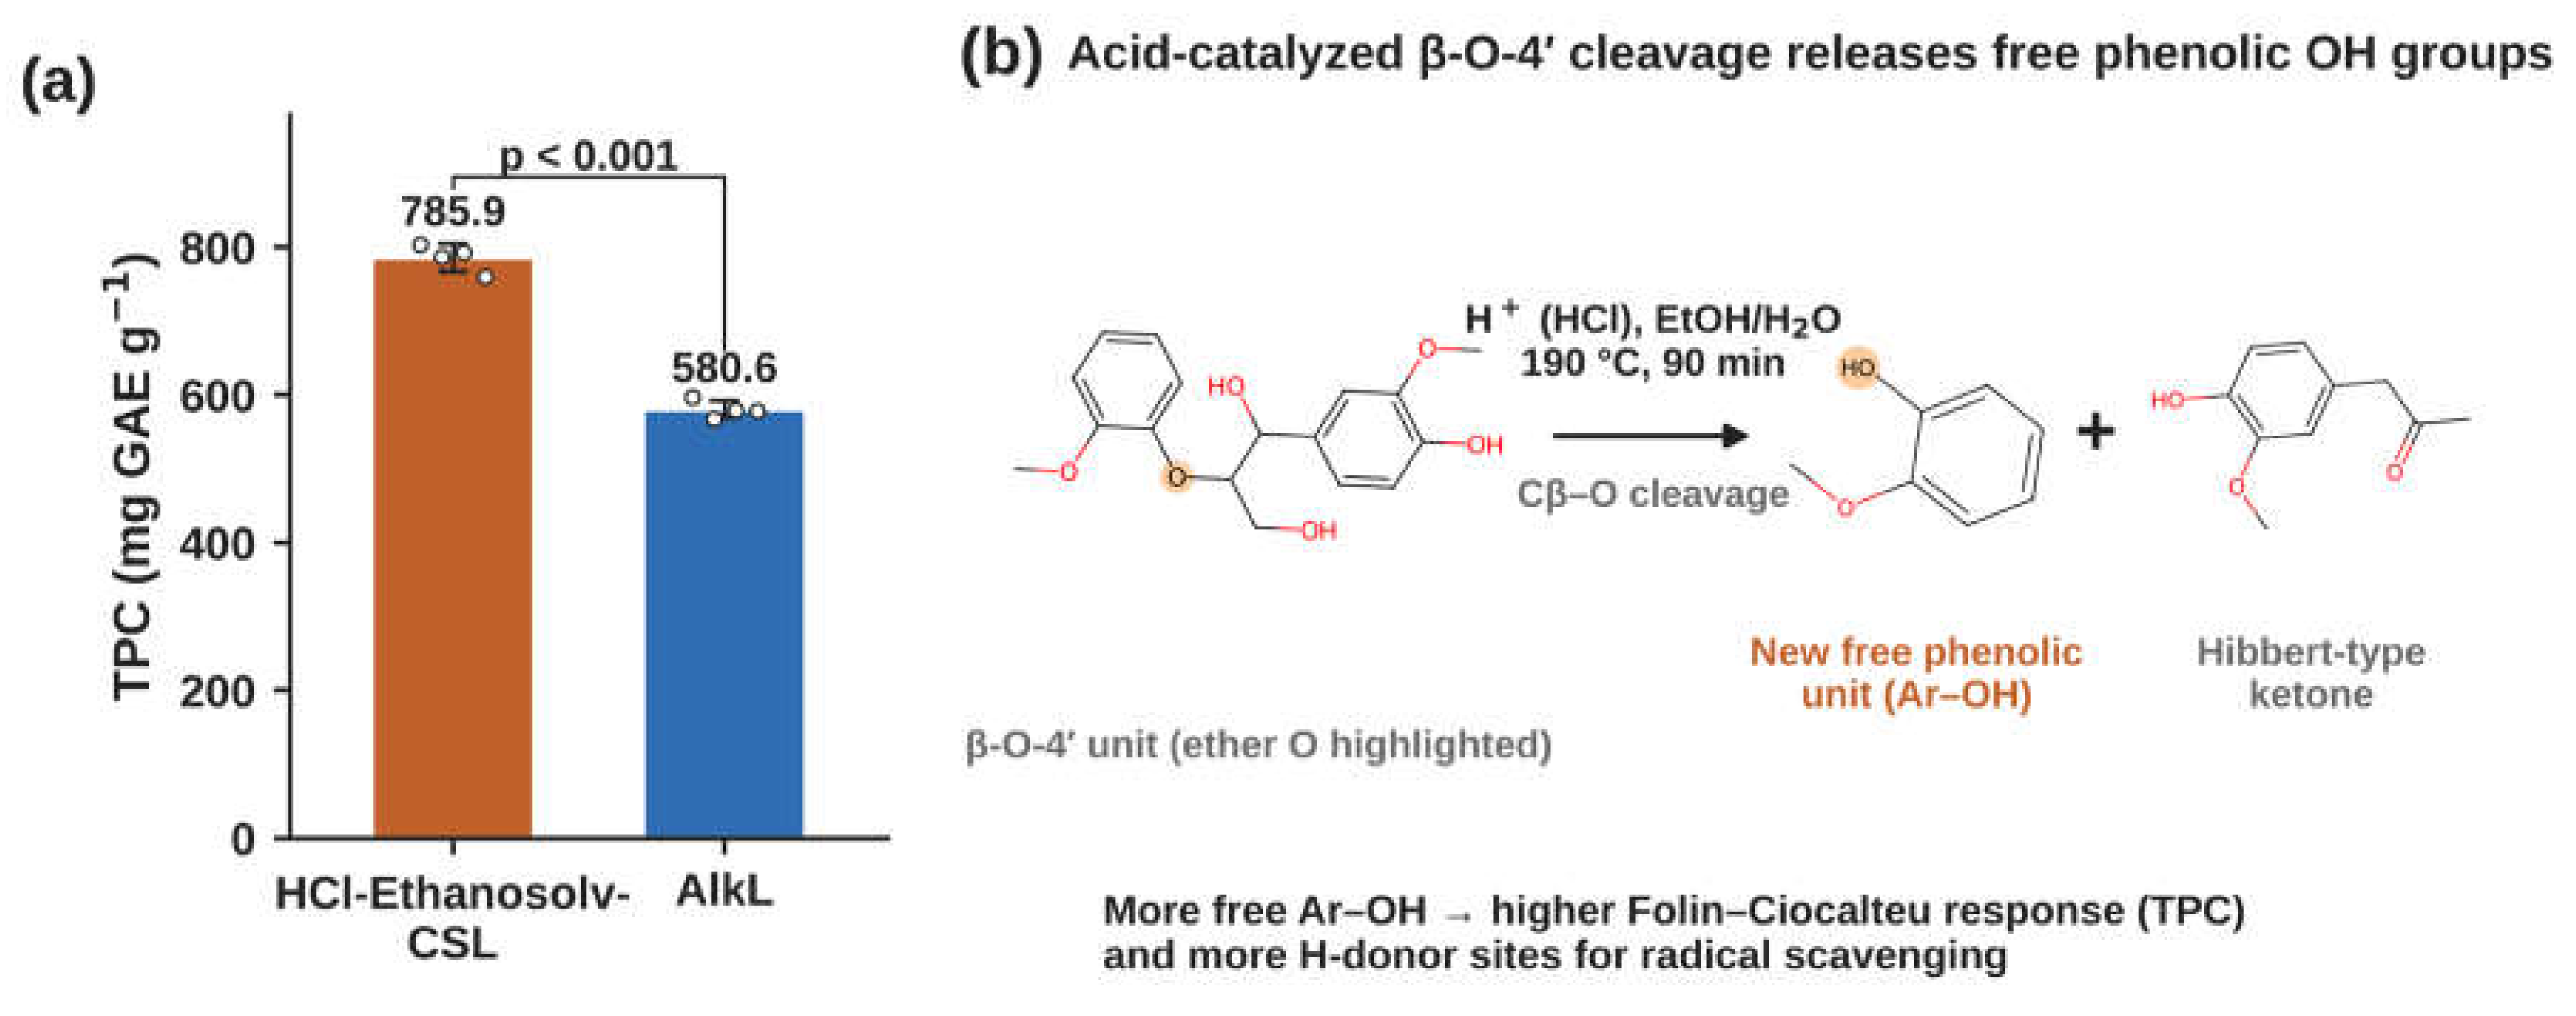
Figure 11.
Antioxidant activity. Dose–response curves for (a) ABTS and (b) DPPH radical scavenging by HCl-Ethanosolv-CSL, AlkL and ascorbic acid (mean ± SD), plotted against final in-well concentration. The dashed line marks 50% scavenging. (c) In-well IC50 values (mean ± SD). AlkL did not reach 50% DPPH scavenging within the tested range (open bar, > 39.2 µg mL−1). (d) Proposed mechanism: phenolic units donate a hydrogen atom (HAT) or an electron and then a proton (SET-PT). The resulting phenoxyl radical is stabilized by resonance and by ortho-methoxyl groups.
Figure 11.
Antioxidant activity. Dose–response curves for (a) ABTS and (b) DPPH radical scavenging by HCl-Ethanosolv-CSL, AlkL and ascorbic acid (mean ± SD), plotted against final in-well concentration. The dashed line marks 50% scavenging. (c) In-well IC50 values (mean ± SD). AlkL did not reach 50% DPPH scavenging within the tested range (open bar, > 39.2 µg mL−1). (d) Proposed mechanism: phenolic units donate a hydrogen atom (HAT) or an electron and then a proton (SET-PT). The resulting phenoxyl radical is stabilized by resonance and by ortho-methoxyl groups.
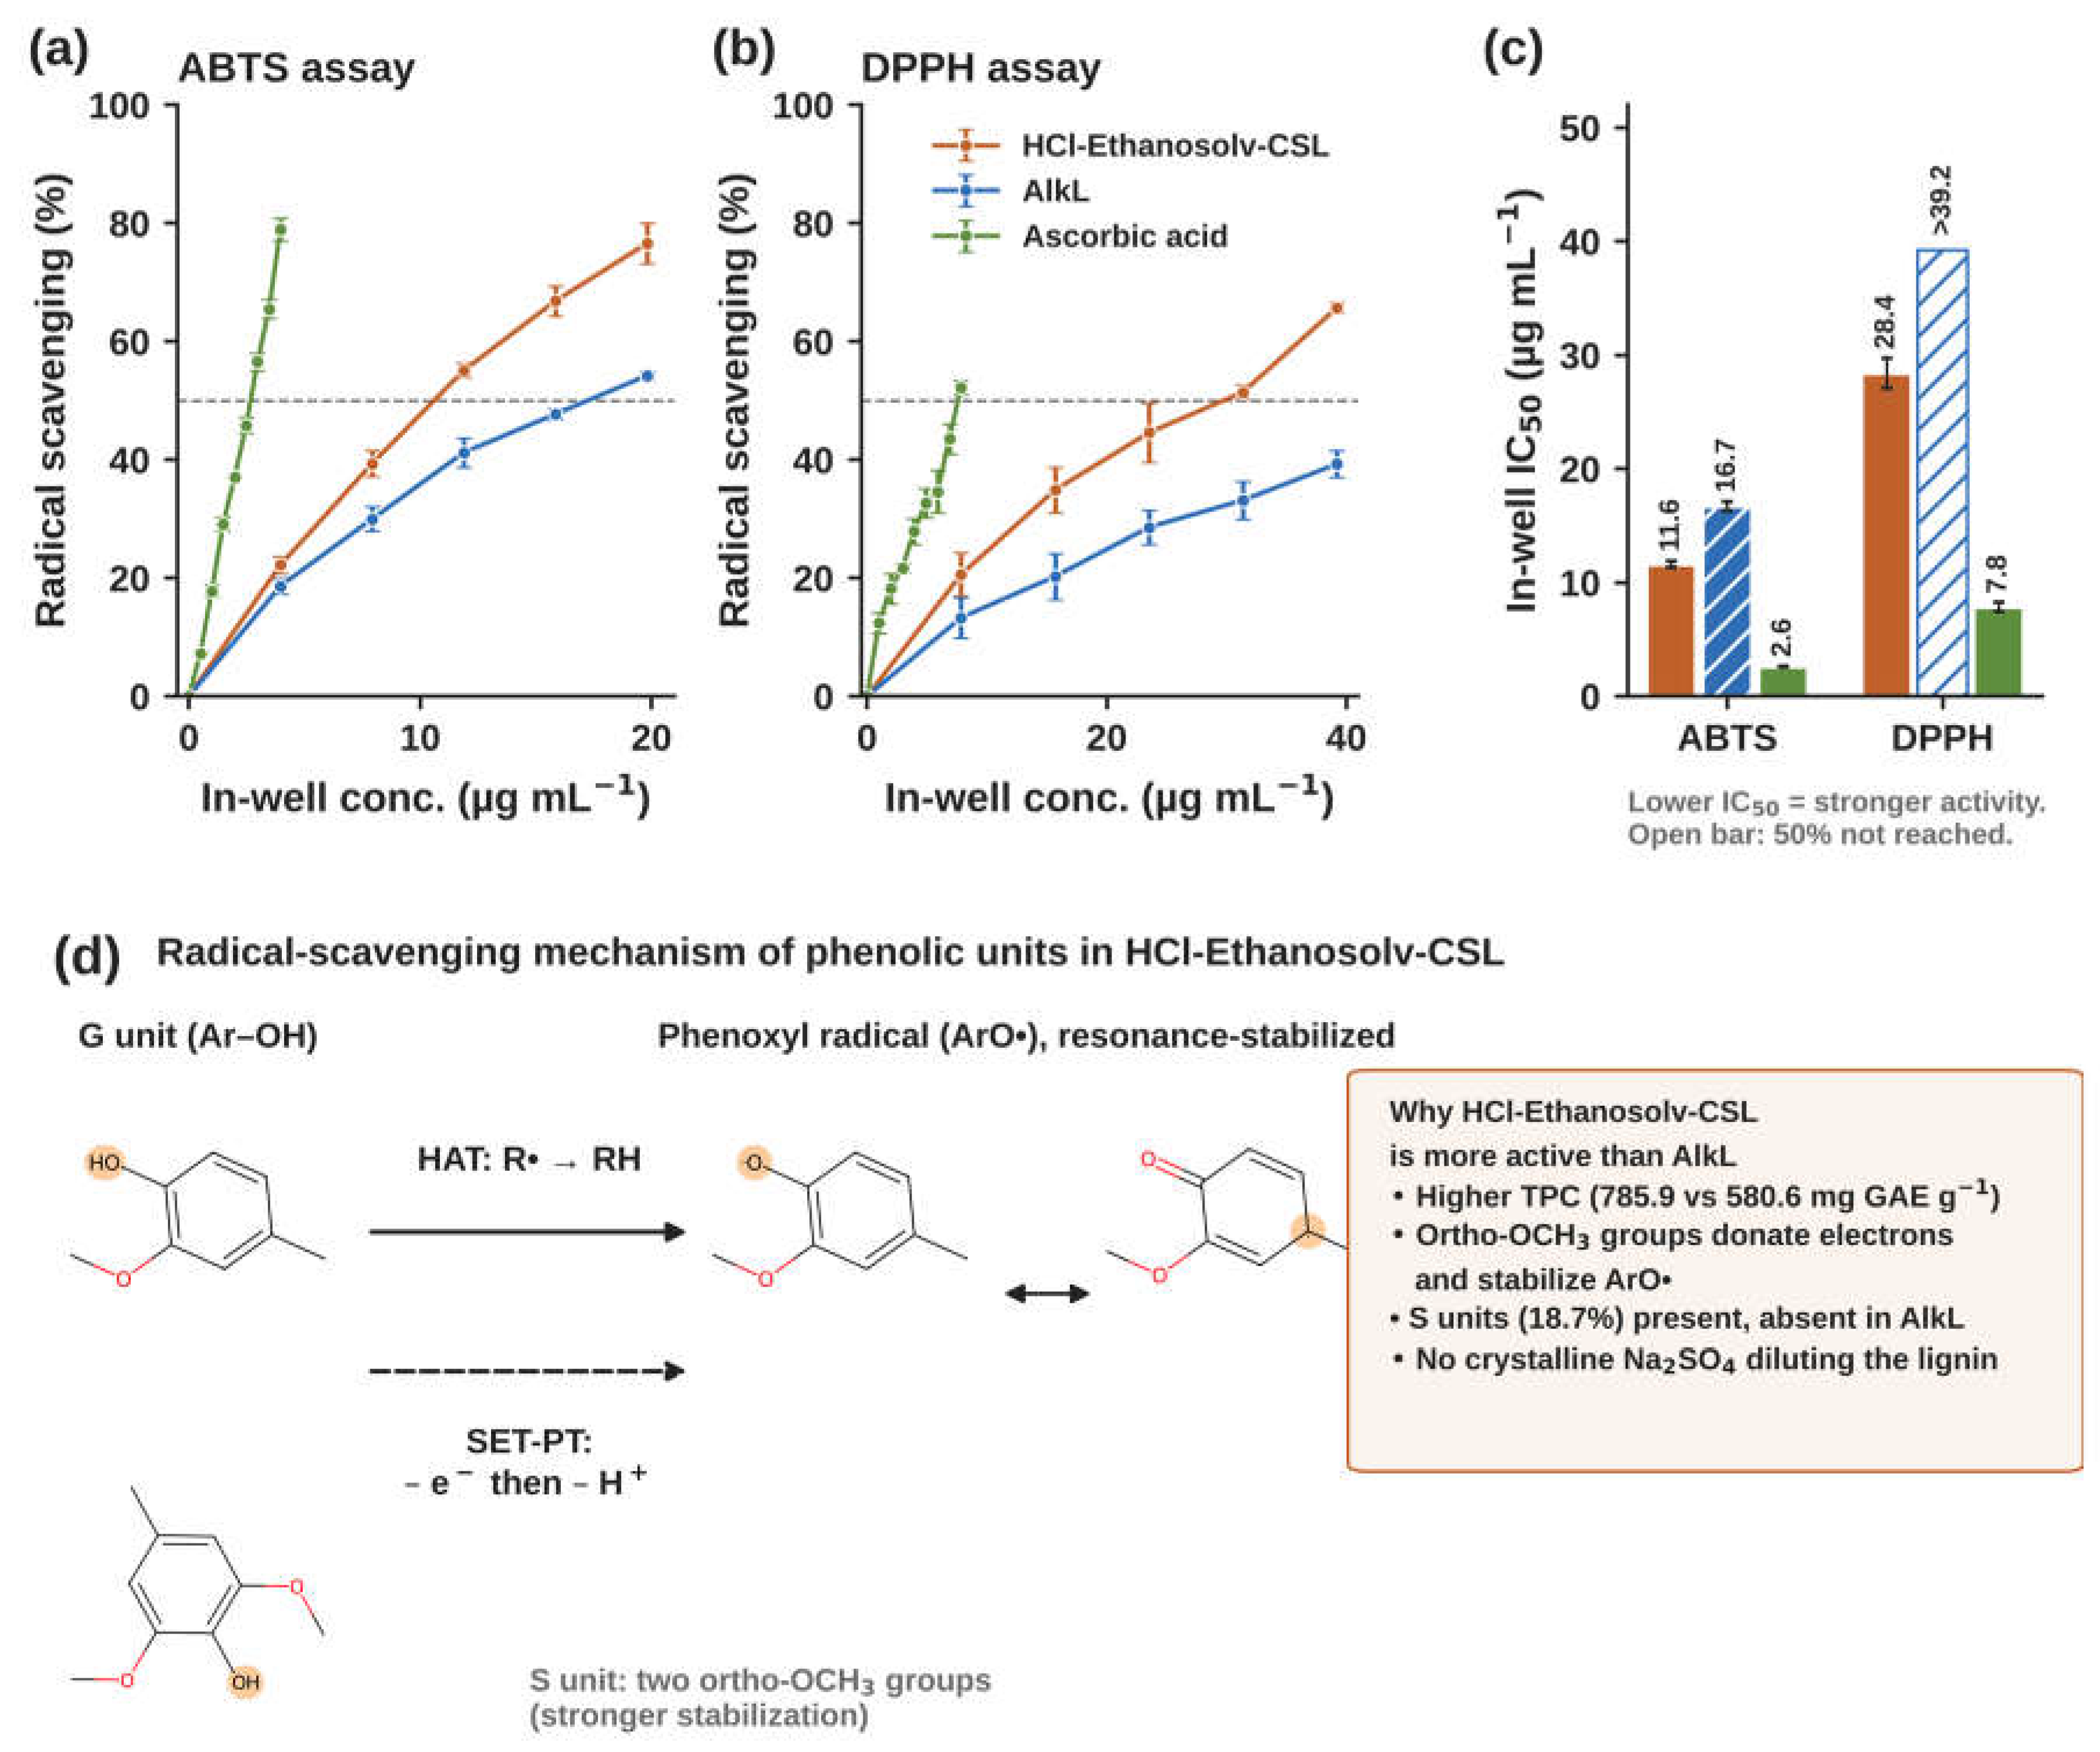
Figure 12.
Antibacterial activity. (a) Disc diffusion plates for HCl-Ethanosolv-CSL (top) and AlkL (bottom). (b) Inhibition zone index (mean ± SD, n = 3). The right axis shows the clear-zone width beyond the disc edge. Different letters within a strain indicate significant differences (Tukey, p < 0.05). (c) Proposed mode of action of HCl-Ethanosolv-CSL on Gram-positive bacteria.
Figure 12.
Antibacterial activity. (a) Disc diffusion plates for HCl-Ethanosolv-CSL (top) and AlkL (bottom). (b) Inhibition zone index (mean ± SD, n = 3). The right axis shows the clear-zone width beyond the disc edge. Different letters within a strain indicate significant differences (Tukey, p < 0.05). (c) Proposed mode of action of HCl-Ethanosolv-CSL on Gram-positive bacteria.
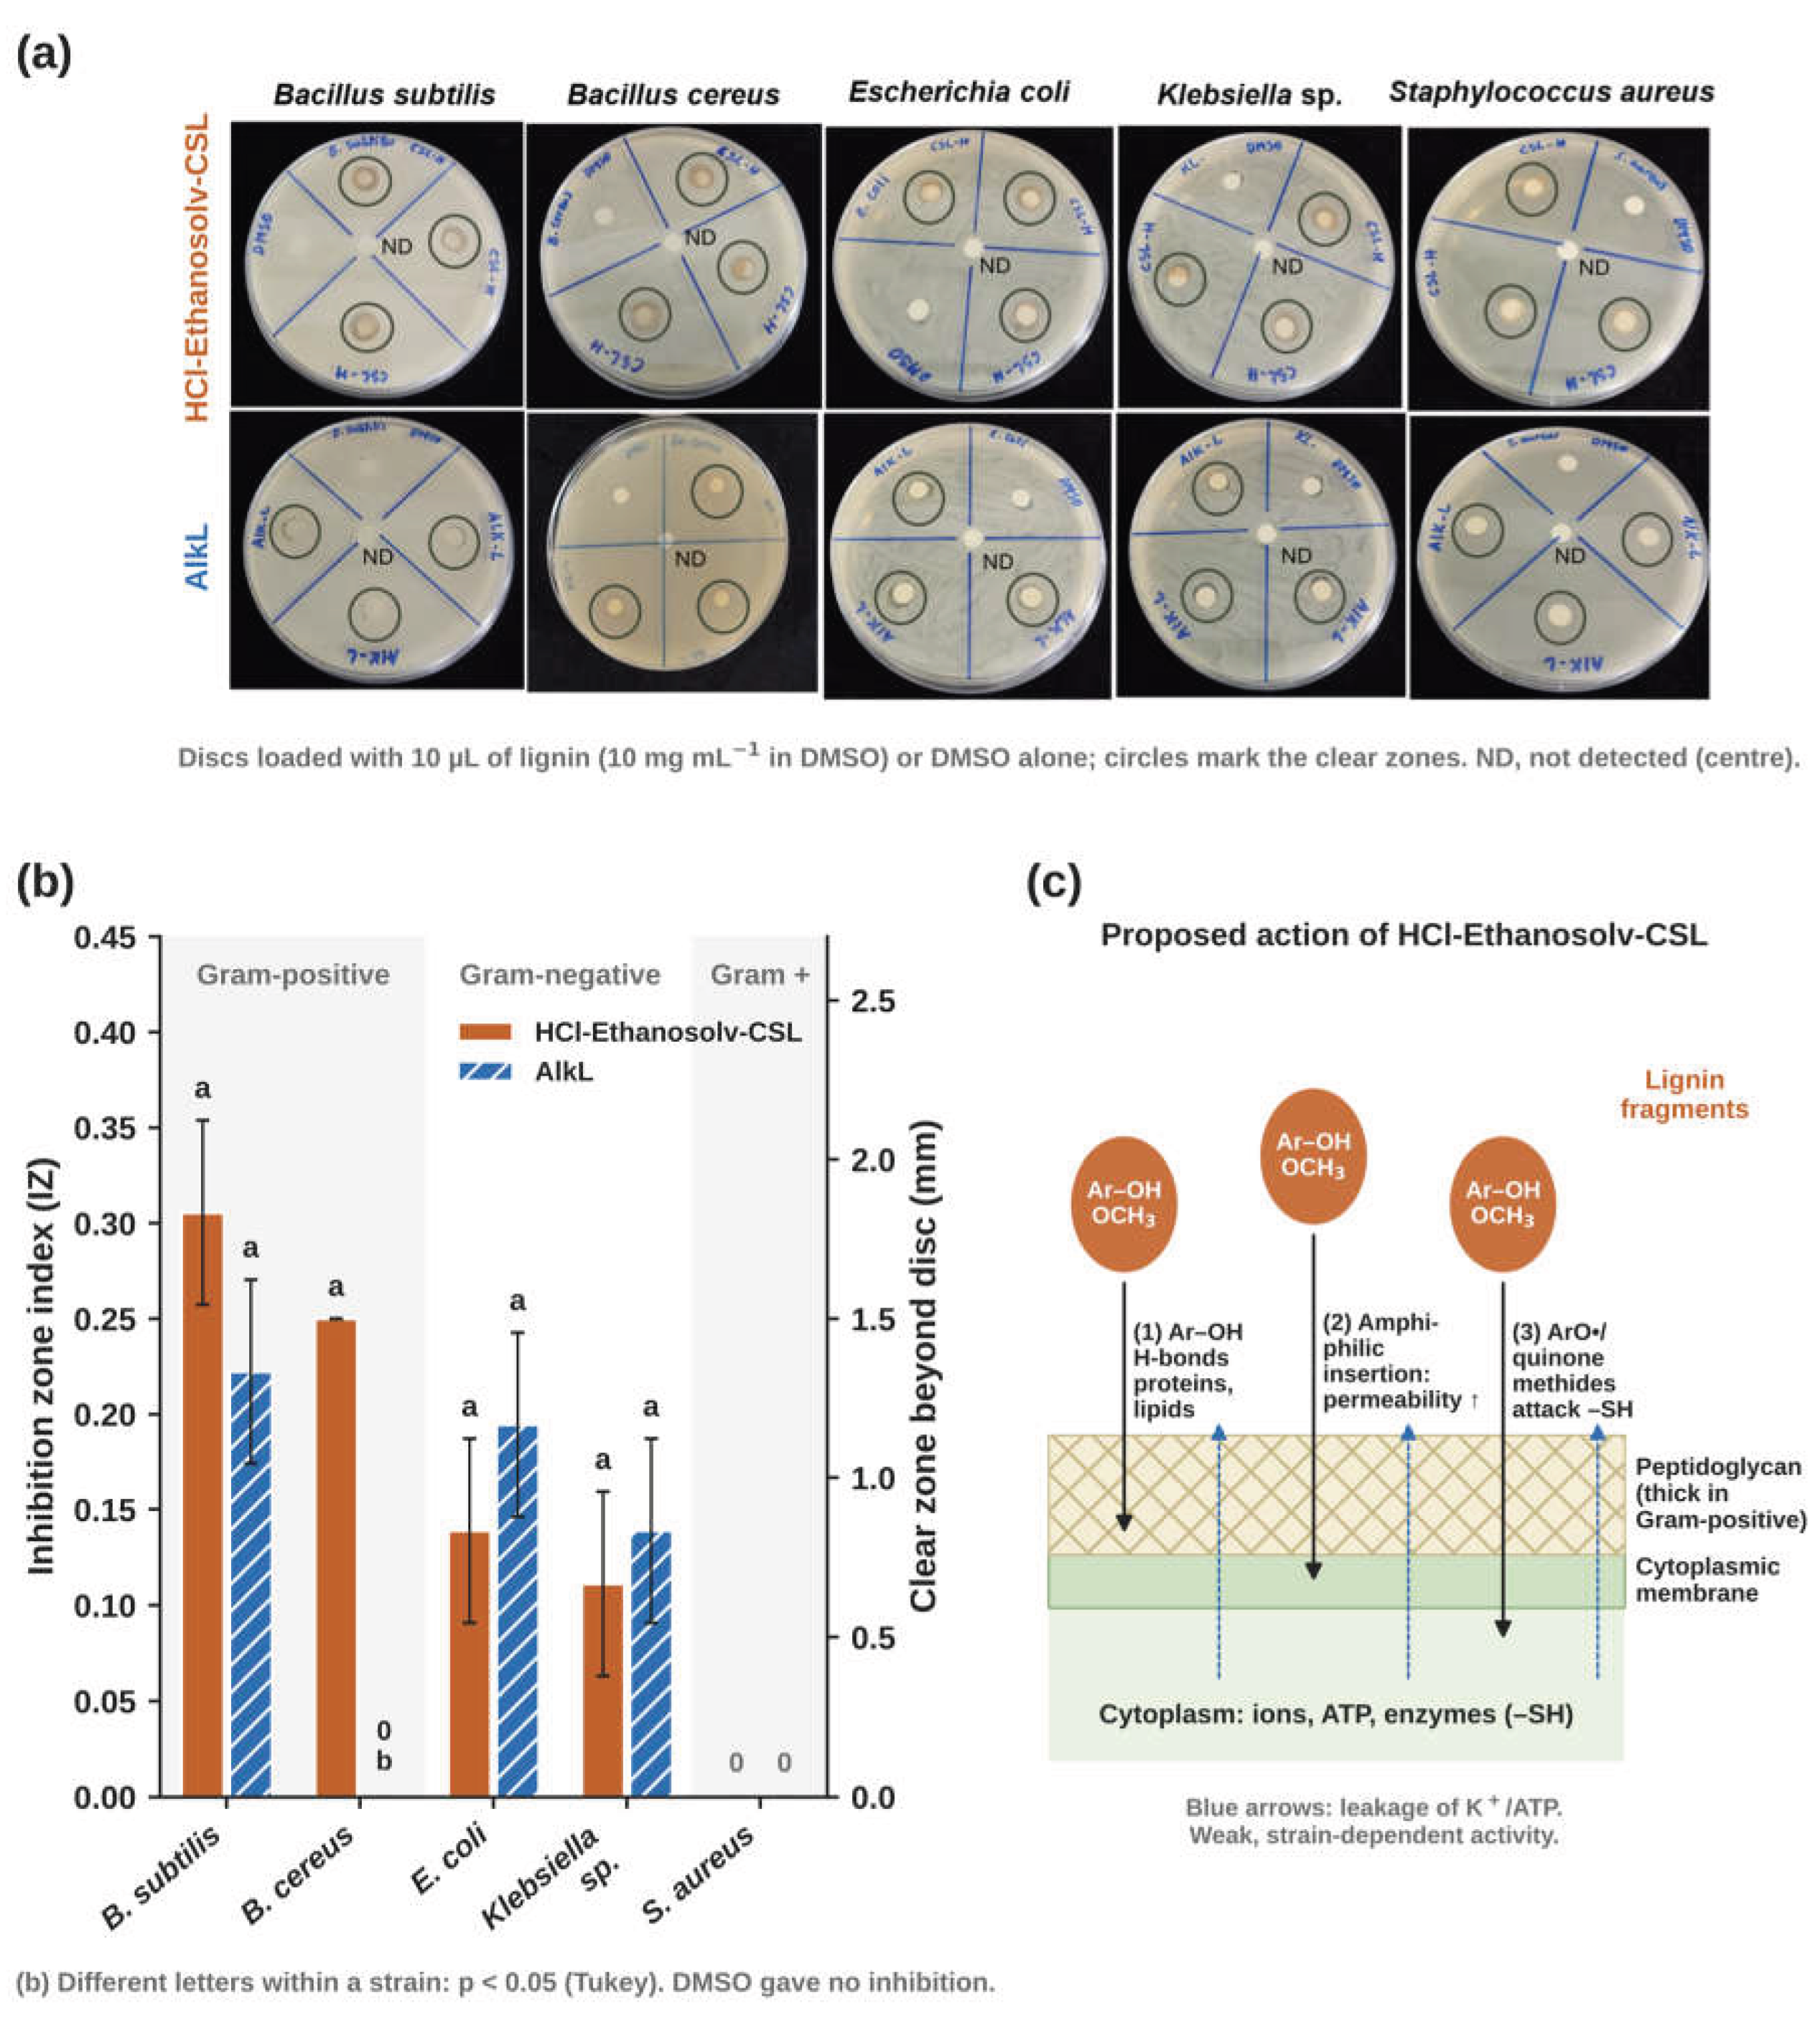
Figure 13.
Flowchart of coconut shell lignin extraction process with HCl.
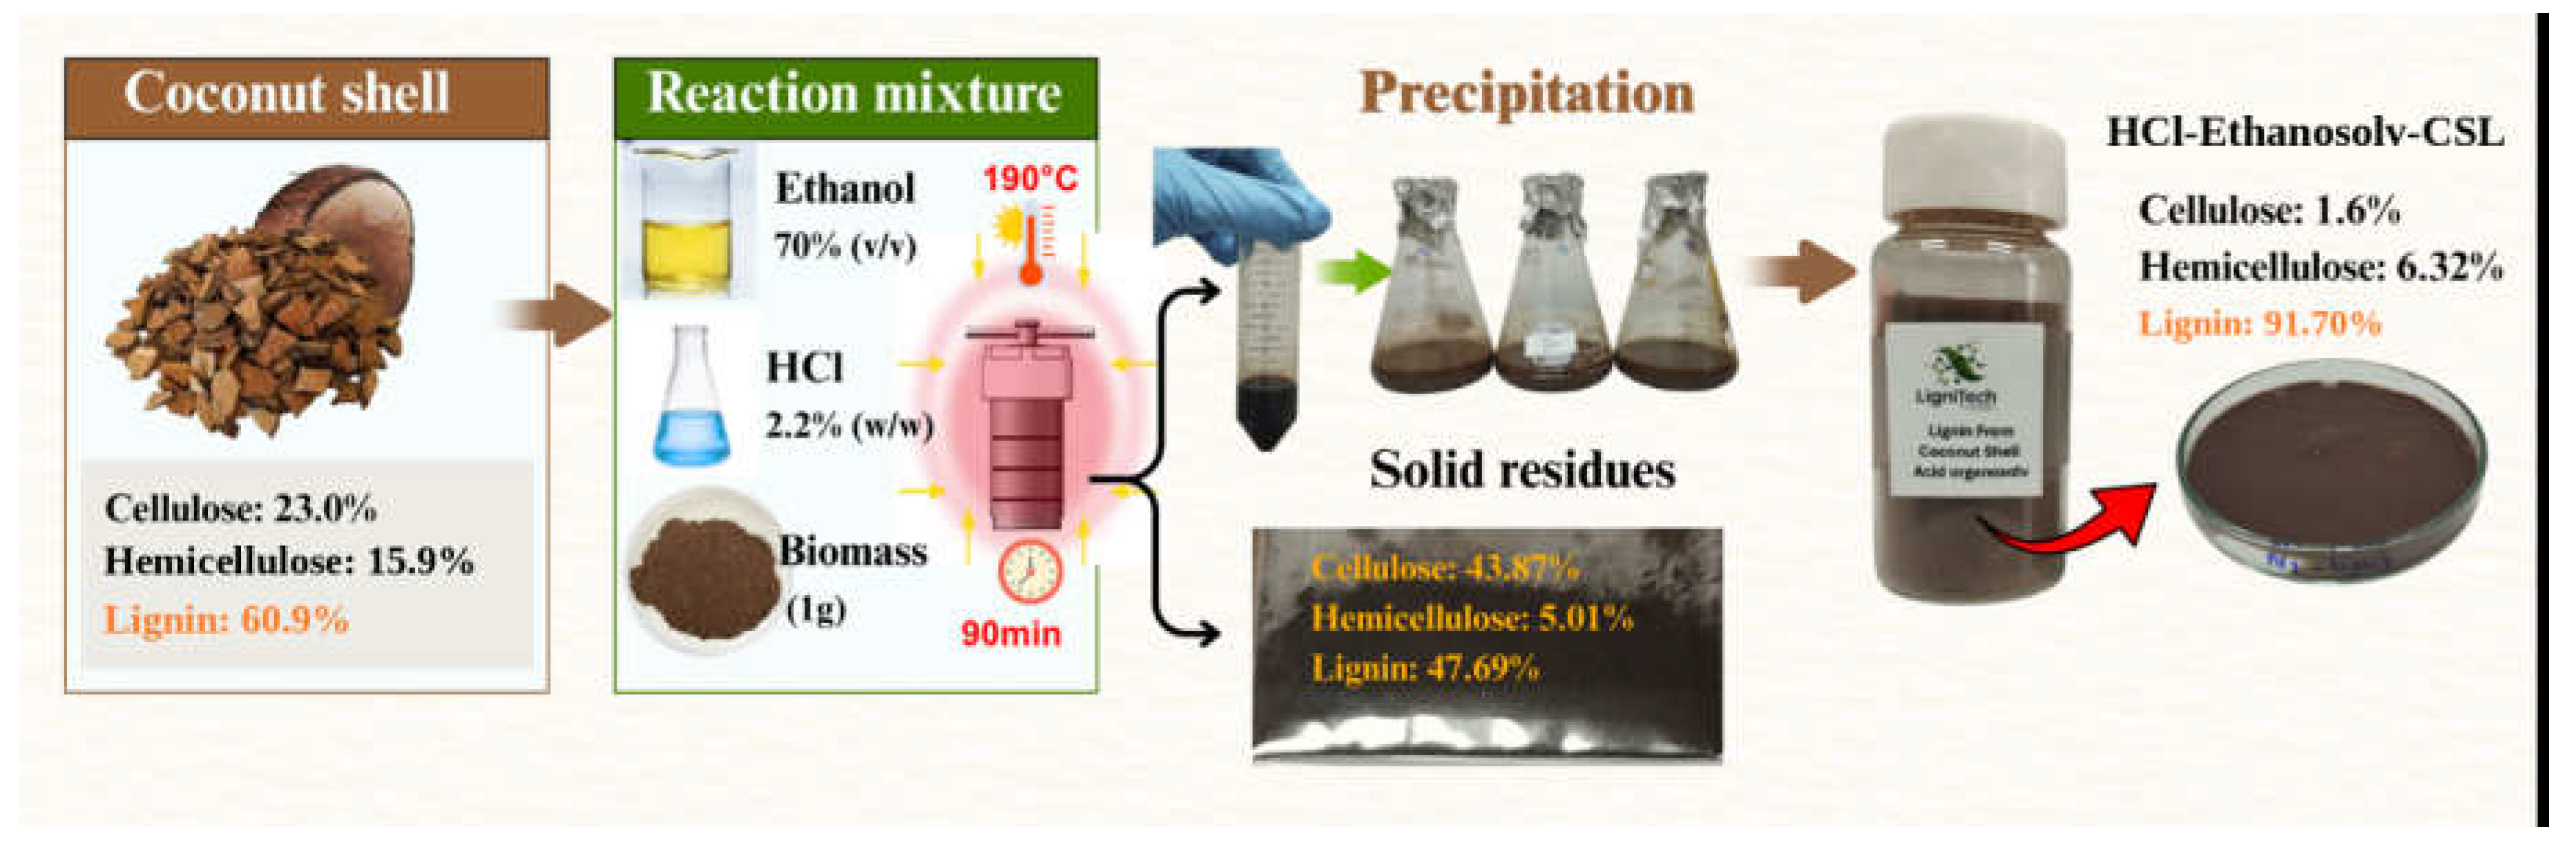

Table 1.
Factors and coded levels in Box-Behnken Design for coconut shell lignin recovery.
| Variables | Coded Factor Level | ||
|---|---|---|---|
| Low (-1) | Center (0) | High (+1) | |
| Ethanol concentration, XEt, (%, v/v) | 50 | 70 | 90 |
| HCl concentration, XAc, (%, w/w) | 0.4 | 2.2 | 4 |
| Temperature, XTp, (℃) | 100 | 145 | 190 |
| Time, XTm, (min) | 15 | 52.5 | 90 |
Table 2.
Regression coefficients of the second-order polynomial model (coded factors).
| Source (Coconut Shell) | Response: lignin yield (g/g) | |||
|---|---|---|---|---|
| Coefficient | Std Error | t Ratio | p Value | |
| Model | F = 18.01 | <.0001* | ||
| Constant (A0) | 0.042600 | 0.007348 | 5.80 | |
| Ethanol concentration (XEt) | 0.008833 | 0.004743 | 1.86 | 0.0837 |
| HCl concentration (XAc) | 0.0194167 | 0.004743 | 4.09 | 0.0011* |
| Temperature (XTp) | 0.0446667 | 0.004743 | 9.42 | <.0001* |
| Time (XTm) | 0.0404167 | 0.004743 | 8.52 | <.0001* |
| XEt×XAc | 0.00725 | 0.008215 | 0.88 | 0.3924 |
| XEt×XTp | 0.01875 | 0.008215 | 2.28 | 0.0386* |
| XAc×XTp | 0.0365 | 0.008215 | 4.44 | 0.0006* |
| XEt×XTm | 0.01 | 0.008215 | 1.22 | 0.2436 |
| XAc×XTm | 0.0295 | 0.008215 | 3.59 | 0.0030* |
| XTp×XTm | 0.03975 | 0.008215 | 4.84 | 0.0003* |
| XEt² | 0.001325 | 0.006451 | 0.21 | 0.8402 |
| XAc² | -0.00105 | 0.006451 | -0.16 | 0.8730 |
| XTp² | 0.016575 | 0.006451 | 2.57 | 0.0223* |
| XTm² | 0.0027 | 0.006451 | 0.42 | 0.6819 |
Table 3.
Analysis of variance (ANOVA) for the lignin yield model.
| Source | DF | Sum of Squares | Mean square | F-Ratio | P-value | |
|---|---|---|---|---|---|---|
| Model | 14 | 0.068061 | 0.004861 | 18.01 | <0.0001* | |
| Error | 14 | 0.003780 | 0.000270 | |||
| Lack of fit | 10 | 0.00376842 | 0.000377 | 134.5863 | 0.0001* | |
| Pure error | 4 | 0.0000112 | 0.0000028 | |||
| Total | 28 | |||||
| R2=0.95 R2adj=0.89 | ||||||
*Significance at p < 0.05.
Table 4.
Chemical composition (%, dry weight) of coconut shell, HCl-Ethanosolv-CSL and the solid residue after extraction (mean of three replicates).
Table 4.
Chemical composition (%, dry weight) of coconut shell, HCl-Ethanosolv-CSL and the solid residue after extraction (mean of three replicates).
| Samples | %ASL | %AIL | %Cellulose | %Hemicellulose | %Ash | Total (%) |
|---|---|---|---|---|---|---|
| Coconut shell biomass | 4.09 | 56.82 | 22.97 | 15.92 | 0.18 | 99.99 |
| HCl-Ethanosolv-CSL | 4.07 | 87.63 | 1.6 | 6.32 | 0.35 | 99.97 |
| Solid residue (CS-SR) | 4.08 | 43.62 | 43.87 | 5.01 | 0.32 | 96.89 |
Table 5.
Assignment of 13C NMR signals of HCl-Ethanosolv-CSL and AlkL.
| Assignment | 13C chemical shift (ppm) | |
|---|---|---|
| HCl-Ethanosolv-CSL | AlkL | |
| CAromatic in non-etherified guaiacyl units (G) | ND | ND |
| CAromatic in ρ-hydroxybenzoate (PB) | 132 | ND |
| CAromatic in esterified p-coumaric acid units | ND | ND |
| CAromatic in guaiacyl units (G2) | ND | 110.8 |
| CAromatic in guaiacyl units (G5) | 115.6-116.5 | 115.5-116.2 |
| CAromatic in guaiacyl units (G6) | ND | 119.5 |
| CAromatic in syringyl units (S) | 103.9 | ND |
| CAromatic in methoxyl group (OCH3) | 56 | 56 |
| DMSO-d6 (solvent) | 40 | 40 |
| Aliphatic side chains | <40 | <40 |
*Guaiacyl unit (G), Syringyl unit (S), and p-hydroxyphenyl unit (H). ND: Not detected.
Table 6.
Relative abundance of interunit linkages and aromatic units in HCl-Ethanosolv-CSL, AlkL and other coconut lignins.
Table 6.
Relative abundance of interunit linkages and aromatic units in HCl-Ethanosolv-CSL, AlkL and other coconut lignins.
| Samples | % H | %G | %S | %PB | S/G | Reference |
|---|---|---|---|---|---|---|
| AlkL | ND | 100 | ND | ND | - | Current study |
| HCl-Ethanosolv-CSL | 0 | 81.30 | 18.69 | 10.21 | 0.23 | Current study |
| Coconut coir lignin (dioxane–water, 9:1, v/v) | 4 | 78 | 18 | 13 | 0.23 | [5] |
| Coconut shell lignin ( [DMBA][HSO4]) | - | - | - | - | 1.50 | [3] |
| MWL (1,4-dioxane: water; 96:4, v/v) | - | - | - | - | 0.55 | [40] |
| DES4−130 lignin | - | - | - | - | 0.64 | [40] |
PB is given as % of S + G. ND, not detected.
Table 7.
Apparent molecular weights (PS-equivalent) of HCl-Ethanosolv-CSL, AlkL and the broad PS standard determined by GPC in DMF.
Table 7.
Apparent molecular weights (PS-equivalent) of HCl-Ethanosolv-CSL, AlkL and the broad PS standard determined by GPC in DMF.
| Sample | Conc. (mg mL−1) | RTpeak (min) | Mp (g mol−1) | Mn (g mol−1) | Mw (g mol−1) | Đ |
|---|---|---|---|---|---|---|
| HCl-Ethanosolv-CSL | 1 | 5.33 | 3.12 × 10⁷ | 2.28 × 10⁷ | 5.49 × 10⁷ | 2.41 |
| HCl-Ethanosolv-CSL | 5 | 6.17 | 2.97 × 10⁶ | 2.36 × 10⁶ | 1.70 × 10⁷ | 7.20 |
| AlkL | 10 | 7.74 | 1.21 × 10⁶ | 1.57 × 10⁵ | 5.13 × 10⁶ | 32.68 |
| Broad PS (HCl-Ethanosolv-CSL sequence) | – | 7.22 | 2.57 × 10⁵ | 1.39 × 10⁵ | 2.87 × 10⁵ | 2.06 |
| Broad PS (AlkL sequence) | – | 7.20 | 2.72 × 10⁵ | 1.31 × 10⁵ | 2.83 × 10⁵ | 2.17 |
Values above the highest PS standard (Mp ≈ 3.7 × 10⁵ g mol−1) are extrapolated and reflect associated species. The narrow PS standard peaks eluted at 7.04, 7.28, 7.78, 8.09, 8.47, 9.09 and 9.57 min (approximately 3.7 × 10⁵ to 7.1 × 10³ g mol−1). Mp, peak molecular weight; Đ = Mw/Mn; RT, retention time.
Table 8.
Antibacterial activity (inhibition zone index, IZ) of HCl-Ethanosolv-CSL and AlkL at 10 mg/mL.
Table 8.
Antibacterial activity (inhibition zone index, IZ) of HCl-Ethanosolv-CSL and AlkL at 10 mg/mL.
| Pathogenic Strains | Inhibition zone index (IZ) | ||
|---|---|---|---|
| HCl-Ethanosolv-CSL | Commercial lignin (AlkL) |
DMSO (control) |
|
| Bacillus subtilis | 0.31±0.05a | 0.22±0.05a | 0.00±0.00b |
| Bacillus cereus | 0.25±0.00a | 0.00±0.00b | 0.00±0.00b |
| Escherichia coli | 0.14±0.05a | 0.19±0.05a | 0.00±0.00b |
| Klebsiella sp. | 0.11±0.05a | 0.14±0.05a | 0.00±0.00b |
| Staphylococcus aureus | 0.00±0.00b | 0.00±0.00b | 0.00±0.00b |
Values are mean ± SD of three replicates (n = 3). IZ = ((diz − dd)/2)/dd, where diz is the diameter of the inhibition zone and dd is the disc diameter (6 mm). Means in the same row with different superscript letters differ significantly (one-way ANOVA with Tukey’s test, p < 0.05).
Disclaimer/Publisher’s Note: The statements, opinions and data contained in all publications are solely those of the individual author(s) and contributor(s) and not of MDPI and/or the editor(s). MDPI and/or the editor(s) disclaim responsibility for any injury to people or property resulting from any ideas, methods, instructions or products referred to in the content. |
© 2026 by the authors. Licensee MDPI, Basel, Switzerland. This article is an open access article distributed under the terms and conditions of the Creative Commons Attribution (CC BY) license (http://creativecommons.org/licenses/by/4.0/).
Copyright: This open access article is published under a Creative Commons CC BY 4.0 license, which permit the free download, distribution, and reuse, provided that the author and preprint are cited in any reuse.