

Submitted:
01 November 2026
Posted:
04 November 2026
You are already at the latest version
Abstract
Sampling temperature is usually fixed for an entire generation, even though the model’s next-token uncertainty changes from step to step. We study Thermo Pulse, an inference-time controller that sets the temperature at every step from the entropy of the renormalized top-five next-token distribution and from its first difference, using a clipped proportional–derivative (PD) law. We also evaluate a hybrid that composes the PD temperature with a relative-probability cutoff removing candidates below 5% of the most likely token. On Qwen2.5-3B-Instruct we compare nine decoding configurations, including greedy decoding, fixed temperatures, an entropy-threshold rule, a Mirostat-v2-style controller and P-only/D-only ablations, on 200 programmatically generated logic items and 200 mathematics items under five paired seeds (18,000 generations). The hybrid reaches 27.7% logic and 29.5% mathematics accuracy, against 26.7% and 28.6% for the PD controller without the cutoff and 27.6% and 25.4% for fixed temperature 0.7. None of the four prespecified primary contrasts is statistically established: the largest, +4.1 percentage points in mathematics relative to fixed temperature 0.7, has a family-cluster bootstrap 95% interval of [−0.8, 9.4] and a Holm-adjusted p of 0.609. Greedy decoding attains the highest mathematics accuracy (33.0%). Step-level instrumentation shows that the hybrid cutoff is active on about half of the generation steps while removing on average under 0.5% of probability mass. We present these results as an instrumented and reproducible case study of entropy-feedback decoding rather than as evidence of a general improvement. Code, data and raw results are available at https://github.com/enkiluv/thermo_pulse.
Keywords:
autoregressive decoding
; dynamic temperature
; entropy feedback
; proportional–derivative control
; sampling truncation
; reasoning benchmarks
1. Introduction
Autoregressive language models generate text by repeatedly sampling from a next-token distribution [1]. The decoding rule that turns logits into tokens affects accuracy, diversity and cost, and is especially consequential for multi-step reasoning, where an early error propagates through the remainder of the answer [2,3]. Most deployed rules are static: greedy decoding always takes the most likely token, fixed-temperature sampling rescales logits by one constant, and truncation rules such as top- [4], nucleus [5], typical [6] and min- sampling [7] prune the candidate set with fixed hyperparameters.
A smaller body of work adapts decoding online. Mirostat adjusts a truncation threshold so that observed surprise tracks a target [8], and entropy-based temperature methods map the current uncertainty to a temperature [9,10]. These methods use the current level of uncertainty. A natural question from feedback control [11] is whether the rate at which uncertainty changes is also a useful input. A sudden drop in entropy might, for example, accompany commitment to a particular continuation, and a controller could respond with a short increase in temperature.
This paper evaluates that idea under a deliberately conservative protocol. Thermo Pulse sets the temperature from the top-five entropy and its first difference with a clipped PD law. The formulation is motivated by the formal similarity between softmax sampling and the Boltzmann–Gibbs distribution [12,13], which makes temperature a natural control variable. We use this similarity only as a design analogy; we do not claim that a language model undergoes physical phase transitions. Our contributions are:
- A
- fully specified controller. We give the exact entropy signal, PD law, clipping bounds and a hybrid variant that adds a relative-probability (min-
-style) cutoff (Section 3).
- 2)
- A controlled comparison. We compare nine configurations, including P-only and D-only ablations and a Mirostat-v2-style baseline, on 400 programmatically generated items with five paired seeds, and we analyse paired differences with family-cluster resampling and Holm adjustment over four prespecified contrasts (Section 4 and Section 5).
- 3)
- Step-level instrumentation and transparent reporting. We report the temperature, candidate count and removed probability mass that each controller produces, and we report null and unfavourable outcomes together with favourable ones (Section 5). The benchmark script, datasets, raw results and analysis scripts are released at https://github.com/enkiluv/thermo_pulse.
The main finding is negative in the inferential sense. The hybrid has the highest observed logic accuracy and improves on its PD-only ablation in both domains, but the differences are small, the primary intervals include zero, and greedy decoding is best in mathematics.
2. Related Work
Truncation sampling. Top- sampling keeps a fixed number of candidates [4]; nucleus sampling keeps the smallest set whose cumulative probability exceeds [5]. Locally typical sampling keeps tokens whose information content is close to the conditional entropy [6], and truncation has been analysed as desmoothing of the model distribution, motivating entropy-dependent thresholds such as -sampling [14]. Min- sampling removes tokens whose probability is below a fraction of the top-token probability [7]. The relative cutoff in our hybrid configuration M9 is a min--style rule with fraction 0.05 applied after the PD temperature; we therefore do not claim the cutoff itself as a contribution.
Adaptive and feedback decoding. Mirostat uses feedback on the surprise of sampled tokens to keep perplexity near a target [8]. EDT selects a token-level temperature as a function of entropy [9], AdapT switches temperature for code tokens judged to be challenging [10], and entropy-aware decoding intervenes when entropy leaves a stable band [15]. Thermo Pulse is closest to EDT; it differs in adding a derivative term and in using a truncated (top-five) entropy with explicit clipping. Our entropy-threshold baseline M4 is a discrete stand-in for this family rather than a reimplementation of EDT.
Physical and control-theoretic framing. The softmax with temperature has the form of a Boltzmann distribution, a correspondence that underlies Boltzmann machines [13] and maximum-entropy reasoning [12]. Temporarily raising and then lowering temperature is the core of simulated annealing [16], and the proportional–derivative law is a standard feedback structure [11]. These connections motivate the design; they are not tested as physical claims.
3. Method: Thermo Pulse
Entropy signal. At generation step let be the raw next-token logits and the indices of the five largest entries of . We renormalize these probabilities to for and compute
is a truncated entropy bounded by nats; it is not the full-vocabulary Shannon entropy.
PD temperature. The controller sets
with , , , , and . The proportional term raises the temperature when exceeds and lowers it otherwise; the derivative term raises the temperature after an entropy drop. The temperature is applied at the same step at which is measured, by sampling from . Because is computed from raw logits, the temperature chosen at step does not affect directly; it acts on later signals only through the sampled token. The P-only and D-only ablations set and , respectively.
Hybrid cutoff (M9). M9 computes with the PD temperature, removes every token with , and samples from the renormalized survivors. M8 applies the identical temperature without the cutoff, so M9 − M8 isolates the effect of the cutoff. Figure 1 summarizes the control loop and Table 1 lists all configurations. Full pseudocode is given in Appendix B.
yield the top-five entropy and its difference ; a clipped PD law sets , which is applied at the same step. M9 additionally applies a relative cutoff before sampling.
4. Experimental Setup
Model and execution. All runs use Qwen2.5-3B-Instruct [17] with PyTorch [18] and Hugging Face Transformers [19] on a single NVIDIA RTX 4070 Laptop GPU with all layers resident on the GPU. The model’s default sampling settings (top-, top- and repetition penalty) are disabled so that each configuration applies only its own transformation. A short system instruction asks for brief reasoning and a final line of the form “Final Answer: <answer>”; generation stops after that line or at 256 new tokens, and only the last “Final Answer” line is parsed (Appendix A). Every configuration is run on every item under five paired seeds, giving generations.
Data. The benchmark contains 200 distinct logic items and 200 distinct mathematics items generated programmatically with dataset seed 20261031. Logic items involve bit updates, set operations, event ordering, path counting and conditional state calculations; mathematics items involve congruences, mixtures, constrained counting, linear systems and sequences. Each domain has 20 nominal families of 10 items, grouped into four construction labels (control, boundary, transition and recovery; 50 items each). The 20 families instantiate 10 archetypes per domain, each reused in two families (Appendix C, Table 5). The construction labels describe how items were generated, not validated cognitive processes; in particular, “recovery” items do not guarantee that a model detects and repairs its own error. All 400 reference keys were re-derived by an independent solver and matched the stored keys (Appendix C).
Outcomes. Accuracy is the percentage of generations whose parsed final answer matches the reference key. We also report the mean number of generated tokens and the tokens per correct answer (TPCA), defined as the total number of generated tokens divided by the number of correct generations. TPCA is a token-count proxy, not a latency or energy measure. Item-level consistency (the share of items correct on all five seeds, mixed, or wrong on all five) is reported in Appendix E.
Statistical analysis. The four primary contrasts, fixed before analysis, are M9 versus M3 and M9 versus M8 in each domain. For each contrast we average paired item-level differences over seeds and report a family-cluster bootstrap 95% interval that resamples the 20 families, a two-sided family sign-flip test, and a Holm adjustment over the four primary tests [20,21,22,23]. Five seeds on one item are not five independent observations. Moreover, the 20 families per domain instantiate only 10 archetypes, and families that share an archetype are correlated; treating the 20 families as independent clusters therefore does not remove all dependence, and the family-cluster intervals may be narrower than intervals that clustered by archetype. Question-level bootstrap intervals and exact first-seed McNemar tests [24] are reported only as ancillary diagnostics. Comparisons with the other seven configurations are exploratory and unadjusted.
5. Results
5.1. Accuracy and Token Cost
Table 2 and Figure 2 summarize accuracy and token cost. M9 has the highest observed logic accuracy (27.7%), narrowly ahead of M3 and M5 (27.6%). In mathematics, greedy decoding (M1) is best with 33.0%, followed by M2 (31.2%) and M9 (29.5%). Mean generation length varies little across configurations (59.3 to 59.8 tokens in logic, 73.4 to 79.8 in mathematics); M9 is not shorter than M8. Differences in TPCA therefore reflect accuracy differences far more than length differences. In mathematics, M9 needs 258.95 tokens per correct answer against 289.00 for M3 and 266.52 for M8, while M1 needs 241.80.
5.2. Primary Contrasts
Table 3 reports the four primary contrasts. The largest observed effect is mathematics M9 − M3 (+4.1 percentage points). Its question-level interval [1.3, 7.0] excludes zero, but the family-cluster interval [−0.8, 9.4] does not, and the Holm-adjusted sign-flip p-value is 0.609. The two M9 − M8 contrasts are +1.0 and +0.9 points with family-cluster intervals [−0.1, 2.2] and [−0.1, 1.9]. No primary contrast is statistically established, so we do not claim that M9 is superior to fixed-temperature sampling or to its PD-only ablation. The gap between question-level and family-cluster intervals for mathematics M9 − M3 illustrates how strongly the conclusion depends on treating related items as dependent.
5.3. Exploratory Comparisons and Ablations
Figure 3 shows M9 against every other configuration. Without multiplicity adjustment, six of the twelve exploratory family-cluster intervals exclude zero. Five favour M9: against M1, M2, M6 and M7 in logic and against M6 in mathematics. One favours the comparator: greedy decoding over M9 in mathematics (−3.5 points, [−6.9, −0.4]). Within the ablation family, M9 exceeds P-only (M6) by 2.4 and 2.6 points (unadjusted sign-flip p = 0.040 and 0.019) and D-only (M7) by 1.7 and 0.7 points. These contrasts do not identify the contribution of any single component. M9 − M6 combines the derivative term and the cutoff, and M9 − M7 combines the proportional term and the cutoff. The only single-component contrast in the design is M9 − M8, which isolates the cutoff and is inconclusive (Table 3). The accuracy differences M8 − M6 (+1.4 and +1.7 points, adding the derivative term) and M8 − M7 (+0.7 and −0.2 points, adding the proportional term), computed from Table 2 without intervals, are also small. Separating the P term, the D term and the cutoff would require a factorial design that includes, for example, P-only and D-only controllers combined with the cutoff. These results are exploratory and would not survive a correction over all sixteen comparisons. All exploratory statistics are listed in Appendix E (Table 8).
5.4. Stability Across Seeds
Sampling-based configurations produce mixed outcomes on a sizeable share of items. M9 is correct on all five seeds for 13.0% of logic items and 14.5% of mathematics items, compared with 12.0% and 14.5% for M8 and 9.5% and 12.0% for M3; the corresponding shares of items with mixed outcomes are 35.0%, 34.5% and 41.5% in logic and 37.5%, 36.5% and 38.5% in mathematics. Greedy decoding is deterministic in this setup, so its all-five rates (24.0% and 33.0%) equal its accuracies and do not indicate better calibration (Appendix E, Table 6).
5.5. Mechanism Instrumentation
Table 4 reports the step-level diagnostics. The PD controllers run cold: the mean temperature is 0.27 for M8 and M9 in both domains, well below the base value , because the mean top-five entropy (0.26 to 0.29 nats) lies far below , so the proportional term is usually negative. The M9 cutoff is active on 49.72% of logic steps and 48.30% of mathematics steps and leaves on average 1.23 and 1.25 candidates, yet it removes only 0.354% and 0.414% of probability mass. The cutoff therefore prunes a long tail of unlikely tokens while changing the renormalized sampling distribution only slightly. Since truncating a distribution and renormalizing changes it by exactly the removed mass in total variation, the removed mass and the total-variation change are the same quantity (Appendix B). The Mirostat-v2-style controller behaves almost like fixed temperature 0.7 in this configuration: its threshold rises from its initial value of 10 bits to a mean of 26.9 and 30.8 bits, far above the target , and it removes about 0.01% of probability mass. This explains why M3 and M5 have identical per-seed accuracies, and it means our results do not test Mirostat in a regime where its cutoff binds. Appendix F shows a token-level trace of the controller.
5.6. Construction Groups
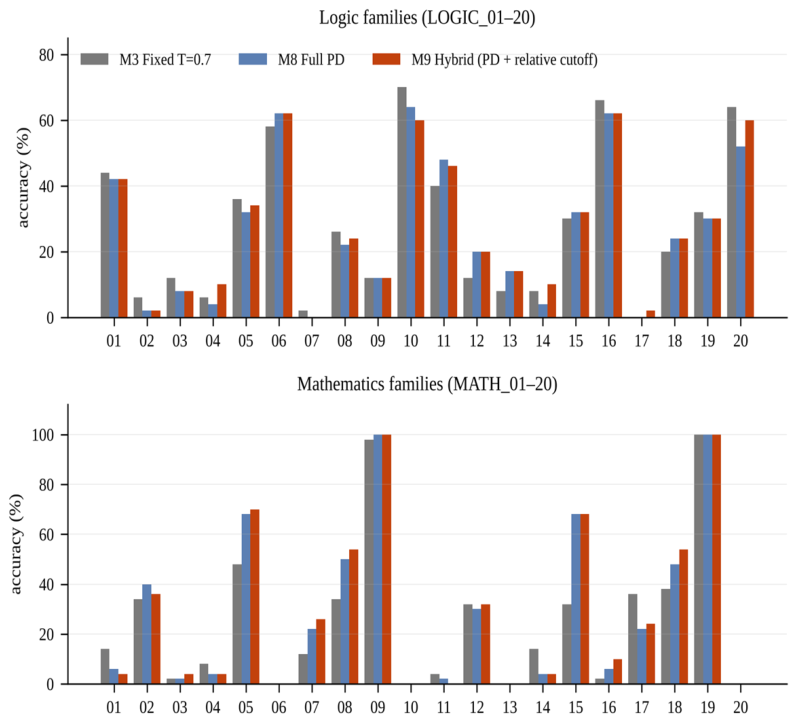
The largest descriptive M9 − M8 differences occur on recovery-labelled items (+2.0 points in logic, +2.4 in mathematics; Appendix E, Table 9 and Figure 4). These subgroup comparisons are exploratory. Recovery items share archetypes with boundary items and differ only in their generated parameters, so the labels cannot establish that temperature feedback repairs erroneous reasoning. Accuracy also varies far more across families than across configurations (Appendix E, Figure 5); three mathematics families are solved by no configuration and two are solved almost always by all.
6. Discussion and Limitations
What the evidence supports. An inexpensive score transformation can modulate temperature as a function of truncated entropy and its local change, and a relative cutoff can remove many low-probability candidates while discarding little probability mass. Under fixed constants on a 3B model, these mechanisms produce small, task-dependent changes in accuracy and stability: the hybrid is the most accurate configuration on logic and ahead of its PD-only and P-only ablations, while greedy decoding remains best on mathematics. The design does not identify the separate contributions of the proportional term, the derivative term and the cutoff.
What it does not support. The benchmark does not establish superiority over fixed-temperature sampling, a reduction in generated tokens, or a causal role of the derivative term in preventing loops or repairing errors. The derivative term raises temperature after entropy drops by design, but we did not annotate loops or error-recovery events, so its behavioural effect remains a hypothesis. A follow-up probe that forked generations from shared prefixes was inconclusive (Appendix G).
Implications for evaluating adaptive decoders. Controllers should report achieved internal states, not only targets: the Mirostat-style baseline did not operate near its target surprise, and the PD controller operated well below its nominal temperature. Inference on generated benchmarks should also account for item dependence; question-level resampling would have suggested a significant mathematics gain that does not survive family-level resampling.
Limitations. All experiments use one 3-billion-parameter instruction-tuned model and a synthetic benchmark generated from ten archetypes per domain; results may not transfer to larger models, other model families, natural-language benchmarks such as GSM8K [25], or open-ended generation. Because the 20 families per domain share 10 archetypes, the effective number of independent units is smaller than 20, and our family-level inference should be read as a lower bound on uncertainty rather than an exact one. The construction labels were not validated psychometrically or behaviourally. The constants , , and the 0.05 cutoff were fixed without a separate tuning set, and a different operating point (for example, closer to the observed entropy range) could behave differently; a systematic search [26] is left for future work. The Mirostat-v2-style baseline was evaluated at one setting in which its cutoff rarely bound. Seeds probe stochastic variation within items but do not add items. Token counts are not wall-clock time, memory or energy, and we make no claim about overhead in serving systems such as vLLM [27].
Broader impacts. This work concerns inference-time decoding and introduces no new data about people or new model capabilities. Better-calibrated decoding could reduce wasted computation; overstated claims about decoding improvements can mislead practitioners, which is why we emphasize uncertainty and negative results.
7. Conclusions
This paper asked whether the rate of change of next-token uncertainty, and not only its level, is a useful control signal for sampling temperature. We answered it with a fully specified and openly released controller, Thermo Pulse, which sets the temperature from the top-five entropy and its first difference through a clipped PD law, and with a hybrid variant that adds a relative-probability cutoff. Both were compared against seven alternatives on 400 programmatically generated reasoning items under five paired seeds, with every generation instrumented at the token level and every primary contrast fixed in advance.
The results are modest but informative. The hybrid achieved the highest observed logic accuracy (27.7%) and improved on its PD-only ablation in both domains (+1.0 and +0.9 percentage points), with intervals that only just include zero. In mathematics it reached 29.5% against 25.4% for fixed temperature 0.7 and needed about 10% fewer tokens per correct answer (258.95 against 289.00), and it raised the share of items solved on all five seeds relative to fixed-temperature sampling (13.0% against 9.5% in logic, 14.5% against 12.0% in mathematics). These gains were not statistically established after family-level resampling and Holm adjustment, greedy decoding remained best in mathematics (33.0%), and the design does not separate the contributions of the proportional term, the derivative term and the cutoff. Entropy feedback is therefore best described as a low-cost control knob that shifts the accuracy–stability–cost trade-off in a task-dependent way, not as a general improvement.
The instrumentation explains much of this picture. Because the observed top-five entropy (0.26 to 0.29 nats) lay far below the reference , the PD controllers ran at a mean temperature of about 0.27 rather than the nominal 0.50, and the upper clip could never bind. The hybrid cutoff acted on about half of the steps yet removed less than 0.5% of probability mass, and the Mirostat-style baseline drifted to a threshold of 27 to 31 bits, far from its 5-bit target, which made it nearly indistinguishable from fixed temperature 0.7. These observations show that adaptive decoders can operate far from their intended regime, and that reporting achieved internal states is necessary to interpret task-level results. The contrast between question-level and family-level intervals for the mathematics gain shows, likewise, that inference on generated benchmarks must account for shared item structure.
Beyond its specific findings, the study contributes a reproducible testbed: the controller, datasets, raw item-by-seed results and analysis scripts are public, so each claim in this paper can be checked and extended. The most direct next steps follow from the limitations we identified: a factorial ablation that crosses the P term, the D term and the cutoff; an operating point with matched to the observed entropy range; archetype-level resampling; evaluation on more models and independently curated benchmarks; and matched-prefix experiments that test whether a temperature pulse after an entropy drop changes the course of a reasoning trajectory.
Appendix A. Reproducibility and Implementation Details
Code and data. All code, both dataset files, the raw result file and the derived CSV files are available at https://github.com/enkiluv/thermo_pulse under the MIT license. The repository contains the benchmark script (benchz.py), its Windows launcher (benchz.cmd), the dataset generator (benchz_dataset_v14.py), the post-processing script that regenerates the CSV exports from the raw results without a GPU (post_v14.py), the datasets (benchmark_v14_logic_mechanism.json, benchmark_v14_math_mechanism.json), the raw results (qwen3b_v14_results_s200.json), the derived CSV files and the token-level HTML report. The result file analysed in this paper is byte-identical to the file in the repository.
Protocol. The analysed run is labelled V14_mechanism_200x5_frozen_algorithms. It uses Qwen/Qwen2.5-3B-Instruct, 200 items per domain, five seeds, a cap of 256 new tokens and dataset seed 20261031; the decoding constants of M1–M9 were frozen before the run. The launcher calls the benchmark with --model qwen-3b --macro --sample 200 --seeds 5 --start M1 and sets BENCH_MAX_NEW_TOKENS=256. The five generation seeds are 52, 62, 72, 82 and 92, and the same seed is used for every configuration and item.
Software and hardware. Python 3.10 in an isolated virtual environment on Windows, PyTorch 2.9.1+cu126, Transformers 4.57.6 and Accelerate 1.15.0 on an NVIDIA RTX 4070 Laptop GPU.
Decoding implementation. Each configuration is a logits processor applied to the raw scores returned by the model. The entropy signal, temperature and cutoff are computed at every step, and the processor returns the rescaled (and, for M9 and M5, masked) scores to the sampler. The model’s default generation settings are overridden (temperature 1.0 for processor-based configurations, top- = 1.0, top- = 0, repetition penalty 1.0) so that temperature is applied exactly once. M1–M3 use an observe-only processor that records the top-five entropy without altering the scores.
Prompt, stopping and parsing. Each item is given as the user message after the following system instruction, formatted with the model’s chat template:
Solve the problem carefully using short intermediate reasoning when needed. Prioritize a correct answer rather than a guess. Keep reasoning within approximately 2-5 brief sentences. For the last line write exactly: Final Answer: <ANSWER>. Do not emit <think> tags or repeat the problem text.
Generation stops once the text after “Final Answer:“ contains a line break or at least five characters, or at 256 new tokens. The parser takes the last “Final Answer:“ line, strips markup and surrounding punctuation, and accepts only a signed integer, a single letter, TRUE/FALSE or ON/OFF; any other output is scored as incorrect. Correctness is exact string equality with the reference key after upper-casing.
Appendix B. Controller Specification
Pseudocode. For M6–M9 the processor keeps the previous entropy and runs, at each step:
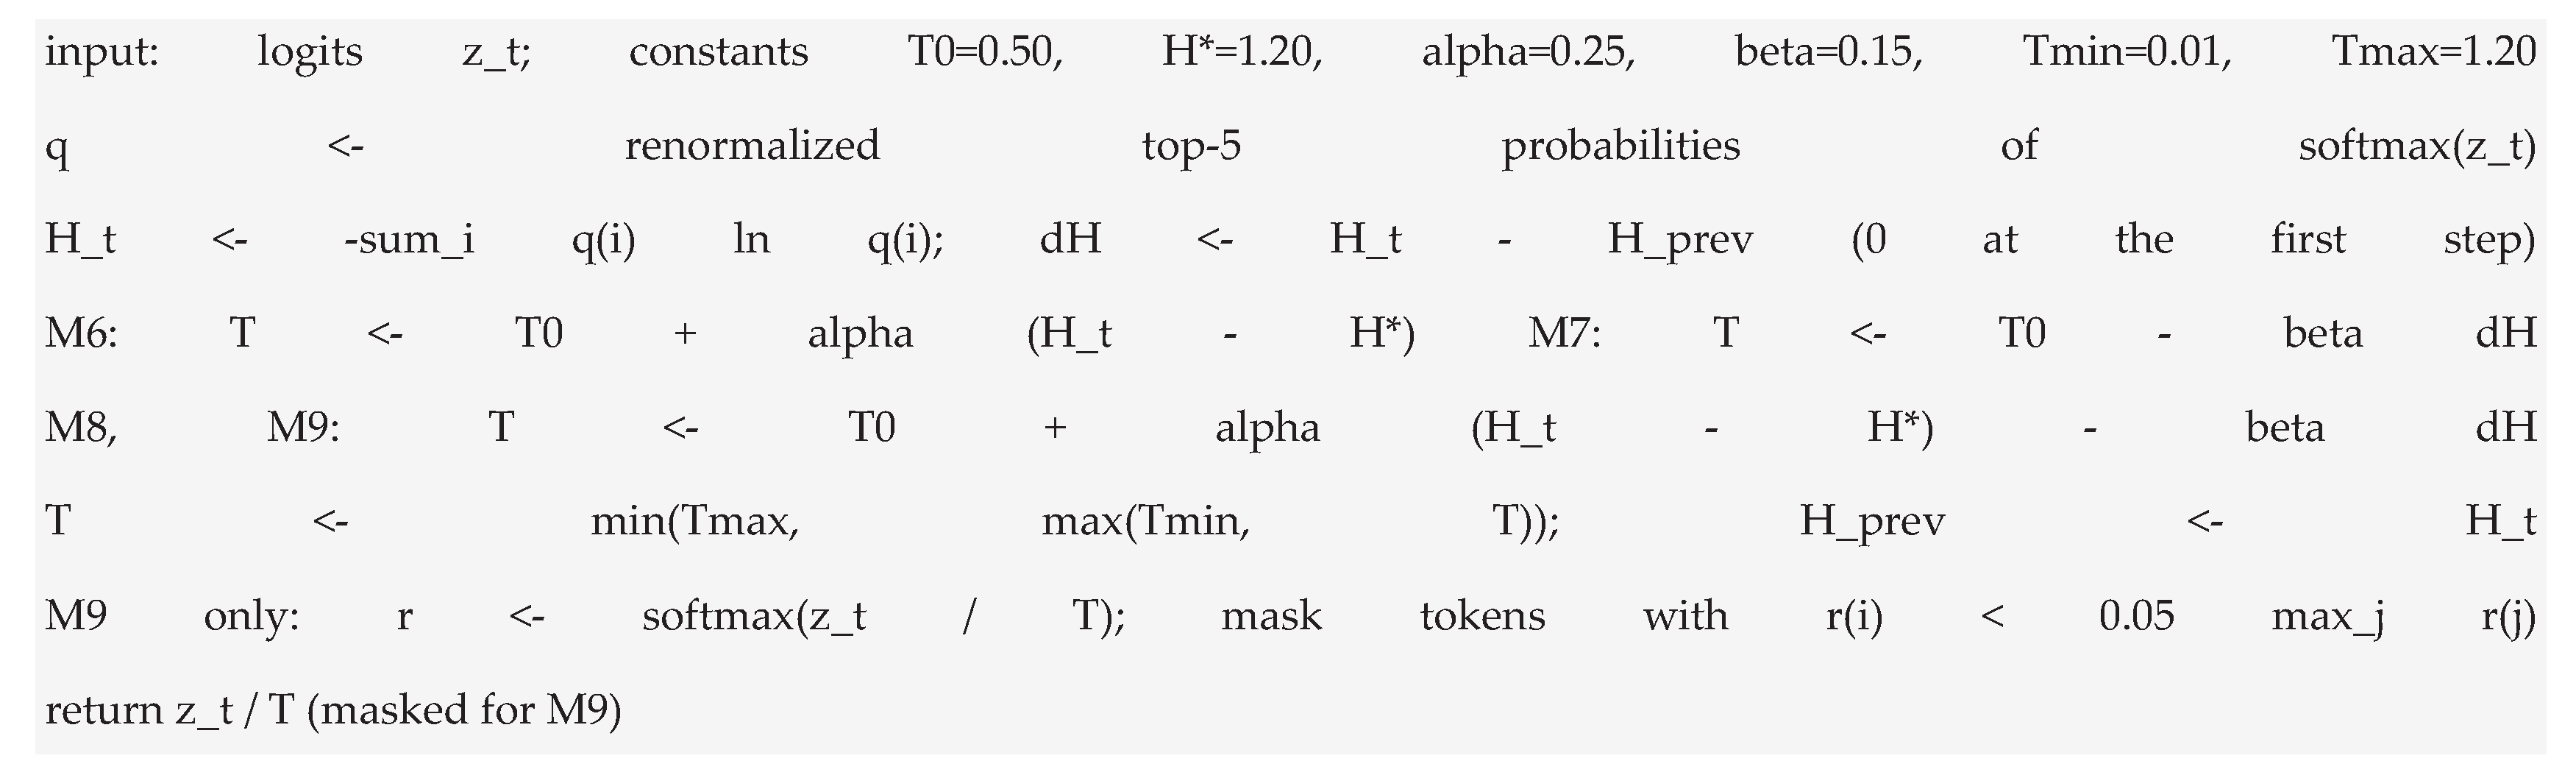
M4 uses the same entropy signal with the piecewise constant rule of Table 1. M5 initializes bits, scales logits by , keeps tokens whose surprise does not exceed (at least one token), and after each step updates , where is the surprise of the sampled token. In this implementation is computed under the untruncated temperature-scaled distribution of the previous step, whereas the original Mirostat v2 computes it under the truncated, renormalized distribution [8]; this is one reason we call M5 “Mirostat-v2 style”.
Removed mass equals total-variation distance. Let be a distribution, the retained set and the removed mass. Renormalizing gives for and 0 otherwise. Then and , so . Reporting both quantities would therefore not provide independent evidence.
Operating range of the controller. Because , the proportional term lies in . With the derivative term lies in . The unclipped temperature therefore ranges from about to , so the lower clip can bind while the upper clip cannot.
Appendix C. Benchmark Construction and Key Verification
Families and archetypes. Table 5 lists the 20 families per domain. Families 01–05 are labelled control and 11–15 transition; they instantiate the same five archetypes. Families 06–10 are labelled boundary and 16–20 recovery; they likewise share five archetypes. Every item was tagged “designed multi-step” by the generator. Comparisons between construction groups therefore compare different parameterizations of the same archetypes.

Table 5.
Family inventory. Accuracy ranges are family-level accuracies over all nine configurations, computed from the item-by-seed records.
Table 5.
Family inventory. Accuracy ranges are family-level accuracies over all nine configurations, computed from the item-by-seed records.
| Families (construction group) | Archetype | Accuracy range over M1–M9 (%) |
|---|---|---|
| LOGIC_01 (control), LOGIC_11 (transition) | Parity of flips along a gate sequence (initial bit and binary flags) | 30–50 |
| LOGIC_02 (control), LOGIC_12 (transition) | Cardinality of a set expression over three integer lists | 0–20 |
| LOGIC_03 (control), LOGIC_13 (transition) | Ordering of eight events from pairwise time offsets | 6–14 |
| LOGIC_04 (control), LOGIC_14 (transition) | Path counting in a three-layer graph with pruned branches | 0–10 |
| LOGIC_05 (control), LOGIC_15 (transition) | Order statistic after excluding the shortest and longest tasks | 20–40 |
| LOGIC_06 (boundary), LOGIC_16 (recovery) | Boolean condition built from modular residues and a threshold | 50–66 |
| LOGIC_07 (boundary), LOGIC_17 (recovery) | Register value after signed updates with a skipped index range | 0–10 |
| LOGIC_08 (boundary), LOGIC_18 (recovery) | Rank query after threshold filtering and removing the maximum | 10–30 |
| LOGIC_09 (boundary), LOGIC_19 (recovery) | Order statistic of parity-filtered, sorted sequence entries | 0–34 |
| LOGIC_10 (boundary), LOGIC_20 (recovery) | Final bit after a chain of XOR/OR/AND operations on X, Y, Z | 50–70 |
| MATH_01 (control), MATH_11 (transition) | Least non-negative solution of two simultaneous congruences | 0–14 |
| MATH_02 (control), MATH_12 (transition) | Remaining dye after successive percentage replacements | 26–50 |
| MATH_03 (control), MATH_13 (transition) | Committees with an at-most-one constraint on a specified subset | 0–10 |
| MATH_04 (control), MATH_14 (transition) | Linear combination of the solution of a 2×2 linear system | 0–14 |
| MATH_05 (control), MATH_15 (transition) | Term of a sequence whose increments grow arithmetically | 32–90 |
| MATH_06 (boundary), MATH_16 (recovery) | Sum of integers in an interval satisfying a congruence | 0–10 |
| MATH_07 (boundary), MATH_17 (recovery) | Inclusion–exclusion count of multiples of two integers | 12–44 |
| MATH_08 (boundary), MATH_18 (recovery) | Multi-stage choice counting with disallowed initial choices | 34–70 |
| MATH_09 (boundary), MATH_19 (recovery) | Total cost after a percentage discount and fixed shipping | 98–100 |
| MATH_10 (boundary), MATH_20 (recovery) | Arithmetic-progression sum with omitted term indices | 0–0 |
Floor and ceiling families. No configuration solved any item of MATH_10, MATH_13 and MATH_20 (0% accuracy for all nine configurations), and every configuration solved at least 95% of MATH_09 and MATH_19. These families contribute little to discriminating between configurations.
Independent key verification. We wrote a separate solver for each of the 20 archetypes that parses the question text and recomputes the answer. It reproduced all 400 stored reference keys (200 logic, 200 mathematics) without exception. The solver checks the keys, not the model’s answer parser.
Representative items. One item of each archetype (variant 1 of families 01–10) with its programmatic key:
- LOGIC_01 (control). A binary signal begins at 0. Passing 11 gates, each gate flips the bit iff its flag is 1. Flags: [1, 0, 0, 0, 0, 1, 0, 0, 0, 0, 1]. After all gates, what is the bit? Answer integer. Key: 1
- LOGIC_02 (control). A=[4, 8, 10, 12, 15, 18, 19, 20, 26, 28, 30, 34, 38, 40]; B=[3, 6, 7, 8, 9, 10, 13, 20, 23, 25, 29, 30, 31, 36, 39]; C=[7, 9, 18, 22, 24, 25, 30, 32, 34, 37, 38, 40]. Form (A intersection B) minus C. How many distinct elements remain? Answer integer. Key: 3
- LOGIC_03 (control). Events form this linked timeline: A is 10 minutes before C; C is 9 minutes before B; B is 8 minutes before F; F is 5 minutes before E; E is 10 minutes before D; D is 11 minutes before G; G is 20 minutes before H. Which event is 4th chronologically? Answer one letter. Key: F
- LOGIC_04 (control). A layered graph has 4 distinct first choices, 7 distinct second choices per first choice and 5 distinct final choices per second choice. Exactly 1 first-choice branches are entirely prohibited. Each remaining second-choice node loses precisely one of its 5 outgoing choices. Count valid paths. Answer integer. Key: 84
- LOGIC_05 (control). Task completion times are [104, 60, 115, 27, 75, 96, 123, 80, 47] minutes. Exclude the shortest 5 tasks, then exclude the single longest of the remaining tasks. What is the longest remaining time? Answer integer. Key: 115
- LOGIC_06 (boundary). A system opens iff ((108 mod 10) < 4) AND ((108 mod 7) is even OR 108 > 150). Is it open? Answer TRUE or FALSE. Key: FALSE
- LOGIC_07 (boundary). A register starts at 31. Apply signed updates [2, 2, 8, -8, 6, -6, -1, 10, 5, 5, 3, 3, -2, 0, 1] in order, but skip updates numbered 2 through 15 inclusive (1-indexed). What is the final value? Answer integer. Key: 33
- LOGIC_08 (boundary). Scores: [831, 620, 336, 418, 715, 443, 480, 707, 478, 585, 510]. Remove scores below 287, then remove the highest surviving score. What is the 1th highest among survivors? Answer integer. Key: 715
- LOGIC_09 (boundary). The sequence is [39, 5, 9, 17, 35, 11, 36, 12, 44, 24, 4, 2]. Retain only even entries; sort them in increasing order. What is the 1th retained value? Answer integer. Key: 2
- LOGIC_10 (boundary). Binary state X=0, Y=0, Z=1. Apply in order: XOR 1, OR Y, XOR 1, AND (Z OR 0), XOR 0. What is the final bit? Answer integer. Key: 0
- MATH_01 (control). Find the least nonnegative integer x satisfying x ≡ 4 (mod 9) and x ≡ 12 (mod 13). Answer integer. Key: 103
- MATH_02 (control). A 1200-liter tank contains pure dye. Replace 25% of the mixed contents with water, mix thoroughly, then replace another 30% with water. How many liters of dye remain? Answer integer. Key: 630
- MATH_03 (control). Choose 5 people from 21. Among them 3 specified people are mutually exclusive: at most one of these 3 may be chosen. How many committees are valid? Answer integer. Key: 17748
- MATH_04 (control). Solve x+y=88 and 3x-7y=-126. Find 4x+3y. Answer integer. Key: 313
- MATH_05 (control). An integer sequence begins at 7. The increment from term 1 to term 2 is 3, and each later increment grows by 3 compared with the preceding increment. What is term 13? Answer integer. Key: 241
- MATH_06 (boundary). Find the sum of all integers x satisfying 82 ≤ x ≤ 122 and x ≡ 5 (mod 8). Answer integer. Key: 505
- MATH_07 (boundary). Among integers from 1 through 217 inclusive, how many are divisible by 3 OR by 9? Answer integer. Key: 72
- MATH_08 (boundary). A three-stage machine has 8 independent initial choices, 7 intermediate choices per initial choice, and 5 endings per intermediate choice. Exactly 6 initial choices are disallowed. How many different complete procedures remain? Answer integer. Key: 70
- MATH_09 (boundary). An order contains 7 identical items at 40 credits each. A 10% discount applies to the entire item subtotal, then a fixed shipping charge of 10 credits is added. What is the total cost? Answer integer. Key: 262
- MATH_10 (boundary). An arithmetic progression starts at 12, increases by 2, and has 21 terms. Omit terms numbered [5, 6, 7] (1-indexed). What is the sum of the remaining terms? Answer integer. Key: 606
These items are taken verbatim from the dataset files. Parameterized templates do not by themselves rule out overlap with the model’s training data.
Appendix D. Statistical Procedures
Notation. Let be correctness of item , seed and configuration , with items and seeds per domain. Accuracy is . The all-five rate is , the mixed rate is , and the all-wrong rate is the remainder. TPCA is , where is the number of generated tokens, and is undefined if no generation is correct.
Paired contrasts. For configurations and the item-level difference is with seeds aligned by label. The reported difference is . The question bootstrap resamples items; the family-cluster bootstrap resamples the 20 families with replacement and recomputes the mean over all items of the drawn families [21]. The family sign-flip test randomly flips the sign of each family’s mean difference and compares the absolute mean of the flipped differences with the observed absolute mean. Holm’s procedure [22] is applied to the four primary sign-flip p-values. Both bootstraps use 5,000 resamples with generator seed 20261027 and percentile intervals. Because all families contain ten items, resampling the 20 family-mean differences is equivalent to resampling families with all their items. The sign-flip test uses 50,000 Monte Carlo draws with seed 20261028 and reports , where is the number of draws whose absolute mean difference is at least the observed one.
McNemar diagnostic. For each contrast we report the exact McNemar test [24] on the first seed only, with the number of items correct under M9 and wrong under the comparator and the reverse. This test ignores the other seeds and the family structure, so we do not use it for inference.
Interpretation. The sign-flip test treats families as exchangeable units under the null of no difference. Each archetype appears in two families (Table 5), so the 20 families are not 20 independent clusters, and both the bootstrap intervals and the sign-flip p-values may understate uncertainty. All intervals should be read as sensitivity summaries for this benchmark; none of the paper’s conclusions relies on a claim of statistical superiority.
Appendix E. Additional Results
Table 6.
Item-level consistency over five seeds: share of items correct on all seeds, with mixed outcomes, and wrong on all seeds.
Table 6.
Item-level consistency over five seeds: share of items correct on all seeds, with mixed outcomes, and wrong on all seeds.
| Configuration | Logic all-5 (%) | Logic mixed (%) | Logic all-wrong (%) | Math all-5 (%) | Math mixed (%) | Math all-wrong (%) |
|---|---|---|---|---|---|---|
| M1 Greedy | 24.0 | 0.0 | 76.0 | 33.0 | 0.0 | 67.0 |
| M2 Fixed T = 0.2 | 12.0 | 32.0 | 56.0 | 17.5 | 32.5 | 50.0 |
| M3 Fixed T = 0.7 | 9.5 | 41.5 | 49.0 | 12.0 | 38.5 | 49.5 |
| M4 Entropy threshold | 9.5 | 37.5 | 53.0 | 15.5 | 34.5 | 50.0 |
| M5 Mirostat-v2 style | 10.0 | 41.0 | 49.0 | 12.0 | 38.5 | 49.5 |
| M6 P-only | 11.5 | 32.0 | 56.5 | 14.0 | 32.5 | 53.5 |
| M7 D-only | 10.5 | 38.5 | 51.0 | 14.0 | 37.0 | 49.0 |
| M8 Full PD | 12.0 | 34.5 | 53.5 | 14.5 | 36.5 | 49.0 |
| M9 Hybrid | 13.0 | 35.0 | 52.0 | 14.5 | 37.5 | 48.0 |
Table 7.
Accuracy by seed. Seeds are paired across configurations.
| Configuration | Domain | Seed 1 | Seed 2 | Seed 3 | Seed 4 | Seed 5 | Mean ± SD |
|---|---|---|---|---|---|---|---|
| M1 Greedy | Logic | 24.0 | 24.0 | 24.0 | 24.0 | 24.0 | 24.0 ± 0.00 |
| Math | 33.0 | 33.0 | 33.0 | 33.0 | 33.0 | 33.0 ± 0.00 | |
| M2 Fixed T = 0.2 | Logic | 26.0 | 26.5 | 26.0 | 24.0 | 23.5 | 25.2 ± 1.21 |
| Math | 29.5 | 33.0 | 33.0 | 31.5 | 29.0 | 31.2 ± 1.69 | |
| M3 Fixed T = 0.7 | Logic | 28.5 | 23.0 | 26.5 | 31.0 | 29.0 | 27.6 ± 2.71 |
| Math | 26.5 | 25.5 | 24.5 | 27.5 | 23.0 | 25.4 ± 1.56 | |
| M4 Entropy threshold | Logic | 24.0 | 23.0 | 27.0 | 28.0 | 26.0 | 25.6 ± 1.85 |
| Math | 25.5 | 33.0 | 31.5 | 30.5 | 25.5 | 29.2 ± 3.12 | |
| M5 Mirostat-v2 style | Logic | 28.5 | 23.0 | 26.5 | 31.0 | 29.0 | 27.6 ± 2.71 |
| Math | 26.5 | 25.5 | 24.5 | 27.5 | 23.0 | 25.4 ± 1.56 | |
| M6 P-only | Logic | 24.5 | 23.0 | 26.0 | 27.0 | 26.0 | 25.3 ± 1.40 |
| Math | 23.5 | 28.5 | 30.0 | 29.0 | 23.5 | 26.9 ± 2.82 | |
| M7 D-only | Logic | 25.0 | 24.5 | 27.0 | 27.0 | 26.5 | 26.0 ± 1.05 |
| Math | 26.5 | 32.5 | 31.5 | 29.5 | 24.0 | 28.8 ± 3.16 | |
| M8 Full PD | Logic | 24.5 | 25.5 | 27.0 | 29.5 | 27.0 | 26.7 ± 1.69 |
| Math | 24.5 | 31.5 | 31.5 | 31.5 | 24.0 | 28.6 ± 3.56 | |
| M9 Hybrid | Logic | 27.5 | 26.0 | 27.5 | 29.0 | 28.5 | 27.7 ± 1.03 |
| Math | 26.5 | 32.0 | 32.5 | 31.0 | 25.5 | 29.5 ± 2.92 |
Table 8.
All paired comparisons of M9 with the other configurations (prim. = prespecified primary, expl. = exploratory). Δ is M9 minus the comparator in percentage points; CIs are bootstrap 95% intervals; McNemar uses the first seed only.
Table 8.
All paired comparisons of M9 with the other configurations (prim. = prespecified primary, expl. = exploratory). Δ is M9 minus the comparator in percentage points; CIs are bootstrap 95% intervals; McNemar uses the first seed only.
| Domain | Comparator | Role | Δ (pp) | Question CI | Family CI | Sign-flip p | McNemar b / c | McNemar p |
|---|---|---|---|---|---|---|---|---|
| Logic | M1 Greedy | expl. | +3.7 | [-0.2, 7.7] | [0.3, 7.0] | 0.064 | 17 / 10 | 0.248 |
| Logic | M2 Fixed T = 0.2 | expl. | +2.5 | [0.3, 4.8] | [0.5, 4.6] | 0.046 | 15 / 12 | 0.701 |
| Logic | M3 Fixed T = 0.7 | prim. | +0.1 | [-2.4, 2.6] | [-1.8, 2.0] | 1.000 | 13 / 15 | 0.851 |
| Logic | M4 Entropy threshold | expl. | +2.1 | [0.2, 4.1] | [-0.1, 4.3] | 0.105 | 13 / 6 | 0.167 |
| Logic | M5 Mirostat-v2 style | expl. | +0.1 | [-2.4, 2.6] | [-1.8, 2.0] | 1.000 | 13 / 15 | 0.851 |
| Logic | M6 P-only | expl. | +2.4 | [0.6, 4.2] | [0.4, 4.4] | 0.040 | 11 / 5 | 0.210 |
| Logic | M7 D-only | expl. | +1.7 | [-0.1, 3.6] | [0.2, 3.3] | 0.062 | 11 / 6 | 0.332 |
| Logic | M8 Full PD | prim. | +1.0 | [-0.1, 2.1] | [-0.1, 2.2] | 0.171 | 7 / 1 | 0.070 |
| Math | M1 Greedy | expl. | -3.5 | [-7.3, 0.2] | [-6.9, -0.4] | 0.066 | 6 / 19 | 0.015 |
| Math | M2 Fixed T = 0.2 | expl. | -1.7 | [-3.8, 0.2] | [-4.3, 0.5] | 0.248 | 7 / 13 | 0.263 |
| Math | M3 Fixed T = 0.7 | prim. | +4.1 | [1.3, 7.0] | [-0.8, 9.4] | 0.155 | 18 / 18 | 1.000 |
| Math | M4 Entropy threshold | expl. | +0.3 | [-1.7, 2.3] | [-2.2, 2.5] | 0.871 | 12 / 10 | 0.832 |
| Math | M5 Mirostat-v2 style | expl. | +4.1 | [1.3, 7.0] | [-0.8, 9.4] | 0.155 | 18 / 18 | 1.000 |
| Math | M6 P-only | expl. | +2.6 | [0.9, 4.4] | [0.8, 4.6] | 0.019 | 11 / 5 | 0.210 |
| Math | M7 D-only | expl. | +0.7 | [-0.9, 2.3] | [-0.8, 2.2] | 0.467 | 10 / 10 | 1.000 |
| Math | M8 Full PD | prim. | +0.9 | [-0.1, 1.9] | [-0.1, 1.9] | 0.152 | 7 / 3 | 0.344 |
Table 9.
M9 − comparator differences by construction group (percentage points), with the number of item–seed pairs correct only under M9 and only under the comparator in parentheses.
Table 9.
M9 − comparator differences by construction group (percentage points), with the number of item–seed pairs correct only under M9 and only under the comparator in parentheses.
| Domain | M9 vs | All | Control | Boundary | Transition | Recovery |
|---|---|---|---|---|---|---|
| Logic | M8 | +1.0 (22/12) | +1.6 (8/4) | -0.4 (2/3) | +0.8 (6/4) | +2.0 (6/1) |
| Logic | M3 | +0.1 (78/77) | -1.6 (21/25) | -2.0 (15/20) | +4.8 (27/15) | -0.8 (15/17) |
| Logic | M5 | +0.1 (78/77) | -1.6 (21/25) | -2.0 (15/20) | +4.8 (27/15) | -0.8 (15/17) |
| Logic | M1 | +3.7 (93/56) | +3.2 (23/15) | +3.6 (23/14) | +6.4 (33/17) | +1.6 (14/10) |
| Logic | M2 | +2.5 (70/45) | -2.0 (18/23) | +3.2 (13/5) | +6.4 (30/14) | +2.4 (9/3) |
| Math | M8 | +0.9 (17/8) | -0.4 (2/3) | +1.6 (6/2) | +0.0 (2/2) | +2.4 (7/1) |
| Math | M3 | +4.1 (108/67) | +2.4 (25/19) | +7.2 (26/8) | +4.4 (30/19) | +2.4 (27/21) |
| Math | M5 | +4.1 (108/67) | +2.4 (25/19) | +7.2 (26/8) | +4.4 (30/19) | +2.4 (27/21) |
| Math | M1 | -3.5 (57/92) | -2.4 (13/19) | +0.0 (20/20) | -7.2 (10/28) | -4.4 (14/25) |
| Math | M2 | -1.7 (38/55) | +0.4 (9/8) | -1.6 (16/20) | +0.0 (7/7) | -5.6 (6/20) |
Table 10.
a. Logic results by construction group: accuracy (%) / all-five correct (%) / mixed (%) / TPCA. b. Mathematics results by construction group: accuracy (%) / all-five correct (%) / mixed (%) / TPCA.
Table 10.
a. Logic results by construction group: accuracy (%) / all-five correct (%) / mixed (%) / TPCA. b. Mathematics results by construction group: accuracy (%) / all-five correct (%) / mixed (%) / TPCA.
| a. | ||||
|---|---|---|---|---|
| Configuration | Control | Boundary | Transition | Recovery |
| M1 Greedy | 16.0 / 16 / 0 / 267.2 | 28.0 / 28 / 0 / 242.5 | 18.0 / 18 / 0 / 268.1 | 34.0 / 34 / 0 / 232.0 |
| M2 Fixed T = 0.2 | 21.2 / 6 / 34 / 207.8 | 28.4 / 16 / 30 / 245.8 | 18.0 / 4 / 42 / 276.0 | 33.2 / 22 / 22 / 226.1 |
| M3 Fixed T = 0.7 | 20.8 / 0 / 54 / 223.2 | 33.6 / 14 / 34 / 207.5 | 19.6 / 4 / 46 / 240.6 | 36.4 / 20 / 32 / 203.3 |
| M4 Entropy threshold | 18.4 / 2 / 42 / 252.5 | 31.6 / 16 / 32 / 218.9 | 17.2 / 2 / 40 / 280.9 | 35.2 / 18 / 36 / 209.6 |
| M5 Mirostat-v2 style | 20.8 / 2 / 52 / 223.7 | 33.6 / 14 / 34 / 207.5 | 19.6 / 4 / 46 / 240.6 | 36.4 / 20 / 32 / 203.3 |
| M6 P-only | 15.2 / 2 / 36 / 302.9 | 31.6 / 20 / 28 / 219.5 | 20.4 / 4 / 36 / 237.2 | 34.0 / 20 / 28 / 215.6 |
| M7 D-only | 18.4 / 2 / 44 / 246.2 | 29.6 / 16 / 32 / 236.8 | 20.8 / 2 / 50 / 231.4 | 35.2 / 22 / 28 / 209.1 |
| M8 Full PD | 17.6 / 2 / 38 / 257.8 | 32.0 / 18 / 30 / 221.1 | 23.6 / 6 / 46 / 204.9 | 33.6 / 22 / 24 / 221.8 |
| M9 Hybrid | 19.2 / 2 / 40 / 236.1 | 31.6 / 18 / 28 / 225.2 | 24.4 / 6 / 50 / 199.6 | 35.6 / 26 / 22 / 207.7 |
| b. | ||||
| Configuration | Control | Boundary | Transition | Recovery |
| M1 Greedy | 26.0 / 26 / 0 / 308.9 | 36.0 / 36 / 0 / 225.6 | 28.0 / 28 / 0 / 266.7 | 42.0 / 42 / 0 / 197.6 |
| M2 Fixed T = 0.2 | 23.2 / 12 / 28 / 324.4 | 37.6 / 24 / 32 / 195.2 | 20.8 / 6 / 34 / 361.8 | 43.2 / 28 / 36 / 188.6 |
| M3 Fixed T = 0.7 | 21.2 / 6 / 42 / 352.5 | 28.8 / 18 / 30 / 245.9 | 16.4 / 2 / 44 / 451.0 | 35.2 / 22 / 38 / 210.5 |
| M4 Entropy threshold | 23.2 / 14 / 24 / 329.8 | 32.8 / 20 / 30 / 222.1 | 21.6 / 6 / 42 / 352.6 | 39.2 / 22 / 42 / 198.7 |
| M5 Mirostat-v2 style | 21.2 / 6 / 42 / 356.1 | 28.8 / 18 / 30 / 245.9 | 16.4 / 2 / 44 / 451.0 | 35.2 / 22 / 38 / 210.5 |
| M6 P-only | 21.6 / 12 / 24 / 349.5 | 32.0 / 20 / 30 / 231.1 | 18.8 / 4 / 40 / 417.6 | 35.2 / 20 / 36 / 221.6 |
| M7 D-only | 24.4 / 12 / 30 / 315.6 | 33.6 / 20 / 36 / 211.7 | 20.4 / 4 / 40 / 371.2 | 36.8 / 20 / 42 / 208.0 |
| M8 Full PD | 24.0 / 12 / 36 / 321.9 | 34.4 / 20 / 38 / 211.5 | 20.8 / 6 / 38 / 368.8 | 35.2 / 20 / 34 / 222.1 |
| M9 Hybrid | 23.6 / 12 / 34 / 327.1 | 36.0 / 20 / 40 / 201.1 | 20.8 / 6 / 36 / 366.8 | 37.6 / 20 / 40 / 211.9 |
Figure 4.
Accuracy (%) by construction group and configuration.
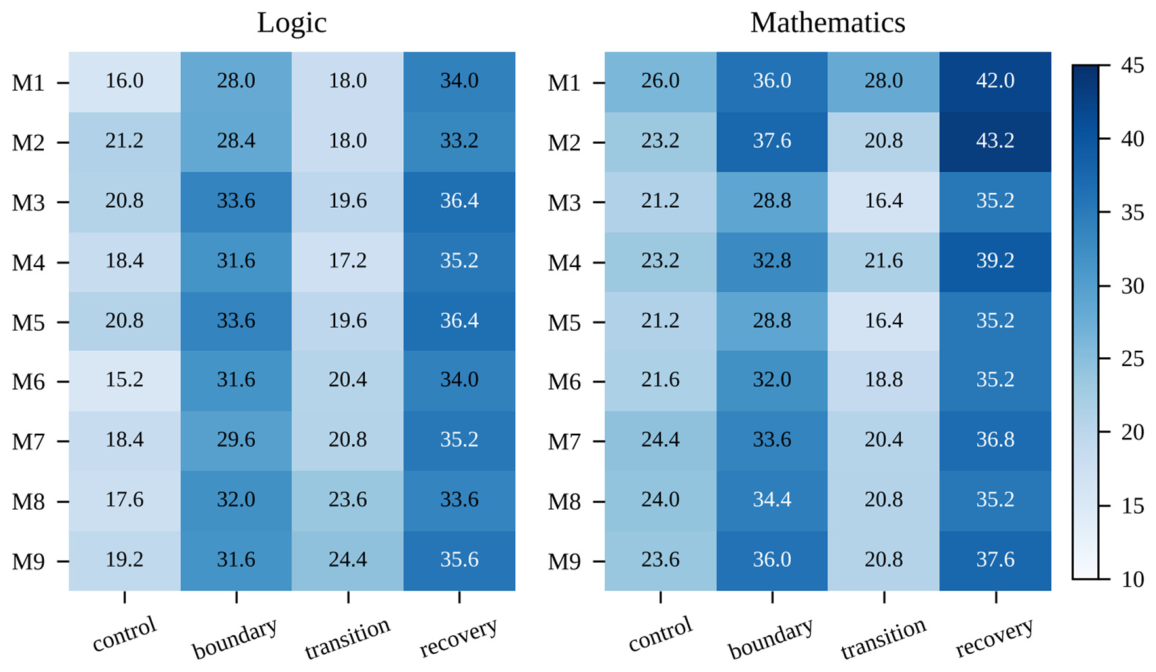
Table 11.
Token statistics: mean generated tokens (± SD over seeds), mean tokens of correct generations, and correct generations out of 1,000.
Table 11.
Token statistics: mean generated tokens (± SD over seeds), mean tokens of correct generations, and correct generations out of 1,000.
| Configuration | Logic tokens (mean ± SD) | Logic tokens of correct gens. | Logic correct / total | Math tokens (mean ± SD) | Math tokens of correct gens. | Math correct / total |
|---|---|---|---|---|---|---|
| M1 Greedy | 59.4 ± 0.0 | 53.54 | 240 / 1000 | 79.8 ± 0.0 | 97.36 | 330 / 1000 |
| M2 Fixed T = 0.2 | 59.7 ± 1.1 | 53.90 | 252 / 1000 | 76.3 ± 1.3 | 93.84 | 312 / 1000 |
| M3 Fixed T = 0.7 | 59.3 ± 2.5 | 57.38 | 276 / 1000 | 73.4 ± 3.7 | 88.11 | 254 / 1000 |
| M4 Entropy threshold | 59.4 ± 2.0 | 56.98 | 256 / 1000 | 75.8 ± 2.5 | 91.84 | 292 / 1000 |
| M5 Mirostat-v2 style | 59.4 ± 2.5 | 57.46 | 276 / 1000 | 73.6 ± 3.6 | 88.11 | 254 / 1000 |
| M6 P-only | 59.3 ± 2.2 | 56.80 | 253 / 1000 | 76.5 ± 1.0 | 93.72 | 269 / 1000 |
| M7 D-only | 59.3 ± 2.2 | 56.15 | 260 / 1000 | 75.1 ± 1.0 | 93.60 | 288 / 1000 |
| M8 Full PD | 59.8 ± 1.8 | 56.24 | 267 / 1000 | 76.2 ± 1.1 | 94.15 | 286 / 1000 |
| M9 Hybrid | 59.8 ± 1.9 | 56.90 | 277 / 1000 | 76.4 ± 1.1 | 92.87 | 295 / 1000 |
Table 12.
Full step-level diagnostics for all configurations. High-
| Domain | Configuration | steps (%) | Mean candidates | Filter active (%) | Removed mass (%) | |||
|---|---|---|---|---|---|---|---|---|
| Logic | M1 Greedy | 0.2511 | 8.33 | 0.0000 | 151,936 | 0.00 | 0.0000 | 0.000 |
| Logic | M2 Fixed T = 0.2 | 0.2644 | 8.95 | 0.2000 | 151,936 | 0.00 | 0.0000 | 0.000 |
| Logic | M3 Fixed T = 0.7 | 0.2754 | 9.63 | 0.7000 | 151,936 | 0.00 | 0.0000 | 0.000 |
| Logic | M4 Entropy threshold | 0.2684 | 9.27 | 0.1597 | 151,936 | 0.00 | 0.0000 | 0.000 |
| Logic | M5 Mirostat-v2 style | 0.2152 | 6.79 | 0.7000 | 24,334.74 | 79.47 | 0.0107 | 26.942 |
| Logic | M6 P-only | 0.2695 | 9.37 | 0.2674 | 151,936 | 0.00 | 0.0000 | 0.000 |
| Logic | M7 D-only | 0.2677 | 9.24 | 0.5025 | 151,936 | 0.00 | 0.0000 | 0.000 |
| Logic | M8 Full PD | 0.2686 | 9.21 | 0.2696 | 151,936 | 0.00 | 0.0000 | 0.000 |
| Logic | M9 Hybrid | 0.2635 | 8.98 | 0.2684 | 1.23 | 49.72 | 0.3544 | 0.000 |
| Math | M1 Greedy | 0.2734 | 10.55 | 0.0000 | 151,936 | 0.00 | 0.0000 | 0.000 |
| Math | M2 Fixed T = 0.2 | 0.2777 | 10.56 | 0.2000 | 151,936 | 0.00 | 0.0000 | 0.000 |
| Math | M3 Fixed T = 0.7 | 0.2982 | 11.42 | 0.7000 | 151,936 | 0.00 | 0.0000 | 0.000 |
| Math | M4 Entropy threshold | 0.2882 | 11.01 | 0.1695 | 151,936 | 0.00 | 0.0000 | 0.000 |
| Math | M5 Mirostat-v2 style | 0.2314 | 7.42 | 0.7000 | 36,131.88 | 73.46 | 0.0091 | 30.840 |
| Math | M6 P-only | 0.2846 | 10.90 | 0.2712 | 151,936 | 0.00 | 0.0000 | 0.000 |
| Math | M7 D-only | 0.2892 | 11.15 | 0.5020 | 151,936 | 0.00 | 0.0000 | 0.000 |
| Math | M8 Full PD | 0.2854 | 10.93 | 0.2734 | 151,936 | 0.00 | 0.0000 | 0.000 |
| Math | M9 Hybrid | 0.2852 | 10.90 | 0.2733 | 1.25 | 48.30 | 0.4137 | 0.000 |
steps are the share of steps with nats. For M5 the logged entropy is the full-vocabulary entropy of the distribution rather than the top-five entropy.
Figure 5.
Family-level accuracy of M3, M8 and M9 in each domain, computed from item-by-seed records.
Figure 5.
Family-level accuracy of M3, M8 and M9 in each domain, computed from item-by-seed records.
Appendix F. Token-Level Trace
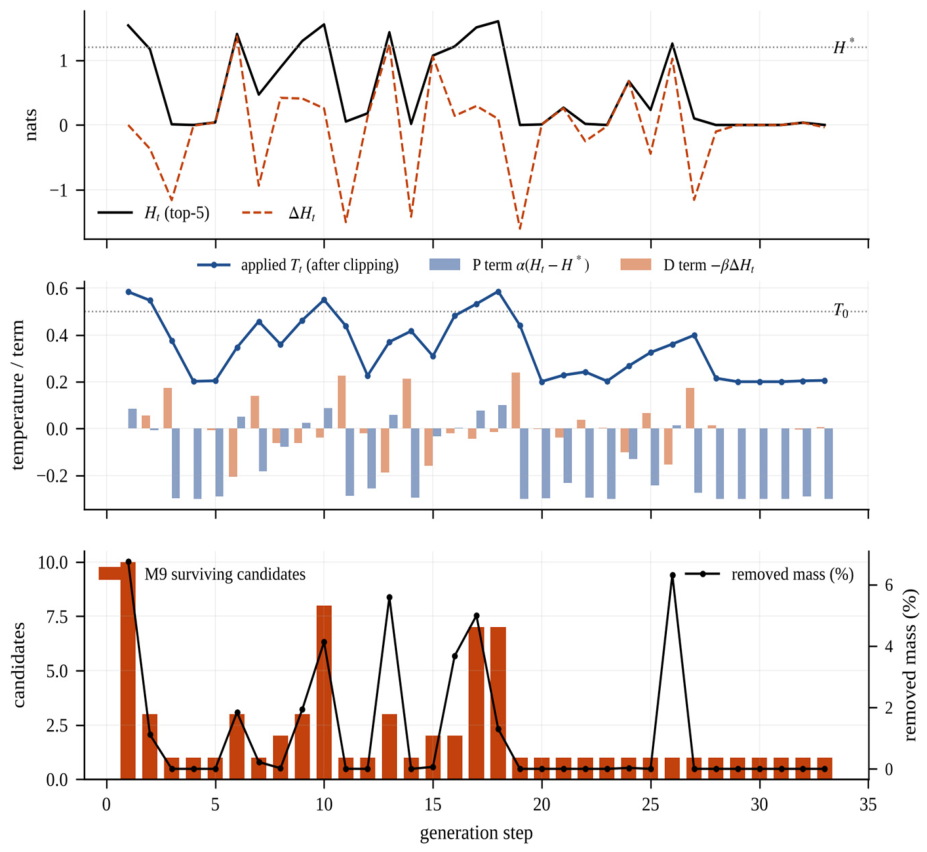
Figure 6 shows the first logged generation of M8 on a logic item (LOGIC_01, variant 1), for which M9 produced the same token sequence. The top panel shows and ; the middle panel shows the proportional and derivative contributions and the applied temperature, which falls to the lower range whenever the model is confident; the bottom panel shows the number of candidates that survive the M9 cutoff and the removed probability mass. The trace illustrates the mechanism and is not evidence of an effect on accuracy.
Figure 6.
Token-level trace of the controller on one logic generation. P and D contributions are computed from the logged and with the constants of Section 3.
Figure 6.
Token-level trace of the controller on one logic generation. P and D contributions are computed from the logged and with the constants of Section 3.
Appendix G. Exploratory Same-Prefix Probe
After the main benchmark, we ran an exploratory probe (labelled V15) that forked M8 and M9 generations from shared prefixes. Across 211 valid logic forks and 227 valid mathematics forks, the item-average M9 − M8 correctness differences were −1.28 and +0.50 percentage points with family-bootstrap intervals [−3.33, 0.00] and [−0.83, 2.00]. The mean removed probability mass at the fork point was 0.327% and 0.650%, and first-token divergence was 0% and 0.88%. Because the probe used selected prefix positions and has unresolved concerns about common-random-number alignment after the fork, we report it only as a sensitivity observation.
Appendix H. Licenses of Existing Assets
Qwen2.5-3B-Instruct is distributed under the Qwen Research License (listed as “qwen-research” on the model card) [17]. PyTorch is released under a BSD-style license [18] and Hugging Face Transformers under the Apache 2.0 license [19]. The benchmark items, code and results released with this paper are available under the MIT license at https://github.com/enkiluv/thermo_pulse; the items were generated programmatically and contain no personal data.
References
- Vaswani, Ashish; Shazeer, Noam; Parmar, Niki; Uszkoreit, Jakob; Jones, Llion; Gomez, Aidan N.; Kaiser, Łukasz; Polosukhin, Illia. Attention is all you need. Adv. Neural Inf. Process. Syst. 30 2017. [Google Scholar] [CrossRef]
- Wei, Jason; Wang, Xuezhi; Schuurmans, Dale; Bosma, Maarten; Ichter, Brian; Xia, Fei; Chi, Ed; Le, Quoc; Zhou, Denny. Chain-of-thought prompting elicits reasoning in large language models. Adv. Neural Inf. Process. Syst. 35 2022, 24824–24837. [Google Scholar] [CrossRef]
- Wang, Xuezhi; Wei, Jason; Schuurmans, Dale; Le, Quoc; Chi, Ed; Narang, Sharan; Chowdhery, Aakanksha; Zhou, Denny. Self-consistency improves chain of thought reasoning in language models. International Conference on Learning Representations, 2023. [Google Scholar]
- Fan, Angela; Lewis, Mike; Dauphin, Yann. Hierarchical neural story generation. Proc. 56th Annu. Meet. Assoc. Comput. Linguist. 2018, Volume 1, pages 889–898. [Google Scholar]
- Holtzman, Ari; Buys, Jan; Du, Li; Forbes, Maxwell; Choi, Yejin. The curious case of neural text degeneration. International Conference on Learning Representations, 2020. [Google Scholar]
- Meister, Clara; Pimentel, Tiago; Wiher, Gian; Cotterell, Ryan. Locally typical sampling. Trans. Assoc. Comput. Linguist. 2023, 11, 102–121. [Google Scholar] [CrossRef]
- Nguyen, Minh Nhat; Baker, Andrew; Neo, Clement; Roush, Allen; Kirsch, Andreas; Shwartz-Ziv, Ravid. Turning up the heat: Min-p sampling for creative and coherent LLM outputs. International Conference on Learning Representations, 2025. [Google Scholar]
- Basu, Sourya; Ramachandran, Govardana Sachitanandam; Keskar, Nitish Shirish; Varshney, Lav R. Mirostat: A neural text decoding algorithm that directly controls perplexity. International Conference on Learning Representations, 2021. [Google Scholar]
- Zhang, Shimao; Bao, Yu; Huang, Shujian. EDT: Improving large language models’ generation by entropy-based dynamic temperature sampling. arXiv 2024, arXiv:2403.14541. [Google Scholar]
- Zhu, Yuqi; Li, Jia; Li, Ge; Zhao, YunFei; Li, Jia; Jin, Zhi; Mei, Hong. Hot or cold? Adaptive temperature sampling for code generation with large language models. In Proceedings of the AAAI Conference on Artificial Intelligence, 2024; volume 38. [Google Scholar]
- Åström, Karl Johan; Murray, Richard M. Feedback Systems: An Introduction for Scientists and Engineers, second edition; Princeton University Press, 2021. [Google Scholar]
- Jaynes, Edwin T. Information theory and statistical mechanics. Phys. Rev. 1957, 106(4), 620–630. [Google Scholar] [CrossRef]
- Ackley, David H.; Hinton, Geoffrey E.; Sejnowski, Terrence J. A learning algorithm for Boltzmann machines. Cogn. Sci. 1985, 9(1), 147–169. [Google Scholar] [CrossRef]
- Hewitt, John; Manning, Christopher D.; Liang, Percy. Truncation sampling as language model desmoothing. Findings of the Association for Computational Linguistics: EMNLP 2022, 2022. [Google Scholar]
- Arora, Kushal; O’Donnell, Timothy J.; Precup, Doina; Weston, Jason; Cheung, Jackie C. K. The stable entropy hypothesis and entropy-aware decoding: An analysis and algorithm for robust natural language generation. arXiv 2023, arXiv:2302.06784. [Google Scholar]
- Kirkpatrick, Scott; Gelatt, C. Daniel; Vecchi, Mario P. Optimization by simulated annealing. Science 1983, 220(4598), 671–680. [Google Scholar] [CrossRef]
- Qwen; Yang, An; Yang, Baosong; Zhang, Beichen; Hui, Binyuan; Zheng, Bo; Yu, Bowen; et al. (Eds.) Qwen2.5 technical report. In arXiv; 2024. [Google Scholar]
- Paszke, Adam; Gross, Sam; Massa, Francisco; Lerer, Adam; Bradbury, James; Chanan, Gregory; et al. PyTorch: An imperative style, high-performance deep learning library. In Advances in Neural Information Processing Systems 32; 2019; pp. pages 8024–8035. [Google Scholar]
- Wolf, Thomas; Debut, Lysandre; Sanh, Victor; Chaumond, Julien; Delangue, Clement; Moi, Anthony; et al. Transformers: State-of-the-art natural language processing. In Proceedings of the 2020 Conference on Empirical Methods in Natural Language Processing: System Demonstrations, 2020; pp. pages 38–45. [Google Scholar]
- Efron, Bradley; Tibshirani, Robert J. An Introduction to the Bootstrap; Chapman & Hall/CRC, 1993. [Google Scholar]
- Cameron, Colin; Gelbach, Jonah B.; Miller, Douglas L. Bootstrap-based improvements for inference with clustered errors. Rev. Econ. Stat. 2008, 90(3), 414–427. [Google Scholar] [CrossRef]
- Holm, Sture. A simple sequentially rejective multiple test procedure. Scand. J. Stat. 1979, 6(2), 65–70. [Google Scholar]
- Dror, Rotem; Baumer, Gili; Shlomov, Segev; Reichart, Roi. The hitchhiker’s guide to testing statistical significance in natural language processing. Proc. 56th Annu. Meet. Assoc. Comput. Linguist. 2018, Volume 1, pages 1383–1392. [Google Scholar]
- McNemar, Quinn. Note on the sampling error of the difference between correlated proportions or percentages. Psychometrika 1947, 12(2), 153–157. [Google Scholar] [CrossRef]
- Cobbe, Karl; Kosaraju, Vineet; Bavarian, Mohammad; Chen, Mark; Jun, Heewoo; Kaiser, Lukasz; et al. Training verifiers to solve math word problems. arXiv 2021, arXiv:2110.14168. [Google Scholar]
- Bergstra, James; Bengio, Yoshua. Random search for hyper-parameter optimization. J. Mach. Learn. Res. 2012, 13, 281–305. [Google Scholar]
- Kwon, Woosuk; Li, Zhuohan; Zhuang, Siyuan; Sheng, Ying; Zheng, Lianmin; Yu, Cody Hao; Gonzalez, Joseph E.; Zhang, Hao; Stoica, Ion. Efficient memory management for large language model serving with PagedAttention. In Proceedings of the 29th Symposium on Operating Systems Principles, 2023; pp. pages 611–626. [Google Scholar]
Figure 1.
Thermo Pulse control loop. Logits at step
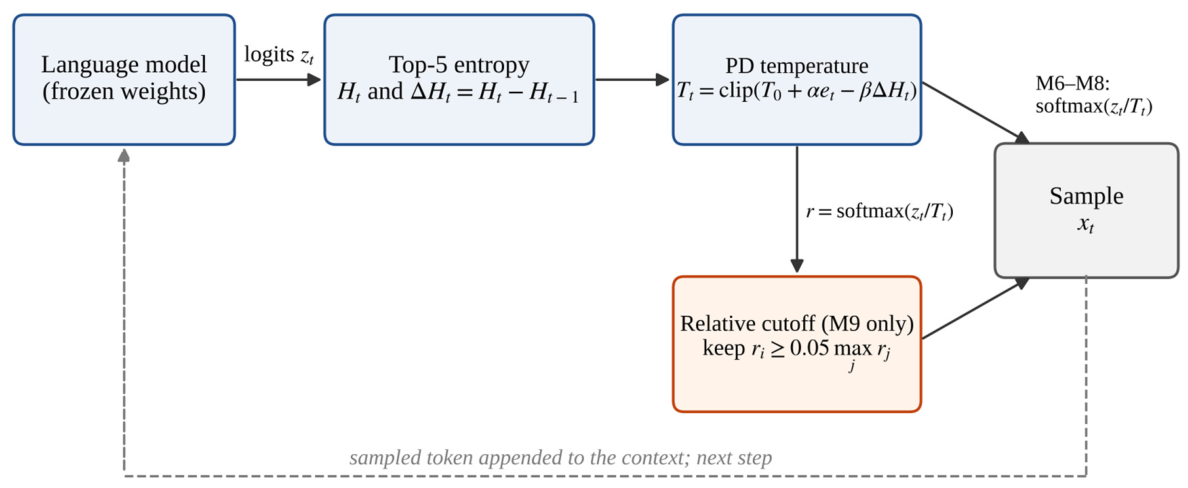
Figure 2.
Accuracy versus tokens per correct answer. Error bars show the standard deviation of accuracy over five seeds (zero for greedy decoding, which is deterministic here). Lower TPCA and higher accuracy are better.
Figure 2.
Accuracy versus tokens per correct answer. Error bars show the standard deviation of accuracy over five seeds (zero for greedy decoding, which is deterministic here). Lower TPCA and higher accuracy are better.
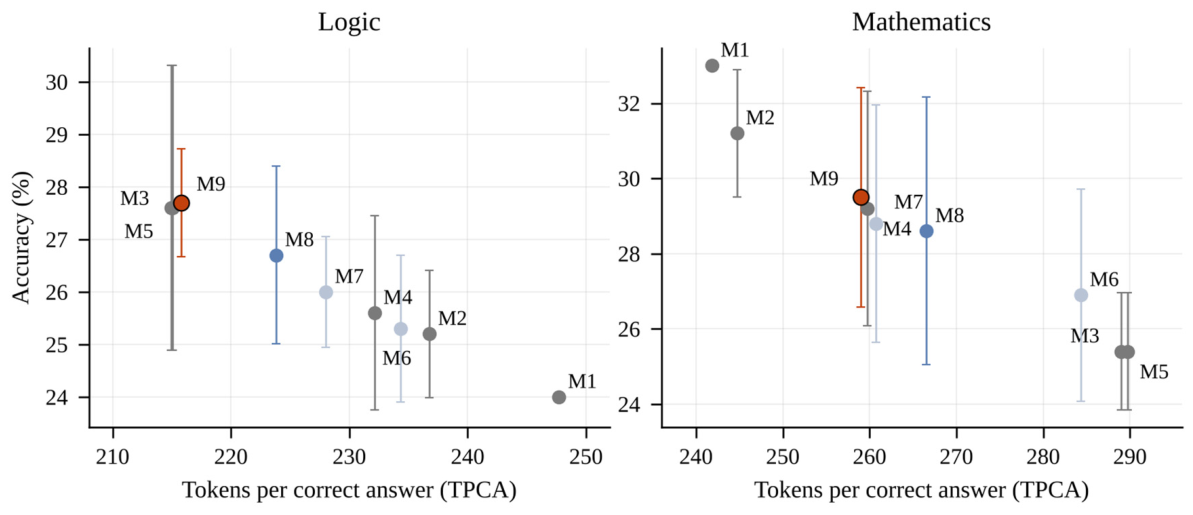
Figure 3.
Paired accuracy differences between M9 and each comparator with family-cluster bootstrap 95% intervals. Squares mark the four prespecified primary contrasts; circles are exploratory and unadjusted.
Figure 3.
Paired accuracy differences between M9 and each comparator with family-cluster bootstrap 95% intervals. Squares mark the four prespecified primary contrasts; circles are exploratory and unadjusted.
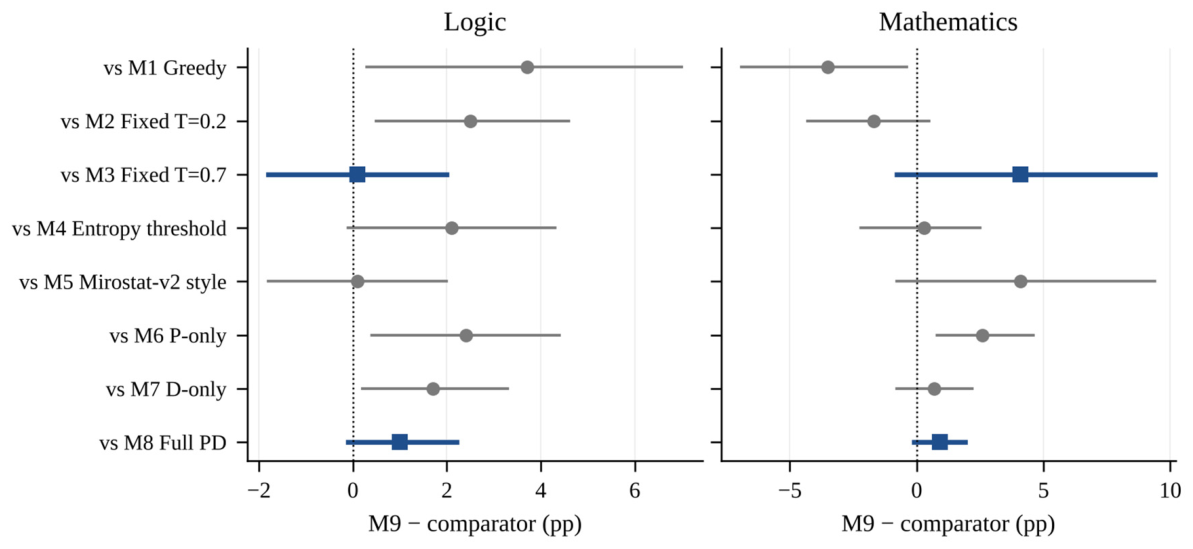
Table 1.
Decoding configurations. All constants were fixed before the benchmark run.
| ID | Configuration | Operational definition |
|---|---|---|
| M1 | Greedy | selection |
| M2 | Fixed low | |
| M3 | Fixed standard | |
| M4 | Entropy threshold | , , for , , |
| M5 | Mirostat-v2 style | bits, , base ; adaptive surprise cutoff |
| M6 | P-only | |
| M7 | D-only | |
| M8 | Full PD | Equation (2) |
| M9 | Hybrid | Equation (2) followed by the 5%-of-maximum relative cutoff |
Table 2.
Accuracy (mean ± standard deviation over five seeds), mean generated tokens, and tokens per correct answer (TPCA). Bold marks the highest accuracy in each domain.
Table 2.
Accuracy (mean ± standard deviation over five seeds), mean generated tokens, and tokens per correct answer (TPCA). Bold marks the highest accuracy in each domain.
| Configuration | Logic acc. (%) | Logic tokens | Logic TPCA | Math acc. (%) | Math tokens | Math TPCA |
|---|---|---|---|---|---|---|
| M1 Greedy | 24.0 ± 0.0 | 59.4 | 247.71 | 33.0 ± 0.0 | 79.8 | 241.80 |
| M2 Fixed T = 0.2 | 25.2 ± 1.2 | 59.7 | 236.73 | 31.2 ± 1.7 | 76.3 | 244.70 |
| M3 Fixed T = 0.7 | 27.6 ± 2.7 | 59.3 | 214.94 | 25.4 ± 1.6 | 73.4 | 289.00 |
| M4 Entropy threshold | 25.6 ± 1.9 | 59.4 | 232.12 | 29.2 ± 3.1 | 75.8 | 259.75 |
| M5 Mirostat-v2 style | 27.6 ± 2.7 | 59.4 | 215.04 | 25.4 ± 1.6 | 73.6 | 289.74 |
| M6 P-only | 25.3 ± 1.4 | 59.3 | 234.30 | 26.9 ± 2.8 | 76.5 | 284.33 |
| M7 D-only | 26.0 ± 1.1 | 59.3 | 228.01 | 28.8 ± 3.2 | 75.1 | 260.76 |
| M8 Full PD | 26.7 ± 1.7 | 59.8 | 223.80 | 28.6 ± 3.6 | 76.2 | 266.52 |
| M9 Hybrid | 27.7 ± 1.0 | 59.8 | 215.82 | 29.5 ± 2.9 | 76.4 | 258.95 |
Table 3.
Prespecified primary contrasts (percentage points). Intervals are bootstrap 95% intervals; the sign-flip test resamples families; Holm adjusts over the four tests.
Table 3.
Prespecified primary contrasts (percentage points). Intervals are bootstrap 95% intervals; the sign-flip test resamples families; Holm adjusts over the four tests.
| Domain | Contrast | Δ acc. (pp) | Family-cluster 95% CI | Question 95% CI | Sign-flip p | Holm p |
|---|---|---|---|---|---|---|
| Logic | M9 − M3 | +0.1 | [-1.8, 2.0] | [-2.4, 2.6] | 1.000 | 1.000 |
| Logic | M9 − M8 | +1.0 | [-0.1, 2.2] | [-0.1, 2.1] | 0.171 | 0.609 |
| Math | M9 − M3 | +4.1 | [-0.8, 9.4] | [1.3, 7.0] | 0.155 | 0.609 |
| Math | M9 − M8 | +0.9 | [-0.1, 1.9] | [-0.1, 1.9] | 0.152 | 0.609 |
Table 4.
Step-level diagnostics averaged over instrumented generation steps. Candidates are surviving vocabulary entries (151,936 means no truncation). Removed mass is the pre-cutoff probability of excluded tokens. For M5, is the full-vocabulary entropy at (Appendix E, Table 12).
Table 4.
Step-level diagnostics averaged over instrumented generation steps. Candidates are surviving vocabulary entries (151,936 means no truncation). Removed mass is the pre-cutoff probability of excluded tokens. For M5, is the full-vocabulary entropy at (Appendix E, Table 12).
| Domain | Configuration | Mean candidates | Filter active (%) | Removed mass (%) | (bits) | ||
|---|---|---|---|---|---|---|---|
| Logic | M3 Fixed T = 0.7 | 0.700 | 0.275 | 151,936 | 0.00 | 0.000 | — |
| Logic | M5 Mirostat-v2 style | 0.700 | 0.215 | 24,334.74 | 79.47 | 0.011 | 26.9 |
| Logic | M8 Full PD | 0.270 | 0.269 | 151,936 | 0.00 | 0.000 | — |
| Logic | M9 Hybrid | 0.268 | 0.264 | 1.23 | 49.72 | 0.354 | — |
| Math | M3 Fixed T = 0.7 | 0.700 | 0.298 | 151,936 | 0.00 | 0.000 | — |
| Math | M5 Mirostat-v2 style | 0.700 | 0.231 | 36,131.88 | 73.46 | 0.009 | 30.8 |
| Math | M8 Full PD | 0.273 | 0.285 | 151,936 | 0.00 | 0.000 | — |
| Math | M9 Hybrid | 0.273 | 0.285 | 1.25 | 48.30 | 0.414 | — |
Disclaimer/Publisher’s Note: The statements, opinions and data contained in all publications are solely those of the individual author(s) and contributor(s) and not of MDPI and/or the editor(s). MDPI and/or the editor(s) disclaim responsibility for any injury to people or property resulting from any ideas, methods, instructions or products referred to in the content. |
© 2026 by the authors. Licensee MDPI, Basel, Switzerland. This article is an open access article distributed under the terms and conditions of the Creative Commons Attribution (CC BY) license (http://creativecommons.org/licenses/by/4.0/).
Copyright: This open access article is published under a Creative Commons CC BY 4.0 license, which permit the free download, distribution, and reuse, provided that the author and preprint are cited in any reuse.