

Submitted:
02 November 2026
Posted:
04 November 2026
You are already at the latest version
Abstract
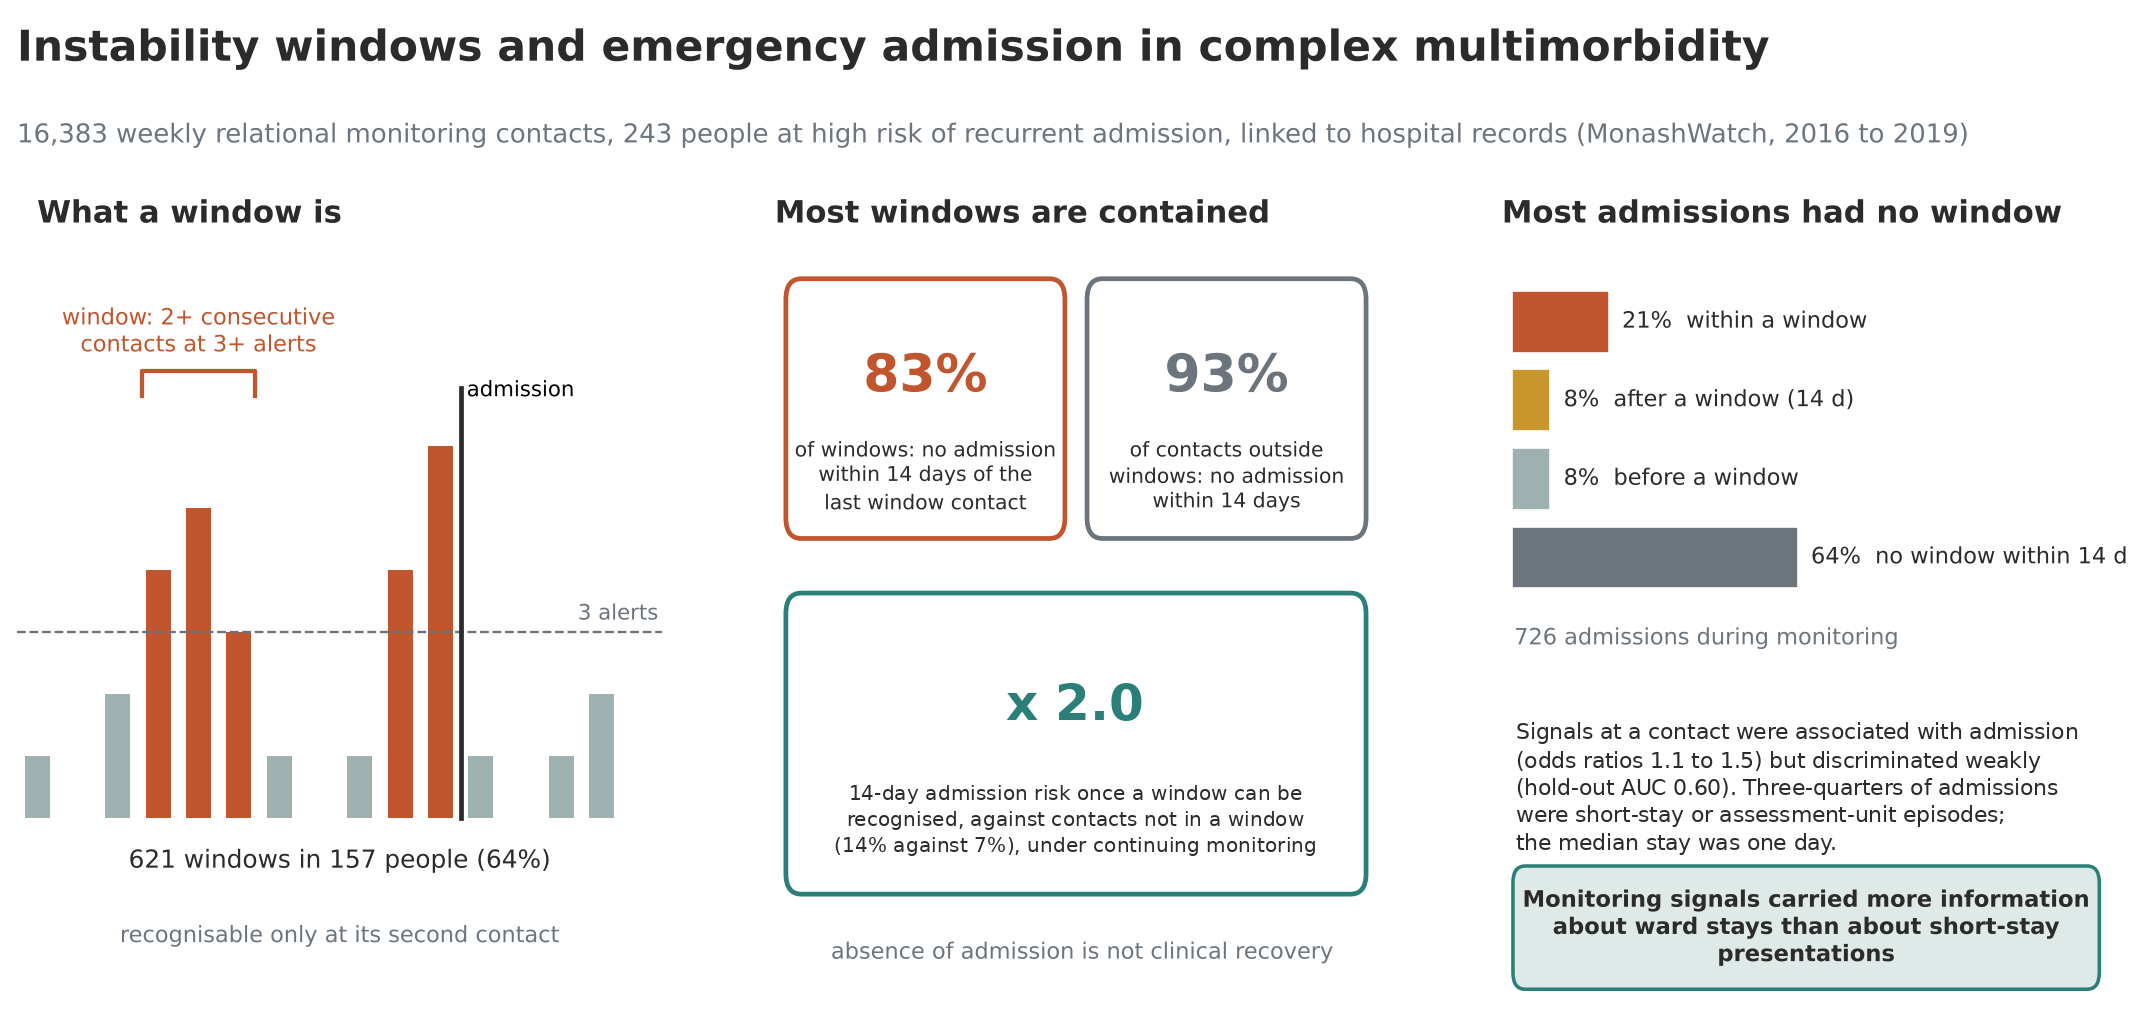
How often periods of instability in complex multimorbidity pass without hospital admission has not been quantified at scale. We analysed 16,383 structured telephone monitoring contacts from 243 people at high predicted risk of recurrent hospitalisation in the MonashWatch programme (2016 to 2019), linked to 1,698 emergency admission events. An instability window was defined as two or more consecutive contacts each recording three or more alerts; 621 windows were detected in 157 participants. Of 540 windows with a determined outcome, 83.0% (participant-level bootstrap 95% CI 78.7 to 86.8) had no recorded emergency admission within 14 days, against 93.3% of contacts outside windows. Classing each contact using only what was known at that point, admission within 14 days followed 13.8% of contacts at which a window could first be recognised, against 6.9% of contacts not in a recognised window (ratio 1.99, 95% CI 1.54 to 2.47). Of 726 admissions during monitoring, 21% fell within a window and 64% had no window within 14 days. After truncation at admission, the specified analyses did not demonstrate differences in window duration or breadth between windows followed by admission and other windows. Monitoring signals were each associated with admission (odds ratios 1.08 to 1.45), but a joint model discriminated weakly (mean hold-out AUC 0.60 across 200 participant-level splits). Detected instability marks a period of roughly doubled short-term risk in which most people are not admitted. Absence of a recorded admission is not clinical recovery, and whether monitoring averted admissions cannot be determined from these data.
Keywords:
complex adaptive systems
; multimorbidity
; instability
; patient trajectories
; relational monitoring
; telehealth
; hospital admission
; outcome definition
; time-to-event analysis
1. Introduction
An instability-plasticity theory for longitudinal care in high-need, high-cost (HNHC) patients with complex multimorbidity was proposed in a companion paper in this journal [1]. The theory holds that care trajectories in this population do not progress in a straight line. They move through phases in which the person’s usual state is maintained, phases of instability, and critical transitions. Three terms are used in this paper, each at a different level. At the level of the monitoring record, a window with no recorded emergency admission within the outcome horizon is called contained and a window followed by admission is called escalated. Contained is operational shorthand for no recorded Monash Health emergency admission within the specified horizon. It does not imply confirmed residence at home, preserved physiological regulation or a successful intervention. At the level of the person’s regulation over days and weeks, the relevant concept is homeokinesis: stability as a dynamic state of fluctuation within limits, rather than a fixed set point [2]. At the level of the trajectory over months and years, the relevant concept is homeorhesis: return to a path rather than to a point [3]. In complex multimorbidity the path is itself declining, so a person can be stable in this sense while getting worse. Acute-on-chronic deterioration and critical slowing down are properties of this level, not of a single window.
The framework starts from the observation that not all instability phases end in admission. From that it hypothesises plasticity: a trajectory in an instability phase can take more than one path, either because it is susceptible to intervention or because it self-stabilises and returns to the maintained state. That hypothesis was not tested in the companion paper and is not tested here. What can be examined at scale in a monitoring cohort is the pattern of instability in relation to admission: how often detected instability is followed by admission, how that compares with periods outside detected instability, where admissions fall relative to detected windows, what distinguishes windows that escalate, and how monitoring signals behave around and before the admissions that occur. That pattern has not been reported for a real-world monitoring cohort.
This paper works at three levels of description (Figure 1). An instability phase is a theoretical construct: a period during which a person’s physiological, functional and social systems have reduced capacity to absorb disturbance. An episode of deterioration is a clinical entity: a period during which a person is unwell relative to their own usual state, receives care, and either returns towards that state or does not. Clinicians recognise episodes routinely, but their boundaries are set by judgement and, in complex multimorbidity, often overlap. An instability window is an operational unit: a run of two or more consecutive monitoring contacts each recording three or more alerts, fully specified and reproducible from the data. The three do not coincide. A window is detected only where contacts fall within an episode, so it is generally shorter than the episode, and brief episodes may be missed. A phase may contain several episodes. Where this paper reports numbers, the unit is the window, the contact or the admission, and the text says which. Where it interprets them, the referent is the phase, and the text says so.
Research on trajectories in complex multimorbidity sits between two traditions with different units of analysis. Clinical and complexity-informed work takes the individual trajectory as primary, treats context and history as part of the phenomenon, and asks what is happening to this person now. Statistical inference takes the population as primary and asks what can be asserted about it from a sample, with stated uncertainty. Both are needed here, and they impose different obligations. The clinical tradition requires that constructs correspond to something a clinician would recognise. The statistical tradition requires that every claim be traceable to a defined measurement and an estimated quantity. In this paper findings are reported at the level of the operational window, contact or admission, with the estimation conventions those levels require. Interpretation is offered at the level of the phase and the episode, and is identified as interpretation.
The wider evidence supports the need for this grounding. HNHC populations are heterogeneous and poorly predicted by administrative or baseline clinical variables [4,5]. In a cohort of 224,285 HNHC patients in British Columbia, five cost trajectory groups were identified and administrative data could not predict group membership [4]. Patient-reported data added only modestly to prediction in the same population (combined AUC 0.72) [6], and readmission risk models in general discriminate modestly [7]. Systematic reviews of interventions for HNHC patients report inconsistent effects on utilisation and cost [8]. A randomised trial of intensive care management for very frequent hospital users found no effect on readmission, with large falls in utilisation in both arms, as regression to the mean would predict [9]. Trials of telemonitoring in older people with several conditions have given mixed results [10,11]. Realist synthesis identifies the lack of a mechanistic account of how relational engagement changes trajectories as an explanatory gap [12], and an international consensus statement has called for multimorbidity research to study trajectories over time [13].
The MonashWatch programme applied this form of monitoring to people at high predicted risk of recurrent hospitalisation within Monash Health, Victoria, Australia. Using the Patient Journey Record (PaJR) system, trained peer navigators made structured telephone contacts at approximately weekly intervals, recording patient-reported concerns across six domains together with their own rating of concern [14,15,16]. The system is sociotechnical by design: the structured alert data sit alongside what navigators come to know about each person across repeated contacts, and a supervising general practitioner reviews what is escalated. The programme was designed as a relational support and sensing service, not as an early-warning tool, and the present analysis describes what it detected rather than evaluating it against a prediction standard.
This paper examines, in a full monitoring cohort, the pattern of instability in relation to admission on which the instability-plasticity theory rests [1]. The theory was developed partly from PaJR monitoring data from Australian and Irish cohorts, and the present analysis uses the Australian cohort. It is therefore a more formal evaluation on overlapping data, not an independent external validation. The aims were to: (1) quantify how often detected instability windows are followed by emergency admission, and compare that with monitoring contacts outside windows; (2) tabulate, with the admission as the unit, where admissions fell relative to detected windows; (3) determine whether window characteristics measured before an admission distinguish windows that are followed by admission; and (4) describe how monitoring signals behave before admission, both looking back from admissions that occurred and looking forward from every contact in the monitoring record. Earlier MonashWatch reports [14,16,17] took the patient or the admission as the unit; this analysis takes the instability window as a unit and reports what followed detected deterioration when no admission occurred. It differs from the companion paper [1] in being empirical. It also re-examines, in the unselected cohort, an association previously observed in a pilot extract.
2. Materials and Methods
2.1. Study Design and Setting
This was a retrospective observational cohort study of telephone monitoring data linked to emergency department (ED) and hospital admission records from the MonashWatch PaJR programme within Monash Health, Victoria, Australia. MonashWatch was implemented under the Victorian HealthLinks: Chronic Care initiative [18]. Under that initiative, eligibility was determined by a case-finding algorithm applied to the Victorian Admitted Episodes Dataset and the Victorian Emergency Minimum Dataset when a person presented to a participating health service. The algorithm selected people with a predicted probability of 30% or more of three or more unplanned, potentially preventable hospital admissions in the following 12 months, on the basis of an unplanned admission in the preceding 6 months or an ED presentation in the preceding 3 months and high cumulative utilisation over the preceding 12 months. The conditions that drive potentially preventable admissions dominate the cohort: advanced chronic obstructive pulmonary disease and asthma with heart failure, diabetes with progressive chronic kidney disease, and severe inflammatory, hepatic and digestive disease. People whose care was directed by active cancer treatment, advanced dementia or severe mental illness requiring psychiatric inpatient care were excluded. The term high-need, high-cost is used in this paper in that programmatic sense. Individual healthcare cost was not measured, and no cost outcome is reported.
All people consecutively enrolled between December 2016 and August 2017 were included, and monitoring continued until July 2019. The extract contains 244 enrolment records. One person was enrolled twice under two programme identifiers, so the 244 records correspond to 243 individuals. No record was excluded and every record has at least one monitoring contact. Participant-level counts in the window analyses use the enrolment record as the unit; analyses clustered on the hashed patient identifier use the individual. Ethics approval was granted by the Monash Health Human Research Ethics Committee (reference RES-16-0000522L). Records were linked across datasets by hashed unit record identifiers, and no identifiable data were accessed.
2.2. The PaJR Monitoring System
PaJR is a web-based monitoring platform that supports structured telephone contacts between trained peer navigators and enrolled participants [14,15,19]. Navigators were termed Guides or operators in earlier descriptions; the role is unchanged. The monitoring domains are grounded in a biopsychosocial and environmental model of health integrated with complex adaptive systems theory [19,20]. Each contact records information across six domains: illness and symptoms, medication, health care, social support, environmental circumstances, and self-care. Within each domain, responses generate flags graded green (no concern), amber, continuous red, urgent red and immediate red. Total Alerts is the number of non-green flags at a contact across all domains. Red alerts is the number of urgent and immediate red flags. The Health Care domain is flagged by responses about health care: an unmet need for care, care the person intends to seek, or care already received, including ED attendance, hospital admission and general practice. A contact made shortly after an admission can therefore carry flags generated by that admission. Because this bears on any analysis of alert burden around admission, every window, time-to-event and prospective analysis was repeated with this domain removed from Total Alerts, red alerts and the breadth indices (Section 2.6).
Calls are semi-structured. Each call opens with open-ended narrative, which continues alongside the structured items. Twelve brief opener items are asked at every call, covering concerns today (Q1), symptoms, self-rated health (Q3, 0 to 5, higher is worse), change in health, health care or medication, carer concerns (Q8) and the other domains. A positive opener opens the matching detailed item set; a navigator can also open a set where the narrative indicates concern. The instrument records by exception: medication concerns (Q7) and the detailed items Q23 to Q25 have a stored default of no problem, so a blank there may mean that no problem was raised; Q21 and Q26 have no stored default, and Q1, Q3, Q8 and Q34 are compulsory. Q1 does not gate any other item. In these data, the detailed items on expected health over the next few days (Q21), eating, drinking and toileting (Q23), outdoor activity (Q24), sleep (Q25) and the health score (Q26, analysed as 9 minus the raw score so that higher is worse) were recorded at 71% to 85% of contacts at which the participant reported a concern at Q1 and at 19% to 24% of contacts at which they did not. Medication concerns (Q7) were recorded at 85% of contacts regardless of Q1. Q1, Q3, Q8 and the navigator’s own rating of concern (Q34) were recorded at 99.7% to 100% of contacts, and blanks on those items were treated as missing. Each call ends with Q34 and the navigator’s record of any response. The call structure is described in [19].
Two consequences follow from recording by exception. First, depth of assessment is part of the severity measure by design: more concerning contacts open more items and can generate more flags, and they are longer (median call length 282 s at contacts with no alerts and 992 s at contacts with six or more). Total Alerts and the multi-domain indices are severity-scaled composites and should not be read as counts of independently assessed domains. Second, the item-level analyses of Q7 and Q23 to Q25 were run twice: on recorded responses only, which is the primary basis, and with blanks set to the no-problem default as a sensitivity analysis. Q21 has no default, and its blanks were left missing in both; Q3 and Q26 are graded scales and were not recoded. Q26 has no stored default: at the 5,130 contacts where both were recorded, Q26 equalled the Q3 value at only 5.7% of them (Spearman’s rho with Q3, −0.66), so Q26 blanks were left missing. Item recording rates are given in Table S5.
Two multi-domain indices were calculated. Red-domain breadth is the number of the six domains with at least one urgent or immediate red flag at a contact. Any-domain breadth is the number of domains with at least one amber or red flag. A domain counts once however many flags it carries, the denominator is always six, and a domain with no flag counts as zero. For a window, each index is the mean across the contacts in the window.
2.3. Data Sources, Event Definition and Units of Analysis
Three units of analysis are used and are kept distinct throughout: the monitoring contact, the instability window, and the emergency admission (Table 1, Figure 2). The monitoring extract holds 16,383 contacts. The hospital extracts hold Monash Health ED presentations from 2 July 2016 to 21 July 2019, and admission episodes for the same individuals; events are limited to the ED extract’s date range. Presentations to other health services are not included.
One event definition is used in every analysis. An emergency admission event is either an ED presentation with a departure status of admission to a ward, medical assessment and planning unit, short stay observation unit, coronary care, intensive care or operating theatre, or an admission recorded in the admissions file as an emergency admission not through this site’s ED (type O) with no admitted ED presentation within one day. Elective admissions, maternity and statistical admissions, transfers to another campus (including coronary care at another campus), the cardiac catheter laboratory, discharge to residential care and mental health bed episodes are never events. Events are dated by the Melbourne calendar date of ED arrival, or of admission for type O records, and one event is counted per person per day. The hospital extract held 2,219 ED presentations, of which 1,665 had an admitted departure status. Of 61 type O records examined, 17 matched an admitted ED presentation, one preceded the ED extract and 43 were added. Five admissions-file records of admission through the ED with no admitted ED presentation within one day were not counted. After 10 same-day duplicates were merged, there were 1,698 events. Emergency short stay episodes are counted as admissions in the primary definition. Because short stay and assessment-unit episodes made up most admissions, every principal estimate was repeated with the event set restricted to ward admissions (short stay observation unit excluded: 627 events) and to ward admissions excluding the medical assessment and planning unit as well (424 events). Of the 1,698 events, 726 occurred between a participant’s first and last monitoring contact, 709 before the first contact and 263 after the last. Where an admission is dated to a ward admission in the admissions file, linked ED events had a median of 4.0 hours from ED arrival to ward admission (events with admission 0 to 24 hours after arrival, n = 1,633).
The extracts do not contain programme exit dates or dates of death in the community. Deaths in hospital were identified from the separation mode of the admission record. Exit from the programme was inferred for sensitivity analysis: a participant whose last contact preceded the extract date by more than their own longest gap between contacts was treated as having left the programme, with an exit date of the last contact plus that longest gap; participants whose last contact was within 30 days of the extract date were treated as still active. No field in the analysis extract recorded a clinical action or response: none of the non-flag columns records an action, so actions taken in response to alerts could not be analysed. Diagnoses, prior-year admissions, functional status and socioeconomic indicators were not held in the analysis extracts.
2.4. Identification of Instability Windows
An instability window was defined as a run of two or more consecutive recorded contacts each with Total Alerts of three or more. A run ends at the first contact below the threshold. Runs cannot overlap, and every run from every participant was retained, so participants contribute different numbers of windows. Consecutive means consecutive recorded contacts; in the primary definition no limit was placed on the calendar gap between them. The definition was chosen on clinical grounds as a pragmatic operational unit. It was not registered in advance. Its sensitivity was examined by varying the alert threshold from one to five, the minimum run length from two to four contacts, and the largest permitted gap between contacts (14 days, 21 days or no limit), each under the proximity rule and under the primary truncated rule described below.
Because windows are identified by selecting contacts on a high value of the alert score, some return towards each participant’s own average is expected on statistical grounds alone [21]. The requirement for two consecutive contacts at or above the threshold reduces the contribution of isolated extreme observations. Regression to the mean bears on the proportion of windows not followed by admission, not on the comparisons between windows.
A window is identified retrospectively, since its second contact is needed to know that a run has begun. For analyses that ask what follows a window once it can be recognised, the second elevated contact is therefore the time origin. An admission that falls on or after the date of the first elevated contact and before or on the second is counted as an admission after a single elevated contact, not as a window event. The first contact is used as the origin only for retrospective description.
2.5. Linking Windows to Outcomes
Window outcomes were classified as no acute care contact (no ED attendance and no admission), ED attendance only, emergency admission, or not determined. The outcome is operational, and the word is used in a restricted sense throughout: it is what the hospital record shows in the horizon after the window, observed under continuing monitoring and under whatever response navigators, the supervising general practitioner or the participant made to the window. It is not what the window would have led to without that response. A window followed by no admission may be one in which an admission was averted by the response, one that self-stabilised, or one that was never going to escalate, and the record does not distinguish them. For the same reason, admission is not treated in this paper as the event a window predicts, and a window not followed by admission is not treated as a false positive of detection. Where a two-way summary is needed, windows are described as contained or escalated, as defined in the Introduction.
Linking a window to an admission requires a rule, and the choice matters in this cohort because admissions were frequent and a window can precede, contain or follow one. Three rules were compared. (a) Proximity: a window is linked to an emergency admission that occurs within the horizon of any contact in the window, before or after it. (b) Proximity, with admissions that preceded the first contact of the window not counted. (c) Truncation with forward classification: each window is cut at the first emergency admission that falls within it, contacts on or after the admission date are removed, a truncated window with fewer than two remaining contacts is dropped, and the outcome is an admission within the horizon after the last remaining contact. Rule (c) is the only one under which every contact in the window precedes the outcome. It is the primary rule, and the only basis for any statement that a window was followed by admission. Because it drops windows in which fewer than two contacts preceded the admission, it describes the windows that met the pre-admission observation requirement and not all detected windows; the dropped windows are accounted for separately in the admission-level tabulation (Section 2.6). Rules (a) and (b) are reported because classification by proximity is common when runs of observations are related to events, and because comparison with rule (c) shows how much of an apparent association arises from contacts made after the admission. A forward classification without truncation is reported as a diagnostic only, because it reclassifies windows that contain an admission by whether a further admission follows them. Under rule (a) an admission could be linked to more than one window; the number of unique admissions is reported.
Fourteen days was retained as the primary horizon on clinical grounds. Fourteen and 30 days are the conventional horizons in the readmission literature [7], and a hospital contact beyond the horizon is conventionally treated as a new episode. Every rule was evaluated at 7, 14, 21, 28 and 30 days. Under rule (c) and the diagnostic classification, a window’s outcome was not determined when the horizon extended beyond the participant’s last recorded contact or the end of the hospital extract; under rules (a) and (b) it was not determined only when the window ran to the participant’s last recorded contact and no hospital contact was found. Proportions are reported among windows with a determined outcome. Because participants contribute repeated windows, the principal estimates are reported with a participant-level bootstrap 95% confidence interval (2,000 resamples of participants with replacement, percentile method), and this is the interval given in the Abstract and Highlights. Wilson intervals, which treat windows as independent, are given in the tables and in Figure 3B where labelled, as a secondary description. A death in hospital within the horizon was examined as a separate outcome in a sensitivity analysis.
2.6. Statistical Analysis
Reference rate for admission outside windows. The proportion of windows not followed by admission cannot be interpreted without a reference, since in a cohort admitted several times a year most 14-day intervals of any kind contain no admission. The reference is drawn from the same monitored cohort, so the comparison is between states within monitoring and not between monitoring and its absence; a contact with no alerts is still a relational contact at which support is given. Two reference sets were formed from monitoring contacts outside all of a participant’s windows: all such contacts (reference A), and those with zero alerts (reference B). A forward-only version of reference A returned to it the 326 window contacts made on or after an admission inside their window, which a window built only from contacts before its admission could not include; ratios from the first and second window contacts are reported against it. A third comparison classed every contact using only that contact and earlier ones: outside a recognised window (including the first elevated contact of every run), at a window’s second contact, or later in a window, with a run ended by any admission between two contacts. Contacts not in a recognised window formed the comparison group for this classification. For this comparison each contact was followed from its date to the earliest of 30 days later, the enrolment record’s last contact and the end of the hospital extract, and the probability of an emergency admission by day 14 was estimated by the Kaplan-Meier method. The counts are given in Table S3. From each reference contact the Kaplan-Meier probability of emergency admission by days 7, 14, 21 and 30 was estimated, with follow-up to the earliest of 30 days, the participant’s last contact and the end of the hospital extract, and the proportion with no admission within 14 days was calculated with the same determination rule as rule (c). The same quantities were estimated for windows from the second elevated contact (primary) and from the first contact (retrospective description), with the same follow-up rule, and the difference and ratio of window to reference probabilities were estimated by a paired participant-level bootstrap in which both figures are recomputed on each resample. A further version restricted reference A to participants who had at least one window.
Admission-level tabulation. Each of the 726 emergency admissions during monitoring was classified, with the admission as the unit, as falling within a detected window (between its first and last contact), within 14 days after the end of a window, only preceding a window that began 1 to 14 days later, or with no window within 14 days; admissions in participants with no windows are shown separately. For admissions within a window, the number of window contacts before the admission was counted. A second, post hoc, descriptive classification by timescale was made from the contacts strictly before each admission: subacute, where the admission fell within a window after at least two of its contacts, or within 14 days after a window ended; acute, where the last contact before the admission had Total Alerts of three or more, was no more than 7 days before the admission, and was not part of an established window; earlier window only, where the participant had a window ending more than 14 days before and the last contact before the admission was not an elevated contact within 7 days of it; and no elevated contact, where the last contact before the admission had Total Alerts below three and no instability window had ended before the admission. Elevated means Total Alerts of three or more throughout; a contact below that threshold may carry one or two alerts. Contacts on the admission date are not used, because a contact has a date but no time and cannot be placed before or after the admission. Two admissions, in two groups each smaller than five (last elevated contact more than 7 days before the admission; no contact before it), are not shown separately. For single elevated contacts, the proportion admitted within 7 days was compared with contacts with fewer than three alerts by participant-level bootstrap. Triage category, presenting problem and diagnosis group (major diagnostic category from the first character of the diagnosis-related group) were tabulated by admission category, with cells below five suppressed.
Window characteristics. Six characteristics were compared between windows with and without admission: duration in contacts, duration in days, mean alerts per contact, peak alerts, red-domain breadth and any-domain breadth. Three cluster-aware approaches were used, each under the proximity rule (a) and under truncation (c). First, within participants who contributed both kinds of window, each characteristic was averaged per participant and outcome and compared by Wilcoxon signed-rank test, with the Hodges-Lehmann estimate of the paired difference and its 95% confidence interval. This controls for stable differences between participants. Second, all windows were analysed by logistic generalised estimating equations (GEE) [22] clustered on participant with an exchangeable working correlation and robust standard errors, one standardised characteristic at a time, giving an odds ratio per standard deviation. Third, conditional logistic regression stratified on participant and a participant-level bootstrap of the difference in medians (2,000 resamples) were run as checks under rule (a). Benjamini-Hochberg correction [23] was applied within each family of six characteristics at a threshold of 0.05. Window-level Mann-Whitney comparisons, which treat windows as independent, are reported in the Supplementary Material as exploratory.
Time to admission. Each window contributed the time from its first contact to the first emergency admission after that contact. Three censoring rules were used: at the last contact of the window; at the last contact plus 14 days, which matches the outcome horizon and was the primary rule; and at the onset of the participant’s next window or the end of follow-up, in every case capped at the participant’s last contact and the end of the hospital extract. Kaplan-Meier estimates of the cumulative probability of admission are reported with Greenwood intervals and with participant-level bootstrap intervals, since a participant contributes several windows and outcome periods can overlap. Cox models with robust standard errors clustered on participant estimated hazard ratios per standard deviation for four covariates measured at the first contact of the window: Total Alerts, red alert count, red-domain breadth and any-domain breadth, with Benjamini-Hochberg correction across the four. Covariates were fixed at onset because any quantity accumulated over a window, including its duration, peak and contact count, depends on how long the window was observed and cannot be used to predict the time at which observation ended. Each model was refitted with an indicator of discharge from a Monash Health admission within the preceding 14 days, and separately within 30 days, as a covariate, and again after excluding windows with an admission between the first and second contact. Proportional hazards were tested. Models with covariates at the second contact, time-varying covariates and recurrent-event specifications [24] are described in the note to Table S7.
Window state over the monitoring record. A Cox model followed each enrolment record from contact to contact. Each contact opened an interval ending at the next contact, 14 days later, the record’s last contact or the end of the hospital extract, whichever came first; intervals starting during a hospital stay were excluded, because a person who is an inpatient is not at risk of an emergency admission from the community and the window state at such a contact is not a state of the person at home; an admission within the interval was the event. The exposure was the forward-only window state at the contact, compared with contacts not in a recognised window, with discharge within the preceding 14 and 30 days as covariates and, in a further model, Total Alerts at the contact. Standard errors were robust and clustered on the individual.
Signals before admissions that occurred. Among the 1,214 contacts in the 14 days before an emergency admission, each of 11 signals was modelled as the dependent variable in a linear GEE (identity link, Gaussian family) with days from admission as the single covariate, clustered on the individual with an exchangeable working correlation and robust standard errors. Days from admission was entered in days, negative before admission, so the coefficient is the change in the signal per day closer to admission. The linear model was used for binary signals as well, so that every coefficient is on the scale of its signal; for binary signals it is a change in proportion per day. Benjamini-Hochberg correction was applied across the 11 signals. Areas under the receiver operating characteristic curve (AUC) were calculated from unadjusted logistic regression distinguishing contacts in the final 7 days before admission (n = 629) from those 7 to 14 days before (n = 585), with DeLong confidence intervals [25]. Because every contact in this set was followed by an admission, these AUCs describe how well a signal separates nearer from further contacts among admissions that occurred. They do not describe prediction of admission.
Prospective analysis across the whole monitoring record. The prediction time is the monitoring contact. For every contact N, predictors are the values recorded at that contact and the outcome is any emergency admission event dated after the contact and within 14 days of it. Every contact whose 14-day horizon contains an admission is positive, so an admission that falls in the horizons of two successive contacts makes both positive; no admission is attributed to a single contact. Contacts whose horizon extended past the end of the hospital extract were excluded (116 contacts). Contacts made on a date within a Monash Health hospital stay of any type, counting the admission and discharge dates (291 of the 16,267 eligible contacts; 67 of them strictly between a record’s admission and discharge dates), were retained, because the prediction time is the monitoring contact as it occurred and the programme continued to make contact during hospital stays. Contact records hold a date but no time, so a contact on an admission or discharge date may have been made before admission or after discharge. For a contact made during a stay, the admission already under way is dated on or before the contact and is not counted; an emergency admission dated after the contact and within 14 days, including a readmission after discharge, is counted. In 8 of the 291 contacts the only admission counted was dated within the hospital record already under way. As a sensitivity analysis, the eight single-predictor models, the joint model and the window-membership models were refitted without the 67 contacts and without all 291 (Table S6, panel (g)). The number of positive contacts and the number of unique admissions they cover are reported separately. Dependence between contacts of the same person was handled by clustering on the individual. Eight single-predictor logistic GEE models, clustered on the individual with an exchangeable working correlation, were fitted with Benjamini-Hochberg correction across the eight; each was refitted with the recent-discharge indicators and with an independence working correlation, and all eight were refitted at a 7-day horizon, as sensitivity analyses; self-rated health, Total Alerts and red alerts were also refitted at 7, 14 and 21 days on a fixed set of contacts with 21 days of follow-up. Within-person change at contact N (the difference from the previous contact, with the gap in days, and the deviation from the person’s running mean of earlier contacts) was entered with the level at N in further sensitivity models. A joint model of Total Alerts, self-rated health and navigator concern was assessed for calibration by decile of predicted risk, for positive predictive value, sensitivity and specificity at the top 10%, 20% and 30% of predicted risk, and for discrimination in participants held out from fitting: a single 70/30 split by participant with a DeLong interval, and 200 repeated 70/30 splits by participant, reporting the mean test AUC and the 2.5th to 97.5th percentiles of the split AUCs. The percentile range describes the sensitivity of the test AUC to the allocation of participants between development and test sets; it is not a confidence interval for the AUC of a fixed model. The DeLong interval for the single split does not allow for clustering of contacts within individuals and is reported as a secondary description. Window membership at contact N was added to the prospective model as a sensitivity analysis, defined so that a window state is assigned only from contacts up to and including N and is reset by any admission.
Descriptive statistics are medians with interquartile ranges (IQR) or means with standard deviations (SD). Exact p-values are reported, except below 0.001. Analyses were conducted in R version 4.5.3 (2026-03-11) using the geepack, survival and pROC packages, with each resampling procedure using its own fixed seed, derived from a single base seed; all package versions are listed in the Supplementary Material. One script (analysis_paper_2_v28.R) produces every reported figure and was run five times: the primary run, and sensitivity runs with the Health Care domain excluded, with ward-only event sets, and with blanks in Q7 and Q23 to Q25 set to the no-problem default. The script, the five outputs and a table setting out the key figures from the five runs side by side, together with the script that builds that table (compare_variants_v28.R), are provided as Supplementary Material. The study is observational and its findings are hypothesis-generating.
2.7. Patient and Public Involvement
Patients were not directly involved in the design, conduct or reporting of this study. Participants in the PaJR programme contributed to the development of the monitoring service through feedback during implementation. MonashWatch was developed in partnership with Monash Health clinical leadership and with community input through the HealthLinks: Chronic Care initiative.
3. Results
3.1. Participants and Monitoring
The 243 individuals (244 enrolment records) contributed 16,383 monitoring contacts, a mean of 67.1 per record (SD 40.8; median 68, IQR 37 to 92) over a mean of 18.4 months. Median age at first ED presentation was 71 years (IQR 59 to 80; range 21 to 92), and 48% of records were for women. Most contacts were with the participant (87.2%) and the remainder with a carer. Alert burden was skewed: mean 1.46 alerts per contact (SD 2.47), median 0, maximum 21. Three or more alerts were recorded at 20.1% of contacts and at least one urgent or immediate red flag at 17.2%. The interval between contacts had a median of 7 days (IQR 6 to 8; 5th to 95th centile 2 to 20). The median was 7 days at every level of concurrent alert burden, so contact frequency did not rise with alert burden, although call length did (Section 2.2).
The hospital extracts yielded 1,698 emergency admission events over the extract period, of which 726 occurred during monitoring. Every individual had at least one event during the extract period (median 5, IQR 3 to 9; range 1 to 82). Twenty participants died in hospital. Age, sex, utilisation and monitoring characteristics are shown in Table 2 by whether participants had instability windows and, under the proximity rule, what those windows were associated with. Admission rates in Table 2 are calculated over the monitoring period only, from each participant’s first to last contact.
Two features of Table 2 bear on what follows. Participants with no windows had the lowest alert burden but an admission rate during monitoring (1.5 per person-year) above that of participants whose windows were never associated with admission (0.9), so many admissions in this cohort occurred without any detected window. Participants whose windows were all associated with admission had shorter follow-up than those whose windows were not (28% against 6% monitored for less than six months), which reduces the opportunity for a window without admission to be observed. Comparisons between participants are subject to this difference. Comparisons within participants are not.
3.2. Instability Windows and What Followed Them
The primary definition identified 621 windows in 157 participants (64%). Participants with any window had a median of 3 (IQR 1 to 6; maximum 16). Median window duration was 10 days (IQR 7 to 21). In 108 instances two windows from the same participant were separated by a single contact below the threshold, and four windows contained a gap between contacts of more than 60 days.
Under the primary rule, windows were truncated at the first admission within them: 39 were shortened, 67 were dropped because fewer than two contacts preceded the admission, and 554 remained. Of the 540 with a determined outcome, 448 (83.0%; participant-level bootstrap 95% CI 78.7 to 86.8; Wilson interval 79.6 to 85.9) had no recorded emergency admission within 14 days of the last contact: 81.7% had no acute care contact and 1.3% an ED attendance only (Table 3). This estimate describes the 554 windows that met the requirement of two contacts before any admission. The 67 dropped windows, in which deterioration and admission were too close together for two preceding contacts to be recorded, are counted at the admission level in Section 3.3.
The proximity rule gave a lower figure, and the reason is informative. Under it, 203 windows were linked to an admission and 67.0% (participant-level bootstrap 62.0 to 72.4; Wilson 63.2 to 70.6) of the 616 windows with a determined outcome were not. The 203 windows were linked to 184 unique admissions; 12 admissions were linked to more than one window, and 57 windows had more than one admission within their horizon. In 47 of the 203 windows (23%) the nearest admission preceded the first contact of the window. In 82 (40%) it fell between the first and last contacts, so contacts made after the admission were part of the window. In 67 (33%) it followed the last contact, and in 7 no single position applied (Figure 3A). When admissions that preceded the window were not counted, 74.3% (participant-level bootstrap 69.2 to 79.0; Wilson 70.7 to 77.6) of windows were not linked to an admission.
Of the 89 windows that contained an admission, 4 had no contact before it, 52 had one, and 33 had two or more. Most windows linked to an admission by proximity therefore began at or within one contact of the admission. They record instability around and after an admission, not escalation that monitoring detected beforehand.
Reference rate and relative risk. From monitoring contacts outside windows (original reference; 14,312 contacts, 240 participants), the Kaplan-Meier probability of emergency admission was 3.2% (participant-level bootstrap 2.7 to 3.9) by day 7, 6.4% (5.3 to 7.6) by day 14 and 12.6% (10.7 to 14.6) by day 30, and 93.3% of contacts with determined follow-up were not followed by admission within 14 days (Table 4). With the 326 window contacts made on or after an admission inside their window returned to it (the forward-only reference, Section 2.6), the probability was 3.5% by day 7, 6.7% by day 14 and 13.1% by day 30; the ratios from a window’s second and first contacts that follow are against this reference. Windows carried a higher short-term risk than that reference under every origin and horizon. From the second elevated contact of a window, after exclusion of 67 windows with an admission on or before the second contact and of windows with no follow-up after it, the probability of admission was 7.3% (4.8 to 10.1) by day 7, 12.3% (9.1 to 15.8) by day 14 and 19.5% (15.4 to 23.8) by day 30 (546 windows, 105 events, 148 participants). The difference from the forward-only reference at 14 days was 5.6 percentage points (2.5 to 8.9) and the ratio 1.84 (1.37 to 2.41); the ratio fell from 2.12 at day 7 to 1.49 at day 30. From the first contact, as a retrospective description, the probability was 16.2% (12.7 to 19.9) by day 14 and the ratio 2.42 (1.89 to 3.10). Against contacts outside windows in participants who had at least one window (original reference; 7.0% at 14 days), the first-contact ratio was 2.32 (1.81 to 2.91). Against contacts with zero alerts outside windows (5.6% at 14 days) the ratios were larger (second contact 2.19, 1.57 to 2.98). Window membership at a contact also raised the odds of admission in the prospective model (odds ratio 1.58, 1.21 to 2.06, for a window recognisable from that contact and earlier ones, with any admission ending it), but after adjustment for Total Alerts at the same contact the odds ratio was 1.15 (0.88 to 1.51): most of the window effect is carried by the alert count at the contact itself. Classing each contact using only what was known at that point, admission within 14 days followed 13.8% of contacts at which a window could first be recognised (its second elevated contact), against 6.9% of contacts not in a recognised window (ratio 1.99, 1.54 to 2.47; Kaplan-Meier estimates from 619 second contacts and 14,847 contacts not in a recognised window followed, with 85 and 1,027 admitted by day 14; Table S3). In a Cox model following each enrolment record from contact to contact, a window’s second contact carried a hazard ratio of 1.88 (1.33 to 2.67) with recent discharge allowed for, and 1.19 (0.82 to 1.74) when Total Alerts at the contact were added. Every figure in this comparison was observed under monitoring. The reference contacts are monitored contacts at which support was given, and a window not followed by admission may be one in which the response to it averted an admission. The comparison therefore describes the difference in recorded admission between states within a monitored cohort and not the natural history of either.
The proportion not followed by admission fell with the outcome horizon under every rule (Table 4, Figure 3B). Under truncation it was 87.5% at 7 days, 83.0% at 14 and 73.9% at 30. Under the proximity rule it fell from 73.9% at 7 days to 55.0% at 30 days, and under rule (b) from 78.5% to 66.1%. Among 527 windows not followed by admission at 14 days under forward classification, 55 (10.4%) were followed by an admission between days 15 and 28. Most windows were not followed by admission under every rule and at every horizon examined; the size of the majority depends on both choices. Under the truncated rule the proportion varied little with the alert threshold (82.9% to 85.8%, Table S1) and more with the minimum run length (71.9% to 83.3%, Table S2); the corresponding proximity-rule ranges were 65.3% to 71.8% and 60.4% to 68.2%.
Three further checks were made. With exit from the programme inferred from gaps in monitoring, 12 windows had an outcome period extending beyond the inferred exit, and the proportion not linked to an admission under the proximity rule was 67.3% (63.5 to 70.9). One window had a death in hospital within 14 days of its end, and it was already classified as an admission; no window classified as having no admission was reclassified. Deaths outside hospital could not be identified. Finally, among windows with no acute care contact, mean alerts in the three contacts after the window (median 1.7, IQR 0.7 to 2.7) matched the three contacts before it (median 1.7, IQR 0.7 to 2.7), against a median of 5.0 within the window. Across all 385 windows not associated with admission that had contacts on both sides, the Hodges-Lehmann difference was 0.0 (95% CI −0.3 to 0.2). Alert burden returned to its level before the window. This describes the monitoring record and is not evidence of clinical recovery.
3.3. Admissions in Relation to Detected Windows
Taking the admission as the unit (Table 5), 152 of the 726 emergency admissions during monitoring (20.9%) fell within a detected window, 56 (7.7%) occurred within 14 days after the end of a window, 56 (7.7%) only preceded a window that began within 14 days, and 462 (63.6%) had no window within 14 days, of which 176 were in participants who never had a window. Of the 82 windows whose nearest admission fell inside them (a subset of the 89 windows that contained any admission; Section 3.2), 4 had no contact before the admission, 51 had one and 27 had two or more. The statement that admission more often occurred within detected instability than at its end therefore holds at the window level and at the admission level (152 within against 56 after). However, in two-thirds of the windows that contained an admission, the detected instability before the admission was a single contact or none. The dominant finding at the admission level is that most admissions were not preceded by a detected window at all.
By timescale, 141 admissions (19.4%) were subacute (within a window after at least two of its contacts, or within 14 days after a window ended), 86 (11.8%) followed a single elevated contact with the previous contact below the threshold, 281 (38.7%) occurred in a participant whose last window had ended more than 14 days earlier, and 216 (29.8%) followed no elevated contact. For these admissions the last contact before the admission had Total Alerts below three, and no window had ended beforehand. That last contact was a median of 5 days (IQR 3 to 7) before the admission, and it recorded no alerts in 151 of the 216 and one or two alerts in 65. In 157 of the 216, the participant had an elevated contact at some earlier date that did not form a window. This category does not mean that there was no contact or support: like every admission in the table, these occurred under monitoring. A single elevated contact carried a short-term risk of its own: of 1,820 contacts with three or more alerts whose previous contact was below the threshold, 6.0% (4.8 to 7.4) were followed by admission within 7 days, against 3.3% (2.8 to 4.0) of contacts with fewer than three alerts, a difference of 2.7 points (1.5 to 4.0). In 73 cases a window began 1 to 14 days after an admission. Triage category, presenting problem and diagnosis group differed between the admissions monitoring had detected and those it had not (Table S9). Admissions that fell within a detected window were mostly triage 3 or 4 (83%), led by abdominal pain (19%), shortness of breath (14%) and “generally unwell” (8%), with digestive diagnoses the largest group (26%). Admissions in participants who never had a window were more often triage 2 (30%), led by cardiac chest pain (30%), with circulatory diagnoses the largest group (38%). The same contrast appears by timescale: admissions after a subacute window were 12% triage 2 against 29% for admissions with no elevated contact immediately before them. Of the 726 admissions, 448 (62%) were short stay observation unit episodes and 532 (73%) short stay or assessment-unit episodes. Median length of stay was 1 day (IQR 1 to 3) among the 716 admissions with a linked admission record; short stay episodes had a median of 1 day and assessment-unit episodes a median of 4 days (Table S10).
With the Health Care domain excluded from the alert score, 44 of the 621 windows were no longer detected, 126 admissions (17.4%) fell within a window, 59 followed one, 51 preceded one and 490 (67.5%) had no window within 14 days; 74 admissions changed category.
3.4. Window Characteristics and Admission
Under the proximity rule, windows linked to an admission were longer and broader than other windows from the same participant (Table 6, Figure 4A). Among the 71 participants with both kinds of window, the paired difference was 5.8 days in duration (95% CI 2.3 to 9.8; adjusted p = 0.004), 0.23 domains in red-domain breadth (0.14 to 0.32; adjusted p < 0.001) and 0.17 in any-domain breadth (0.02 to 0.34; adjusted p = 0.047). Mean alerts, peak alerts and duration in contacts did not differ after correction. The logistic GEE across all 616 windows, conditional logistic regression and the participant-level bootstrap all found differences in duration in days and red-domain breadth (GEE odds ratios per SD 1.82 and 1.70), but they did not agree on the other four characteristics (Table S4).
These differences were not demonstrated when windows were truncated at admission. Among the 50 participants with both kinds of truncated window, no characteristic showed a difference after correction; the paired difference in duration was −0.3 days (−3.0 to 3.0) and in red-domain breadth 0.06 (−0.07 to 0.17). In the logistic GEE across 540 windows the odds ratios were 1.13 (0.93 to 1.38) for duration in days and 1.23 (1.00 to 1.51) for red-domain breadth, and all intervals included 1. The proximity-rule estimates for duration in days and for red-domain breadth lay above the upper confidence limits of the truncated estimates, so the attenuation is not only a loss of precision. When the 47 windows whose nearest admission preceded them were reclassified by whether an admission followed their last contact, the differences became larger (paired difference in duration 8.3 days, 4.3 to 13.6; odds ratio 2.19), which locates the source of the difference in the windows that contained an admission. A window that continues past an admission is longer by construction, and the contacts that follow an admission carry a high alert burden (Section 3.5).
The Health Care domain accounted for the breadth difference under the proximity rule. With that domain excluded, the paired difference in red-domain breadth among the 69 participants with both kinds of window was −0.02 (−0.09 to 0.07; unadjusted p = 0.70) and the odds ratio per SD was 1.09 (0.90 to 1.32), while the difference in duration in days remained (4.6 days, 1.2 to 8.5; odds ratio 1.75, 1.31 to 2.33). Under truncation with the domain excluded nothing differed (red-domain breadth odds ratio 1.21, 0.97 to 1.51).
The interval between contacts is consistent with this account. Within the 71 participants, duration in contacts did not differ between admission-associated and other windows, but the mean interval between contacts was 2.0 days longer in admission-associated windows (0.6 to 3.5; p = 0.004). Median length of stay was 1 day (IQR 1 to 3; mean 3.1; Table S10). The longer calendar duration of these windows is therefore at least partly the interruption of calls around a hospital stay, and it cannot be read as persistence of deterioration before admission.
Neither comparison is unbiased. The proximity rule lets windows with admission extend past the admission, which favours finding them longer. Truncation shortens only the windows with admission, which works against finding them longer, and retains only 92 such windows. With contacts a week apart, escalation faster than about a week cannot be observed at all. The absence of a difference before admission is partly a limit of cadence and sample.
The time-to-event analysis treats both kinds of window alike and asks whether the state at window onset is associated with how soon an admission follows (Table 7, Figure 4B). Red-domain breadth at the first contact showed a small association with earlier admission under the primary censoring rule (hazard ratio 1.18 per SD, 95% CI 1.01 to 1.37; p = 0.033; adjusted p = 0.13), with the same direction under the other two rules (1.17 and 1.12). It did not survive correction under any rule, and it was not present when an indicator of discharge within the preceding 14 days was added (1.09, 0.94 to 1.26; p = 0.26), when the Health Care domain was removed from the covariate (1.10, 0.93 to 1.29; p = 0.25), or when the 54 windows with an admission between the first and second contact were excluded (1.18, 0.97 to 1.44; p = 0.10). Window onset fell within 14 days of a discharge in 15.6% of windows and within 30 days in 25.6%. Total Alerts, red alert count and any-domain breadth at onset were not associated with time to admission under any of the three censoring rules. With discharge within the preceding 14 days added as a covariate under the primary rule, any-domain breadth had a hazard ratio of 0.82 (0.67 to 0.99; unadjusted p = 0.043), in the direction of later rather than earlier admission. Covariates at the second contact added nothing (Table S7). In sensitivity models that entered red-domain breadth together with Total Alerts, the hazard ratio for red-domain breadth was 1.26 to 1.29 with time-varying and recurrent-event specifications under the primary rule; these models were not adjusted for recent discharge and carry the same caveat. In a model that separated Total Alerts into red and non-red flags, non-red flags at onset had a hazard ratio below 1 under two of three censoring rules. That result was not prespecified, depends on the censoring rule and is reported as exploratory only. The proportional hazards assumption was violated for Total Alerts at onset under the two stricter censoring rules (p = 0.036 and 0.045) and held for the other covariates.
3.5. Monitoring Signals around Admissions That Occurred
Table 8 and Figure 5A describe monitoring contacts in the 14 days either side of an emergency admission. Total Alerts rose from a mean of 1.96 in the period 7 to 14 days before admission to 2.80 in the final 7 days, red alerts from 0.41 to 0.63, and navigator concern from 16.4% to 24.6% of contacts. In narrower bands the rise was steepest in the final three days, reaching 4.13 Total Alerts in the day before admission (n = 62). On the full alert score, alert burden did not fall back after admission: it was 3.74 in the first three days after admission and 3.29 across the first week, above the week before admission, and 2.49 in the second week, above the level 7 to 14 days before admission.
Most of that excess was the Health Care domain recording the admission itself. With that domain excluded, Total Alerts were 1.81 and 2.57 in the two weeks before admission, 2.53 in the first week after and 2.25 in the second: the first week after admission was no higher than the week before, and the second week after remained above the fortnight before. Red alerts without the domain were 0.33, 0.53, 0.44 and 0.45 across the four bands. Anchoring to discharge instead of admission, or excluding contacts that also preceded a later admission, changed the means little (Table 8). Calls were longer in the first week after admission (median 662 s, against 500 s and 555 s in the two bands before admission), while the interval between contacts was unchanged (median 7 days in every band). Given the call structure, part of the higher alert count after admission reflects fuller assessment. Whether the remaining excess in the second week is a property of the person’s state or of the navigator’s response to a known admission cannot be separated in these data.
Looking back from admissions that occurred, seven of eleven signals rose as admission approached after correction for multiple testing (Table 9). Total Alerts rose by 0.117 per day (95% CI 0.078 to 0.157), equivalent to about 1.6 alerts across the fortnight. No signal separated contacts in the final week from earlier contacts strongly; the highest AUC was 0.601 (0.554 to 0.648) for the health score. Expected health over the next few days (Q21) was not associated with proximity to admission (adjusted p = 0.24; AUC 0.503, 0.457 to 0.549); only 11 of the 474 pre-admission contacts with a Q21 response recorded worse or much worse, so that estimate is unstable. Setting blanks in Q23 to Q25 to the no-problem default did not change these conclusions: the association for eating, drinking and toileting strengthened (adjusted p = 0.013) and that for outdoor activity did not reach the threshold (0.056) (Table S5).
3.6. Prospective Analysis Across the Whole Monitoring Record
Across the whole record, 16,267 contacts from 243 individuals had 14 days of observable follow-up, including 291 contacts made on a date within a Monash Health hospital stay (Section 2.6). An emergency admission followed within 14 days of 1,236 contacts (7.6%), covering 698 unique admissions; the remaining 1,000 events fell before the first contact (710), after the last contact (231) or in gaps of more than 14 days between contacts (59). Every signal except carer concern was associated with admission in the following 14 days after correction (Table 10). Self-rated health had an odds ratio of 1.30 per point (95% CI 1.18 to 1.44), patient concern 1.45 (1.25 to 1.69), navigator concern 1.43 (1.15 to 1.78), red alerts 1.28 per alert (1.15 to 1.42) and Total Alerts 1.08 per alert (1.05 to 1.12). The associations were larger at a 7-day horizon (navigator concern 1.76; red alerts 1.42; self-rated health 1.43) and smaller at 21 days (Table S6), and were unchanged by adjustment for discharge within the preceding 14 or 30 days. Expected health recorded as don’t know (Q21) was associated with admission (1.30, 1.01 to 1.67) in the 6,316 contacts at which the item was recorded; don’t know was recorded at contacts with higher alert burden (median 4 against 2) and longer calls, and the estimate was similar after adjustment for call length (1.29, 1.00 to 1.65). Expected health recorded as worse or much worse, the contrast examined in the pilot extract, was recorded at 117 contacts and was not associated with admission (1.23, 0.60 to 2.52). Within-person change at the contact, entered with the level, added nothing: the odds ratios for change terms were all below 1 (for example 0.94, 0.87 to 1.01, per point of worsening in self-rated health since the previous contact).
The associations were stronger for admissions that became ward stays. With events restricted to ward admissions (short stay observation unit episodes not counted; 627 events, 535 positive contacts covering 280 admissions), the odds ratio per point of self-rated health was 1.45 (1.26 to 1.66), for red alerts 1.37 (1.20 to 1.57), for patient concern 1.63 (1.32 to 2.01) and for navigator concern 1.56 (1.14 to 2.13); with assessment-unit episodes also excluded (424 events) they were 1.56, 1.45, 1.73 and 1.69. The window-to-reference ratio at 14 days from the second contact rose from 1.84 to 2.15 (1.45 to 3.02) and 2.30 (1.36 to 3.44) under the two definitions, and the mean hold-out AUC from 0.60 to 0.62 (Table S6). Monitoring signals therefore carried more information about the admissions that became inpatient stays than about the short stay unit presentations that made up three-fifths of the events.
The joint model of Total Alerts, self-rated health and navigator concern was reasonably calibrated but discriminated weakly. Observed admission rates ranged from 5.4% in the lowest decile of predicted risk to 14.5% in the highest. Navigator concern added nothing to Total Alerts and self-rated health in the joint model (0.98, 0.77 to 1.25), consistent with its close tracking of alert burden: navigators recorded concern at 1,956 contacts, of which 80% had three or more alerts, against 12% of contacts without recorded concern. Across 200 participant-level splits the mean test AUC was 0.595; the 2.5th to 97.5th percentiles of the split AUCs (0.537 to 0.647) describe sensitivity to the allocation of participants between development and test sets and are not a confidence interval. In a single split with 30% of participants held out, the AUC was 0.572 (DeLong 95% CI 0.535 to 0.609; this interval does not allow for clustering of contacts within individuals). With the 291 contacts made during a hospital stay excluded, or only the 67 made strictly between a hospital record’s admission and discharge dates, the odds ratios were 1.08 to 1.48 (1.08 to 1.45 with no contacts removed), the same seven measures remained significant after correction, the mean hold-out AUC was 0.595 and 0.593, and the observed admission rates in the lowest and highest tenths of predicted risk were 5.1% and 14.4%, and 5.3% and 14.4% (5.4% and 14.5% with no contacts removed), so the principal prospective findings do not depend on their inclusion (Table S6, panel (g)). Flagging the 10% of contacts at highest predicted risk gave a positive predictive value of 14.5%, sensitivity of 19.1% and specificity of 90.7%. Because signals rise often and the contact-level admission rate is low, a raised signal roughly doubles a small probability and most flagged contacts are not followed by admission.
4. Discussion
4.1. Principal Findings
First, most detected instability windows were contained in the operational sense: 83% of windows that met the pre-admission observation requirement had no recorded Monash Health emergency admission within 14 days of their last contact. For monitoring contacts outside windows, the corresponding proportion was 93%, and admission within 14 days followed 14% of contacts at which a window could first be recognised, against 7% of contacts not in a recognised window. Detected instability therefore marks a period of roughly doubled short-term risk in which most people are not admitted. Containment refers to the hospital record. It is not a measure of clinical recovery, which the study did not assess, and it was observed under monitoring. A contained window may be one in which the response to it averted an admission, and the record cannot tell that window from one that was never going to escalate.
Second, at the level of the admission, most admissions were not preceded by a detected window. Of 726 admissions during monitoring, 21% fell within a window (just over half of them after two or more window contacts), 8% followed a window within 14 days, 8% preceded one and 64% had no window within 14 days. Admissions fell within windows more often than after them, but in two-thirds of the windows with an admission inside, the first admission came after no more than one window contact. By timescale, about a fifth of admissions came during, or within 14 days after, a window of two or more elevated contacts, about a tenth followed a single elevated contact, and about three in ten followed no elevated contact immediately before the admission and no earlier window. All of these admissions occurred under monitoring, and the relational contact is delivered at every call whether or not an alert is raised (Section 4.4).
Third, the specified analyses did not demonstrate differences in window characteristics measured before an admission between windows followed by admission and other windows. Windows linked to an admission by proximity were longer and broader, but they carried the contacts that followed the admission, which are high in alert burden and interrupted by the hospital stay. With those contacts removed, the analyses did not show these differences. The breadth difference under the proximity rule, and the small association between red-domain breadth at window onset and earlier admission, were both accounted for by the Health Care domain, whose flags include care already received. The onset association was also not demonstrated once recent discharge was allowed for.
Fourth, signals at a monitoring contact were associated with admission in the following fortnight. Self-rated health, patient concern, navigator concern, red alerts and Total Alerts each raised the odds of admission by 8% to 45% per unit. The associations were stronger at 7 days and were not explained by recent discharge. Discrimination remained weak: a joint model reached a mean hold-out AUC of 0.60 in participants it had not seen, because admissions are uncommon at the level of the contact and signals rise often. Navigator concern tracked alert burden and added no independent information to it. The associations, and the excess risk after a window, were larger for the admissions that became ward stays than for the short-stay presentations that made up most of the events.
Fifth, alert burden after admission was raised on the full alert score but, once the Health Care domain was removed, the first week after admission carried no more alerts than the week before, and only a modest excess remained in the second week.
4.2. Why the Linkage Rule and the Content of the Alert Score Matter
A proximity rule appears natural when the question is whether a window was near an admission, but it answers a different question from whether detected instability goes on to admission. It allows three kinds of window to be linked to an admission: those that followed one, those that ran through one, and those that preceded one. Only the last kind bears on what follows detected instability, and the characteristics of the first two are shaped by the admission itself. Monitoring studies that classify runs of observations by proximity to an event are open to the same problem. The check is simple: tabulate where the event fell relative to the run, and tabulate the events themselves by their relation to the runs. Truncation has a cost. It removes 67 windows in which fewer than two contacts preceded the admission, and those are the windows in which deterioration and admission were closest together. The admission-level table recovers them: 50 of the 86 admissions that followed a single elevated contact were inside such windows. With contacts a week apart, the monitoring record cannot show escalation over days, so the absence of a difference before admission should not be read as evidence that no such escalation occurs.
A second check concerns the content of a composite alert score. An instrument with a domain whose flags include care already received can register an admission after it has happened. In these data that domain accounted for most of the excess alert burden after admission, for the breadth difference between admission-associated and other windows under the proximity rule, and for the association between breadth at window onset and earlier admission. Any analysis of monitoring signals around admission should state whether the signal can be generated by the admission itself, and report the result with that component removed.
4.3. Comparison with Existing Literature
HNHC populations are recognised as heterogeneous and hard to predict from administrative data [4,5,6], and readmission models in general discriminate modestly [7]. The prospective results here are consistent with that literature and extend it to repeated patient-reported and navigator-rated measures at weekly intervals: each measure was associated with admission, and more frequent and richer observation still did not produce useful discrimination at the level of the contact. Self-rated health was the strongest graded predictor, consistent with its long-recognised role as an integrative measure and with its position as a hub variable in a recent information-theoretic analysis of multimorbidity [26].
The pattern of alert burden around admission, once the Health Care domain is removed, is a rise into admission and a return towards the pre-admission level within a week, with a modest excess in the second week. That is compatible with post-hospital syndrome, the period of generalised vulnerability that follows an inpatient stay [27], and with the earlier observation in this programme that potentially preventable admissions are preceded by a pre-hospital syndrome [16]. The excess is smaller than the full alert score suggested. Utilisation fell in both arms of trials in very frequent hospital users [9] and in both arms of the non-randomised evaluation of this programme [14]. In the same way, a return of alert burden to its earlier level after a window is what regression to the mean would produce, and cannot be attributed to monitoring.
4.4. Alternative Explanations
Three considerations other than plasticity bear on the observed pattern, and the data cannot separate their contributions. The first is statistical and applies whatever the mechanism; the second and third concern what the record can and cannot show.
Regression to the mean. Windows are selected on high alert values, so a return towards each participant’s own average is expected on statistical grounds alone [21], and the return of alert burden after non-admitted windows to its pre-window level is consistent with that expectation. The expectation says nothing about the mechanism, which in each window is self-stabilisation, response to care or variation in the measure. The requirement for two consecutive elevated contacts reduces but does not remove the effect.
Treatment paradox. Navigators and the supervising general practitioner acted on alerts and on navigator concern, and if those actions averted some admissions the prospective association between signals and admission would be attenuated. The associations observed here are positive and the model is calibrated, so the paradox did not remove the signal. It may have weakened it, and the content of the responses was not recorded. The same logic applies to the windows. A window followed by no recorded admission because the response to it averted the admission is not a false positive of detection. It is detection followed by an effective response, which a prediction framing would count as an error. The proportion of windows not followed by admission is therefore a proportion under monitoring and response, not a property of the windows alone. The paradox also reaches the reference rate and the admissions with no elevated contact immediately before them: the relational contact is delivered at every call, with or without an alert, and may avert admissions through support alone. The reference contacts are monitored contacts, and the 6.7% admission probability after them is a rate under monitoring, not a rate in its absence.
Outcome misclassification. Admissions to services other than Monash Health were not captured and would inflate containment. The Health Care domain records unmet need and intended care as well as care received, so its flags cannot be used to estimate how many admissions elsewhere were missed.
Given these explanations, the pattern of mostly contained windows with a doubled short-term risk would also be expected in the absence of plasticity. The analysis is compatible with the instability-plasticity framework and does not test it.
4.5. A Systems Interpretation of Admission within Instability
This section is interpretation. It reads the observed pattern through the instability-plasticity theory [1], and none of the mechanisms described was measured.
On this reading the admission is an event within an instability phase. Hospital care acts on the fast variable, the acute deterioration that prompted the admission, and does not act on the slow variables that set the trajectory: multimorbidity burden, functional reserve, capacity for self-care and social support. Hospitalisation may also disturb those slow variables through immobility, disrupted sleep, medication change and social dislocation [27]. Figure 5B represents this as a balancing loop on the acute event and a reinforcing loop on reserve. In resilience terms, the acute intervention restores the state without restoring the basin [28,29], and in the terms of the Introduction it addresses a failure of homeokinetic regulation while leaving the homeorhetic path where it was or lower.
Two readings of the admissions follow. Neither was tested here, and the second is offered as a hypothesis. On the first, acute-on-chronic deterioration runs over days and, once under way, is managed through general practice, ambulance and the emergency department, beyond the reach of a weekly call. The timescale table is consistent with this for part of the cohort, since three in ten admissions followed no elevated contact and a tenth followed a single one. On the second, the emergency department is the default branch when a trajectory destabilises or becomes unsupportable at home, whether or not the illness needs hospital care, because the system offers no other branch at that point.
Three observations from the Results are consistent with the second reading, although each is also consistent with other accounts. About three-quarters of emergency admissions were short stay or assessment-unit episodes, and the median length of stay of all emergency admissions was one day (interquartile range 1 to 3; Table S10). The admissions that fell within a detected window, where the navigator was already in contact, were predominantly low triage, presenting as abdominal pain, breathlessness or being generally unwell, with digestive diagnoses the largest group (Table S9). The admissions monitoring did not see were more often high-triage cardiac events of the kind that would reach an emergency department under any system.
On this hypothesis the first group, which monitoring detected, would be the group for whom admission was the default rather than the necessity. The missing element would then be not faster sensing but somewhere for the navigator to send the person other than the emergency department. Length of stay and triage category are consistent with this and do not establish it. Whether any admission could have been managed elsewhere was not assessed, and these data do not show that any individual admission was avoidable, unnecessary or safely manageable outside hospital. A weekly relational contact operates at the timescale of the path: it can support self-care, engagement with usual care and the slow variables, and it is the nearest thing the system had to the missing branch. On this hypothesis monitoring would show its effect on the chronic trajectory, and on how much hospital care an admission then requires, more than on whether an acute event reaches the emergency department. The alternative explanations in Section 4.4 apply equally.
The same reasoning offers one explanation for weak discrimination. Two people can record the same alert burden, self-rated health and navigator concern while being in different positions: one declining slowly with little reserve, another stable until a recent failure of support. If what happens next depends on the path as well as the present state, a classifier built on the present state is limited by the information that state contains. The within-person change models, which entered the difference from the previous contact and from the running mean alongside the level, did not improve on the level. The simplest form of path information available in these data therefore does not settle this. This is a hypothesis about why discrimination was weak. The data show only that it was weak.
4.6. Hypotheses Not Tested Here
Longer recovery from disturbance and spread of disturbance across subsystems are recognised signatures of a system losing resilience, described as critical slowing down and weakening modularity [28,29]. The present findings support neither, although the small number of admission-associated windows with two or more pre-admission contacts and the weekly cadence limit what they could show. Duration before admission did not differ detectably between windows, and in the time-to-event analysis duration is the time axis and cannot be a predictor. The association with red-domain breadth was with the state at onset and was not demonstrated once recent discharge was allowed for (Section 4.1). In any case, co-occurrence of flags across domains would not establish coupling between them, since a single unmeasured driver would produce the same pattern. A formal test of critical slowing down requires rising lag-1 autocorrelation and variance in the monitored series as a transition approaches [30]. Such analyses are feasible in these data within participants, although weekly sampling, adaptive call depth and gaps around hospital stays will constrain them.
Two features of these data bear on the non-linearity the framework asserts. First, the state recorded at a contact, and the change in that state since the previous contact or from the person’s own running mean, carried little information about what followed. That is what would be expected if the course of a trajectory depends on its history and context and not only on its present position. Second, the propensity to instability windows varied widely between people and was not accounted for by what was measured at the outset. Over a mean of 18 months of monitoring, 36% of enrolment records had no window while others had up to 16. The groups were similar in age, although the proportion of women was higher in groups with windows (37% with no window, 59% with both kinds of window; Table 2), and the analysis extract held no baseline clinical measure. In an earlier analysis of this programme, frailty, measured by the Clinical Frailty Index, was the best baseline predictor of acute admission, although discrimination was modest (area under the curve 0.66) [17]. Which journeys carry a propensity to instability windows, whether that propensity is stable within a person or changes along the trajectory, and whether frailty or any baseline measure predicts it, cannot be answered in a cohort selected on administrative risk at a single point in time. They are questions for a cohort with baseline measures and longer follow-up, and are planned for the Northern Health deployment of the same instrument, together with the test of critical slowing down described above.
Most windows were contained, windows carried a doubled short-term risk, and most admissions were not preceded by a detected window. That is the pattern the framework describes: instability as a phase with more than one exit, and acute events that run faster than weekly monitoring. What the analysis cannot show is which exit operated in a given window. Containment has a mechanism in every case: self-stabilisation of the person’s own regulation, or response to care, including the monitoring response itself. Regression to the mean is not a third mechanism but a property of the selection. Windows are defined by high alert values, and part of any high value is variation in the measure rather than change in the person, so some fall towards each person’s average is expected on statistical grounds alone. How much of the observed fall is of that kind, and how much is self-stabilisation or response to care, cannot be apportioned from these data, so the fall by itself is not evidence for any one mechanism. Distinguishing self-stabilisation from response to care, against that expectation, is the test of plasticity, and it remains to be done.
These data contain no comparison group. Two controlled evaluations of this monitoring model have been reported. At Monash Health, an intention-to-treat group was compared with usual care over 30 months: acute bed days fell further in the intervention group (a reduction of 1.14 bed days, p < 0.001), while admission frequency did not differ, and both groups showed regression to the mean [14]. At Northern Health, with clinician-supported peer navigators and propensity-score matching over 12 months, bed days were lower (median 2 against 4), admissions were lower (median 1 against 2), and emergency presentations were lower but not significantly so [31]. The evaluations differ on admissions and agree on bed days, which fell in both and by more than emergency presentations in either. They ask whether the programme changed hospital use; the present analysis asks what monitoring detected and what followed it, and cannot attribute any outcome to monitoring. Read together, weak discrimination of admission from monitoring signals, most admissions arising without a detected window, and larger effects on time in hospital than on arrival at the emergency department are consistent with the hypothesis in Section 4.5. This is an interpretation across studies with different designs and samples.
4.7. Implications for Monitoring Programmes
These implications are proposals for evaluation and are not recommendations for practice. First, monitoring programmes of this kind should not be judged on prediction of admission alone. Signals at a contact were associated with admission, but discrimination at the level of the contact was weak and most of what monitoring detected was contained. A prediction-focused evaluation would count that detection as false positives, including every window in which the response averted the admission. It would also miss any effect of the relational contact delivered at calls that raised no alert. The two controlled evaluations of this model found their largest effects on bed days [14,31], which points towards the chronic trajectory and the course of each admission as outcomes. The present data give a reason to examine those outcomes. About three-quarters of emergency admissions were short-stay or assessment-unit episodes (532 of 726). Short-stay episodes, three-fifths of all admissions, usually lasted one day, and assessment-unit episodes a median of four days (Table S10). On the hypothesis in Section 4.5 these would be the default response to destabilisation at home rather than a measure of illness needing hospital care, and monitoring signals carried more information about the admissions that became ward stays than about those episodes. Bed days, admissions with a stay beyond observation, and the relation of monitoring signals to those admissions are therefore proposed as candidate outcomes for future evaluation, alongside admission frequency and patient-centred outcomes. This study did not compare outcome measures and does not establish that any is superior. What is missing is a design that joins window-level monitoring data, a record of what is done in response to alerts, and a contemporaneous comparison group.
Second, these data do not support using the duration or breadth of a window to anticipate admission, and they do not exclude differences that weekly contact and 92 truncated admission-associated windows could not detect. The candidate marker under the proximity rule, red-domain breadth at window onset, did not survive removal of the Health Care domain or adjustment for recent discharge. A single elevated contact carried about twice the 7-day risk of contacts with fewer than three alerts, and the second elevated contact about twice the 14-day risk of contacts outside windows. Whether a response at the first or second elevated contact changes what follows is a question for a design that records the response.
Third, the navigator’s rating of concern tracked alert burden closely, rose before admissions that occurred and was associated with admission prospectively, but it added no information to the structured alerts and self-rated health. This does not show that navigator judgement is without value, since the outcome that judgement serves may not be admission and the content of navigators’ responses was not available. Work on the relational and interpretive elements of remote monitoring [32,33] and on integrated models that combine screening with response capacity [34] suggests where that value might be sought.
A further hypothesis concerns the system of care rather than the person. Programmes intended to avoid admission in high-need populations have had inconsistent effects on admission [8,9,10,11]. One explanation is path dependence in the care system itself. When a trajectory destabilises, or the support holding it fails, the established pathway is the emergency department and admission at a threshold set by history rather than by the person’s trajectory. For a person already on a declining path, there is no alternative branch. The admissions this programme detected are consistent with that description (Section 4.5), which was not tested. Admission then acts on the presenting problem while contributing to hospitalisation-associated disability and post-hospital syndrome [27,35], which in this paper’s terms closes a reinforcing loop on reserve. A programme that acts on the person, upstream of the threshold, cannot alter a pathway whose form is a property of the system. If this is right, the response is not a better predictor of admission but reconfiguration. Alternative branches at the point of destabilisation would include admission-avoidance hospital at home [36], a clinical response the navigator can call on short of the emergency department, and admission thresholds for complex multimorbidity that take the trajectory into account. This is a hypothesis about the care system. These data are consistent with it and cannot test it, since whether any admission needed hospital care was not assessed.
4.8. The Earlier Pilot Observation
An earlier pilot extract from this programme (64 participants, 280 contacts within 10 days of 103 admissions, December 2016 to September 2017) showed patient-reported expected health (Q21) worsening sharply in the days before admission (Table S8). That pattern was not present in the full cohort. The two analyses also coded the item differently: in the pilot analysis a blank Q21 response was taken as stay about the same, whereas here Q21 blanks were left missing (Section 2.2). Looking back from admissions, the ordinal item and the binary worse-or-much-worse contrast were not associated with proximity to admission (Table 9). Prospectively, a response of worse or much worse was not associated with admission in the following 14 days (odds ratio 1.23, 0.60 to 2.52), although a response of don’t know was. The two contrasts are not the same exposure: worse or much worse was recorded at 1.8% of contacts at which the item was recorded, and don’t know at 21%, concentrated at contacts with higher alert burden and longer calls. The pilot extract was assembled by one of the authors (C.M.M.) for an exploration of self-reported trajectories before and after acute admission [16]. It took participants who had an admission and sufficient monitoring time for both periods to be observed, and the selection was made without reference to Q21 or to any other monitoring signal. It is therefore a subset defined by the availability of monitoring around an admission, which favours participants who remained engaged with the programme. The published report of that exploration [16] states its criteria differently and reports different counts from the extract held. Of the 103 admissions in the pilot file, 91 match an event in the current extract to within one day. Eighteen of the 64 pilot participants are not selected by the published criteria: 16 had fewer than the required 44 contacts, one had a first contact outside the enrolment period and one has no contacts in the current extract. The two files overlap at the level of participants and most admissions, but record-level reconciliation has not been established (Table S8).
The present analysis does not refute the published result, which used a different method (a change-point test on a peri-admission time series, where the present analysis estimates association with proximity to admission). The general point is that an extract selected on the availability of observations around an event can show a pattern that the unselected record does not.
4.9. Strengths and Limitations
Few datasets combine approximately weekly contact, coverage of social and self-care domains alongside symptoms and health care use, observation over a mean of 18 months, and linkage to hospital records in a population at high risk of admission. The principal proportion carries a participant-level bootstrap interval, the Kaplan-Meier estimates carry both Greenwood and participant-level bootstrap intervals, the Cox and GEE models use robust standard errors clustered on participant, and the hold-out AUC is summarised over 200 participant-level splits. The window estimates are compared with a reference from contacts outside windows, and the full script, the outputs of all five runs and the unit tests are provided so that every reported figure can be checked.
The limitations are substantial. The design is retrospective and observational, within a single programme and health service, in 243 individuals enrolled over nine months in 2016 and 2017. The large number of contacts does not increase the number of independent participants, and the findings are hypothesis-generating and need external validation before they inform practice. Participants were selected for high predicted risk following an index hospital event, so regression to the mean is expected in utilisation and in alert burden.
Outcome ascertainment was limited to Monash Health. Admissions elsewhere were not captured and would cause windows to be misclassified as not followed by admission, and contacts outside windows likewise. Deaths outside hospital and programme exit dates were not available; neither in-hospital death nor inferred exit changed the headline proportion by more than one percentage point. Short stay and assessment-unit episodes made up about three-quarters of emergency admissions; restricting events to ward admissions raised the proportion of windows not followed by admission to 92% to 94% and left the ratio of window to reference risk, and the prospective associations, at least as large.
The instability window is a pragmatic construct that was not registered in advance, and the choice of linkage rule and the content of the alert score both change the results materially. The alert score incorporates depth of assessment by design, so alert counts and multi-domain indices are not comparable with instruments that administer a fixed item set. Weekly monitoring cannot show change over days. The paired analyses apply only to participants who had windows both with and without admission (71 under the proximity rule, 50 after truncation), who were monitored for longer and had a higher alert burden than others. They do not control for change over time within a participant. The prospective analysis evaluates the particular predictors and model specified here; it does not show what other combinations of these signals, or signals at other cadences, could achieve.
What was done in response to alerts was not recorded in the analysis extract. Navigator support, general practitioner review, medication change and social intervention may have followed detected instability and influenced whether admission occurred. Together with the absence of a comparison group in these data, this is the principal reason the study cannot address whether detected windows were modifiable. The programme’s effect on hospital use was evaluated against usual care elsewhere [14]. Individual clinical characteristics beyond age and sex were not held in the analysis extract, which limits assessment of generalisability. The cohort is a probabilistic risk group defined from administrative data at a single point in time; it is heterogeneous by construction, and its definition is a limitation for any analysis of individual trajectories.
5. Conclusions
Among people at high predicted risk of recurrent hospitalisation with complex multimorbidity, most detected instability windows were not followed by a recorded emergency admission: 83% within 14 days of the last contact when every window contact preceded the outcome, against 93% of monitoring contacts outside windows. Classing each contact using only what was known at that point, admission within 14 days followed 14% of contacts at which a window could first be recognised, about twice the proportion at contacts not in a recognised window. This describes absence of a recorded admission over a defined period within one health service. It is not a measure of clinical recovery.
Most admissions were not preceded by a detected window: of 726 admissions during monitoring, 64% had no window within 14 days, a tenth followed a single elevated contact and three in ten followed no elevated contact immediately before the admission and no earlier window. The specified analyses did not demonstrate differences in window duration or breadth before admission between windows followed by admission and other windows; the differences seen under the proximity rule arose from contacts made after the admission and from the Health Care domain of the alert score, whose flags include care already received. Signals at a monitoring contact were each associated with admission in the following fortnight, but a joint model discriminated weakly.
These data have no comparison group, and every figure in this paper was observed under monitoring. The study did not establish that monitoring caused these outcomes, improved them or prevented hospitalisation, and it did not measure what care was delivered in response to detected instability or at the contacts that raised no alert. A window not followed by admission may be a detection that was acted on; an admission with no elevated contact immediately before it is not an admission without support. The pattern is compatible with the instability-plasticity framework, but a fall from selected high alert values is expected whatever its mechanism, and effective response to alerts and admissions outside the health service would produce the same record. The controlled evaluations of the programme, reported separately, found their largest effects on bed days [14,31]. That monitoring acts on the chronic trajectory more than on the acute events that lead to admission is a hypothesis for evaluation, not a finding of this study.
Given this pattern, and because most admissions were short-stay episodes about which monitoring signals carried the least information, evaluating monitoring programmes on admission prediction or on the count of emergency presentations alone may not capture what they detect. Bed days and admissions that become inpatient stays are proposed as additional outcomes for future evaluation, alongside admission frequency and patient-centred outcomes. Evaluation needs designs that record the response to alerts, follow people through admission and discharge, and include a contemporaneous comparison.
Supplementary Materials
The following supporting information can be downloaded online: Supplementary Tables S1 to S10 and Notes S1 to S3 (alert threshold and window definition sensitivity under both linkage rules; outcome horizon counts and admission within 14 days by forward-only contact state; exploratory window-level comparisons; item recording rates and the no-problem default sensitivity; prospective model calibration, horizon, working-correlation and in-hospital-contact sensitivity; time-to-event sensitivity models; the pilot extract and its reconstruction; triage, presenting problem and diagnosis group by admission category; length of stay by unit; how the counts of windows with an admission relate to one another; changes to the analysis since the first revised manuscript; and a cross-reference from each principal estimate to the output that produces it); analysis_paper_2_v28.R, the complete R script; its five run outputs (analysis_paper_2_v28_R1_primary, R2_exHC, R3_ward_exSSU, R4_ward_exSSU_exMAPU and R5_filled, dated 15 October 2026) with their figure-data files, from which every principal estimate is taken; variant_comparison_v28.csv and variant_comparison_v28_sources.csv, which set out the key figures from the five runs side by side, and compare_variants_v28.R, which builds them; test_v28_helpers.R and test_v28_results.txt, the unit tests and their result record; analysis_paper_2_v28_addendum.R, which runs the analysis script unchanged, confirms that the 15 October primary output is reproduced exactly and adds the round 4 analyses, with its output analysis_paper_2_v28_addendum_R1_2026-10-27_22-17-35.txt, the reproduction-check output and figure data of 27 October 2026, and its tests (test_v28_addendum_helpers.R, run_test_v28_addendum.R, test_v28_addendum_results.txt); and MD5_MANIFEST.txt, the checksum of every file.
Author Contributions
Conceptualisation, C.M.M. and K.S.; methodology, C.M.M. and K.S.; formal analysis, K.S.; data curation, K.S. and D.C.; writing, original draft preparation, C.M.M.; writing, review and editing, K.S., I.L.H. and D.C.; visualisation, C.M.M.; project administration, C.M.M. All authors have read and agreed to the published version of the manuscript.
Funding
The MonashWatch programme was funded through the Victorian Department of Health and Human Services HealthLinks: Chronic Care initiative, a capitated funding model supporting care for patients at high risk of recurrent hospital use. No separate funding was received for this study. Ishbel Henderson is funded by the National Institute for Health and Care Research (NIHR) as an Innovation Fellow at the University of Oxford.
Institutional Review Board Statement
The study was conducted in accordance with the Declaration of Helsinki and approved by the Human Research Ethics Committee of Monash Health (reference RES-16-0000522L).
Informed Consent Statement
Informed consent was obtained from all participants involved in the study. Records were linked across datasets by hashed unit record identifiers, and no identifiable data were accessed.
Data Availability Statement
All statistical analyses reported in this paper were conducted by the authors in R using a single script, analysis_paper_2_v28.R, which is provided as Supplementary Material with the outputs of its five runs, a cross-run comparison table and the script that builds it (compare_variants_v28.R), the unit tests and their results, and the round 4 addendum script (analysis_paper_2_v28_addendum.R) with its output, reproduction check and tests. A checksum manifest (MD5_MANIFEST.txt) allows any copy of these files to be confirmed unchanged, and Note S3 of the Supplementary Material links each principal estimate to the output that produces it. No file contains identifiable patient data. De-identified summary data are available from the corresponding author on reasonable request, subject to institutional and ethics approvals.
Acknowledgments
The authors acknowledge the peer navigators, clinical staff and patients of the MonashWatch programme, and Monash Health and the Victorian Department of Health and Human Services for supporting the HealthLinks: Chronic Care initiative. During the preparation of this manuscript, the authors used Claude (Anthropic, San Francisco, CA, USA; Claude Sonnet and Claude Fable 5.1, accessed through claude.ai between April and October 2026) for manuscript drafting, structural revision and editing, and to render Figures 1 to 5 from tabulated results produced by the authors. All statistical analyses were conducted by the authors in R, as described in the Methods and Data Availability Statement. The authors have reviewed and edited the output and take full responsibility for the content of this publication.
Conflicts of Interest
Carmel Martin declares a conflict of interest as majority shareholder (51%) of PHC Research Pty Ltd, Brisbane, Australia, a company that researches, develops and provides software for relational monitoring systems including PaJR. The remaining authors declare no conflicts of interest. The PaJR software originated as an academic spinout from the National Digital Research Centre of Ireland, a government-funded initiative, and the original implementation was an Irish government-funded academic project. The corresponding author’s shareholding reflects that founding academic relationship. PHC Research Pty Ltd has been funded through contracts with public health services for provision of the PaJR software and support: Monash Health (2016 to 2022, including the MonashWatch programme from which these data are drawn; the contract ended with the Victorian HealthLinks: Chronic Care initiative that funded the programme); Northern Health (to December 2026); Grampians Health (ongoing, with a transition to another software vendor planned); and East Grampians Health Service and other rural health services in Victoria (ongoing). The changes of vendor at Northern Health and Grampians Health are commercial decisions of those services, and their outbound-call monitoring programmes continue. This describes the position as at the date of submission. There is no industry sponsorship, no pharmaceutical or device company funding, and no paid consulting arrangement related to PaJR. K.S. and D.C. were involved in the delivery of the MonashWatch programme from which the data are drawn. K.S. was employed by Monash Health during the programme and is now an independent consultant. PHC Research Pty Ltd had no role in the design of this study, in data collection, in access to the MonashWatch dataset, in statistical analysis, in interpretation, in preparation of the manuscript or in the decision to submit for publication. The monitoring data were collected by Monash Health as part of routine programme delivery and were accessed under Monash Health governance. Statistical analysis was conducted by K.S., who receives no payment from PHC Research Pty Ltd and has no financial interest in the company or in the PaJR software. C.M.M. contributed to interpretation and drafting. All authors had access to the analysis script and outputs, which are provided as Supplementary Material to allow independent verification of every reported result.
Abbreviations
The following abbreviations are used in this manuscript:
| Abbreviation | Meaning |
| AUC | Area under the receiver operating characteristic curve |
| CI | Confidence interval |
| ED | Emergency department |
| GEE | Generalised estimating equations |
| HNHC | High-need, high-cost |
| IQR | Interquartile range |
| PaJR | Patient Journey Record |
| SD | Standard deviation |
References
- Martin, C.M.; Campbell, D.; Stockman, K.; Henderson, I. Detecting and Redirecting Critical Transitions in High-Need, High-Cost Patient Trajectories: An Instability–Plasticity Theory for Longitudinal Care. Systems 2026, 14, 610. [Google Scholar] [CrossRef]
- Yates, F.E. Outline of a physical theory of physiological systems. Can. J. Physiol. Pharmacol. 1982, 60, 217–248. [Google Scholar] [CrossRef]
- Waddington, C.H. The Strategy of the Genes: A Discussion of Some Aspects of Theoretical Biology; Allen and Unwin: London, UK, 1957. [Google Scholar]
- Trenaman, L.; Guh, D.; McGrail, K.; Lynd, L.D.; Bansback, N. Longitudinal trajectories of healthcare costs among high-need high-cost patients: a population-based retrospective cohort study in British Columbia, Canada. BMJ Open 2025, 15, e089693. [Google Scholar] [CrossRef]
- Hayes, S.L.; Salzberg, C.A.; McCarthy, D.; Radley, D.C.; Abrams, M.K.; Shah, T.; Anderson, G.F. High-need, high-cost patients: who are they and how do they use health care? Issue Brief. (Commonw. Fund) 2016, 26, 1–14. [Google Scholar]
- Trenaman, L.; Guh, D.; Bryan, S.; Bansback, N. Can patient-reported data improve predictions about who will be a high-need, high-cost patient in British Columbia? Qual. Life Res. 2025, 34, 2663–2676. [Google Scholar] [CrossRef]
- Kansagara, D.; Englander, H.; Salanitro, A.; Kagen, D.; Theobald, C.; Freeman, M.; Kripalani, S. Risk prediction models for hospital readmission: a systematic review. JAMA 2011, 306, 1688–1698. [Google Scholar] [CrossRef]
- Chang, E.; Ali, R.; Seibert, J.; Berkman, N.D. Interventions to improve outcomes for high-need, high-cost patients: a systematic review. J. Gen. Intern. Med. 2023, 38, 185–194. [Google Scholar] [CrossRef]
- Finkelstein, A.; Zhou, A.; Taubman, S.; Doyle, J. Health care hotspotting: a randomized, controlled trial. N. Engl. J. Med. 2020, 382, 152–162. [Google Scholar] [CrossRef]
- Takahashi, P.Y.; Pecina, J.L.; Upatising, B.; Chaudhry, R.; Shah, N.D.; Van Houten, H.; Cha, S.; Croghan, I.; Naessens, J.M.; Hanson, G.J. A randomized controlled trial of telemonitoring in older adults with multiple health issues to prevent hospitalizations and emergency department visits. Arch. Intern. Med. 2012, 172, 773–779. [Google Scholar] [CrossRef]
- Steventon, A.; Bardsley, M.; Billings, J.; Dixon, J.; Doll, H.; Hirani, S.; Cartwright, M.; Rixon, L.; Knapp, M.; Henderson, C.; et al. Effect of telehealth on use of secondary care and mortality: findings from the Whole System Demonstrator cluster randomised trial. BMJ 2012, 344, e3874. [Google Scholar] [CrossRef]
- Chang, E.; Ali, R.; Berkman, N.D. Unpacking complex interventions that manage care for high-need, high-cost patients: a realist review. BMJ Open 2022, 12, e058539. [Google Scholar] [CrossRef]
- Calderón-Larrañaga, A.; Fabbri, E.; González, A.I.; Ágh, T.; Aronson, L.; Bauer, U.; Bernabei, R.; Byles, J.; Onder, G.; Paganoni, G.; et al. Understanding changes in complex care needs over time: key research insights into multimorbidity trajectories. Lancet Healthy Longev. 2025, 6, 100790. [Google Scholar] [CrossRef]
- Martin, C.; Hinkley, N.; Stockman, K.; Campbell, D. Capitated telehealth coaching hospital readmission service in Australia: pragmatic controlled evaluation. J. Med. Internet Res. 2020, 22, e18046. [Google Scholar] [CrossRef]
- Jessup, R.L.; Stockman, K.; Nguyen, D.; Haywood, C.; Suleiman, M.; Thomas, S.; Hayes, J.; Fabri, A.M.; Campbell, D. Implementation of a peer health navigator program for patients at risk of frequent hospitalisation. BMC Geriatr. 2026, 26, 522. [Google Scholar] [CrossRef]
- Martin, C.; Hinkley, N.; Stockman, K.; Campbell, D. Potentially preventable hospitalizations: The 'pre-hospital syndrome'. Retrospective observations from the MonashWatch self-reported health journey study in Victoria, Australia. J. Eval. Clin. Pract. 2021, 27, 228–235. [Google Scholar] [CrossRef]
- Martin, C.; Hinkley, N.; Stockman, K.; Campbell, D. Resilience, health perceptions, (QOL), stressors, and hospital admissions—Observations from the real world of clinical care of unstable health journeys in Monash Watch (MW), Victoria, Australia. J. Eval. Clin. Pract. 2018, 24, 1310–1318. [Google Scholar] [CrossRef]
- Ferrier, D. HealthLinks Chronic Care. In Policy and Planning; Victorian Department of Health and Human Services: Melbourne, Australia, 2020. [Google Scholar]
- Martin, C.M.; Vogel, C.; Grady, D.; Zarabzadeh, A.; Hederman, L.; Kellett, J.; Smith, K.; O'Shea, B. Implementation of complex adaptive chronic care: the Patient Journey Record system (PaJR). J. Eval. Clin. Pract. 2012, 18, 1226–1234. [Google Scholar] [CrossRef]
- Martin, C.; Sturmberg, J. Complex adaptive chronic care. J. Eval. Clin. Pract. 2009, 15, 571–577. [Google Scholar] [CrossRef]
- Barnett, A.G.; van der Pols, J.C.; Dobson, A.J. Regression to the mean: what it is and how to deal with it. Int. J. Epidemiol. 2005, 34, 215–220. [Google Scholar] [CrossRef]
- Liang, K.Y.; Zeger, S.L. Longitudinal data analysis using generalized linear models. Biometrika 1986, 73, 13–22. [Google Scholar] [CrossRef]
- Benjamini, Y.; Hochberg, Y. Controlling the false discovery rate: a practical and powerful approach to multiple testing. J. R. Stat. Soc. Ser. B 1995, 57, 289–300. [Google Scholar] [CrossRef]
- Andersen, P.K.; Gill, R.D. Cox's regression model for counting processes: a large sample study. Ann. Stat. 1982, 10, 1100–1120. [Google Scholar] [CrossRef]
- DeLong, E.R.; DeLong, D.M.; Clarke-Pearson, D.L. Comparing the areas under two or more correlated receiver operating characteristic curves: a nonparametric approach. Biometrics 1988, 44, 837–845. [Google Scholar] [CrossRef]
- Hourican, C.; Peeters, G.; Melis, R.J.F.; Kok, A.; van Schoor, N.M.; Wezeman, S.; Olde Rikkert, M.G.M. Interpreting higher-order dependence in multimorbidity using cohort data: a partial information decomposition approach. PLoS Comput. Biol. 2026, 22, e1014386. [Google Scholar] [CrossRef]
- Krumholz, H.M. Post-hospital syndrome: an acquired, transient condition of generalized risk. N. Engl. J. Med. 2013, 368, 100–102. [Google Scholar] [CrossRef]
- Scheffer, M.; Bolhuis, J.E.; Borsboom, D.; Buchman, T.G.; Gijzel, S.M.W.; Goulson, D.; Kammenga, J.E.; Kemp, B.; van de Leemput, I.A.; Levin, S.; et al. Quantifying resilience of humans and other animals. Proc. Natl. Acad. Sci. USA 2018, 115, 11883–11890. [Google Scholar] [CrossRef]
- Olde Rikkert, M.G.; Dakos, V.; Buchman, T.G.; de Boer, R.; Glass, L.; Cramer, A.O.J.; Levin, S.; van Nes, E.; Sugihara, G.; Ferrari, M.D.; et al. Slowing down of recovery as generic risk marker for acute severity transitions in chronic diseases. Crit. Care Med. 2016, 44, 601–606. [Google Scholar] [CrossRef]
- Dakos, V.; Carpenter, S.R.; Brock, W.A.; Ellison, A.M.; Guttal, V.; Ives, A.R.; Kéfi, S.; Livina, V.; Seekell, D.A.; van Nes, E.H.; et al. Methods for detecting early warnings of critical transitions in time series illustrated using simulated ecological data. PLoS ONE 2012, 7, e41010. [Google Scholar] [CrossRef]
- Jessup, R.L.; Stockman, K.; Haywood, C.; Nguyen, D.; Tacey, M.; Thomas, S.; Campbell, D. Impact of clinician-supported peer health navigation on hospital resource utilisation amongst high risk adults: a pragmatic propensity-score matching study. Int. J. Integr. Care 2026, 26, 3. [Google Scholar] [CrossRef]
- Duffy, L.V.; Evans, R.; Bennett, V.; Mathieson, K. Therapeutic relational connection in telehealth: concept analysis. J. Med. Internet Res. 2023, 25, e43303. [Google Scholar] [CrossRef]
- van Dijk, S.H.B.; Brusse-Keizer, M.G.J.; Rodenburg, B.; Lenferink, A. Patterns of symptom deterioration can support multimorbidity management in COPD: perspectives of patients and healthcare professionals. PLoS ONE 2025, 20, e0338888. [Google Scholar] [CrossRef]
- Sioni, S.R.; Manson, L.; Arledge, N. Short-term gains, enduring potential: an integrated SDOH-focused care model delivers cost savings and patient-reported benefits. Popul. Health Manag. 2025, 28, 161–172. [Google Scholar] [CrossRef]
- Covinsky, K.E.; Pierluissi, E.; Johnston, C.B. Hospitalization-associated disability: "She was probably able to ambulate, but I'm not sure. JAMA 2011, 306, 1782–1793. [Google Scholar] [CrossRef]
- Shepperd, S.; Iliffe, S.; Doll, H.A.; Broad, M.J.; Gladman, J.; Langhorne, P.; Richards, S.H. Admission avoidance hospital at home. Cochrane Database Syst. Rev. 2016, 9, CD007491. [Google Scholar] [CrossRef]
Figure 1.
Three levels of description used in this paper, shown on a schematic monitoring record. The instability phase is a theoretical construct, the episode of deterioration is a clinical entity, and the instability window is the operational unit that is counted: two or more consecutive monitoring contacts each recording three or more alerts. The second window illustrates an admission that falls between the first and last contacts of a window. Schematic only; not drawn from participant data.
Figure 1.
Three levels of description used in this paper, shown on a schematic monitoring record. The instability phase is a theoretical construct, the episode of deterioration is a clinical entity, and the instability window is the operational unit that is counted: two or more consecutive monitoring contacts each recording three or more alerts. The second window illustrates an admission that falls between the first and last contacts of a window. Schematic only; not drawn from participant data.
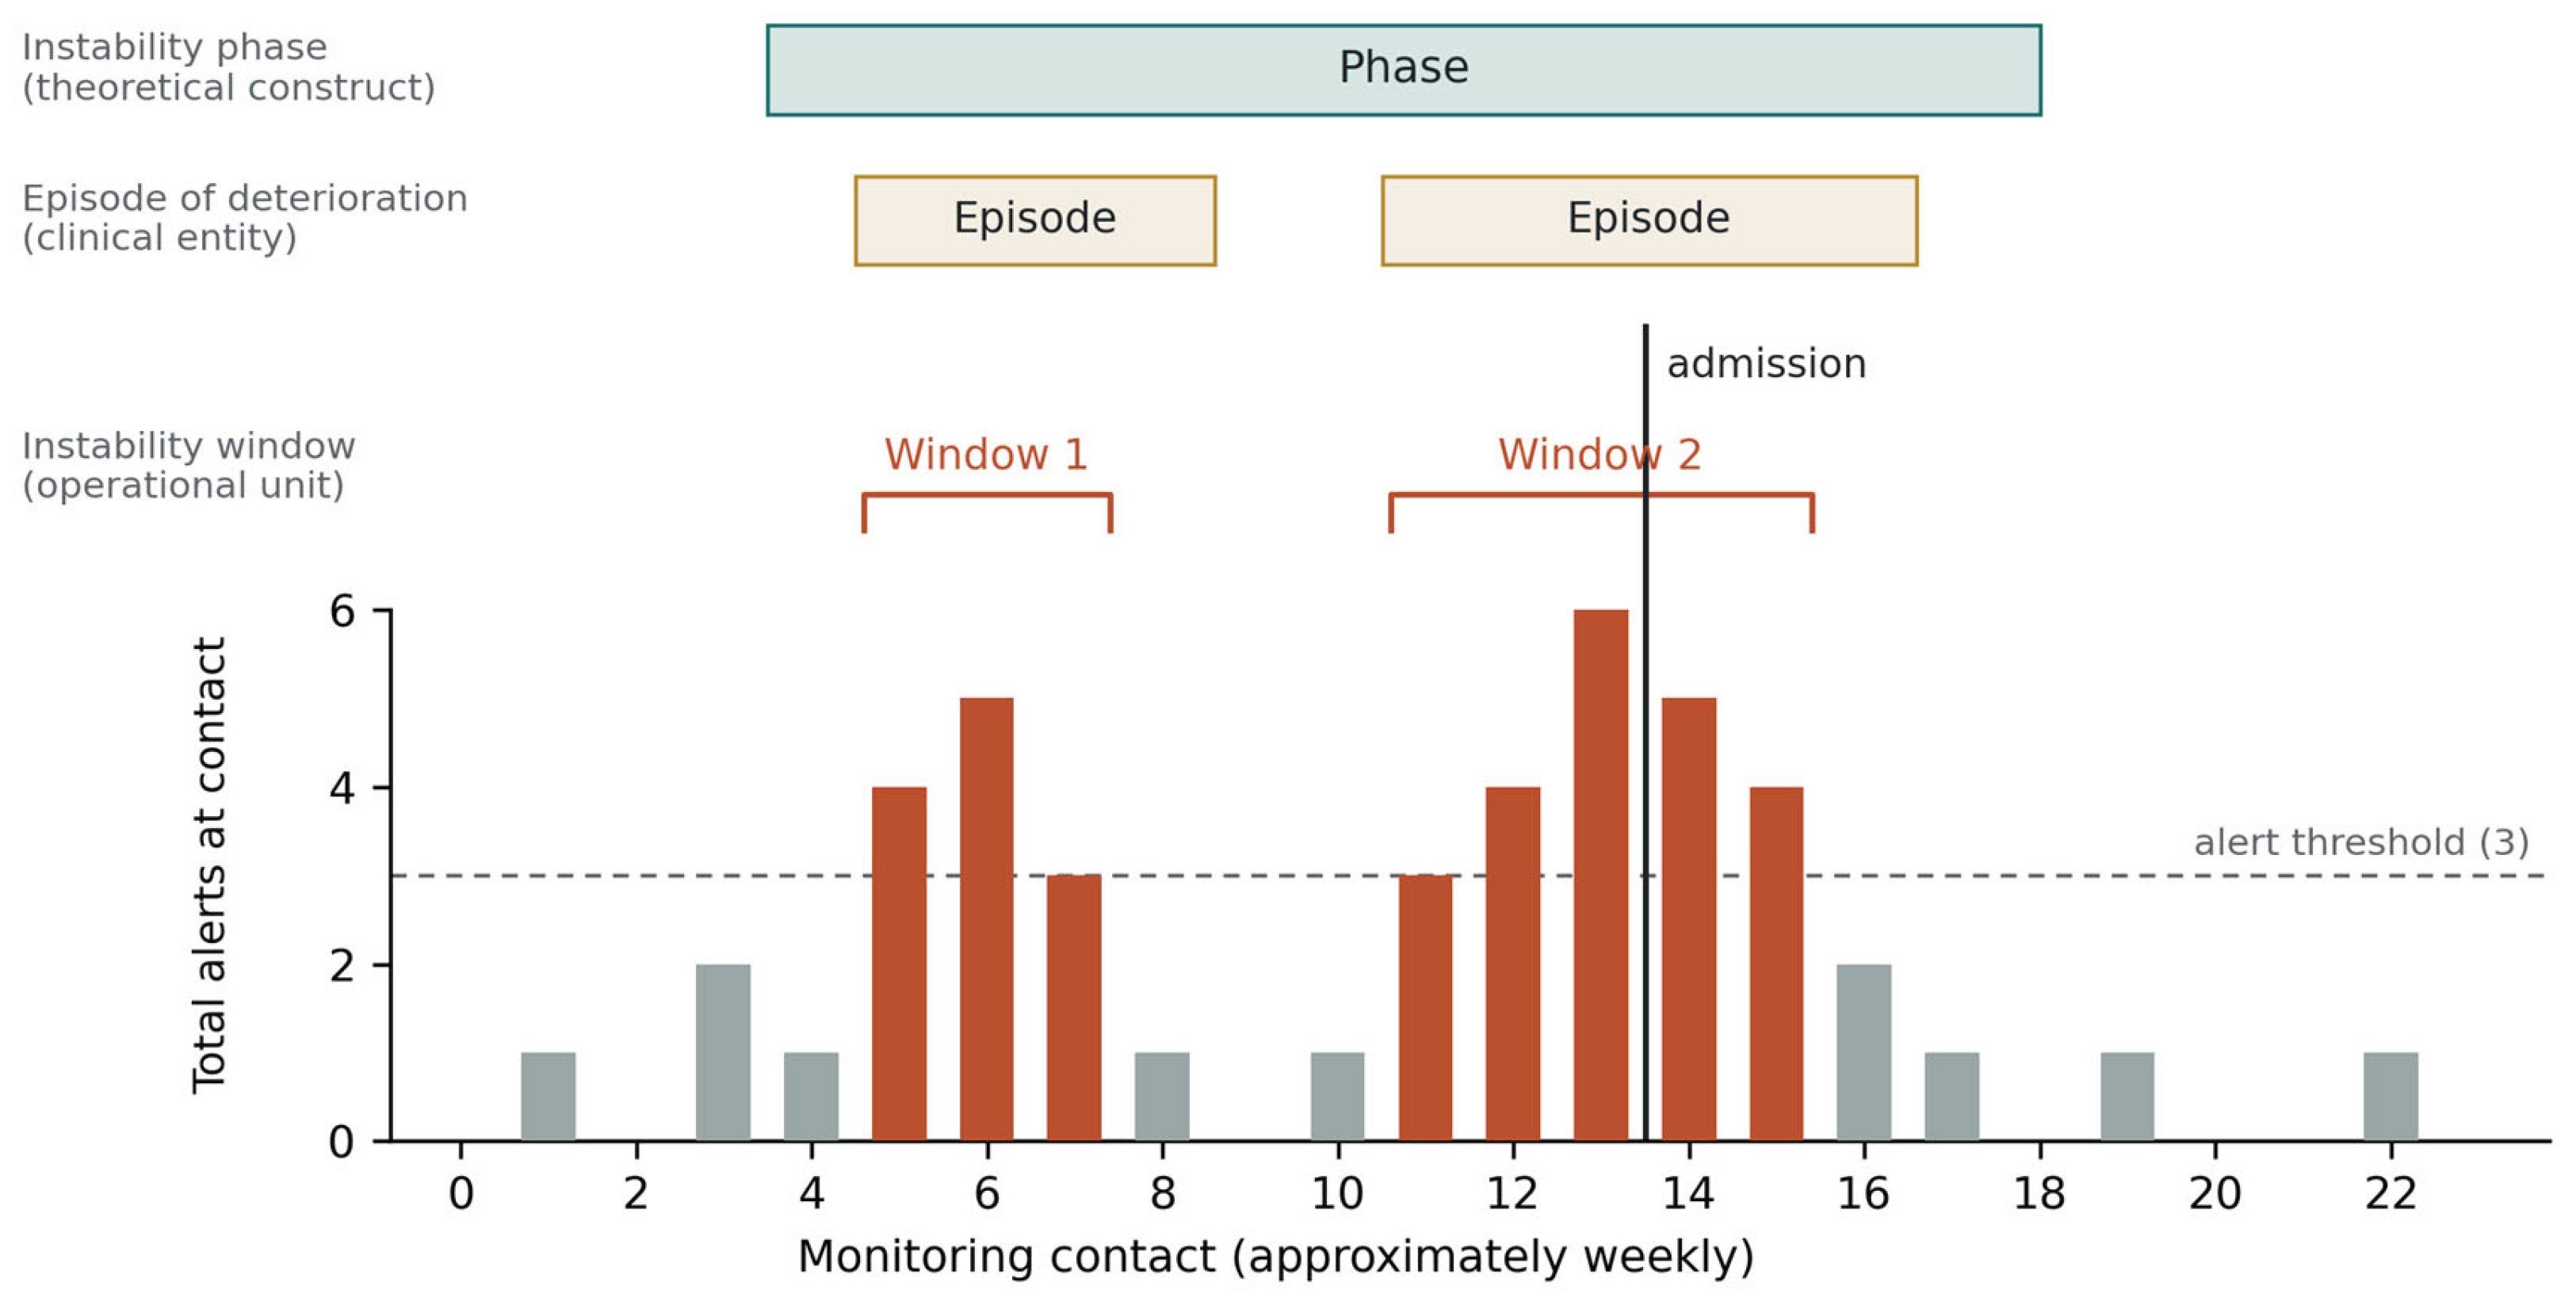
Figure 2.
Flow of participants, contacts, admissions and windows into each analysis. ED = emergency department; GEE = generalised estimating equations; AUC = area under the receiver operating characteristic curve.
Figure 2.
Flow of participants, contacts, admissions and windows into each analysis. ED = emergency department; GEE = generalised estimating equations; AUC = area under the receiver operating characteristic curve.
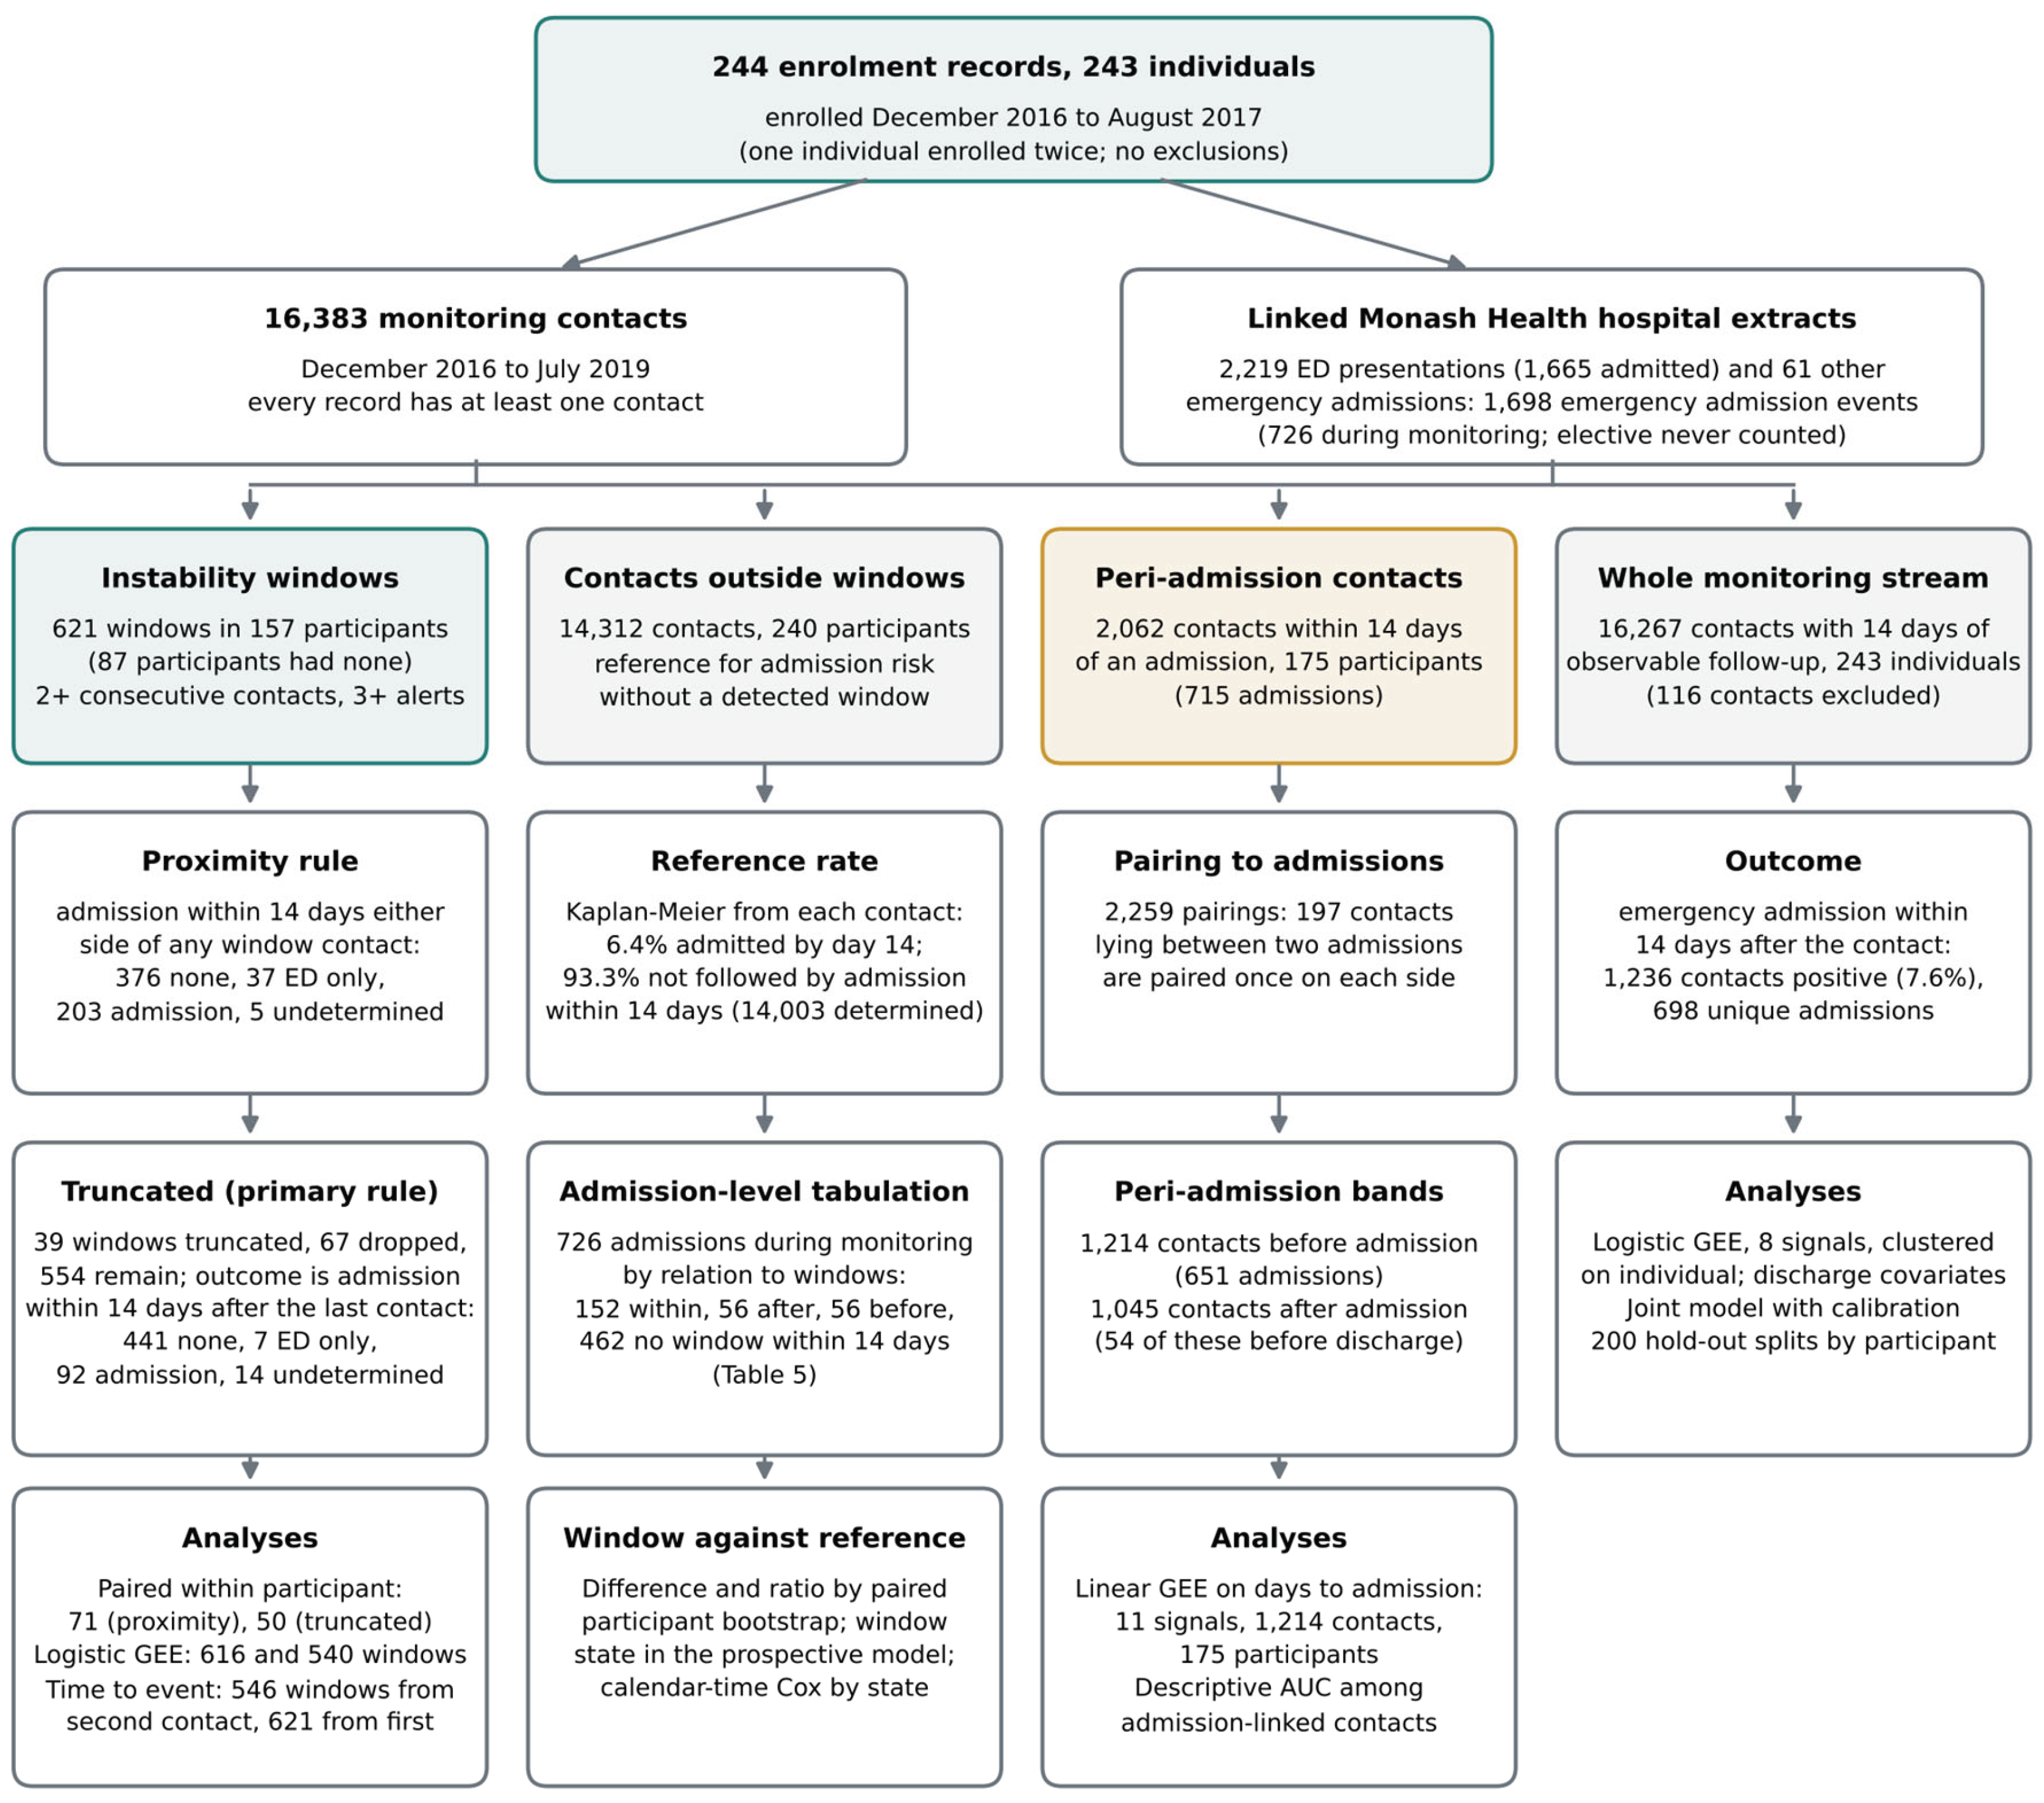
Figure 3.
What followed detected instability windows. (A) Position of the nearest matched admission relative to the window for the 203 windows linked to an admission under the proximity rule. (B) Percentage of windows with a determined outcome that were not followed by admission, by linkage rule and outcome horizon, with the reference from contacts outside windows. Bars at 14 days are participant-level bootstrap 95% confidence intervals, as in Table 3; bars at the other horizons are Wilson 95% intervals, which treat windows as independent and are secondary. (C) Kaplan-Meier cumulative probability of emergency admission from the second window contact, from the first window contact, from contacts outside windows (original reference; the ratios in Table 4 are against the forward-only reference, Section 2.6) and from contacts with zero alerts outside windows. Shaded bands are participant-level bootstrap intervals.
Figure 3.
What followed detected instability windows. (A) Position of the nearest matched admission relative to the window for the 203 windows linked to an admission under the proximity rule. (B) Percentage of windows with a determined outcome that were not followed by admission, by linkage rule and outcome horizon, with the reference from contacts outside windows. Bars at 14 days are participant-level bootstrap 95% confidence intervals, as in Table 3; bars at the other horizons are Wilson 95% intervals, which treat windows as independent and are secondary. (C) Kaplan-Meier cumulative probability of emergency admission from the second window contact, from the first window contact, from contacts outside windows (original reference; the ratios in Table 4 are against the forward-only reference, Section 2.6) and from contacts with zero alerts outside windows. Shaded bands are participant-level bootstrap intervals.
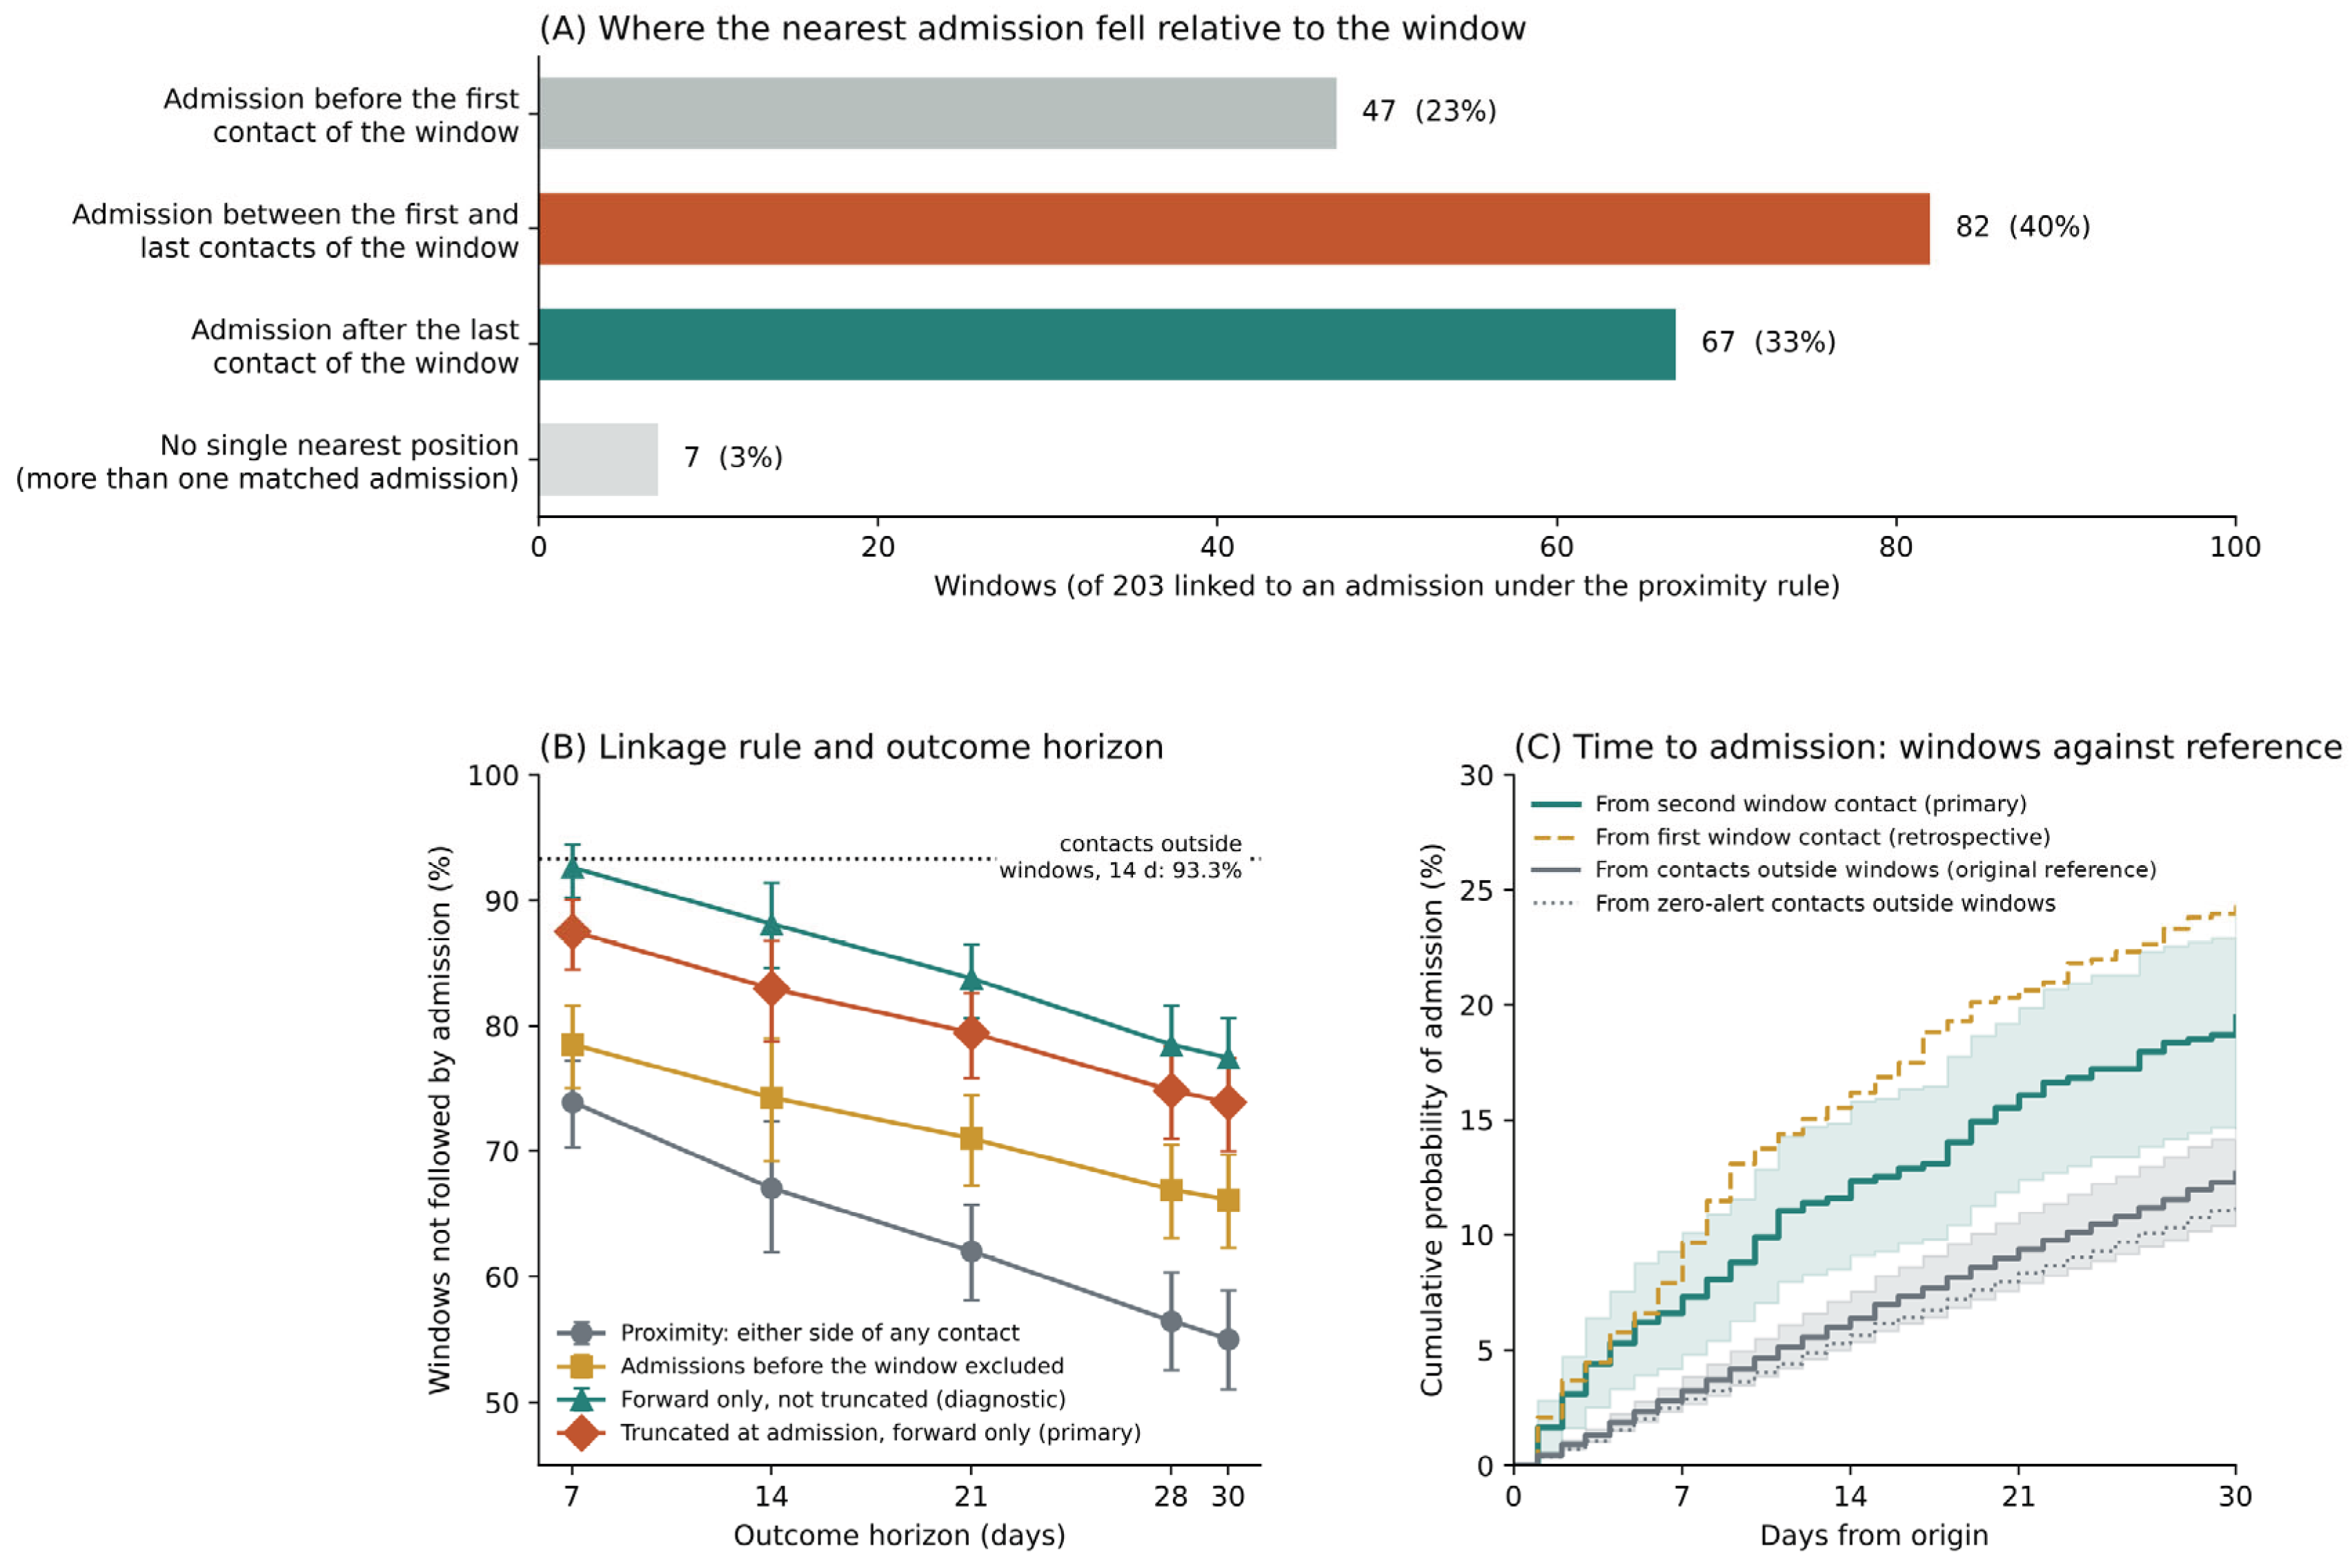
Figure 4.
Window characteristics and admission. (A) Odds ratio per SD for admission, from logistic GEE clustered on participant, under the proximity rule and after truncation at admission with forward classification; the open circle is red-domain breadth under the proximity rule with the Health Care domain removed from all alert measures. (B) Hazard ratio per SD for time from window onset to emergency admission, for covariates measured at the first contact of the window, under three censoring rules and, as open circles, under the primary rule with discharge within 14 days as a covariate. Bars are 95% confidence intervals.
Figure 4.
Window characteristics and admission. (A) Odds ratio per SD for admission, from logistic GEE clustered on participant, under the proximity rule and after truncation at admission with forward classification; the open circle is red-domain breadth under the proximity rule with the Health Care domain removed from all alert measures. (B) Hazard ratio per SD for time from window onset to emergency admission, for covariates measured at the first contact of the window, under three censoring rules and, as open circles, under the primary rule with discharge within 14 days as a covariate. Bars are 95% confidence intervals.
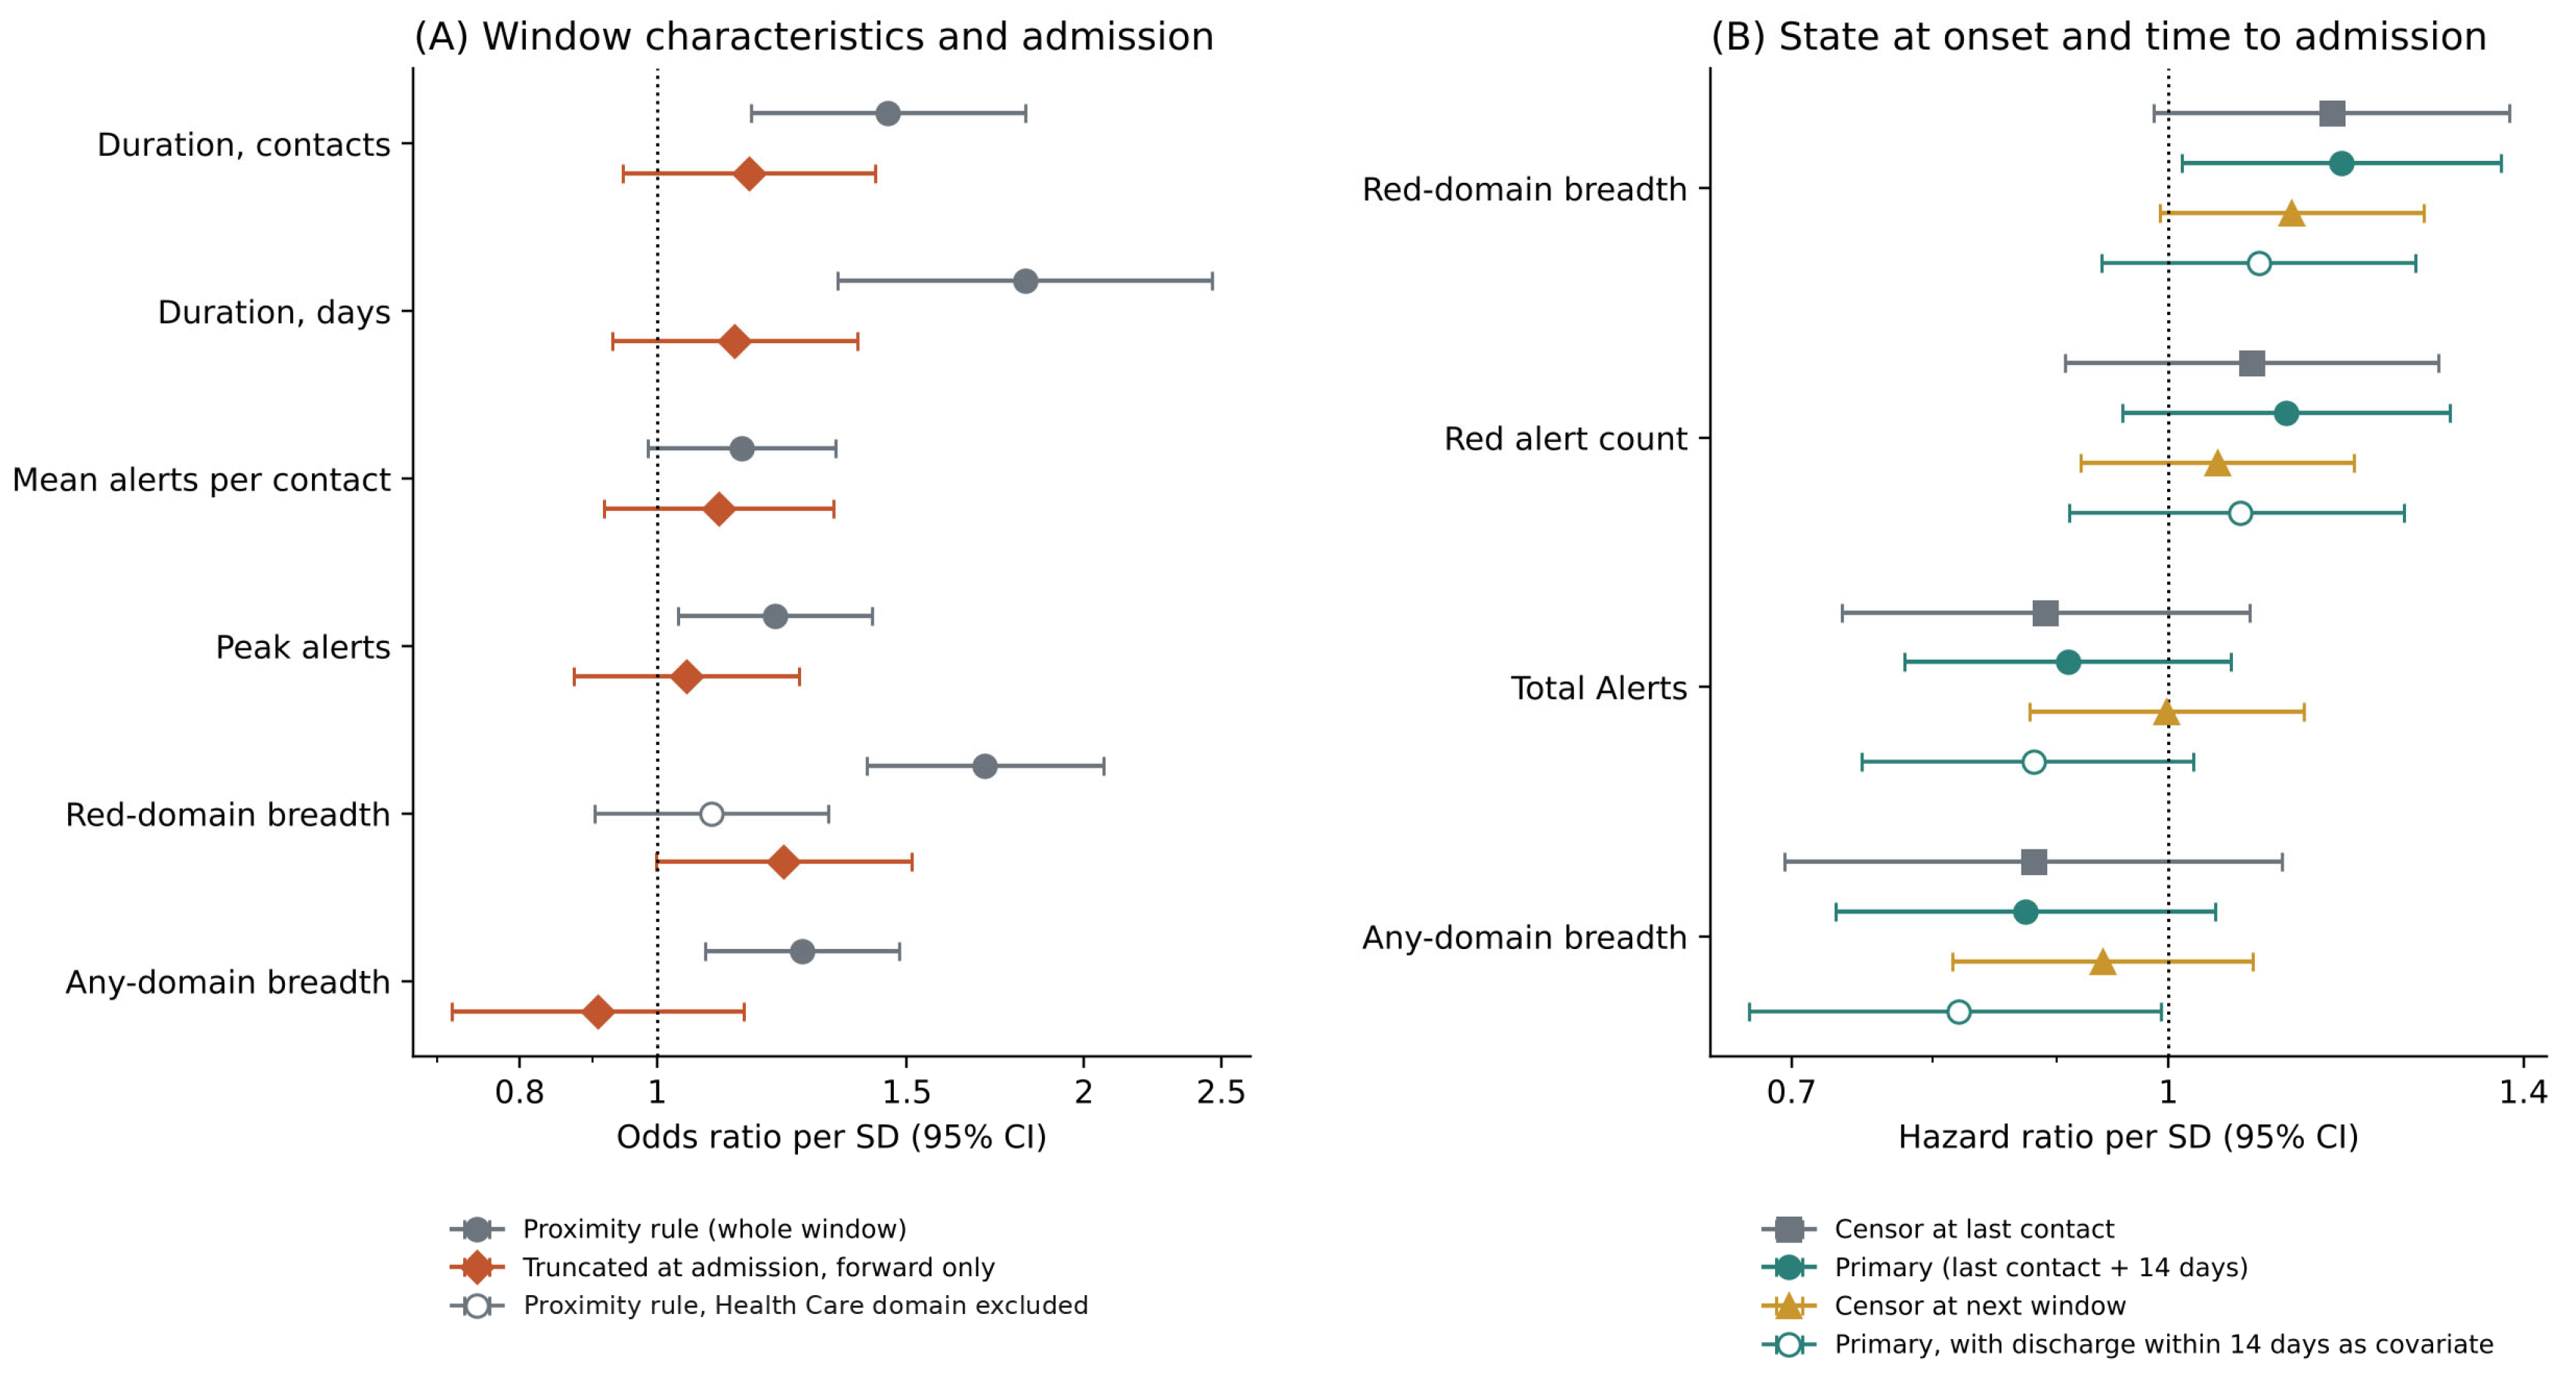
Figure 5.
Alert burden around emergency admissions, with and without the Health Care domain, and a conceptual account of why admission may address the acute event without altering the trajectory. (A) Observed mean Total Alerts and red alerts per contact in nine bands relative to the date of admission (2,259 contact-admission pairings, 175 participants; 62 to 370 contacts per band), on the full alert score and with the Health Care domain excluded. (B) Causal loop representation. Admission is proposed to close a balancing loop (B) on the acute deterioration that precipitated it, while the process of hospitalisation is proposed to close a reinforcing loop (R) that reduces physiological and social reserve and raises susceptibility to the next disturbance. Plus and minus signs give the direction of each proposed effect. Panel B is a hypothesis-generating conceptual model. It was not estimated from these data.
Figure 5.
Alert burden around emergency admissions, with and without the Health Care domain, and a conceptual account of why admission may address the acute event without altering the trajectory. (A) Observed mean Total Alerts and red alerts per contact in nine bands relative to the date of admission (2,259 contact-admission pairings, 175 participants; 62 to 370 contacts per band), on the full alert score and with the Health Care domain excluded. (B) Causal loop representation. Admission is proposed to close a balancing loop (B) on the acute deterioration that precipitated it, while the process of hospitalisation is proposed to close a reinforcing loop (R) that reduces physiological and social reserve and raises susceptibility to the next disturbance. Plus and minus signs give the direction of each proposed effect. Panel B is a hypothesis-generating conceptual model. It was not estimated from these data.
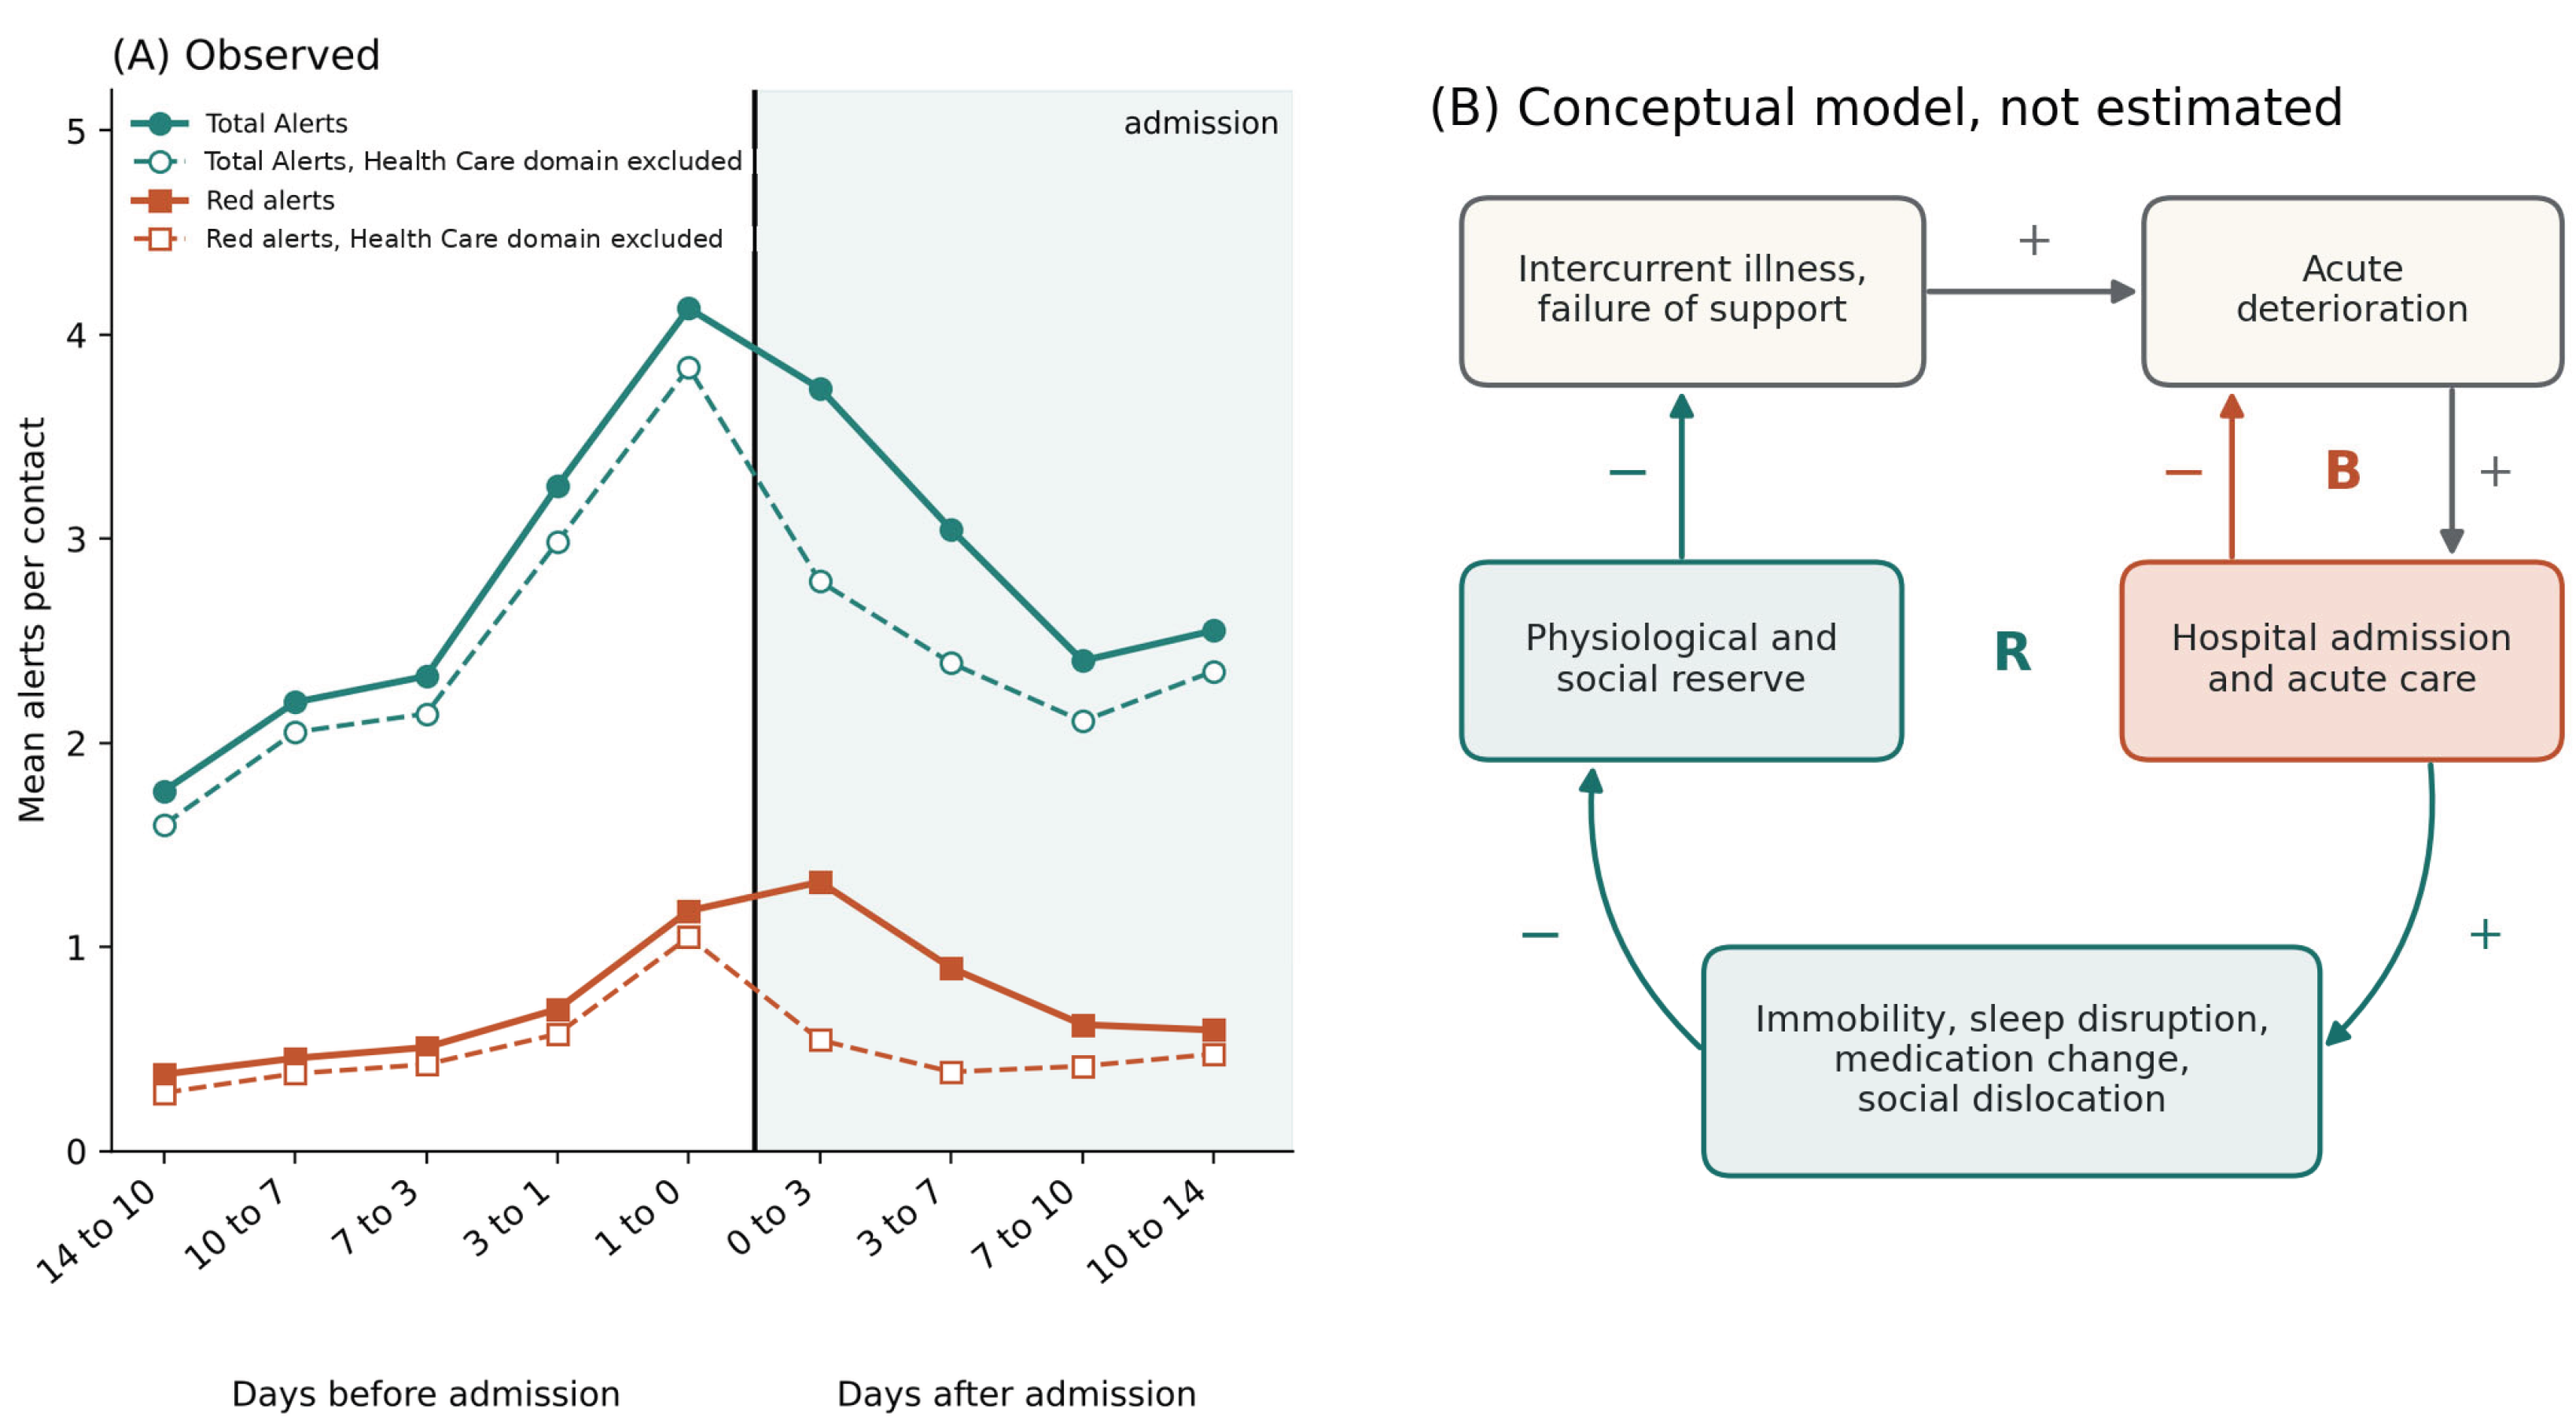

Table 1.
Data sources and units of analysis.
| Source | Unit | n | Participants | Used for |
|---|---|---|---|---|
| Monitoring extract | Contact | 16,383 | 244 records (243 individuals) | Window detection; reference rate; prospective analysis |
| Hospital extracts (Monash Health) | Emergency admission event | 1,698 (from 2,219 ED presentations and 61 type O admissions) | 243 | All outcomes; admission-level tabulation (726 during monitoring) |
| Instability windows | Window | 621 (554 after truncation at admission) | 157 | Window outcomes, characteristics, time to admission |
| Contacts outside windows | Contact | 14,312 | 240 | Reference rate for admission outside windows |
| Peri-admission set | Contact within 14 days of an admission | 2,062 contacts; 2,259 contact-admission pairings | 175 | Peri-admission bands (Table 8); retrospective signal analysis (Table 9) |
| Prediction set | Contact with 14 days of observable follow-up | 16,267 | 243 | Prospective analysis (Table 10) |
ED = emergency department. In the peri-admission set each contact is first assigned to its single nearest admission (2,062 contacts, none in more than one pairing). For the banded and retrospective analyses each contact keeps its nearest admission on each side, so that a contact lying between two admissions counts as after the first and before the second. This gives 2,259 pairings, in which 197 contacts appear twice: 1,214 before an admission (from 651 admissions, a median of 2 contacts per admission) and 1,045 after. An earlier pilot extract is described in the Supplementary Material.
Table 2.
Participant characteristics by instability window group (proximity linkage rule).
| Characteristic | No windows | Windows, none with admission | Windows, all with admission | Both kinds of window |
|---|---|---|---|---|
| Enrolment records, n | 87 | 50 | 29 | 71 |
| Age, years, median (IQR) | 71 (61 to 80) | 72 (62 to 81) | 70 (57 to 79) | 71 (58 to 80) |
| Female, n (%) | 32 (37) | 23 (46) | 15 (52) | 42 (59) |
| Contacts per record, median (IQR) | 62 (19 to 82) | 79 (57 to 100) | 60 (19 to 79) | 82 (62 to 104) |
| Follow-up, months, median (IQR) | 20 (5 to 24) | 25 (17 to 27) | 19 (5 to 24) | 24 (17 to 27) |
| Follow-up under 6 months, n (%) | 25 (29) | 3 (6) | 8 (28) | 2 (3) |
| Alerts per contact, mean (SD) | 0.46 (1.03) | 1.32 (2.19) | 1.25 (2.37) | 2.39 (3.04) |
| Contacts with a red alert, % | 6.4 | 14.0 | 16.7 | 27.9 |
| Emergency admissions per person-year during monitoring | 1.51 | 0.86 | 3.58 | 2.63 |
| Windows per person-year | 0 | 1.51 | 1.35 | 3.34 |
| Died in hospital, n (%) | 6 (7) | 3 (6) | 4 (14) | 5 (7) |
IQR = interquartile range. Groups are defined under the proximity rule (Section 2.5) using windows with no acute care contact and windows with an admission. A further 7 records had only windows with an ED attendance alone or an undetermined outcome and are not shown. Age is at first ED presentation. Admissions per person-year count emergency admission events dated between each participant’s first and last contact, divided by person-time over the same span; admissions before enrolment and after the last contact are excluded. Counts of deaths are small, and group differences should not be interpreted.
Table 3.
Outcomes of instability windows at 14 days under three linkage rules.
| Linkage rule | Windows | No acute care contact | ED attendance only | Emergency admission | Not determined | Not followed by admission, % (participant-level bootstrap 95% CI; Wilson 95% CI) |
|---|---|---|---|---|---|---|
| (a) Proximity: admission within 14 days either side of any window contact | 621 | 376 | 37 | 203 | 5 | 67.0 (62.0 to 72.4; 63.2 to 70.6) |
| (b) As (a), admissions before the first window contact not counted | 621 | 421 | 35 | 158 | 7 | 74.3 (69.2 to 79.0; 70.7 to 77.6) |
| (c) Primary: window truncated at admission; admission within 14 days after last contact | 554 | 441 | 7 | 92 | 14 | 83.0 (78.7 to 86.8; 79.6 to 85.9) |
| Diagnostic: forward only, windows not truncated | 621 | 514 | 13 | 71 | 23 | 88.1 (84.6 to 91.4; 85.3 to 90.5) |
| Reference: monitoring contacts outside windows (original reference) | 14,312 contacts | 309 | 93.3 (92.1 to 94.4; participant-level bootstrap only) |
ED = emergency department. Percentages are of windows with a determined outcome. The first interval is a participant-level bootstrap 95% CI, which allows for repeated windows within participants and is the principal interval; the second is a Wilson interval, which treats windows as independent. The reference row carries a participant-level bootstrap interval only. Under rules (a) and (b) the final column is the proportion not associated with an admission, since the admission may precede or fall within the window. The diagnostic row is not a valid estimate: windows that contain an admission are classified by whether a further admission follows them, and 72 of the 89 such windows move to the no acute care category. The reference row gives the proportion of the 14,003 determined contacts outside all windows with no emergency admission in the following 14 days, with a participant-level bootstrap interval; among contacts with zero alerts outside windows it was 94.2% (93.0 to 95.2).
Table 4.
Proportion of windows not followed by admission, and cumulative probability of admission, by outcome horizon.
Table 4.
Proportion of windows not followed by admission, and cumulative probability of admission, by outcome horizon.
| 7 days | 14 days | 21 days | 28 days | 30 days | |
|---|---|---|---|---|---|
| (a) Proximity rule, % | 73.9 (70.3 to 77.3) | 67.0 (63.2 to 70.6) | 62.0 (58.1 to 65.8) | 56.5 (52.6 to 60.4) | 55.0 (51.1 to 58.9) |
| (b) Admissions before the window not counted, % | 78.5 (75.1 to 81.6) | 74.3 (70.7 to 77.6) | 71.0 (67.3 to 74.5) | 66.9 (63.1 to 70.5) | 66.1 (62.3 to 69.8) |
| (c) Truncated, forward, % | 87.5 (84.5 to 90.1) | 83.0 (79.6 to 85.9) | 79.4 (75.8 to 82.6) | 74.9 (71.0 to 78.3) | 73.9 (70.0 to 77.4) |
| Diagnostic: forward, not truncated, % | 92.6 (90.2 to 94.5) | 88.1 (85.3 to 90.5) | 83.8 (80.6 to 86.5) | 78.5 (75.0 to 81.6) | 77.4 (73.9 to 80.6) |
| Cumulative probability of admission from the second window contact, % | 7.3 (4.8 to 10.1) | 12.3 (9.1 to 15.8) | 16.1 (12.4 to 19.9) | 19.5 (15.4 to 23.8) | |
| Cumulative probability of admission from the first window contact, % | 9.7 (7.0 to 12.8) | 16.2 (12.7 to 19.9) | 20.6 (16.2 to 25.3) | 24.5 (19.6 to 29.6) | |
| Reference: cumulative probability from contacts outside windows (original reference), % | 3.2 (2.7 to 3.9) | 6.4 (5.3 to 7.6) | 9.4 (7.9 to 11.0) | 12.6 (10.7 to 14.6) | |
| Forward-only reference, % | 3.5 | 6.7 | 9.7 | 13.1 | |
| Ratio, second contact to forward-only reference | 2.12 (1.43 to 2.96) | 1.84 (1.37 to 2.41) | 1.65 (1.28 to 2.08) | 1.49 (1.19 to 1.84) |
Rows (a) to (c) and the diagnostic row give the percentage of windows with a determined outcome that were not followed by (or, for rules (a) and (b), not associated with) an emergency admission, with Wilson 95% confidence intervals, which treat windows as independent and are secondary to the participant-level bootstrap intervals in Table 3; rule (c) had 536 to 540 determined windows at each horizon. The cumulative probabilities are Kaplan-Meier estimates with follow-up to the earliest of 30 days, the participant’s last contact and the end of the hospital extract, with participant-level bootstrap intervals; the second-contact rows exclude 67 windows with an admission on or before the second contact. The reference comprises 14,095 contacts outside all windows with follow-up (1,760 events, 238 participants). The forward-only reference adds the 326 window contacts made on or after an admission inside their window (14,413 contacts with follow-up, 1,862 events, 240 participants); its probabilities are given without intervals, and the ratios are against it. Ratios are from a paired participant-level bootstrap. These rows have different time origins and populations and are not estimates of one quantity. Full counts are in Table S3.
Table 5.
Emergency admissions during monitoring by their relation to detected instability windows (726 admissions).
Table 5.
Emergency admissions during monitoring by their relation to detected instability windows (726 admissions).
| Relation to detected windows | Admissions, n (%) | Participants | With Health Care domain excluded, n (%) |
|---|---|---|---|
| Within a window (between its first and last contact) | 152 (20.9) | 71 | 126 (17.4) |
| Within 14 days after the end of a window | 56 (7.7) | 38 | 59 (8.1) |
| Only preceding a window that began 1 to 14 days later | 56 (7.7) | 41 | 51 (7.0) |
| No window within 14 days, participant had windows at other times | 286 (39.4) | 94 | 279 (38.4) |
| No window within 14 days, participant had no windows | 176 (24.2) | 42 | 211 (29.1) |
| By timescale of the signal before the admission (post hoc) | |||
| Subacute: within a window after two or more of its contacts, or within 14 days after a window ended | 141 (19.4) | 64 | 130 (17.9) |
| Acute: single elevated contact immediately before the admission | 86 (11.8) | 64 | 84 (11.6) |
| Earlier window only (ended more than 14 days before) | 281 (38.7) | 89 | 272 (37.5) |
| Last contact below the three-alert threshold, no earlier window | 216 (29.8) | 69 | 236 (32.5) |
Admissions are emergency admission events dated between the participant’s first and last monitoring contact. Each admission appears once in the upper part and once in the lower part; two admissions in two smaller groups (no monitoring contact before the admission; last elevated contact more than 7 days before) are not shown separately (counts below 5 suppressed). Of the 86 acute admissions, 50 fell inside a window whose first contact was the single elevated contact before the admission; these correspond to windows dropped by truncation under rule (c). The participant count is the number of participants contributing at least one admission to the row. An elevated contact is one with Total Alerts of three or more. No elevated contact: the last contact dated before the admission had Total Alerts below three, no instability window had ended before the admission, and the admission did not fall within a window that already had at least two contacts before the admission. At that last contact, 151 of these 216 admissions had no alert and 65 had one or two. Contacts on the admission date are not used, because a contact has a date but no time and cannot be placed before or after the admission. The category means that no elevated-alert signal was detected immediately before the admission, not that no concern was recorded.
Table 6.
Window characteristics and admission under the proximity rule and after truncation at admission.
Table 6.
Window characteristics and admission under the proximity rule and after truncation at admission.
| Proximity rule (a) | Truncated, forward (c) | |||
|---|---|---|---|---|
| Characteristic | Paired difference (95% CI); adjusted p | Odds ratio per SD (95% CI); adjusted p | Paired difference (95% CI); adjusted p | Odds ratio per SD (95% CI); adjusted p |
| Duration, contacts | 0.5 (0.0 to 1.0); 0.080 | 1.46 (1.17 to 1.82); 0.002 | 0.2 (−0.4 to 1.0); 0.96 | 1.16 (0.95 to 1.43); 0.43 |
| Duration, days | 5.8 (2.3 to 9.8); 0.004 | 1.82 (1.34 to 2.46); < 0.001 | −0.3 (−3.0 to 3.0); 0.96 | 1.13 (0.93 to 1.38); 0.43 |
| Mean alerts per contact | 0.24 (−0.12 to 0.62); 0.18 | 1.15 (0.99 to 1.34); 0.077 | 0.00 (−0.44 to 0.45); 0.99 | 1.11 (0.92 to 1.33); 0.44 |
| Peak alerts | 0.75 (−0.04 to 1.44); 0.082 | 1.21 (1.04 to 1.42); 0.020 | −0.17 (−1.00 to 0.78); 0.96 | 1.05 (0.87 to 1.26); 0.61 |
| Red-domain breadth | 0.23 (0.14 to 0.32); < 0.001 | 1.70 (1.41 to 2.06); < 0.001 | 0.06 (−0.07 to 0.17); 0.96 | 1.23 (1.00 to 1.51); 0.31 |
| Red-domain breadth, Health Care domain excluded | −0.02 (−0.09 to 0.07); 0.72 | 1.09 (0.90 to 1.32); 0.44 | 0.07 (−0.06 to 0.19); 0.76 | 1.21 (0.97 to 1.51); 0.35 |
| Any-domain breadth | 0.17 (0.02 to 0.34); 0.047 | 1.27 (1.08 to 1.48); 0.005 | −0.07 (−0.28 to 0.14); 0.96 | 0.91 (0.72 to 1.15); 0.51 |
| Participants or windows, n | 71 participants | 616 windows, 154 participants | 50 participants | 540 windows, 145 participants |
Paired difference is the Hodges-Lehmann estimate of the within-participant difference (windows with admission minus windows with no acute care contact), from participants contributing both; p from the Wilcoxon signed-rank test. Odds ratios are from logistic GEE clustered on participant, exchangeable working correlation, for admission against all other determined outcomes. Adjusted p is Benjamini-Hochberg adjusted within each column (family of six). The Health Care domain row is from the run with that domain removed from all alert measures (69 paired participants; 577 and 514 windows). Under truncation the smallest unadjusted paired p was 0.28 (red-domain breadth). When windows with an ED attendance only were grouped with those with no acute care contact, the truncated paired results were similar (smallest unadjusted p = 0.34).
Table 7.
State at window onset and time to emergency admission: Cox models, one covariate at a time, by censoring rule.
Table 7.
State at window onset and time to emergency admission: Cox models, one covariate at a time, by censoring rule.
| Covariate at first window contact | Censored at last contact (101 events) | Primary: last contact plus 14 days (149 events) | Censored at next window onset (256 events) | Primary rule with discharge within 14 days as covariate |
|---|---|---|---|---|
| Red-domain breadth | 1.17 (0.99 to 1.38); 0.072 | 1.18 (1.01 to 1.37); 0.033 | 1.12 (0.99 to 1.27); 0.066 | 1.09 (0.94 to 1.26); 0.26 |
| Red alert count | 1.08 (0.91 to 1.29); 0.38 | 1.12 (0.96 to 1.31); 0.16 | 1.05 (0.92 to 1.19); 0.48 | 1.07 (0.91 to 1.25); 0.43 |
| Total Alerts | 0.89 (0.73 to 1.08); 0.24 | 0.91 (0.78 to 1.06); 0.23 | 1.00 (0.88 to 1.14); 0.98 | 0.88 (0.75 to 1.02); 0.096 |
| Any-domain breadth | 0.88 (0.70 to 1.11); 0.29 | 0.87 (0.73 to 1.05); 0.14 | 0.94 (0.82 to 1.08); 0.39 | 0.82 (0.67 to 0.99); 0.043 |
Values are hazard ratios per SD (95% CI) and unadjusted p, from Cox models of 621 windows with robust standard errors clustered on participant. No covariate had a Benjamini-Hochberg adjusted p below 0.05 under any rule (family of four; smallest adjusted p = 0.13). Eleven windows linked to an admission under the proximity rule had their admission on or before the first window contact and contribute no event. With the Health Care domain removed from the covariates, the primary-rule hazard ratio for red-domain breadth was 1.10 (0.93 to 1.29).
Table 8.
Monitoring signals by time relative to emergency admission (175 participants; 2,259 contact-admission pairings).
Table 8.
Monitoring signals by time relative to emergency admission (175 participants; 2,259 contact-admission pairings).
| Time relative to admission | Contacts, n | Total Alerts, mean (SD) | Total Alerts without Health Care domain, mean | Red alerts, mean (SD) | Red alerts without Health Care domain, mean | Self-rated health Q3, mean (SD) | Health score Q26, mean (SD) [n] | Navigator concern Q34, % [n] |
|---|---|---|---|---|---|---|---|---|
| 7 to 14 days before | 585 | 1.96 (2.70) | 1.81 | 0.41 (0.77) | 0.33 | 2.26 (0.98) | 3.77 (1.79) [252] | 16.4 [581] |
| 0 to 7 days before | 629 | 2.80 (3.55) | 2.57 | 0.63 (1.03) | 0.53 | 2.48 (1.10) | 4.51 (2.11) [281] | 24.6 [621] |
| 0 to 7 days after | 512 | 3.29 (3.20) | 2.53 | 1.05 (1.00) | 0.44 | 2.56 (0.94) | 4.09 (1.81) [314] | 23.0 [509] |
| 7 to 14 days after | 533 | 2.49 (3.23) | 2.25 | 0.60 (0.98) | 0.45 | 2.41 (1.02) | 4.38 (2.04) [253] | 20.1 [533] |
| Sensitivity analyses, contacts after admission | ||||||||
| 0 to 7 days after, made after discharge only | 457 | 3.22 | 2.47 | 1.03 | 0.43 | |||
| 0 to 7 days after discharge | 611 | 3.19 (3.20) | 2.53 | 0.99 (0.98) | 0.46 | 2.55 (0.93) | ||
| 7 to 14 days after discharge | 362 | 2.18 (3.11) | 2.02 | 0.47 (0.91) | 0.38 | 2.30 (1.03) | ||
| 0 to 7 days after, excluding contacts within 14 days before a later admission | 405 | 3.20 (3.02) | 1.03 (0.98) | 2.52 (0.93) | ||||
| 7 to 14 days after, excluding the same | 448 | 2.40 (3.11) | 0.56 (0.95) | 2.38 (0.98) |
Bands in the upper part are anchored to the date of admission. Of the 512 contacts in the first week after admission, 46 (9.0%) were made before discharge (mean Total Alerts 4.02; 3.17 without the Health Care domain), and 8 of 533 in the second week; 107 and 85 contacts in the two post-admission bands also lay within 14 days before a later admission. Q3 is scored 0 to 5 and Q26 as 9 minus the raw score; higher is worse for both. Q26 is recorded by exception and its n is the number of contacts at which it was recorded. Blank cells were not estimated.
Table 9.
Signals in the 14 days before emergency admissions that occurred (1,214 contacts, 175 participants, 651 admissions).
Table 9.
Signals in the 14 days before emergency admissions that occurred (1,214 contacts, 175 participants, 651 admissions).
| Signal | Contacts, n | Change per day closer to admission, β (95% CI) | Adjusted p | AUC, final 7 days against days 7 to 14 (95% CI) |
|---|---|---|---|---|
| Total Alerts | 1,214 | 0.117 (0.078 to 0.157) | < 0.001 | 0.557 (0.526 to 0.588) |
| Health score (Q26) | 533 | 0.075 (0.046 to 0.103) | < 0.001 | 0.601 (0.554 to 0.648) |
| Self-rated health (Q3) | 1,208 | 0.032 (0.020 to 0.044) | < 0.001 | 0.555 (0.524 to 0.585) |
| Red alerts | 1,214 | 0.032 (0.020 to 0.043) | < 0.001 | 0.547 (0.520 to 0.573) |
| Concerns today (Q1) | 1,211 | 0.015 (0.009 to 0.021) | < 0.001 | 0.547 (0.520 to 0.574) |
| Navigator concern (Q34) | 1,202 | 0.014 (0.009 to 0.019) | < 0.001 | 0.541 (0.519 to 0.564) |
| Eating, drinking, toileting (Q23) | 593 | 0.008 (0.001 to 0.016) | 0.048 | 0.536 |
| Not going outdoors (Q24) | 593 | 0.008 (−0.000 to 0.015) | 0.081 | 0.532 |
| Sleep problem (Q25) | 571 | −0.002 (−0.011 to 0.008) | 0.71 | 0.504 |
| Expected health, ordinal (Q21) | 474 | −0.007 (−0.018 to 0.004) | 0.24 | 0.503 (0.457 to 0.549) |
| Expects to be worse, binary (Q21) | 474 | 0.002 (−0.002 to 0.005) | 0.35 | 0.509 (0.496 to 0.523) |
β is from a linear GEE with the signal as the dependent variable and days from admission as the covariate, clustered on the individual with an exchangeable working correlation; for binary signals it is a change in proportion per day. Adjusted p is Benjamini-Hochberg adjusted across the 11 signals. AUC is from unadjusted logistic regression (629 contacts in the final 7 days against 585 in days 7 to 14), with DeLong intervals where calculated, which do not allow for clustering of contacts within individuals; participant-level bootstrap intervals were similar. Every contact in this table was followed by an admission, so the AUC describes separation of nearer from further contacts and is not a measure of prediction of admission. AUCs are not comparable across rows because items recorded by exception are present at a subset of contacts.
Table 10.
Association between signals at a monitoring contact and emergency admission within the following 14 days (16,267 contacts, 243 individuals; 1,236 contacts followed by admission, covering 698 admissions).
Table 10.
Association between signals at a monitoring contact and emergency admission within the following 14 days (16,267 contacts, 243 individuals; 1,236 contacts followed by admission, covering 698 admissions).
| Predictor at the contact | Contacts, n | Odds ratio (95% CI) | p | Adjusted p |
|---|---|---|---|---|
| Concerns today (Q1) | 16,263 | 1.45 (1.25 to 1.69) | < 0.001 | < 0.001 |
| Navigator concern (Q34) | 16,223 | 1.43 (1.15 to 1.78) | 0.001 | 0.002 |
| Medication concerns (Q7) | 13,872 | 1.33 (1.04 to 1.72) | 0.025 | 0.034 |
| Self-rated health (Q3), per point | 16,251 | 1.30 (1.18 to 1.44) | < 0.001 | < 0.001 |
| Expected health, don’t know (Q21) | 6,316 | 1.30 (1.01 to 1.67) | 0.042 | 0.048 |
| Red alerts, per alert | 16,267 | 1.28 (1.15 to 1.42) | < 0.001 | < 0.001 |
| Total Alerts, per alert | 16,267 | 1.08 (1.05 to 1.12) | < 0.001 | < 0.001 |
| Carer concerns (Q8) | 16,223 | 1.17 (0.88 to 1.56) | 0.28 | 0.28 |
| Outside the corrected family: expected health worse or much worse (Q21) | 5,003 | 1.23 (0.60 to 2.52) | 0.57 |
Logistic GEE, one predictor at a time, clustered on the individual with an exchangeable working correlation. Adjusted p is Benjamini-Hochberg adjusted across the eight models. With blanks in Q7 set to the no-problem default, the Q7 estimate was 1.34 (1.04 to 1.73) in 16,267 contacts. With an independence working correlation each of the eight odds ratios was larger (navigator concern 1.80; red alerts 1.48). Restricting events to ward admissions gave larger odds ratios throughout (self-rated health 1.45 and 1.56 per point for the two ward-only definitions) and a mean hold-out AUC of 0.62.
Disclaimer/Publisher’s Note: The statements, opinions and data contained in all publications are solely those of the individual author(s) and contributor(s) and not of MDPI and/or the editor(s). MDPI and/or the editor(s) disclaim responsibility for any injury to people or property resulting from any ideas, methods, instructions or products referred to in the content. |
© 2026 by the authors. Licensee MDPI, Basel, Switzerland. This article is an open access article distributed under the terms and conditions of the Creative Commons Attribution (CC BY) license (http://creativecommons.org/licenses/by/4.0/).
Copyright: This open access article is published under a Creative Commons CC BY 4.0 license, which permit the free download, distribution, and reuse, provided that the author and preprint are cited in any reuse.