

Submitted:
01 November 2026
Posted:
03 November 2026
You are already at the latest version
Abstract
Background/ Objectives: Sodium–glucose cotransporter-2 inhibitors (SGLT2i) provide cardiorenal benefits beyond glucose lowering, yet longitudinal changes across multiple laboratory domains in patients with diabetic kidney disease (DKD) remain incompletely characterized. This study aimed to evaluate 12-month changes in renal, glycemic, metabolic, hematological, and inflammatory parameters in patients with DKD treated with empagliflozin or dapagliflozin. Methods: This retrospective, single-center cohort study included 452 patients with type 2 diabetes mellitus and DKD who received empagliflozin or dapagliflozin. Laboratory parameters were assessed at baseline and after 12 months. Longitudinal changes, between-group differences, correlations, and exploratory path analyses were evaluated. Results: Over 12 months, glycated hemoglobin and fasting glucose levels decreased, whereas estimated glomerular filtration rate (eGFR), vitamin D, hematocrit, mean corpuscular volume, and high-density lipoprotein cholesterol (HDL-C) increased. Ferritin, the triglyceride–glucose (TyG) index, bicarbonate, and plateletcrit decreased. Most other measured hematological and inflammatory parameters did not change significantly. The overall patterns of change were broadly similar between treatment groups, although selected differences were observed in individual parameters. In exploratory path analyses, age was negatively associated with change in eGFR (β = −0.269, p < 0.001), whereas KDIGO category was positively associated with change in eGFR (β = 0.200, p < 0.001). Sex was associated with change in the TyG index (β = −0.261, p = 0.013), and treatment group was associated with change in the platelet-to-lymphocyte ratio (β = −0.194, p = 0.010). The models explained a modest proportion of the variance. Conclusions: This real-world cohort provides a multidomain assessment of laboratory changes observed over 12 months in patients with DKD receiving empagliflozin or dapagliflozin. Changes extended beyond glycemic measures to selected renal, metabolic, and hematological parameters, while most conventional and composite inflammatory markers remained unchanged. The observational design and absence of a non-SGLT2i control group preclude causal conclusions or claims of long-term renoprotection. Prospective controlled studies are warranted to clarify the clinical significance and comparative effects of these changes.
Keywords:
sodium–glucose cotransporter-2 inhibitors
; diabetic kidney disease
; glycemic control
; estimated glomerular filtration rate
; hematological parameters
; inflammatory markers
Introduction
Diabetic kidney disease (DKD) is a major complication of type 2 diabetes mellitus (T2DM) and contributes substantially to chronic kidney disease (CKD), cardiovascular morbidity, and premature mortality. Its clinical course is heterogeneous, involving changes in kidney function, albuminuria, glycemic control, and metabolic status. A comprehensive assessment of patients with DKD therefore requires consideration of laboratory parameters beyond serum creatinine and glucose alone [1,2].
Sodium–glucose cotransporter 2 inhibitors (SGLT2i) have become an important component of T2DM and CKD management because of their kidney and cardiovascular benefits, which extend beyond glucose lowering. Large clinical trials have established the efficacy of empagliflozin and dapagliflozin in relevant patient populations, while dedicated kidney outcome trials have further supported the use of SGLT2i in CKD [3,4,5,6,7]. Nevertheless, changes observed during routine treatment may extend across several laboratory domains, and their patterns in patients with DKD warrant further characterization.
Systemic inflammation and hematological alterations are relevant to the pathophysiology and clinical assessment of DKD. Indices derived from complete blood counts, including the neutrophil-to-lymphocyte ratio (NLR), monocyte-to-lymphocyte ratio (MLR), platelet-to-lymphocyte ratio (PLR), systemic immune-inflammation index (SII), and systemic inflammation response index (SIRI), have been investigated as accessible markers of inflammatory status in metabolic and kidney diseases [8,9,10,11,12,13]. Recent real-world research has also examined longitudinal changes in inflammatory markers across oral antidiabetic drug classes [14]. In addition, a recent meta-analysis of randomized trials evaluated the effects of SGLT2i on hemoglobin, hematocrit, iron-related markers, and erythropoiesis, highlighting the relevance of hematological outcomes when characterizing treatment-associated changes [15].
Metabolic indicators may provide complementary information about the clinical profile of patients receiving SGLT2i. The triglyceride–glucose (TyG) index is used as a surrogate marker of insulin resistance, while the uric acid-to-high-density lipoprotein cholesterol ratio (UHR) and triglyceride-to-HDL cholesterol ratio (TG/HDL-C) reflect additional metabolic dimensions [16,17,18]. Evaluating these indices alongside kidney function, glycemic measures, hematological parameters, and inflammatory markers may offer a broader description of laboratory changes during follow-up.
Recent studies have compared the clinical effectiveness and kidney outcomes of empagliflozin and dapagliflozin [19,20]. However, the simultaneous longitudinal assessment of renal, glycemic, metabolic, hematological, and inflammatory laboratory parameters in patients with DKD remains insufficiently characterized in routine clinical practice. In particular, examining erythrocyte indices, platelet-related parameters, iron-related markers, and composite inflammatory indices alongside conventional kidney and glycemic measures may provide a more integrated description of changes observed during treatment. This multidomain approach distinguishes the present study from investigations focused primarily on kidney outcomes or glycemic control.
Accordingly, this study aimed to evaluate 12-month changes in renal, glycemic, metabolic, hematological, and inflammatory parameters in patients with DKD treated with empagliflozin or dapagliflozin in a real-world clinical setting. We compared baseline and follow-up measurements within the cohort and between treatment groups. We also explored associations between treatment group, demographic and clinical characteristics, and selected changes in laboratory parameters using correlation and path analyses. Rather than presuming the superiority of either drug, the study provides a multidomain description of laboratory changes during routine clinical care and examines factors associated with selected outcomes.
Materials and Methods
This retrospective cohort study was conducted using the medical records of patients followed at the Internal Medicine Outpatient Clinic of the University of Health Sciences, Bağcılar Training and Research Hospital. Records of patients who initiated SGLT2i treatment between January and September 2024 were retrospectively screened. Patients with T2DM, diagnosed according to the American Diabetes Association (ADA) criteria, who had completed 12 months of SGLT2i treatment were evaluated (21). Approximately 2,000 patient records were screened.
Patients with T2DM and clinically and laboratory-confirmed DKD were identified. Patients receiving uric acid–lowering agents, losartan-containing medications, or lipid-lowering therapy, as well as those with an active infection at baseline, pregnancy, or a history of malignancy, were excluded. Patients younger than 18 or older than 75 years and those with CKD stages G4 or G5 were also excluded.
CKD was defined according to Kidney Disease: Improving Global Outcomes (KDIGO) criteria as an abnormality of kidney structure or function persisting for at least 3 months (22). The estimated glomerular filtration rate (eGFR) was calculated using the 2021 CKD-EPI creatinine equation. CKD categories were defined as G1 (eGFR ≥90 mL/min/1.73 m2), G2 (60–89 mL/min/1.73 m2), and G3 (30–59 mL/min/1.73 m2). Patients classified as G1 were eligible for inclusion if evidence of kidney damage was present, specifically persistent albuminuria, defined as a urine albumin-to-creatinine ratio (UACR) ≥30 mg/g creatinine for at least 3 months, despite preserved eGFR. Patients classified as G2–G3 were included based on the documented clinical and laboratory diagnosis of diabetic kidney disease. Only patients in CKD categories G1–G3 were included; patients in categories G4 and G5 were excluded. Following the application of these criteria, 452 patients aged 18–75 years were included in the final analysis.
Patients were classified into two groups according to the prescribed SGLT2i: empagliflozin and dapagliflozin. Baseline measurements were defined as those obtained at treatment initiation, whereas follow-up measurements were defined as those obtained after 12 months of treatment. Changes in evaluated parameters were assessed within each group by comparing baseline and 12-month measurements. Baseline values, 12-month values, and changes over the same period were also compared between the two treatment groups. For each parameter, the change (Δ) was calculated as the 12-month value minus the baseline value.
The study was conducted in accordance with the Declaration of Helsinki and approved by the Non-Interventional Clinical Research Ethics Committee of the University of Health Sciences Bağcılar Training and Research Hospital (approval no. 2025/10/13/097; October 24, 2025). The ethics committee waived the requirement for informed consent because of the retrospective nature of the study.
Demographic characteristics, comorbidities, and medication use were obtained from electronic medical records. Laboratory data were retrieved from the national electronic health record system and the institutional database. The evaluated laboratory parameters included fasting plasma glucose, hemoglobin A1c (HbA1c), blood urea nitrogen, creatinine, uric acid, aspartate aminotransferase (AST), alanine aminotransferase (ALT), lactate dehydrogenase (LDH), calcium, sodium, potassium, total protein, albumin, ferritin, vitamin D, low-density lipoprotein cholesterol (LDL-C), high-density lipoprotein cholesterol (HDL-C), total cholesterol, triglycerides, phosphorus, and C-reactive protein (CRP). Complete blood count parameters, including hemoglobin, hematocrit, red cell distribution width (RDW), mean corpuscular volume (MCV), plateletcrit, and the blood cell counts required to calculate hematological indices, were also evaluated. Venous blood gas measurements, including pH and bicarbonate, urinalysis findings, and UACR were recorded. All laboratory measurements were obtained during routine clinical care using the hospital laboratory's standard procedures and analytical platforms. Overall, the assessment covered five complementary domains: renal function and albuminuria, glycemic control, metabolic and lipid parameters, hematological indices, and inflammatory markers, allowing a broad evaluation of laboratory changes over 12 months in patients treated with empagliflozin or dapagliflozin.
eGFR was calculated using the 2021 Chronic Kidney Disease Epidemiology Collaboration (CKD-EPI) creatinine equation (23). Hematological and inflammation-related indices were calculated to further characterize changes in blood cell profiles and inflammatory status. These included NLR, PLR, MLR, SII, and SIRI. NLR was calculated by dividing the neutrophil count by the lymphocyte count, PLR by dividing the platelet count by the lymphocyte count, and MLR by dividing the monocyte count by the lymphocyte count. SII was calculated as the platelet count multiplied by the neutrophil count and divided by the lymphocyte count (8), whereas SIRI was calculated as the neutrophil count multiplied by the monocyte count and divided by the lymphocyte count (9).
Additional metabolic indices were calculated to characterize cardiometabolic changes during follow-up. The TyG index was calculated as a surrogate marker of insulin resistance using the formula ln[(fasting triglyceride level (mg/dL) × fasting plasma glucose level (mg/dL))/2] (16). The UHR and TG/HDL-C were also evaluated as indices associated with cardiometabolic risk. UHR was calculated by dividing the serum uric acid level by the HDL-C level (17), and TG/HDL-C was calculated by dividing the serum triglyceride level by the HDL-C level (18).
Sample Size
No formal a priori sample size calculation was performed before the study. The sample size was determined by the number of eligible patients who initiated empagliflozin or dapagliflozin during the predefined study period and met the study eligibility criteria. A total of 452 patients were included in the analysis, comprising 212 patients treated with empagliflozin and 240 patients treated with dapagliflozin. The study was retrospective and observational; therefore, the available sample size was determined by the eligible medical records rather than by a prospective power-based recruitment target. The precision of the estimates should be interpreted in conjunction with the observed effect sizes and 95% confidence intervals.
Statistical Analysis
Statistical analyses were performed using IBM SPSS Statistics version 31.0 and IBM SPSS AMOS version 31. The normality of continuous variables was assessed using skewness and kurtosis coefficients (24). Continuous variables were expressed as mean ± standard deviation or median (minimum–maximum), as appropriate. Categorical variables were presented as numbers (n) and percentages (%).
Baseline and 12-month measurements were compared within each treatment group using the paired-samples t-test for variables with an approximately normal distribution and the Wilcoxon signed-rank test for variables that were not normally distributed. Between-group comparisons of baseline values, 12-month values, and changes (Δ) from baseline to 12 months were performed using the independent-samples t-test for normally distributed variables and the Mann–Whitney U test for variables that were not normally distributed. Categorical variables were compared using the chi-square test or Fisher's exact test, as appropriate.
Changes (Δ) in all parameters were calculated as the 12-month value minus the baseline value. Associations between changes in clinical parameters and treatment type, sex, age, and KDIGO stage were evaluated using Spearman's rank correlation analysis. Spearman's rank correlation coefficients (ρ) and corresponding p-values were reported. A correlation matrix heatmap using a red–blue color scale was generated to visualize the correlation results.
Path analysis was additionally performed for variables considered clinically significant. The dependent variables were ΔeGFR, Δtriglycerides, ΔTyG index, and ΔPLR. The independent variables were treatment group, sex, age, and KDIGO stage. The models were fitted using IBM SPSS AMOS version 31. Unstandardized regression coefficients (Estimate), standard errors (S.E.), standardized regression coefficients (β), and coefficients of determination (R2) were reported. Treatment group was coded as dapagliflozin (DAPA) = 1 and empagliflozin (EMPA) = 0. Sex was coded as male = 1 and female = 0.
A p-value of less than 0.05 was considered statistically significant.
Results
A total of 452 patients with T2DM and DKD were included in the study. Of these, 255 (56.4%) were female and 197 (43.6%) were male, and the mean age was 59.6 ± 12.1 years. According to eGFR categories, 29 patients (6.4%) were classified as G1, 337 (74.6%) as G2, and 86 (19.0%) as G3. No statistically significant differences were observed between the empagliflozin and dapagliflozin groups in sex, age distribution, mean age, or KDIGO stage (all p > 0.05; Table 1).
Table 2 summarizes changes in clinical, metabolic, renal, hematological, and inflammatory parameters over the 12-month follow-up period. HbA1c and fasting plasma glucose levels decreased significantly (p < 0.001 and p = 0.017, respectively), while eGFR increased significantly (p < 0.001). Other statistically significant changes included increases in vitamin D, hematocrit, MCV, and HDL-C, together with decreases in ferritin, the TyG index, bicarbonate, and plateletcrit. RDW also showed a statistically significant change. No statistically significant changes were observed in the remaining parameters listed in Table 2 (all p > 0.05).
At 12 months, the empagliflozin and dapagliflozin groups showed broadly similar clinical, metabolic, renal, hematological, and inflammatory profiles, with significant between-group differences observed in vitamin D levels and platelet distribution width (PDW) (p = 0.035 and p = 0.017, respectively) (Table 3). Within-group analyses showed that ferritin levels decreased significantly in both groups, whereas the platelet-to-lymphocyte ratio (PLR) decreased significantly only in the dapagliflozin group. HDL-C levels increased significantly in both groups, while the triglyceride-glucose (TyG) index did not change significantly in either group. At baseline, HDL-C levels were higher in the dapagliflozin group (p = 0.005). Baseline pH and bicarbonate levels were higher in the empagliflozin group, and the between-group difference in pH remained significant at 12 months (p = 0.036). Bicarbonate levels decreased significantly within the empagliflozin group (p = 0.004). These findings should be interpreted cautiously because within-group changes do not necessarily indicate differences in treatment effects between groups.
Correlation analyses revealed several significant associations between treatment, sex, age, KDIGO stage, and changes in clinical and laboratory parameters over 12 months (Table 4). Treatment group was negatively correlated with changes in serum sodium (r = −0.160, p = 0.039), platelet-to-lymphocyte ratio (PLR; r = −0.228, p = 0.003), platelet count (r = −0.222, p = 0.004), and plateletcrit (PCT; r = −0.192, p = 0.013), whereas a positive correlation was observed with the change in mean corpuscular volume (MCV; r = 0.164, p = 0.033). Sex was negatively correlated with changes in fasting glucose (r = −0.138, p = 0.041), ferritin (r = −0.201, p = 0.046), triglycerides (r = −0.228, p = 0.030), and the triglyceride–glucose (TyG) index (r = −0.253, p = 0.024), while a positive correlation was observed with the change in serum potassium (r = 0.176, p = 0.022). Age was negatively correlated with changes in estimated glomerular filtration rate (eGFR; r = −0.208, p < 0.001), total cholesterol (r = −0.223, p = 0.033), triglycerides (r = −0.285, p = 0.006), and the TyG index (r = −0.242, p = 0.032). KDIGO stage was negatively correlated with the change in triglyceride levels (r = −0.223, p = 0.034). No other statistically significant correlations were observed among the variables examined (all p > 0.05). The correlation patterns between changes in clinical parameters and treatment type, sex, age, and KDIGO stage are also illustrated in the heatmap (Figure 1).
Path analysis showed that age was negatively associated with ΔeGFR (β = −0.269, p < 0.001), whereas KDIGO stage was positively associated with ΔeGFR (β = 0.200, p < 0.001). The model explained 11.3% of the variance in ΔeGFR (R2 = 0.113). Sex was the only significant predictor of ΔTyG (β = −0.261, p = 0.013), and the model explained 12.6% of the variance (R2 = 0.126). Treatment group was significantly associated with ΔPLR (β = −0.194, p = 0.010), with the model explaining 4.7% of the variance (R2 = 0.047). None of the examined predictors was significantly associated with Δtriglycerides, although the model explained 9.4% of the variance (R2 = 0.094). The path analysis models illustrating the associations of treatment group, sex, age, and KDIGO stage with changes in renal, metabolic, and inflammatory parameters are presented in Figure 2, and the corresponding regression estimates are provided in Table 5.
Discussion
In this retrospective cohort study of 452 patients with T2DM and DKD, 12-month follow-up during SGLT2i therapy was associated with improvements in glycemic control and changes in selected renal and metabolic parameters. HbA1c and fasting plasma glucose decreased, whereas eGFR, HDL-C, vitamin D, hematocrit, and MCV increased. The TyG index and ferritin levels decreased, while most conventional and composite inflammatory markers remained unchanged. Although the overall findings were broadly similar between the empagliflozin and dapagliflozin groups, selected between-group differences and associations involving age, sex, KDIGO stage, and changes in specific parameters were observed. These findings provide a longitudinal overview of changes across several laboratory domains and demonstrate that the observed changes were not uniform across all parameters [1,2].
Changes in renal function are an important consideration when evaluating the effects of SGLT2 inhibitors in patients with DKD. In the present study, eGFR increased significantly over the 12-month follow-up, whereas serum creatinine, blood urea nitrogen, and UACR did not change significantly. Large randomized clinical trials, including DAPA-CKD, EMPA-KIDNEY, and CREDENCE, have demonstrated that SGLT2 inhibitors reduce the risk of kidney disease progression and other adverse renal outcomes [5,6,7]. However, these established kidney-protective benefits should be distinguished from the changes in routine laboratory measurements observed in the present study. The increase in eGFR may reflect a combination of biological variability, changes in clinical status, and treatment-related effects; given the retrospective design and the absence of a non-SGLT2i control group, its underlying cause cannot be determined. Furthermore, the predominance of patients classified as KDIGO G2 may have influenced the distribution of observed renal outcomes and the interpretation of changes in renal parameters. However, this distribution alone does not explain the increase in eGFR. Therefore, the increase in eGFR should be interpreted cautiously and should not, in isolation, be considered evidence of improved kidney function or slower CKD progression.
The metabolic findings of the present study indicate improvements in glycemic control during the 12-month follow-up, as reflected by significant reductions in HbA1c and fasting plasma glucose. These findings are consistent with the established glucose-lowering effects of SGLT2 inhibitors reported in randomized clinical trials [3,4]. HDL-C levels increased significantly over the 12-month follow-up, although baseline HDL-C levels were higher in the dapagliflozin group than in the empagliflozin group (p = 0.005). In contrast, triglyceride, LDL-C, and total cholesterol levels remained largely unchanged. The TyG index, a surrogate marker of insulin resistance calculated from fasting triglyceride and glucose levels, decreased significantly [16]. However, because the TyG index is influenced by both glucose and triglyceride concentrations, its reduction should not be interpreted as direct evidence of improved insulin sensitivity. In contrast, neither the UHR nor the TG/HDL-C ratio changed significantly. These ratios have been investigated as markers associated with metabolic and inflammatory conditions [17,18]. Taken together, these findings suggest that changes during SGLT2 inhibitor treatment were more evident in glycemic control and selected metabolic parameters than in the overall lipid profile. The simultaneous assessment of these measures also illustrates that improvement in one metabolic indicator does not necessarily imply a consistent change across all lipid-related or surrogate indices.
Inflammation is an important component of DKD, and readily available hematological indices have been investigated as potential markers of systemic inflammatory activity [10,11,12,13]. In the present study, CRP and the composite inflammatory indices, including NLR, PLR, MLR, SII, and SIRI, did not change significantly over the 12-month follow-up. In contrast, ferritin levels decreased significantly, while hematocrit and MCV increased. Plateletcrit also decreased significantly during follow-up; however, in the absence of significant changes in platelet count and most other inflammatory indices, this isolated finding should be interpreted cautiously and does not by itself establish an anti-inflammatory effect of SGLT2 inhibitor therapy. Ferritin is involved in iron storage and may also reflect inflammatory activity; therefore, its reduction cannot be interpreted as evidence of a specific anti-inflammatory effect without additional information on iron status and related clinical factors. Similarly, the absence of significant changes in routine inflammatory indices does not exclude changes in inflammatory pathways that are not captured by these nonspecific markers. Although the observed hematological changes may be compatible with previously described effects of SGLT2 inhibitors on erythropoiesis [15,25], the present study did not include direct measurements of erythropoietin or other mechanistic biomarkers. Thus, the hematological findings should be considered descriptive observations rather than evidence of a specific inflammatory or erythropoietic mechanism.
Vitamin D levels increased significantly over the 12-month follow-up, and the dapagliflozin group had significantly higher vitamin D levels than the empagliflozin group at 12 months (p = 0.035). Although vitamin D metabolism is closely linked to mineral and bone disorders in CKD [22], the clinical significance of this finding remains uncertain. The retrospective design and the absence of detailed data on vitamin D supplementation, parathyroid hormone, and fibroblast growth factor 23 limit the interpretation of the observed change. In contrast, serum uric acid levels and the UHR did not change significantly. Although SGLT2 inhibitors have been associated with changes in serum uric acid through alterations in renal urate handling [26], these effects may vary according to kidney function and individual metabolic characteristics. The absence of a significant change in the present cohort highlights the need for cautious interpretation and further investigation of these parameters in patients with DKD.
The correlation and path analyses provided additional insight into the factors associated with changes in selected clinical and metabolic parameters during follow-up. Age was negatively correlated with changes in eGFR, triglycerides, and the TyG index, whereas KDIGO stage was negatively correlated with changes in triglycerides. Sex was associated with changes in glucose, triglycerides, and the TyG index. Treatment group was significantly correlated with changes in PLR, platelet count, MCV, and plateletcrit. However, in the path analysis, treatment group was significantly associated only with ΔPLR. This model explained only a small proportion of the variance in ΔPLR, indicating limited explanatory power. The observed association should not be interpreted as evidence of the superiority of either SGLT2 inhibitor. In the path analysis, age and KDIGO stage were significantly associated with ΔeGFR, whereas sex was associated with ΔTyG index. The proportion of variance explained by these statistically significant models ranged from 4.7% to 12.6%. These findings suggest that demographic and clinical characteristics may be associated with variation in laboratory changes, but other unmeasured factors are likely to contribute. Moreover, these exploratory analyses identify associations rather than establish clinically useful predictors of treatment response, and their findings require confirmation in independent cohorts. Given the observational design, these associations should not be interpreted as causal relationships or as evidence of differential treatment responsiveness.
An important strength of this study is its longitudinal assessment of a broad range of laboratory parameters in a real-world cohort of 452 patients with T2DM and DKD treated with empagliflozin or dapagliflozin. Recent real-world studies have directly compared these agents, although their study populations, follow-up periods, and primary outcomes differed from those of the present study. Bharati et al. conducted a propensity score-matched multicenter cohort study of patients with stage 3 CKD and reported a lower risk of stage 5 CKD or end-stage kidney disease among patients initiating empagliflozin than among those initiating dapagliflozin over approximately 2.5 years of follow-up [19]. Lee et al. evaluated clinical and metabolic outcomes in a nationwide propensity-matched cohort of patients with T2DM who maintained treatment for more than 365 days [20]. These studies provide complementary evidence on comparative clinical outcomes in routine practice. The present study extends this real-world evidence by examining 12-month changes in renal function, glycemic control, lipid-related measures, hematological parameters, and composite inflammatory indices within the same cohort of patients with DKD treated with empagliflozin or dapagliflozin. Its contribution lies in the integrated longitudinal assessment of these laboratory domains and the exploratory analysis of factors associated with their changes, rather than in demonstrating the superiority of either drug. Because the study designs, populations, and outcomes differ, direct comparisons should be interpreted cautiously.
Nevertheless, several limitations should be acknowledged. First, the retrospective, single-center design limits causal inference and may restrict the generalizability of the findings. Second, the absence of a non-SGLT2i control group and the lack of random treatment allocation preclude definitive attribution of the observed changes to either treatment. Residual confounding related to concomitant medications, lifestyle factors, adherence, and other clinical characteristics may also have affected the results. Third, multiple parameters and statistical comparisons were evaluated, increasing the possibility of chance findings. Finally, the absence of mechanistic biomarkers, including cytokines and markers of iron metabolism and erythropoiesis, limited the ability to explain the underlying biological pathways. In addition, the relatively low variance explained by the path models indicates that the included demographic and clinical variables captured only a limited proportion of the observed changes. These limitations underscore the exploratory nature of the findings and the need for prospective controlled studies incorporating appropriate comparative analyses and more detailed mechanistic assessments to clarify the renal, metabolic, hematological, and inflammatory changes observed during SGLT2 inhibitor treatment.
In conclusion, in this real-world cohort of patients with T2DM and DKD, 12 months of SGLT2 inhibitor treatment was associated with improved glycemic control and changes in selected renal, metabolic, and hematological parameters. Most conventional and composite inflammatory indices remained unchanged, while empagliflozin and dapagliflozin showed broadly similar patterns across the evaluated outcomes. Associations identified through correlation and path analyses highlighted potential relationships between patient characteristics and changes in selected parameters, although their explanatory power was limited. These findings provide real-world longitudinal data on routinely measured laboratory parameters and support further prospective investigation of the clinical significance and determinants of these changes.
Author Contributions
Conceptualization, B.E. and A.E.A.; methodology, B.E. and A.E.A.; software, B.E.; validation, B.E. and A.E.A.; formal analysis, B.E., D.Y. and A.E.A.; investigation, D.Y., K.B., B.E. and A.E.A.; resources, K.B., B.E. and A.E.A.; data curation, B.E.; writing—original draft preparation, B.E.; writing—review and editing, B.E. and A.E.A.; visualization, B.E. and A.E.A.; supervision, B.E. and A.E.A.; project administration, B.E.; funding acquisition, B.E. All authors have read and agreed to the published version of the manuscript.
Funding
This research received no external funding.
Institutional Review Board Statement
The study was conducted in accordance with the Declaration of Helsinki and approved by the Non-Interventional Clinical Research Ethics Committee of the University of Health Sciences Bağcılar Training and Research Hospital (approval no. 2025/10/13/097; October 24, 2025). The ethics committee waived the requirement for informed consent because of the retrospective nature of the study.
Informed Consent Statement
Informed consent was waived by the ethics committee because of the retrospective nature of the study.
Data Availability Statement
Data are unavailable due to privacy or ethical restrictions.
Conflicts of Interest
The authors declare no conflicts of interest.
References
- Gupta S, Dominguez M, Golestaneh L. Diabetic Kidney Disease: An Update. Medical Clinics of North America. 2023;107(4):689–705. PubMed. [CrossRef]
- Alicic, R.Z.; Rooney, M.T.; Tuttle, K.R. Diabetic kidney disease: Challenges, progress, and possibilities. Clin. J. Am. Soc. Nephrol. 2017, 12, 2032–2045. PubMed. [CrossRef]
- Zinman, B.; Wanner, C.; Lachin, J.M.; Fitchett, D.; Bluhmki, E.; Hantel, S.; Mattheus, M.; Devins, T.; Johansen, O.E.; Woerle, H.J.; et al. Empagliflozin, cardiovascular outcomes, and mortality in type 2 diabetes. N. Engl. J. Med. 2015, 373, 2117–2128. PubMed. [CrossRef]
- Wiviott, S.D.; Raz, I.; Bonaca, M.P.; Mosenzon, O.; Kato, E.T.; Cahn, A.; Silverman, M.G.; Zelniker, T.A.; Kuder, J.F.; Murphy, S.A.; et al. Dapagliflozin and cardiovascular outcomes in type 2 diabetes. N. Engl. J. Med. 2019, 380, 347–357. PubMed. [CrossRef]
- Heerspink, H.J.L.; Stefánsson, B.V.; Correa-Rotter, R.; Chertow, G.M.; Greene, T.; Hou, F.F.; Mann, J.F.E.; McMurray, J.J.V.; Lindberg, M.; Rossing, P.; et al. Dapagliflozin in patients with chronic kidney disease. N. Engl. J. Med. 2020, 383, 1436–1446. PubMed. [CrossRef]
- The EMPA-KIDNEY Collaborative Group. Empagliflozin in patients with chronic kidney disease. N. Engl. J. Med. 2023, 388, 117–127. PubMed. [CrossRef]
- Perkovic, V.; Jardine, M.J.; Neal, B.; Bompoint, S.; Heerspink, H.J.L.; Charytan, D.M.; Edwards, R.; Agarwal, R.; Bakris, G.; Bull, S.; et al. Canagliflozin and renal outcomes in type 2 diabetes and nephropathy. N. Engl. J. Med. 2019, 380, 2295–2306. PubMed. [CrossRef]
- Hu, B.; Yang, X.R.; Xu, Y.; Sun, Y.F.; Sun, C.; Guo, W.; Zhang, X.; Wang, W.M.; Qiu, S.J.; Zhou, J.; et al. Systemic immune-inflammation index predicts prognosis of patients after curative resection for hepatocellular carcinoma. Clin. Cancer Res. 2014, 20, 6212–6222. PubMed. [CrossRef]
- Qi, Q.; Zhuang, L.; Shen, Y.; Geng, Y.; Yu, S.; Chen, H.; Liu, L.; Meng, Z.; Wang, P.; Chen, Z. A novel systemic inflammation response index (SIRI) for predicting the survival of patients with pancreatic cancer after chemotherapy. Cancer 2016, 122, 2158–2167. PubMed. [CrossRef]
- Wang Y, Liu Y, Gu W, Cai B, Lei M, Luo Y, Zhang N. Association of immune-inflammation indexes with incidence and prognosis of diabetic nephropathy: a systematic review and meta-analysis. Front Endocrinol (Lausanne). 2025; 16: 1532682. PubMed. [CrossRef]
- Islam, M.M.; Satici, M.O.; Eroglu, S.E. Unraveling the clinical significance and prognostic value of the neutrophil-to-lymphocyte ratio, platelet-to-lymphocyte ratio, systemic immune-inflammation index, systemic inflammation response index, and delta neutrophil index: An extensive literature review. Turk. J. Emerg. Med. 2024, 24, 8–19. PubMed. [CrossRef]
- Liu, W.; Zheng, S.; Du, X. Association of systemic immune-inflammation index and systemic inflammation response index with diabetic kidney disease in patients with type 2 diabetes mellitus. Diabetes Metab. Syndr. Obes. 2024, 17, 517–531. PubMed. [CrossRef]
- Duman, T.T.; Ozkul, F.N.; Balci, B. Could systemic inflammatory index predict diabetic kidney injury in type 2 diabetes mellitus? Diagnostics 2023, 13, 2063. PubMed. [CrossRef]
- Yamak, M.; Çakır, S.; Uzun, S.; Cebeci, E.; Menken, Ö.; Ozturk, S. Comparative Longitudinal Evaluation of Systemic Inflammatory Markers in Type 2 Diabetes Treated with Four Oral Antidiabetic Drug Classes. J. Clin. Med. 2026, 15(2), 688. PubMed. [CrossRef]
- Yang, Y.; Yang, C.; Wang, Y.; et al. Sodium-Glucose Cotransporter 2 Inhibitor Use and Levels of Hemoglobin, Markers of Iron Metabolism, and Erythropoiesis: A Systematic Review and Meta-Analysis of Randomized Clinical Trials. JAMA. Published online October 24, 2026. PubMed. [CrossRef]
- Simental-Mendía, L.E.; Rodríguez-Morán, M.; Guerrero-Romero, F. The product of fasting glucose and triglycerides as surrogate for identifying insulin resistance in apparently healthy subjects. Metab. Syndr. Relat. Disord. 2008, 6, 299–304. PubMed. [CrossRef]
- Aktas, G. An overview of the role of serum uric acid to high-density lipoprotein cholesterol ratio in type 2 diabetes mellitus and in other inflammatory and metabolic conditions. Minerva Med. 2025, 116, 405–415. PubMed. [CrossRef]
- Kosmas, C.E.; Rodriguez Polanco, S.; Bousvarou, M.D.; Papakonstantinou, E.J.; Peña Genao, E.; Guzman, E.; Kostara, C.E. The triglyceride/high-density lipoprotein cholesterol (TG/HDL-C) ratio as a risk marker for metabolic syndrome and cardiovascular disease. Diagnostics 2023, 13, 929. PubMed. [CrossRef]
- Bharati, J.; Bosch, N.A.; Upadhyay, A. Empagliflozin versus dapagliflozin for kidney outcomes in stage 3 chronic kidney disease: A propensity score-matched multicenter cohort study. BMC Nephrol. 2026, 27, 484. PubMed. [CrossRef]
- Lee, D.H.; Kim, H.; You, S.H.; Bae, Y.; Yoo, H.; Jeong, B.S.; Lee, S.W.; Lee, Y.S.; Shin, W. Head-to-head comparative effectiveness of empagliflozin versus dapagliflozin and DPP-4 inhibitors on clinical and metabolic outcomes: A nationwide propensity-matched study. Sci. Rep. 2026, 16, 58787. PubMed. [CrossRef]
- American Diabetes Association Professional Practice Committee for Diabetes. 2. Diagnosis and Classification of Diabetes: Standards of Care in Diabetes—2026. Diabetes Care 2026, 49 (Suppl. 1), S27–S49. PubMed. [CrossRef]
- Kidney Disease: Improving Global Outcomes (KDIGO) CKD Work Group. KDIGO 2024 clinical practice guideline for the evaluation and management of chronic kidney disease. Kidney Int. 2024, 105 (Suppl. 4), S117–S314. PubMed. [CrossRef]
- Inker, L.A.; Eneanya, N.D.; Coresh, J.; Tighiouart, H.; Wang, D.; Sang, Y.; Crews, D.C.; Doria, A.; Estrella, M.M.; Froissart, M.; et al. New creatinine- and cystatin C-based equations to estimate GFR without race. N. Engl. J. Med. 2021, 385, 1737–1749. PubMed. [CrossRef]
- Kim, H.-Y. Statistical notes for clinical researchers: Assessing normal distribution (2) using skewness and kurtosis. Restor. Dent. Endod. 2013, 38, 52–54. PubMed. [CrossRef]
- Sridharan, K.; Sivaramakrishnan, G. Comparative effects of SGLT2 inhibitors on erythropoiesis: A systematic review and network meta-analysis. Diabetes Metab. Syndr. 2026, 20, 103452. PubMed. [CrossRef]
- Yip, A.S.Y.; Leong, S.; Teo, Y.H.; Teo, Y.N.; Syn, N.L.X.; See, R.M.; Wee, C.F.; Yeung Chong, E.; Lee, C.H.; Chan, M.Y.; et al. Effect of sodium-glucose cotransporter-2 (SGLT2) inhibitors on serum urate levels in patients with and without diabetes: A systematic review and meta-regression of 43 randomized controlled trials. Ther. Adv. Chronic Dis. 2022, 13, 20406223221083509. PubMed. [CrossRef]
Figure 1.
Correlations were assessed using Spearman’s rank correlation analysis. Statistical significance was defined as a two-sided p-value < 0.05. Abbreviations: Δ, change from baseline to 12 months; KDIGO, Kidney Disease: Improving Global Outcomes; SGLT2, sodium-glucose cotransporter 2; DAPA, dapagliflozin; EMPA, empagliflozin; HbA1c, hemoglobin A1c; CKD-EPI, Chronic Kidney Disease Epidemiology Collaboration; TyG, triglyceride–glucose index; CRP, C-reactive protein; NLR, neutrophil-to-lymphocyte ratio; PLR, platelet-to-lymphocyte ratio; MLR, monocyte-to-lymphocyte ratio; SII, systemic immune-inflammation index; SIRI, systemic inflammation response index; UACR, urine albumin-to-creatinine ratio.
Figure 1.
Correlations were assessed using Spearman’s rank correlation analysis. Statistical significance was defined as a two-sided p-value < 0.05. Abbreviations: Δ, change from baseline to 12 months; KDIGO, Kidney Disease: Improving Global Outcomes; SGLT2, sodium-glucose cotransporter 2; DAPA, dapagliflozin; EMPA, empagliflozin; HbA1c, hemoglobin A1c; CKD-EPI, Chronic Kidney Disease Epidemiology Collaboration; TyG, triglyceride–glucose index; CRP, C-reactive protein; NLR, neutrophil-to-lymphocyte ratio; PLR, platelet-to-lymphocyte ratio; MLR, monocyte-to-lymphocyte ratio; SII, systemic immune-inflammation index; SIRI, systemic inflammation response index; UACR, urine albumin-to-creatinine ratio.
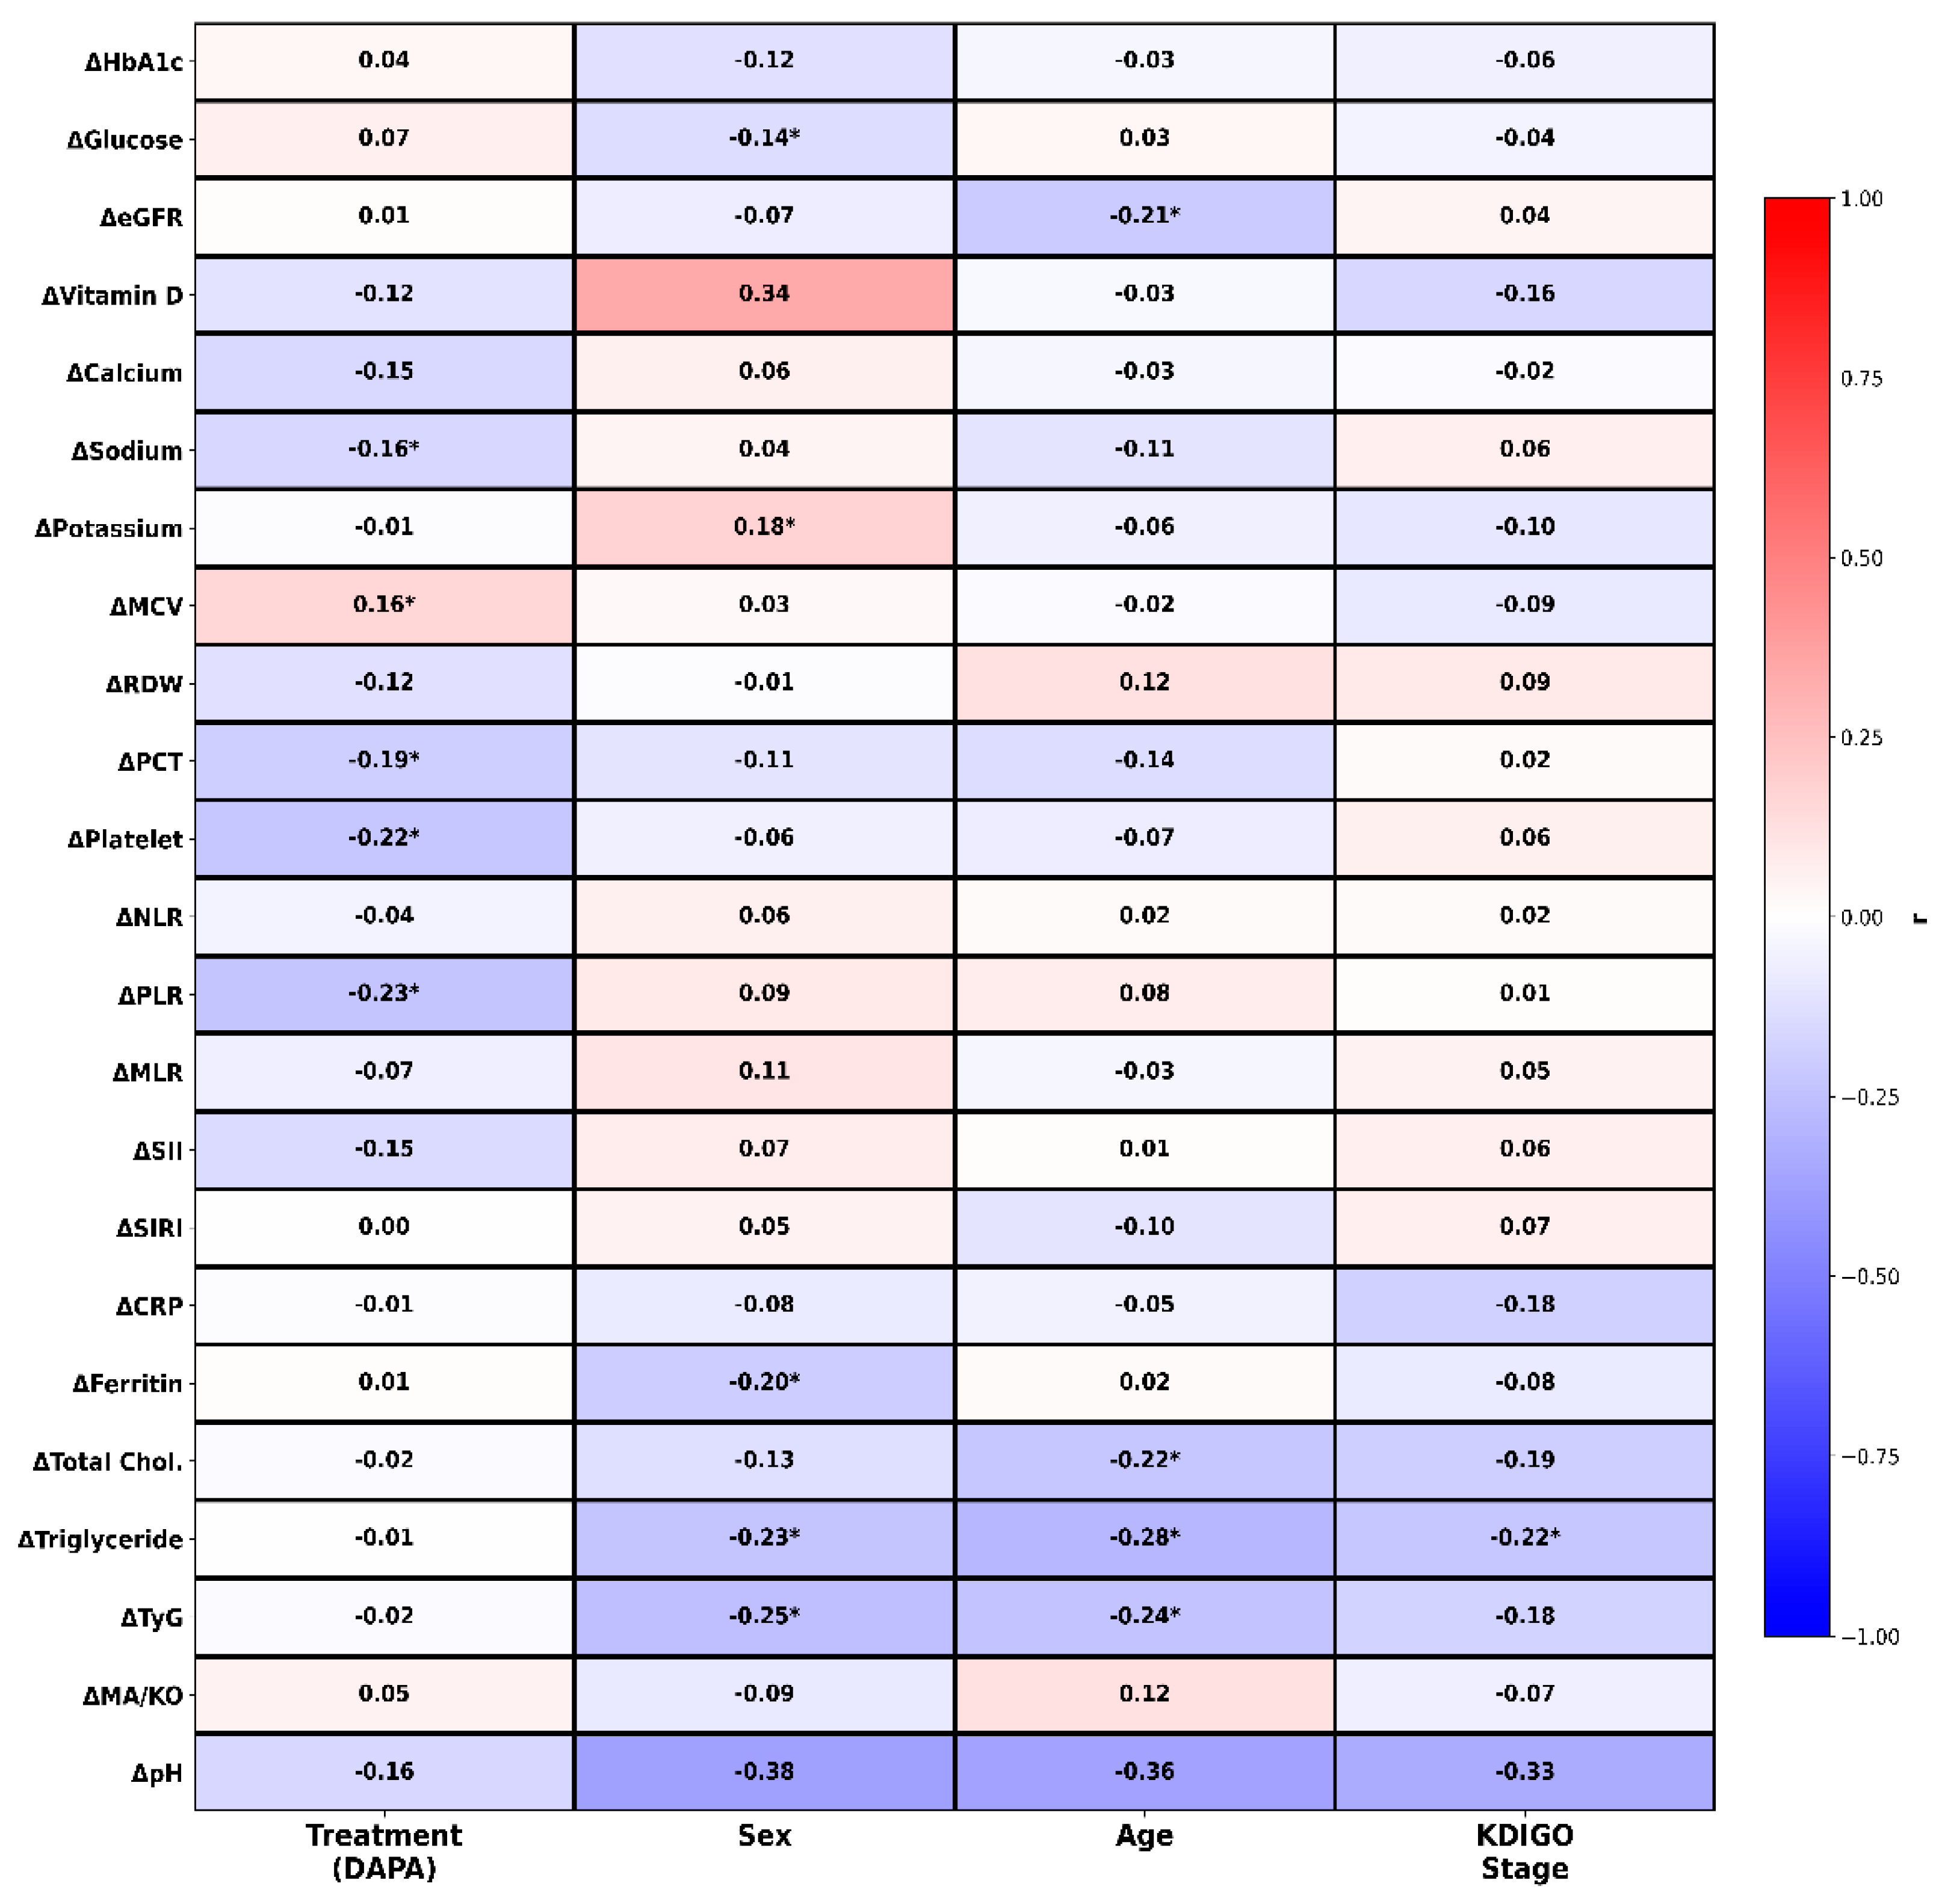
Figure 2.
Path analysis models of changes in renal, metabolic, and inflammatory parameters following SGLT2i treatment. Figure legend: Path analysis showing the associations of treatment group, sex, age, and KDIGO stage with changes in eGFR, triglycerides, TyG index, and PLR. Treatment group was coded as dapagliflozin (DAPA) = 1 and empagliflozin (EMPA) = 0; sex was coded as male = 1 and female = 0. R2 represents the proportion of variance explained by each model. A two-sided p-value < 0.05 was considered statistically significant. Abbreviations: Δ, change from baseline to 12 months; DAPA, dapagliflozin; EMPA, empagliflozin; CKD-EPI, Chronic Kidney Disease Epidemiology Collaboration; KDIGO, Kidney Disease: Improving Global Outcomes; PLR, platelet-to-lymphocyte ratio; SGLT2i, sodium-glucose cotransporter 2 inhibitor; TyG, triglyceride–glucose index; R2, coefficient of determination.
Figure 2.
Path analysis models of changes in renal, metabolic, and inflammatory parameters following SGLT2i treatment. Figure legend: Path analysis showing the associations of treatment group, sex, age, and KDIGO stage with changes in eGFR, triglycerides, TyG index, and PLR. Treatment group was coded as dapagliflozin (DAPA) = 1 and empagliflozin (EMPA) = 0; sex was coded as male = 1 and female = 0. R2 represents the proportion of variance explained by each model. A two-sided p-value < 0.05 was considered statistically significant. Abbreviations: Δ, change from baseline to 12 months; DAPA, dapagliflozin; EMPA, empagliflozin; CKD-EPI, Chronic Kidney Disease Epidemiology Collaboration; KDIGO, Kidney Disease: Improving Global Outcomes; PLR, platelet-to-lymphocyte ratio; SGLT2i, sodium-glucose cotransporter 2 inhibitor; TyG, triglyceride–glucose index; R2, coefficient of determination.
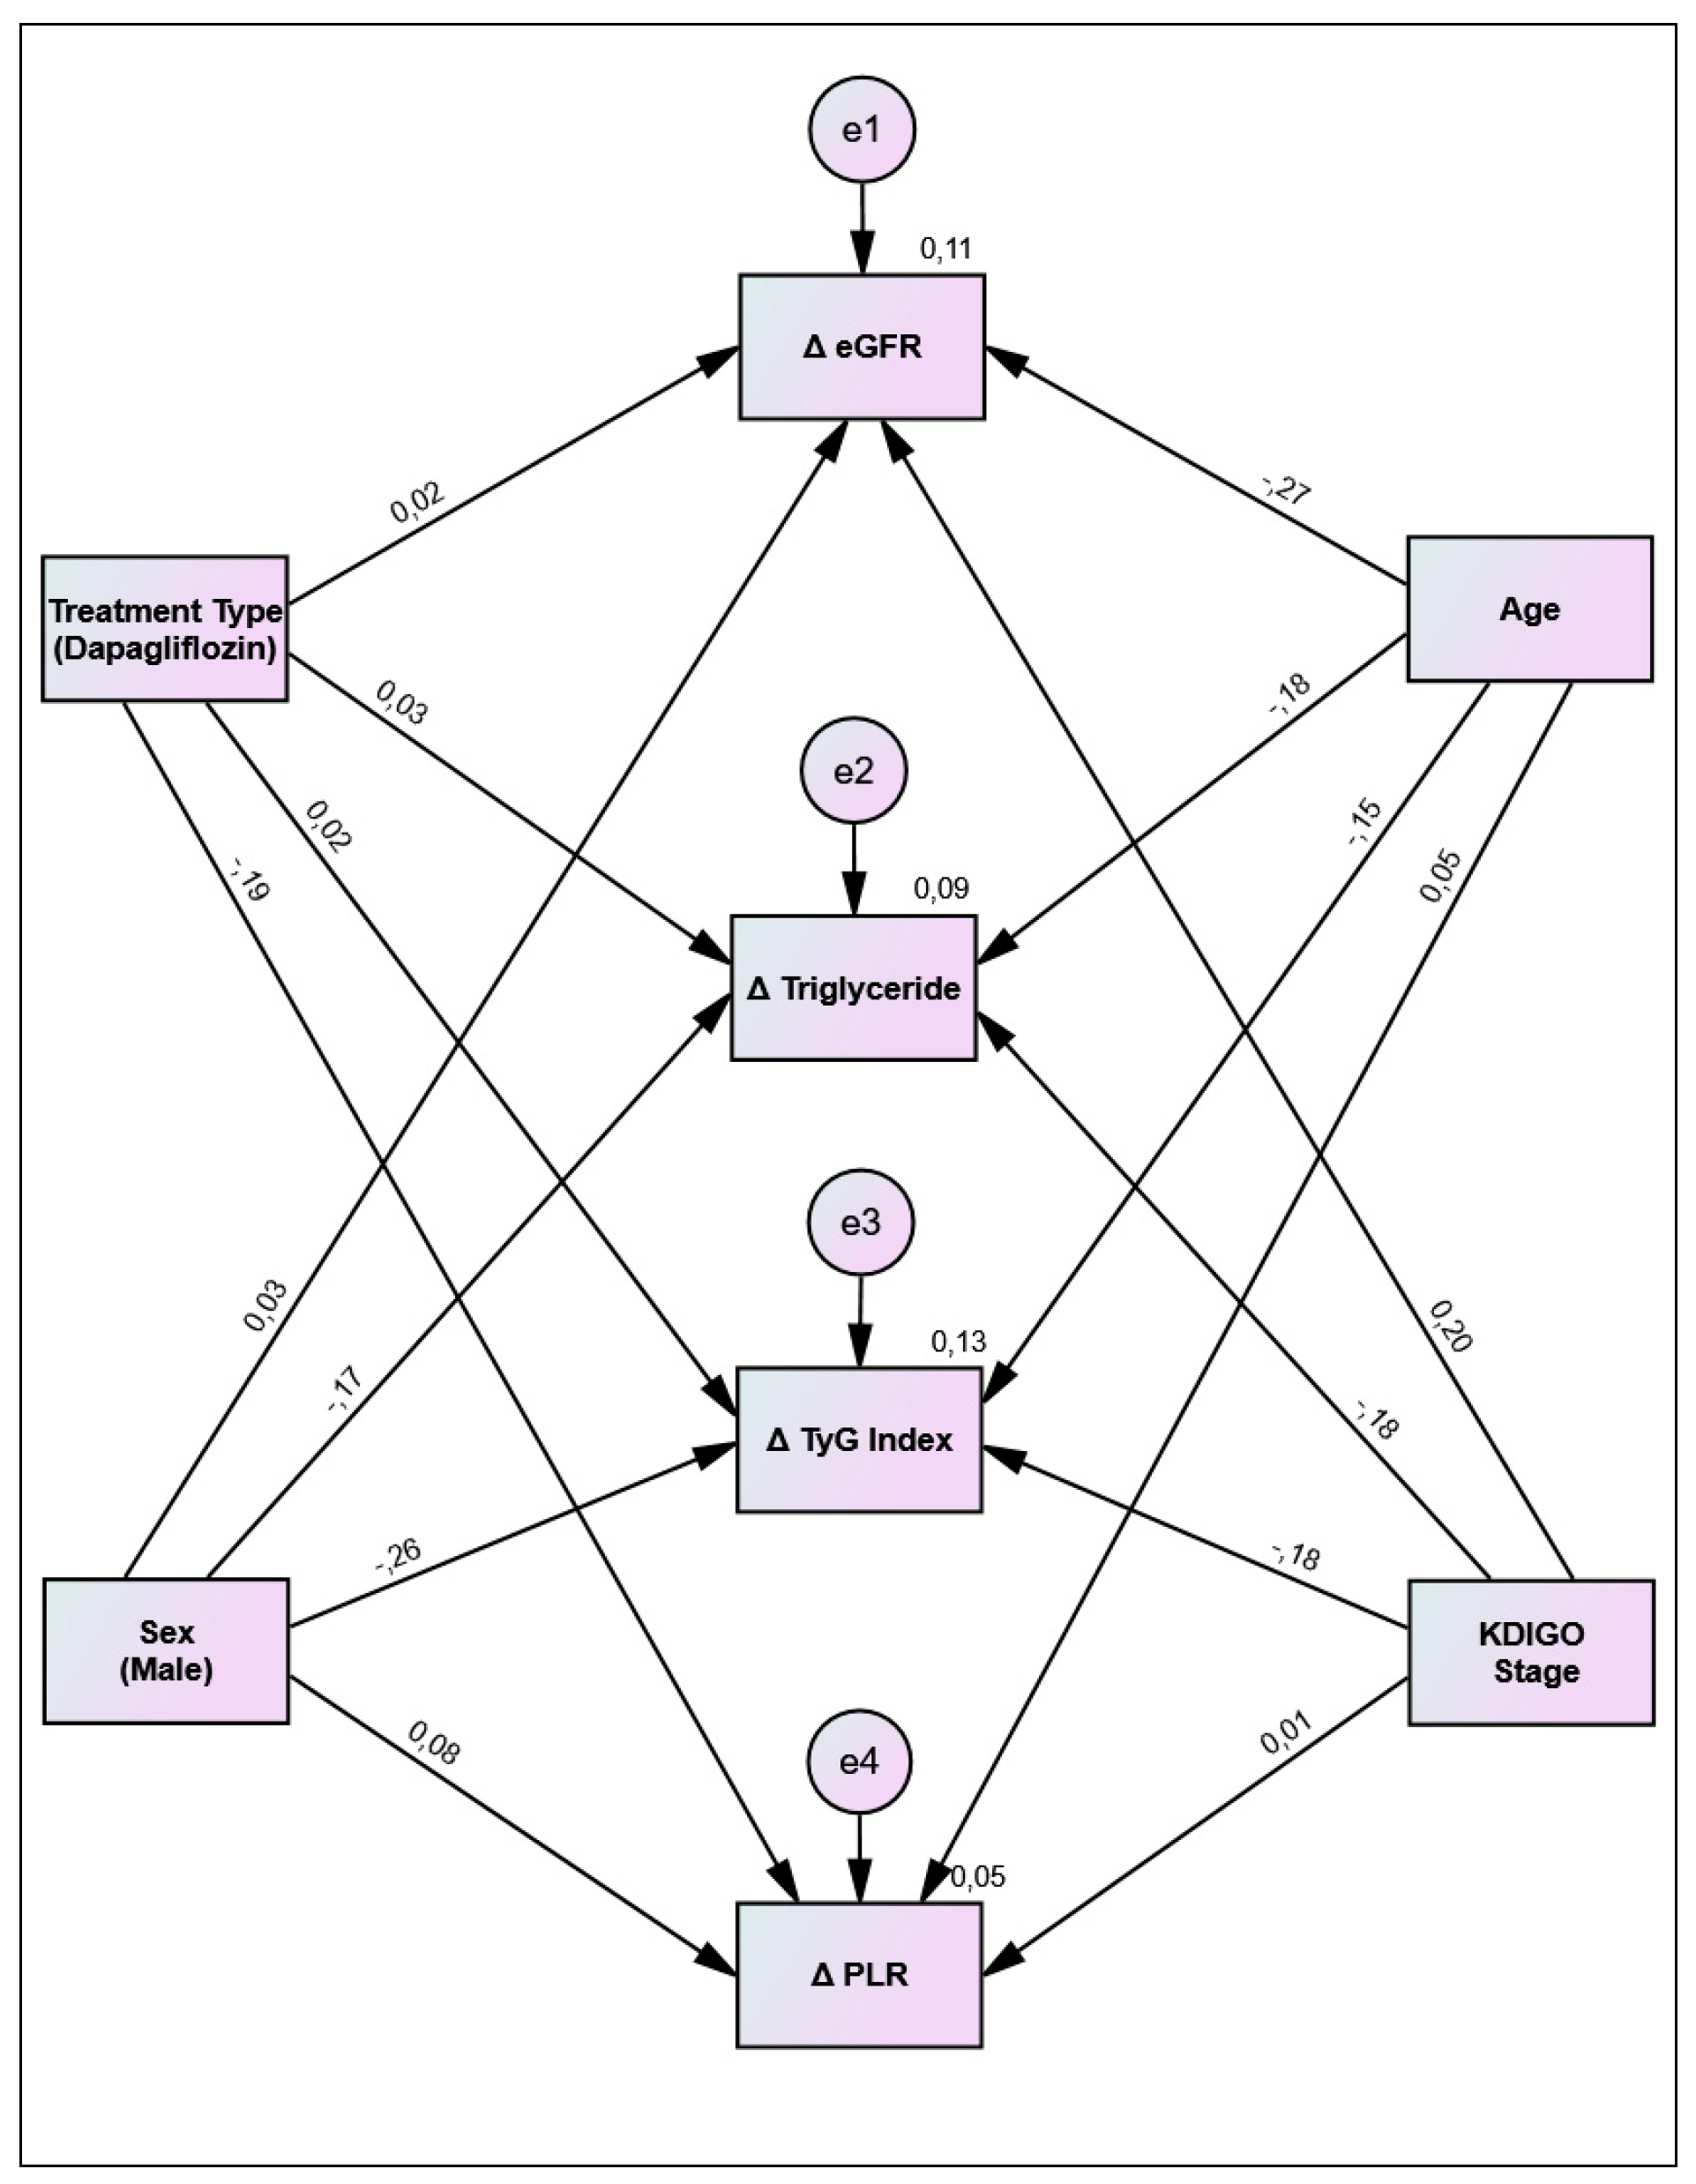

Table 1.
Baseline sociodemographic and clinical characteristics of patients with type 2 diabetes mellitus and diabetic kidney disease according to SGLT2i treatment group.
Table 1.
Baseline sociodemographic and clinical characteristics of patients with type 2 diabetes mellitus and diabetic kidney disease according to SGLT2i treatment group.
| Variable | Category | Overall (n=452) | Empagliflozin (n=212) | Dapagliflozin (n=240) | p value |
| Sex | Female | 255 (56.4) | 122 (57.5) | 133 (55.4) | 0.718 |
| Male | 197 (43.6) | 90 (42.5) | 107 (44.6) | ||
| Age group | <60 years | 228 (50.4) | 102 (48.1) | 126 (52.5) | 0.403 |
| ≥60 years | 224 (49.6) | 110 (51.9) | 114 (47.5) | ||
| KDIGO G category | G I | 29 (6.4) | 14 (6.6) | 15 (6.3) | 0.944 |
| G II | 337 (74.6) | 159 (75.0) | 178 (74.2) | ||
| G III | 86 (19.0) | 39 (18.4) | 47 (19.6) | ||
| Age (years) | Continuous | 59.6 ± 12.1 | 59.7 ± 12.6 | 59.5 ± 11.7 | 0.808 |
Footnote: Data are presented as mean ± standard deviation (SD) or n (%), as appropriate. Categorical variables were compared using Pearson’s chi-square test (χ2), and continuous variables were compared using the independent-samples t-test. A two-sided p-value < 0.05 was considered statistically significant. Abbreviations: SD, standard deviation; SGLT2i, sodium–glucose cotransporter 2 inhibitor.
Table 2.
Changes in clinical, metabolic, renal, hematological, and inflammatory parameters from baseline to 12 months after SGLT2i treatment initiation.
Table 2.
Changes in clinical, metabolic, renal, hematological, and inflammatory parameters from baseline to 12 months after SGLT2i treatment initiation.
| Variable | Baseline (n=452) mean ± SD | 12 months (n=452) mean ± SD | p value |
| HbA1c (%) | 7.99 ± 1.87 | 7.27 ± 1.56 | <0.001 |
| Fasting glucose (mg/dL) | 176.32 ± 83.02 | 159.36 ± 68.04 | 0.017 |
| Urea (mg/dL) | 40.42 ± 25.09 | 37.11 ± 14.67 | 0.528 |
| Creatinine (mg/dL) | 0.99 ± 0.31 | 0.97 ± 0.34 | 0.091 |
| eGFR (mL/min/1.73 m2) | 73.49 ± 16.84 | 78.86 ± 21.16 | <0.001 |
| Uric acid (mg/dL) | 5.39 ± 1.66 | 5.15 ± 1.57 | 0.079 |
| Uric acid/HDL-C ratio | 11.57 ± 5.15 | 11.23 ± 5.22 | 0.530 |
| Vitamin D (µg/L) | 15.58 ± 9.22 | 18.26 ± 11.44 | 0.039 |
| WBC (103/µL) | 7.63 ± 1.64 | 7.57 ± 1.65 | 0.860 |
| Hematocrit (%) | 41.51 ± 5.15 | 41.84 ± 5.11 | 0.04 |
| MCV (fL) | 85.10 ± 6.15 | 85.83 ± 6.15 | 0.005 |
| RDW (%) | 14.13 ± 1.97 | 14.12 ± 1.55 | <0.001 |
| PCT (%) | 0.26 ± 0.07 | 0.25 ± 0.07 | 0.010 |
| Platelets (103/µL) | 252.78 ± 65.90 | 249.81 ± 64.79 | 0.125 |
| NLR | 2.21 ± 1.62 | 2.21 ± 1.16 | 0.294 |
| PLR | 118.94 ± 69.07 | 115.05 ± 40.20 | 0.767 |
| MLR | 0.22 ± 0.14 | 0.22 ± 0.09 | 0.613 |
| SII | 521.32 ± 276.90 | 529.96 ± 241.49 | 0.734 |
| SIRI | 1.05 ± 0.77 | 1.00 ± 0.55 | 0.923 |
| CRP (mg/L) | 6.04 ± 5.41 | 5.62 ± 5.40 | 0.129 |
| Ferritin (µg/L) | 71.13 ± 88.07 | 48.20 ± 43.20 | <0.001 |
| Total cholesterol (mg/dL) | 187.88 ± 37.22 | 192.48 ± 36.71 | 0.330 |
| Triglycerides (mg/dL) | 166.91 ± 79.42 | 155.98 ± 78.74 | 0.848 |
| LDL-C (mg/dL) | 107.82 ± 31.85 | 108.02 ± 34.52 | 0.477 |
| HDL-C (mg/dL) | 46.69 ± 10.45 | 54.42 ± 12.03 | <0.001 |
| TyG index | 9.38 ± 0.66 | 9.19 ± 0.67 | 0.026 |
| Albumin/creatinine ratio (mg/g) | 164.39 ± 335.58 | 114.32 ± 228.44 | 0.683 |
Footnote: Data are presented as mean ± standard deviation (SD). Within-group comparisons between baseline and 12-month values were performed using the paired-samples t-test for normally distributed variables and the Wilcoxon signed-rank test for non-normally distributed variables. A two-sided p-value < 0.05 was considered statistically significant. Abbreviations: CRP, C-reactive protein; eGFR, estimated glomerular filtration rate; CKD-EPI, Chronic Kidney Disease Epidemiology Collaboration; HbA1c, hemoglobin A1c; HDL-C, high-density lipoprotein cholesterol; LDL-C, low-density lipoprotein cholesterol; MCV, mean corpuscular volume; MLR, monocyte-to-lymphocyte ratio; NLR, neutrophil-to-lymphocyte ratio; PCT, plateletcrit; PLR, platelet-to-lymphocyte ratio; RDW, red cell distribution width; SD, standard deviation; SII, systemic immune-inflammation index; SIRI, systemic inflammation response index; TyG, triglyceride–glucose index; WBC, white blood cell count.
Table 3.
Comparison of Clinical, Renal, Metabolic, Hematological, and Inflammatory Parameters at Baseline and 12 Months According to SGLT2i Treatment Group.
Table 3.
Comparison of Clinical, Renal, Metabolic, Hematological, and Inflammatory Parameters at Baseline and 12 Months According to SGLT2i Treatment Group.
| Variable | Measurement | Empagliflozin (EMPA), n = 212, Mean ± SD; Median (Min–Max) | Dapagliflozin (DAPA), n = 240, Mean ± SD; Median (Min–Max) | p-value |
| HbA1c (%) (z) | Baseline | 8.05 ± 1.87; 7.5 (5.1–13.9) | 7.94 ± 1.87; 7.4 (5.5–15.5) | 0.520 |
| 1 year | 7.45 ± 1.66; 6.9 (5.1–14.7) | 7.02 ± 1.38; 6.7 (3.3–12.1) | 0.071 | |
| p2 | <0.001 | 0.002 | ||
| Fasting glucose (mg/dL) (z) | Baseline | 178.6 ± 81.6; 157 (70.9–438) | 174.22 ± 84.43; 148 (74–591) | 0.344 |
| 1 year | 160.48 ± 69.5; 141 (52–536) | 157.78 ± 66.25; 138 (85–433) | 0.841 | |
| p2 | 0.021 | 0.336 | ||
| Urea (mg/dL) (z) | Baseline | 36.82 ± 14.69; 34.6 (4.6–105.2) | 43.52 ± 31.12; 35 (13–238) | 0.216 |
| 1 year | 35.8 ± 13.52; 34 (12–88) | 38.84 ± 15.96; 34 (15.4–98) | 0.198 | |
| p2 | 0.652 | 0.701 | ||
| Creatinine (mg/dL) (z) | Baseline | 0.97 ± 0.25; 0.93 (0.5–2.05) | 1.02 ± 0.35; 0.94 (0.5–3.5) | 0.362 |
| 1 year | 0.95 ± 0.27; 0.9 (0.36–1.8) | 1.00 ± 0.41; 0.89 (0.5–3.5) | 0.983 | |
| p2 | 0.180 | 0.267 | ||
| eGFR (t) | Baseline | 74.28 ± 16.15; 76.76 (30–110) | 72.79 ± 17.42; 76.97 (31–110) | 0.350 |
| 1 year | 79.05 ± 20.21; 78.98 (36–129.04) | 78.61 ± 22.49; 80.74 (37-126.17) |
0.871 | |
| p2 | 0.001 | <0.001 | ||
| Uric acid (mg/dL) (t) | Baseline | 5.26 ± 1.42; 5.2 (3–10.1) | 5.51 ± 1.86; 5.2 (1.8–11.5) | 0.211 |
| 1 year | 5.02 ± 1.54; 4.9 (2–9.7) | 5.35 ± 1.61; 5.15 (2.2–11.8) | 0.186 | |
| p2 | 0.215 | 0.196 | ||
| Uric acid/HDL ratio (%) (t) | Baseline | 11.74 ± 5.61; 11.22 (4.34–34.62) | 11.39 ± 4.63; 10.79 (2.98–24.00) | 0.653 |
| 1 year | 11.17 ± 5.77; 10.14 (3.52–28.87) | 11.34 ± 4.06; 10.35 (3.44–22.99) | 0.863 | |
| p2 | 0.742 | 0.363 | ||
| Vitamin D (µg/L) (t) | Baseline | 14.98 ± 8.71; 12.4 (3–44.2) | 16.87 ± 10.22; 15.35 (4.2–51.9) | 0.285 |
| 1 year | 16.72 ± 10.64; 13.5 (4.2–61.6) | 23.19 ± 12.78; 19.8 (5.1–57) | 0.035 | |
| p2 | 0.048 | 0.594 | ||
| Calcium (mg/dL) (z) | Baseline | 9.66 ± 0.51; 9.7 (8.2–11.2) | 9.66 ± 0.58; 9.7 (8.2–13) | 0.898 |
| 1 year | 9.67 ± 0.53; 9.7 (7.9–11.2) | 9.58 ± 0.55; 9.6 (8.3–11) | 0.400 | |
| p2 | 0.231 | 0.186 | ||
| Phosphorus (mg/dL) (z) | Baseline | 3.47 ± 0.58; 3.48 (2.1–5) | 3.62 ± 0.74; 3.6 (1.5–6.4) | 0.180 |
| 1 year | 3.58 ± 0.55; 3.5 (2.17–5.04) | 3.62 ± 0.63; 3.65 (2.4–4.7) | 0.624 | |
| p2 | 0.165 | 0.443 | ||
| Sodium (mmol/L) (z) | Baseline | 138.96 ± 3.04; 139.4 (129–145.8) | 138.81 ± 3.91; 139 (117–152) | 0.603 |
| 1 year | 139.78 ± 3.01; 140 (131–147) | 139.2 ± 2.64; 139 (132–147) | 0.069 | |
| p2 | 0.006 | 0.656 | ||
| Potassium (mmol/L) (z) | Baseline | 4.51 ± 0.42; 4.5 (2.99–5.59) | 4.51 ± 0.47; 4.5 (3.1–6.5) | 0.953 |
| 1 year | 4.56 ± 0.43; 4.5 (3.33–5.97) | 4.49 ± 0.45; 4.48 (3.5–5.85) | 0.316 | |
| p2 | 0.923 | 0.729 | ||
| WBC (103/µL) (t) | Baseline | 7.79 ± 1.76; 7.8 (3.1–10.9) | 7.46 ± 1.49; 7.5 (4–10.5) | 0.061 |
| 1 year | 7.6 ± 1.68; 7.72 (3.19–10.85) | 7.52 ± 1.61; 7.3 (4.25–10.62) | 0.741 | |
| p2 | 0.755 | 0.766 | ||
| Hematocrit (%) (t) | Baseline | 41.68 ± 5.01; 41.8 (26.2–54.3) | 41.33 ± 5.3; 41.5 (24–52.5) | 0.536 |
| 1 year | 41.67 ± 5.05; 41.85 (26.5–53.5) | 42.14 ± 5.23; 42.35 (30–52.8) | 0.537 | |
| p2 | 0.218 | 0.058 | ||
| MCV (fL) (z) | Baseline | 85.73 ± 6.06; 86.05 (60.8–103.7) | 84.4 ± 6.19; 85.2 (58.1–99.9) | 0.056 |
| 1 year | 86.16 ± 5.91; 86.4 (65.6–103) | 85.24 ± 6.55; 85.85 (56–101) | 0.281 | |
| p2 | 0.343 | <0.001 | ||
| RDW (%) (z) | Baseline | 14.08 ± 2.00; 13.6 (11.45–27.2) | 14.18 ± 1.93; 13.7 (12–26.5) | 0.427 |
| 1 year | 14.11 ± 1.58; 13.8 (7.5–18.6) | 14.14 ± 1.50; 13.8 (12–19.9) | 0.959 | |
| p2 | <0.001 | <0.001 | ||
| PCT (%) (z) | Baseline | 0.26 ± 0.08; 0.25 (0.1–0.74) | 0.26 ± 0.06; 0.25 (0.12–0.47) | 0.603 |
| 1 year | 0.25 ± 0.07; 0.26 (0.1–0.43) | 0.24 ± 0.07; 0.24 (0.1–0.4) | 0.178 | |
| p2 | 0.579 | <0.001 | ||
| Platelet count (PLT) (103/µL) (t) | Baseline | 250.96 ± 65.77; 244 (82–453) | 254.76 ± 66.18; 252.5 (107–529) | 0.592 |
| 1 year | 253.29 ± 65.11; 251 (98–419) | 243.73 ± 64.22; 240 (109–409) | 0.323 | |
| p2 | 0.660 | <0.001 | ||
| MPV (fL) (z) | Baseline | 10.37 ± 1.17; 10.2 (8.4–16.2) | 10.2 ± 1.2; 10 (7.5–13.9) | 0.171 |
| 1 year | 10.21 ± 1.15; 10.1 (7.27–17) | 10.14 ± 1.22; 10 (7.9–13.7) | 0.633 | |
| p2 | 0.111 | 0.631 | ||
| PDW (fL) (z) | Baseline | 15.88 ± 1.36; 16.1 (10–23.26) | 15.9 ± 0.92; 16 (9.9–17) | 0.132 |
| 1 year | 15.99 ± 1.05; 16.1 (11.3–20) | 15.84 ± 0.87; 16 (10–16.8) | 0.017 | |
| p2 | 0.203 | 0.761 | ||
| NLR (z) | Baseline | 2.06 ± 0.88; 1.95 (0.15–6.94) | 2.38 ± 2.15; 1.79 (0.7–16.34) | 0.638 |
| 1 year | 2.09 ± 0.92; 1.94 (0.89–6.3) | 2.42 ± 1.47; 2.16 (0.72–9.17) | 0.344 | |
| p2 | 0.226 | 0.931 | ||
| PLR (z) | Baseline | 110.94 ± 41.63; 102.88 (24.62–263.31) | 127.67 ± 89.25; 111.31 (25.05–814.63) |
0.201 |
| 1 year | 114.78 ± 40.72; 103.54 (48.42–305.06) | 115.53 ± 39.59; 115.99 (45.67–218.33) |
0.729 | |
| p2 | 0.155 | 0.006 | ||
| MLR (z) | Baseline | 0.21 ± 0.10; 0.19 (0.02–0.93) | 0.24 ± 0.17; 0.19 (0.04–1.22) | 0.459 |
| 1 year | 0.21 ± 0.08; 0.2 (0.07–0.5) | 0.22 ± 0.10; 0.21 (0.07–0.67) | 0.540 | |
| p2 | 0.359 | 0.622 | ||
| SII (z) | Baseline | 514.42 ± 249.06; 458.55 (86.15–1511.4) |
529.03 ± 305.63; 458.38 (87.69–1915.2) |
0.788 |
| 1 year | 510.44 ± 203.83; 464.69 (175.67–1228.72) | 563.57 ± 293.92; 503.34 (155.4–1214.28) |
0.629 | |
| p2 | 0.390 | 0.051 | ||
| SIRI (z) | Baseline | 1.00 ± 0.64; 0.89 (0.11–4.65) | 1.1 ± 0.89; 0.84 (0.19–8.17) | 0.821 |
| 1 year | 0.96 ± 0.47; 0.86 (0.25–3.15) | 1.09 ± 0.66; 0.83 (0.21–3.67) | 0.461 | |
| p2 | 0.951 | 0.899 | ||
| CRP (mg/L) (z) | Baseline | 5.74 ± 5.22; 3.9 (0.33–24.57) | 7.31 ± 6.12; 5.73 (0.3–27.6) | 0.131 |
| 1 year | 5.59 ± 5.39; 3.58 (0.83–25.9) | 5.78 ± 5.6; 3.55 (0.47–20) | 0.980 | |
| p2 | 0.147 | 0.674 | ||
| Ferritin (µg/L) (z) | Baseline | 76.51 ± 91.75; 46.9 (3.7–610) | 65.92 ± 84.36; 39.3 (1.7–733) | 0.193 |
| 1 year | 50.79 ± 43.86; 39.9 (4–210.38) | 43.93 ± 42.19; 25 (4.8–201) | 0.270 | |
| p2 | 0.005 | 0.017 | ||
| Total cholesterol (mg/dL) (t) | Baseline | 188.43 ± 37.11; 190 (77–290) | 187.3 ± 37.46; 186 (96–331) | 0.807 |
| 1 year | 193.1 ± 36.77; 191.5 (107–279) | 191.53 ± 36.9; 191 (104–299) | 0.800 | |
| p2 | 0.443 | 0.556 | ||
| Triglycerides (mg/dL) (t) | Baseline | 170.64 ± 81.17; 161 (50–533) | 163.23 ± 77.8; 153 (43–462) | 0.450 |
| 1 year | 150.33 ± 69.65; 140 (39–338) | 164.28 ± 90.42; 139.5 (35–446) | 0.292 | |
| p2 | 0.849 | 0.953 | ||
| LDL cholesterol (mg/dL) (z) | Baseline | 109.76 ± 32.16; 110.6 (19–191) | 105.74 ± 31.52; 104 (26–207) | 0.207 |
| 1 year | 111.58 ± 36.01; 110 (22–274) | 102.18 ± 31.39; 101 (25–180.6) | 0.122 | |
| p2 | 0.769 | 0.476 | ||
| HDL cholesterol (mg/dL) (t) | Baseline | 44.92 ± 10; 44.6 (21–69) | 48.43 ± 10.63; 47.95 (24.8–69.8) | 0.005 |
| 1 year | 54.88 ± 11.95; 52.1 (40–87.6) | 53.72 ± 12.21; 51.5 (40–89) | 0.566 | |
| p2 | <0.001 | 0.019 | ||
| TyG index (t) | Baseline | 9.46 ± 0.65; 9.47 (7.94–10.92) | 9.3 ± 0.67; 9.29 (7.83–11.56) | 0.056 |
| 1 year | 9.21 ± 0.64; 9.2 (7.66–10.77) | 9.16 ± 0.72; 9.12 (7.46–11.11) | 0.721 | |
| p2 | 0.116 | 0.105 | ||
| Urine albumin-to-creatinine ratio (mg/g creatinine) (z) | Baseline | 202.94 ± 395.86; 47.1 (0.18–2196.35) |
124.56 ± 255.23; 35.25 (0.19–1549) |
0.283 |
| 1 year | 109.2 ± 217.28; 37.97 (0.18–1344.7) | 123.11 ± 248.88; 38.14 (0.25–1344) |
0.677 | |
| p2 | 0.808 | 0.601 | ||
| pH (t) | Baseline | 7.39 ± 0.05; 7.39 (7.28–7.5) | 7.35 ± 0.04; 7.35 (7.28–7.42) | <0.001 |
| 1 year | 7.38 ± 0.05; 7.38 (7.25–7.51) | 7.34 ± 0.05; 7.34 (7.25–7.42) | 0.036 | |
| p2 | 0.441 | 0.302 | ||
| HCO3 (mmol/L) (t) | Baseline | 24.9 ± 2.6; 25 (20.3–35.5) | 21.7 ± 3.47; 22.65 (13.8–28.3) | <0.001 |
| 1 year | 23.18 ± 2.48; 23.5 (16.7–27.8) | 22.02 ± 2.22; 22.4 (18.1–26.3) | 0.142 | |
| p2 | 0.004 | 0.327 |
Footnotes: Values are presented as mean ± standard deviation (SD) and median (minimum–maximum). Statistical significance was defined as p < 0.05. Between-group comparisons at each time point were performed using the independent-samples t-test (t) for normally distributed variables and the Mann–Whitney U test (z) for non-normally distributed variables. Within-group comparisons between baseline and 1-year measurements were performed using the paired-samples t-test (t) for normally distributed variables and the Wilcoxon test (z) for non-normally distributed variables. p2 denotes the within-group comparison between baseline and 1-year measurements. Abbreviations: HbA1c, glycated hemoglobin; SD, standard deviation; Med., median; Min, minimum; Max, maximum; eGFR, estimated glomerular filtration rate; CKD-EPI, Chronic Kidney Disease Epidemiology Collaboration; HDL, high-density lipoprotein; WBC, white blood cell count; MCV, mean corpuscular volume; RDW, red cell distribution width; PCT, plateletcrit; PLT, platelet count; MPV, mean platelet volume; PDW, platelet distribution width; NLR, neutrophil-to-lymphocyte ratio; PLR, platelet-to-lymphocyte ratio; MLR, monocyte-to-lymphocyte ratio; SII, systemic immune-inflammation index; SIRI, systemic inflammation response index; CRP, C-reactive protein; LDL, low-density lipoprotein; TyG, triglyceride-glucose index; HCO3, bicarbonate.
Table 4.
Correlations between Δclinical parameters and demographic/clinical variables.
| Variable |
Treatment (DAPA), r |
Sex, r | Age, r | KDIGO stage, r |
Treatment (DAPA), p |
Sex, p | Age, p | KDIGO stage, p |
| Δ HbA1c | 0.039 | −0.125 | −0.034 | −0.058 | 0.637 | 0.133 | 0.680 | 0.485 |
| Δ Glucose | 0.068 | −0.138* | 0.033 | −0.042 | 0.318 | 0.041 | 0.630 | 0.530 |
| Δ eGFR | 0.011 | −0.075 | −0.208* | 0.041 | 0.866 | 0.234 | <0.001 | 0.519 |
| Δ Vitamin D | −0.116 | 0.339 | −0.026 | −0.162 | 0.522 | 0.053 | 0.888 | 0.368 |
| Δ Calcium | −0.150 | 0.058 | −0.034 | −0.016 | 0.083 | 0.502 | 0.699 | 0.852 |
| Δ Sodium | −0.160* | 0.043 | −0.107 | 0.063 | 0.039 | 0.582 | 0.169 | 0.416 |
| Δ Potassium | −0.015 | 0.176* | −0.055 | −0.095 | 0.850 | 0.022 | 0.481 | 0.220 |
| Δ MCV | 0.164* | 0.025 | −0.019 | −0.086 | 0.033 | 0.746 | 0.805 | 0.265 |
| Δ RDW | −0.125 | −0.014 | 0.123 | 0.087 | 0.106 | 0.862 | 0.114 | 0.264 |
| Δ PCT | −0.192* | −0.108 | −0.139 | 0.022 | 0.013 | 0.166 | 0.074 | 0.775 |
| Δ Platelet count | −0.222* | −0.055 | −0.072 | 0.060 | 0.004 | 0.476 | 0.356 | 0.443 |
| Δ NLR | −0.041 | 0.057 | 0.023 | 0.023 | 0.599 | 0.465 | 0.768 | 0.766 |
| Δ PLR | −0.228* | 0.089 | 0.078 | 0.010 | 0.003 | 0.253 | 0.312 | 0.894 |
| Δ MLR | −0.069 | 0.106 | −0.032 | 0.048 | 0.377 | 0.177 | 0.681 | 0.543 |
| Δ SII | −0.148 | 0.073 | 0.014 | 0.064 | 0.055 | 0.350 | 0.854 | 0.407 |
| Δ SIRI | 0.000 | 0.049 | −0.104 | 0.065 | 0.996 | 0.533 | 0.183 | 0.404 |
| Δ CRP | −0.012 | −0.082 | −0.053 | −0.180 | 0.919 | 0.496 | 0.657 | 0.131 |
| Δ Ferritin | 0.009 | −0.201* | 0.017 | −0.082 | 0.927 | 0.046 | 0.870 | 0.420 |
| Δ Total cholesterol | −0.022 | −0.132 | −0.223* | −0.188 | 0.834 | 0.209 | 0.033 | 0.073 |
| Δ Triglycerides | −0.007 | −0.228* | −0.285* | −0.223* | 0.951 | 0.030 | 0.006 | 0.034 |
| Δ TyG | −0.023 | −0.253* | −0.242* | −0.179 | 0.838 | 0.024 | 0.032 | 0.114 |
| Δ MA/KO | 0.052 | −0.089 | 0.124 | −0.069 | 0.679 | 0.479 | 0.325 | 0.588 |
| Δ pH | −0.164 | −0.380 | −0.364 | −0.332 | 0.424 | 0.056 | 0.067 | 0.098 |
Footnote: Values are Spearman’s rank correlation coefficients (r) and corresponding p-values. Δ indicates the change from baseline to 12 months. Treatment was coded as dapagliflozin (DAPA) = 1 and empagliflozin (EMPA) = 0. Bold p-values indicate statistical significance (p < 0.05), while bold r values marked with an asterisk (*) indicate statistically significant correlations. A p-value < 0.05 was considered statistically significant. Abbreviations: DAPA, dapagliflozin; EMPA, empagliflozin; CKD-EPI, Chronic Kidney Disease Epidemiology Collaboration; HbA1c, glycated hemoglobin; KDIGO, Kidney Disease: Improving Global Outcomes; MA/KO, microalbumin-to-creatinine ratio; MCV, mean corpuscular volume; MLR, monocyte-to-lymphocyte ratio; NLR, neutrophil-to-lymphocyte ratio; PCT, plateletcrit; PLR, platelet-to-lymphocyte ratio; RDW, red cell distribution width; SII, systemic immune-inflammation index; SIRI, systemic inflammation response index; TyG, triglyceride–glucose index.
Table 5.
Determinants of Changes in Renal, Metabolic, and Inflammatory Parameters: Path Analysis Results.
Table 5.
Determinants of Changes in Renal, Metabolic, and Inflammatory Parameters: Path Analysis Results.
| Dependent variable | Path | Predictor | Estimate | S.E. | β (Beta) | p | R2 |
| ΔeGFR | <--- | Age | -0.325 | 0.072 | -0.269 | <0.001 | 0.113 |
| <--- | Treatment group | 0.473 | 1.740 | 0.016 | 0.786 | ||
| <--- | KDIGO stage | 5.993 | 1.778 | 0.200 | <0.001 | ||
| <--- | Sex | 0.742 | 1.751 | 0.025 | 0.672 | ||
| ΔTriglycerides | <--- | Age | -0.927 | 0.514 | -0.180 | 0.072 | 0.094 |
| <--- | Treatment group | 3.997 | 12.496 | 0.032 | 0.749 | ||
| <--- | KDIGO stage | -22.475 | 12.768 | -0.176 | 0.078 | ||
| <--- | Sex | -21.723 | 12.576 | -0.173 | 0.084 | ||
| ΔTyG index | <--- | Treatment group | 0.024 | 0.111 | 0.023 | 0.827 | 0.126 |
| <--- | Sex | -0.277 | 0.112 | -0.261 | 0.013 | ||
| <--- | Age | -0.007 | 0.005 | -0.154 | 0.144 | ||
| <--- | KDIGO stage | -0.197 | 0.113 | -0.183 | 0.082 | ||
| ΔPLR | <--- | Age | 0.172 | 0.236 | 0.055 | 0.467 | 0.047 |
| <--- | Treatment group | -14.740 | 5.728 | -0.194 | 0.010 | ||
| <--- | Sex | 5.852 | 5.764 | 0.077 | 0.310 | ||
| <--- | KDIGO stage | 0.519 | 5.853 | 0.007 | 0.929 |
Footnote: Path analysis was performed using IBM SPSS AMOS version 31. Treatment group was coded as dapagliflozin (DAPA) = 1 and empagliflozin (EMPA) = 0. Sex was coded as male = 1 and female = 0. A two-sided p-value < 0.05 was considered statistically significant. Abbreviations: Δ, change from baseline to 12 months; DAPA, dapagliflozin; EMPA, empagliflozin; CKD-EPI, Chronic Kidney Disease Epidemiology Collaboration; KDIGO, Kidney Disease: Improving Global Outcomes; PLR, platelet-to-lymphocyte ratio; S.E., standard error; TyG, triglyceride–glucose index; Estimate, unstandardized regression coefficient; β, standardized regression coefficient; R2, coefficient of determination.
Disclaimer/Publisher’s Note: The statements, opinions and data contained in all publications are solely those of the individual author(s) and contributor(s) and not of MDPI and/or the editor(s). MDPI and/or the editor(s) disclaim responsibility for any injury to people or property resulting from any ideas, methods, instructions or products referred to in the content. |
© 2026 by the authors. Licensee MDPI, Basel, Switzerland. This article is an open access article distributed under the terms and conditions of the Creative Commons Attribution (CC BY) license (http://creativecommons.org/licenses/by/4.0/).
Copyright: This open access article is published under a Creative Commons CC BY 4.0 license, which permit the free download, distribution, and reuse, provided that the author and preprint are cited in any reuse.