

Submitted:
31 October 2026
Posted:
03 November 2026
You are already at the latest version
Abstract
Background: Chronic hyperglycemia may impair oxygen handling through hemoglobin glycation, altered 2,3-BPG regulation, spectrin–ankyrin–Band 3 remodeling, oxidative injury, and PIEZO1–Ca²⁺–Gardos-dependent volume changes. Whether mechanical constraints on capillary erythrocyte transit can offset oxygen-unloading advantages remains unresolved. Methods: We quantitatively reanalyzed published human erythrocyte mechanical and microvascular data, reconstructing within-study effects without pooling incompatible assays or conflating diabetes subtypes. A conditional Hill-based capillary transport–unloading crossover (CTUC) model coupled calculated saturation differences with hypothetical effective erythrocyte flux across 36 pressure–cooperativity scenarios. Aggregate complete blood count data evaluated an exploratory mechanical index (eRMI₀ = RDW-CV × MCHC/MCV). Results: In a mixed-diabetes cohort (81 patients; 78 controls), half-maximal elongation stress increased 17.27% (Hedges’ g = 0.635; 95% CI, 0.316–0.953). Diabetic foot ulcer cases exhibited 4.09% lower elongation (g = 0.780; 95% CI, −0.090–1.650). Lower deformability was associated with prevalent retinopathy (adjusted OR = 2.81; 95% CI, 1.21–6.49) and 6.95-percentage-point lower deep-plexus vessel density. For P₅₀ values of 26.7 versus 28.3 mmHg, assumed inlet/outlet PO₂ of 100/40 mmHg, and Hill coefficient 2.7, modeled fractional unloading improved by 11.69%; nevertheless, a hypothetical 10.47% loss of effective erythrocyte flux entirely nullified this advantage within the normalized proxy. Crossover thresholds spanned 3.52%–13.60%. Conversely, lower P₅₀ (26.2 mmHg) with a hypothetical flux ratio of 0.90 reduced the proxy to 86.72% of reference. Aggregate eRMI₀ shifted inconsistently (−1.52% versus +4.88%). Discussion: These findings highlight a potential mismatch between per-cell oxygen-release capacity and effective microvascular cell transport. Glycation-associated allosteric, metabolic–redox, and membrane–cytoskeletal alterations provide plausible, unverified links. Heterogeneous assays, cross-sectional evidence, and missing paired flux–oxygenation measurements limit causal inference. Conclusion: CTUC defines a testable mathematical compensation boundary, not a measured clinical threshold, for investigating transport-related amplification of glycohypoxia; eRMI₀ remains unvalidated.
Keywords:
glycohypoxia
; oxygenomics of diabetes
; erythrocyte deformability
; glycation
; microvascular transport
; oxygen unloading
1. Introduction
Microvascular oxygen delivery is governed not only by arterial oxygen content and endothelial function but also by the distribution, mechanical properties, and effective transit of erythrocytes within heterogeneous capillary networks [1,2]. With a resting diameter of approximately 7–8 μm, red blood cells (RBCs) must undergo substantial deformation to traverse capillaries narrower than their native dimensions. This process influences local hematocrit, cell-free layer formation, erythrocyte partitioning at vascular bifurcations, and microvascular flow resistance [3]. Importantly, erythrocyte flux and tissue oxygenation represent distinct, although interdependent, physiological determinants [4,5]. Lücker et al. demonstrated that increased capillary hematocrit can improve tissue oxygen tension even at equivalent RBC flux by reducing intravascular resistance to oxygen diffusion [6]. In a hamster model of acute hemodilution, Cabrales showed that transfusion of artificially rigidified erythrocytes reduced functional capillary density to 0.32 ± 0.10 of baseline, compared with 0.81 ± 0.07 following transfusion of normally deformable cells, accompanied by impaired tissue oxygenation [7]. More recently, LeCompte et al. employed anatomically reconstructed human retinal capillary networks to demonstrate that diabetes-associated alterations in erythrocyte biomechanics could redistribute local hematocrit by approximately ±40% and RBC velocity by −30% to +40%, with marked changes in endothelial wall shear stress arising from altered cellular trafficking and capillary partitioning [8]. Together, these experimental and computational observations suggest that erythrocyte mechanical abnormalities may compromise the spatial distribution of oxygen-carrying cells independently of proportional changes in bulk blood flow. Erythrocyte deformability arises from the coordinated contributions of membrane viscoelasticity, cytoplasmic viscosity, cellular hydration, and surface-area-to-volume ratio, supported structurally by the spectrin–actin cytoskeleton and its interactions with ankyrin, Band 3, and protein 4.2 [9,10,11,12]. Chronic hyperglycemia may disrupt these determinants through nonenzymatic protein glycation and oxidative modification [13]. Schwartz et al. identified increased glycation of β-spectrin, ankyrin, and protein 4.2 in diabetic erythrocytes, accompanied by oxidative spectrin damage characterized by a 35% reduction in methionine content. Ektacytometry demonstrated reduced deformability in 21 of 32 diabetic participants, with an average impairment of approximately 10% among affected individuals [14]. Beyond cytoskeletal alterations, membrane mechanics are functionally coupled to ion-dependent volume regulation. Mechanically activated PIEZO1 channels facilitate Ca²⁺ influx, which can stimulate the calcium-sensitive Gardos/KCa3.1 potassium channel, promoting KCl and water loss and potentially modifying erythrocyte hydration and mechanical behavior [15]. Nevertheless, altered calcium homeostasis does not necessarily produce detectable impairment in population-average deformability. In a murine model exhibiting a T2DM-like metabolic phenotype, Kuck et al. reported increased intracellular erythrocyte Ca²⁺ and disrupted insulin-stimulated calcium responses without significant differences in mean deformability, despite greater cell-to-cell mechanical heterogeneity [16]. Human studies similarly demonstrate that the mechanical phenotype is not uniform. In a cohort comprising both type 1 and type 2 diabetes, Ebenuwa et al. documented greater shear stress required for half-maximal elongation (SS₁/₂) than in nondiabetic controls (1.63 ± 0.45 versus 1.39 ± 0.28 Pa; n = 81 and 78, respectively), together with osmotic-gradient abnormalities consistent with altered cellular hydration [17]. Independently, quantitative membrane imaging revealed reduced dynamic membrane fluctuations in diabetic erythrocytes compared with controls (61.64 ± 7.49 versus 70.65 ± 6.65 nm) [18].
These findings implicate interacting structural, oxidative, and ion-regulatory disturbances in diabetic erythrocyte dysfunction while emphasizing that different measurement platforms interrogate distinct mechanical properties rather than interchangeable manifestations of a single phenotype. The potential clinical relevance of these abnormalities is particularly evident in the retinal microcirculation, where restricted capillary dimensions and heterogeneous cellular perfusion may increase sensitivity to impaired erythrocyte transit. In an investigation involving 22 patients with type 2 diabetes mellitus (T2DM) and 19 controls, Chung et al. reported increased erythrocyte rigidity, reduced retinal capillary blood-flow velocity, and lower calculated oxygen transport efficiency, with strong inverse correlations between rigidity and transport efficiency at two shear rates (r = −0.80 and −0.84) [19]. Subsequent studies extended these findings to diabetic microvascular disease. Among 373 patients with T2DM, Moon et al. observed significantly lower erythrocyte elongation index at 3 Pa (EI@3Pa) in individuals with diabetic retinopathy than in those without retinopathy (30.53 ± 1.95 versus 31.20 ± 1.53; P = 0.001). After multivariable adjustment, participants in the lowest deformability quartile had greater odds of prevalent retinopathy than those in the highest quartile (OR = 2.81; 95% CI, 1.21–6.49) [20]. Using microfluidic cross-slot measurements, Tan et al. further identified progressively reduced erythrocyte deformability with increasing retinopathy severity in 86 patients with T2DM (P = 0.018) [21]. More recently, Han et al. investigated 79 patients with treatment-naïve diabetic retinopathy using erythrocyte ektacytometry and retinal vascular imaging. EI@3Pa was positively associated with deep capillary plexus vessel density (r = 0.3893; P = 0.007), whereas lower deformability correlated with greater peripheral retinal ischemia in advanced disease (r = −0.206; P = 0.035) [22].
Beyond retinal pathology, Cahn et al. reported lower erythrocyte elongation ratios in diabetic patients with foot ulcers than in diabetic controls without recognized microvascular complications (1.64 ± 0.07 versus 1.71 ± 0.10) [23]. Collectively, these findings associate erythrocyte mechanical dysfunction with clinical and imaging-based manifestations of diabetic microvascular disease. However, their predominantly observational designs, heterogeneous measurement techniques, and differences in vascular endpoints preclude definitive conclusions regarding causality or the magnitude of mechanically mediated microvascular transport impairment. An important unresolved physiological question is whether changes in hemoglobin oxygen-unloading potential can compensate for mechanically constrained erythrocyte transport. Hemoglobin oxygen affinity, commonly characterized by the partial pressure at 50% oxygen saturation (P₅₀), describes oxygen-binding behavior but does not quantify the effective passage or distribution of oxygen-carrying erythrocytes within exchange vessels. Notably, Ebenuwa et al. reported a positive association between SS₁/₂ and P₅₀ within their diabetes cohort (r = 0.35; P = 0.008), with higher P₅₀ among participants exhibiting the poorest deformability than among those with the greatest deformability (28.3 ± 1.5 versus 26.7 ± 1.6 mmHg) [17,24]. Conversely, Phan et al. observed higher P₅₀ in blood donors with T2DM without significant differences in maximum elongation index or erythrocyte rigidity, indicating that oxygen affinity and mechanical competence do not necessarily vary in parallel [25]. Although increased P₅₀ may enhance oxygen unloading over defined oxygen-pressure intervals, its theoretical benefit could be diminished if the effective flux of erythrocytes through the microcirculation is simultaneously reduced. Crucially, laboratory deformability measurements cannot directly quantify this loss of transport competence. Sosa et al. demonstrated that neither ektacytometry nor micropore filtration reliably predicted erythrocyte perfusion through an artificial microvascular network, highlighting the influence of network geometry and cellular distribution on functional transport [26]. Consequently, the quantitative boundary at which reduced effective erythrocyte transport offsets a theoretical improvement in oxygen unloading remains insufficiently defined. Addressing this relationship requires an explicit biophysical framework that distinguishes oxygen-release potential from cellular transport capacity without assuming that alterations in deformability translate directly into proportional changes in capillary flux.
A related translational challenge concerns the identification of accessible hematological correlates of erythrocyte mechanical impairment. Although ektacytometry, microfluidic assays, and advanced membrane imaging provide detailed biomechanical characterization, their specialized instrumentation limits routine clinical implementation. Complete blood count (CBC) parameters, including red cell distribution width (RDW), mean corpuscular volume (MCV), and mean corpuscular hemoglobin concentration (MCHC), capture aspects of erythrocyte size heterogeneity, cellular volume, and intracellular hemoglobin concentration that may indirectly reflect mechanical behavior. In a study involving 293 adults, Patel et al. found that RDW above 14% was independently associated with reduced erythrocyte deformability (regression coefficient = −0.242; P = 0.003), while MCV and MCHC contributed additional explanatory information within a multivariable model accounting for approximately 37% of the variance in elongation index [27]. Nevertheless, these associations do not establish the predictive validity of a composite CBC-derived mechanical index, particularly across heterogeneous diabetic populations and measurement platforms. Accordingly, the present study aims to quantitatively reanalyze published erythrocyte mechanical abnormalities and their associations with microvascular dysfunction in T2DM, develop an exploratory capillary transport–unloading crossover (CTUC) framework to characterize the conditional relationship between effective erythrocyte transport and hemoglobin oxygen-release potential, and critically evaluate the feasibility of a CBC-derived mechanical impairment index using available aggregate evidence.
2. Methods
2.1. Study Design, Objectives, and Analytical Framework
This study was conducted as a targeted secondary quantitative reanalysis of published human studies, combined with an explicitly conditional biophysical modeling investigation. The primary objective was to reconstruct the magnitude and direction of erythrocyte mechanical impairment in type 2 diabetes mellitus (T2DM) and examine associations with objectively characterized microvascular abnormalities. The second objective was to derive and interrogate a capillary transport–unloading crossover (CTUC), a dimensionless model relating effective flux of oxygen-carrying erythrocytes to potential hemoglobin oxygen unloading. The third, strictly exploratory objective was to assess whether complete blood count (CBC) variables could form a mathematically coherent candidate surrogate of erythrocyte mechanical impairment. The analytical framework comprised four evidence strata: (A) between-group human mechanical phenotyping; (B) within-study erythrocyte mechanics–microvascular associations; (C) studies reporting both CBC variables and direct erythrocyte mechanical measurements; and (D) experimental, microfluidic, or computational evidence used to define mechanistic plausibility and model limitations. Clinical comparisons, published regression coefficients, physical scenario calculations, and aggregate CBC plug-in scores were treated as distinct estimands. The independent person was the primary unit of clinical inference; multiple cells sampled per person and two eyes from one person were not regarded as independent participants.
2.2. Evidence Sources, Study Selection, and Source Independence
Relevant original human studies were identified through a targeted literature inventory addressing erythrocyte deformability, diabetes-associated microvascular abnormalities, erythrocyte oxygen transport, and relationships between CBC parameters and directly measured erythrocyte mechanics. The retained principal reports were Ebenuwa et al., 2024 [17]; Chung et al., 1993 [19]; Moon et al., 2016 [20]; Tan et al., 2020 [21]; Han et al., 2026 [22]; Cahn et al., 2016 [23]; and Patel et al., 2013 [27]. Physical and methodological boundaries were informed by Lücker et al., 2017 [6]; LeCompte et al., 2026 [8]; Phan et al., 2025 [25]; and Sosa et al., 2014 [26]. Individual study roles and the accessible endpoints are summarized in Table 1. Quantitative reconstruction was confined to published measurements and summary statistics with identifiable clinical groups, assay definitions, and appropriate denominators. Primary experimental, microfluidic, and computational studies were considered for model construction and contextual interpretation, not combined with human clinical effect estimates. Reviews and commentaries could inform background context but did not replace original-source numerical extraction. Potentially overlapping reports, particularly the NIH diabetes cohorts described in Ebenuwa et al., 2024 [17] and Ebenuwa et al., 2025 [28], were treated as non-independent sources where appropriate. This targeted synthesis was not designed to claim exhaustive systematic-review coverage.
2.3. Eligibility, Endpoint Hierarchy, and Study-Level Independence
Original adult human studies contributed to quantitative mechanical comparisons when they reported a directly measured RBC deformability or rigidity variable, an identifiable T2DM or diabetes comparator, and sufficient summary statistics to reconstruct the contrast or its uncertainty. Studies lacking essential subgroup denominators or dispersion estimates were retained for structured descriptive interpretation but not for the corresponding standardized calculation. Directly measured mechanical outcomes were distinguished from indirect rheological correlates such as aggregation and fibrinogen. T2DM-specific comparisons were prioritized; inseparable T1DM/T2DM mixtures were identified as mixed-diabetes evidence and were not presented as T2DM-specific estimates. The clinical endpoint hierarchy prioritized contemporaneous quantitative microvascular physiology or imaging (e.g., retinal capillary velocity, optical coherence tomography angiography [OCTA] vessel density, and peripheral ischemic index) over prevalent clinical diagnoses (e.g., retinopathy, diabetic foot ulcer, and kidney disease). Continuous vascular measurements, ordinal disease stage, and prevalent disease status were evaluated as separate endpoint classes rather than combined into one outcome. Experimental studies involving nondiabetic cells, animal models, or simulated networks supplied mechanistic context only and were not entered into clinical sample denominators. Analyses involving repeated cells, images, or bilateral eyes were evaluated according to their independent participant base. Eye-level findings were not reinterpreted as independent patient-level tests without an appropriate clustered or paired uncertainty estimate. Duplicate and multiply reported results were considered with regard to recruitment setting, sample sizes, enrollment period, and laboratory protocol.
2.4. Data Extraction, Provenance, and Numerical Audit
Study-level extraction distinguished publication identifier, design, source population, diabetes subtype, clinical comparison, outcome-specific denominator, measurement protocol, and reported demographic or clinical characteristics when available. Recorded mechanical variables included instrument and assay geometry, shear or extensional stress, original measurement units, group mean and standard deviation (SD), sample size, and favorable versus unfavorable measurement direction. Microvascular variables were distinguished as OCTA vessel density, foveal avascular zone, ischemic index, retinal RBC velocity, modeled oxygen-transport efficiency, or clinically diagnosed complications. CBC variables were retained using their original definitions, particularly RDW-CV versus RDW-SD, MCV, and MCHC, together with the relevant sampled population. Source-reported statistics were kept distinct from author-reconstructed contrasts, aggregate plug-in calculations, and hypothetical model inputs. Missing subgroup counts or dispersion estimates were not imputed, and individual-level records were not synthesized from aggregate means or SDs. Three source-specific issues were considered when interpreting numerical results: the 79-person versus 147-eye denominators and the unusually reported proliferative-retinopathy EI dispersion in Han et al., 2026 [22]; the 118-person CBC versus 93-person mechanical measurement denominators in Tan et al., 2020 [21]; and the 61/20 T2DM/T1DM composition together with the reduced P₅₀ subgroup in Ebenuwa et al., 2024 [17]. Ambiguous published dispersion values were not used to generate an apparently precise standardized contrast. Reconstructed numerical quantities were evaluated against their source-reported means, SDs, sample sizes, mathematical definitions, and dimensions. No formal duplicate extraction by two independent reviewers or exhaustive systematic search is claimed. Where source reporting did not permit a particular calculation, the corresponding result was interpreted descriptively instead.
2.5. Measurement Harmonization and Direction of Impairment
Mechanical outcomes were harmonized by their underlying physical definitions rather than by numerical scale alone (Table 2). Shear-gradient ektacytometry EI@3Pa was distinguished from cross-slot extensional EI, which depends on different geometry and deformation stimuli. SS₁/₂ is the shear stress needed to attain half-maximal elongation and is oriented inversely to deformability. Cell-flow-analyzer elongation ratio (ER) is geometrically distinct from both EI approaches.
Aggregation, osmotic fragility, osmotic-gradient parameters, and membrane fluctuations were considered related phenotypes rather than substitutable mechanical units. Percentage-to-fraction conversion of EI was appropriate only when the original index definition was identical.
The direction of standardized comparisons was fixed as greater mechanical impairment: lower EI or ER in the affected group, or higher SS₁/₂ in the affected group. Original assay units and within-study comparison definitions were preserved. No cross-device raw mean was pooled, and no omnibus mechanical effect was interpreted as a direct measure of capillary RBC flux or tissue oxygen delivery. Consistent with the artificial-network observations of Sosa et al., 2014 [26], no transformation from isolated laboratory deformability measurements to in-vivo microvascular flux was assumed.
2.6. Reconstruction of Within-Study Mechanical Differences and Effect Sizes
For an affected group A and a reference group R, an impairment-oriented mean difference (Δimp) was defined as mean(R) − mean(A) for EI or ER, in which higher values indicate better mechanical function, and mean(A) − mean(R) for SS₁/₂, in which higher values indicate poorer function. Relative within-assay impairment was expressed as 100 × Δimp/mean(R) when the reference mean and original scale allowed meaningful ratio interpretation.
Raw contrasts preserve instrument-specific units, whereas standardized differences permit cautious comparisons within compatible mechanical families without eliminating clinical heterogeneity.
Equation (1). Impairment-oriented mean difference.
Δimp = X̄R − X̄A [EI or ER]; Δimp = X̄A − X̄R [SS₁/₂]
Equation (2). Within-study percentage impairment.
For unpaired participant groups reporting mean, SD and independent subgroup N, the pooled SD (Sp), standardized difference (d) and small-sample bias-corrected Hedges g will be calculated as follows. Corrections will be oriented so that a positive g denotes worse mechanical function in the affected group.
Equation (3). Pooled SD for two independent groups.
Sp = √{ [ (nA − 1)sA² + (nR − 1)sR² ] / (nA + nR − 2) }
Equation (4). Hedges g and small-sample correction.
Equation (5). Approximate standard error and 95% confidence interval.
The confidence interval in Equation (5) is a normal-approximation interval and was interpreted cautiously for small samples, particularly Cahn et al., 2016 [23] (11 versus 11). Overall recruitment N was not substituted for the relevant clinical subgroup denominator. In Moon et al., 2016 [20], the reported retinopathy-related EI means and SDs support a raw contrast, but the retinopathy subgroup sizes must be established before calculating a valid standardized difference. In Han et al., 2026 [22], the reported proliferative diabetic retinopathy EI SD (0.18) was not used to reconstruct a standardized result because of unresolved dispersion consistency. Comparisons were interpreted according to assay family, clinical contrast, and diabetes subtype; effect estimates were not combined into an omnibus pooled deformability effect.
2.7. Reconstruction of Microvascular Associations and Statistical Precision
The downstream clinical analysis focused on reports in which erythrocyte mechanics and a microvascular outcome were assessed within the same participant cohort.
Endpoints were ordered as (i) continuous physiological or imaging markers, including retinal capillary velocity, deep capillary plexus vessel density (DCP VD), and quantitative peripheral ischemia; (ii) ordinal retinopathy severity; and (iii) prevalent disease, including diabetic foot ulcer or albuminuria. These outcome classes were not combined into a single microvascular summary effect.
Where Pearson correlation coefficients and appropriate independent participant denominators were available, Fisher transformation provided a framework for approximate confidence-interval reconstruction (Equation 6). The number of measured cells, retinal images, or eyes was not substituted for the number of independent participants. Spearman rank coefficients were retained as Spearman ρ rather than relabeled Pearson r; any Fisher-based interval for rank correlation would be an approximation, not an exact Pearson-based interval.
Equation (6). Fisher transformation and interval reconstruction.
Han et al., 2026 [22] included OCTA and ultra-widefield fluorescein angiography findings from subsets of eyes within a 79-person cohort. Accordingly, eye-level coefficients were not assigned participant-level precision by treating 147 eyes as independent. Chung et al., 1993 [19] associated erythrocyte rigidity with a calculated retinal oxygen-transport-efficiency quantity at two shear rates; the derived efficiency definition and common-sample dependence limit direct comparison with measured vascular outcomes. Retinal vessel density, peripheral ischemia, blood-cell velocity, and modeled transport efficiency remained distinct variables.
Adjusted associations were retained with their original outcome definition and covariate adjustment. In Moon et al., 2016 [20], the adjusted odds ratio for prevalent retinopathy in the least versus most deformable EI quartile was 2.81 (95% CI 1.21–6.49). This cross-sectional odds ratio was not interpreted as a prospective risk ratio or as proof that erythrocyte impairment preceded retinopathy. Table 3 summarizes the clinical outcome alignment and major denominator limitations.
2.8. Capillary Transport–Unloading Crossover: Conditional Biophysical Model
To distinguish potential hemoglobin unloading from the transport of oxygen-bearing erythrocytes, a minimal dimensionless CTUC model was constructed. Hemoglobin oxygen saturation S(p) was approximated using a Hill relationship, where p is oxygen partial pressure (mmHg), P₅₀ is the partial pressure at 50% saturation (mmHg), and n is the Hill coefficient. Identical inlet and outlet pressures and n were assumed within each contrasted scenario so that calculated unloading differences arose from the specified P₅₀ value alone.
Equation (7). Hill saturation under fixed conditions.
Equation (8). Idealized fractional oxygen unloading.
U(P₅₀; pin, pout, n) = S(pin; P₅₀,n) − S(pout; P₅₀,n); 0 < pout < pin
Fref and Falt denote identically defined effective fluxes of hemoglobin-bearing RBCs through a specified exchange network under the reference and alternative conditions, respectively. The dimensionless flux ratio was φ = Falt/Fref. Assuming comparable intracellular hemoglobin content per effective erythrocyte and the same fixed oxygen-pressure interval, the normalized quantity R represents an illustrative transport–unloading product, not a measured tissue oxygen-delivery or extraction rate. None of the included source studies provides a validated quantitative mapping from EI, SS₁/₂, osmoscan, or CBC variables to φ.
Equation (9). Flux ratio and normalized transport–unloading proxy
The CTUC threshold was defined algebraically by R = 1: at φcrit, the alternative state and reference state are equivalent under this restricted proxy.
The corresponding percentage loss Lcrit is meaningful as a tolerable hypothetical reduction in effective flux only if 0 < φcrit < 1. If U(P₅₀alt) is lower than U(P₅₀ref), then φcrit exceeds 1 and equivalence requires increased, not decreased, flux. In that case, Lcrit is negative and must not be described as a positive tolerated loss.
Equation (10). Conditional crossover threshold.
The principal P₅₀ contrast (26.7 vs 28.3 mmHg) was obtained from within-diabetes SS₁/₂ strata in Ebenuwa et al., 2024 [17,24]. That population contained both T1DM and T2DM participants, and these P₅₀ values were not measurements of capillary transit. The baseline mathematical scenario used p_in = 100 mmHg, p_out = 40 mmHg, and n = 2.7. A joint sensitivity grid evaluated p_in ∈ {80, 90, 100} mmHg, p_out ∈ {20, 30, 40, 50} mmHg, and n ∈ {2.5, 2.7, 3.0}, yielding 36 scenarios. The tested conditions were chosen to explore mathematical sensitivity, not to define empirical physiological normal ranges. Additional hypothetical flux ratios of φ ∈ {1.0, 0.9, 0.8} were used for scenario comparisons.
An exploratory lower-P₅₀ (higher oxygen-affinity) case of 26.2 mmHg, taken from the separate T2DM cohort of Akl and Ahmed, 2026 [30], was treated solely as another hypothetical model input. It was not paired at the participant level with the Ebenuwa mechanical measurements Table 4.
The model assumes identical pressure boundaries across contrasted states, unchanged Hill coefficient within each scenario, steady state, comparable mean hemoglobin content per effective RBC, and no explicit capillary heterogeneity, plasma-dissolved oxygen term, tissue-diffusion component, altered metabolic demand, or coupled flow–pressure response. Actual capillary hematocrit, RBC spacing, transit time, flow, and oxygen extraction are interdependent. Lücker et al., 2017 [6] demonstrated that tissue oxygen tension can differ at a given RBC flux due to hematocrit-dependent intravascular diffusion resistance, while Sosa et al., 2014 [26] showed that single-assay deformability measurements do not necessarily determine artificial-network perfusion. CTUC therefore defines an algebraic crossover of a deliberately reduced proxy, not a measured diabetic tissue-hypoxia threshold.
No causal magnitude for changes in φ was assigned to diabetes, glycation, PIEZO1 activity, membrane rigidity, or any CBC score. LeCompte et al., 2026 [8] was used only as mechanistic context for heterogeneous cell-trafficking effects in simulated capillary networks; its local flow estimates were not transferred to clinical diabetic participants.
2.9. CBC-Derived Erythrocyte Mechanical Impairment Candidate: Definition and Mathematical Audit
An exploratory CBC-derived mechanical impairment candidate, eRMI₀, was constructed algebraically as the product of RDW-CV (%) and MCHC (g/dL) divided by MCV (fL). It is not dimensionless under those reporting units, and its numerical magnitude depends on unit conventions and hematology-analyzer characteristics. The score was therefore considered a candidate mathematical construct, not a validated biological or diagnostic index. RDW-SD (fL) was not substituted for RDW-CV (%) in the definition.
Equation (11). Initial CBC-derived mechanical surrogate candidate.
Patel et al., 2013 [27] reported associations between standardized EI and CBC components, including MCV, MCHC, and a piecewise RDW-above-14% term, in 293 adults. Those published coefficients provided conceptual context but were not transferred into a calibrated T2DM formula without individual-level data and the original regression coding. The algebra of RDW-CV further implies an additional dependence on MCV because RDW-CV is conventionally defined as approximately 100 times the SD of RBC volume divided by MCV.
Equation (12). Algebraic RDW-CV dependence.
For studies reporting only group-level CBC means, eRMI₀ was calculated by plugging the reported mean values into Equation (11). This quantity is not the arithmetic mean of participant-level eRMI₀ values because the expression is nonlinear and depends on the unknown joint distribution of the CBC inputs. Aggregate plug-in contrasts cannot establish individual-level correlations with deformability, calibration slopes, or receiver-operating-characteristic performance.
Equation (13). Non-equivalence of aggregate plug-in and participant mean.
eRMI₀(RDW̄, MCHC̄, MCV̄) ≠ E[eRMI₀(RDWᵢ, MCHCᵢ, MCVᵢ)] (generally)
Available group-level CBC summaries were used with their reported clinical denominators. Ebenuwa et al., 2024 [17] reported diabetes versus control means of RDW-CV 12.98 versus 13.40%, MCV 86.2 versus 87.9 fL, and MCHC 33.1 versus 33.2 g/dL. Tan et al., 2020 [21] reported 14.55 versus 13.72%, 86.3 versus 86.46 fL, and 32.95 versus 33.38 g/dL, respectively. In Tan et al., the 93 mechanically characterized participants were not treated as identical to the 118 people represented in the CBC summaries. These numerical contrasts therefore remained aggregate and were not treated as matched participant-level correlations.
2.10. CBC Comparator Variables, Directional Concordance, and Limits of Validation
The eRMI₀ candidate was evaluated alongside the published behavior of its constituent CBC variables—RDW-CV, MCV, and MCHC—without optimizing new predictive coefficients. Individual CBC associations can vary with hydration, RBC age, anemia, and clinical comorbidity. The piecewise RDW-above-14% term reported by Patel et al., 2013 [27] was treated as a feature of that source model, not as a newly validated diabetes-specific decision threshold. Mechanical directionality was assessed with the assay-specific orientation defined in Table 2. A strict matched comparison between a mean CBC-derived score and a mean mechanical endpoint would require the same participants and clinical subgroups. Where CBC and mechanical measurements had different denominators, the comparison was classified as an unmatched contextual juxtaposition. In Tan et al., 2020 [21], the reported RDW–EI association within the mechanically measured subset was weak and nonsignificant (r = −0.0965, p = 0.496), providing an important negative comparator. An inconsistent direction across sources was not corrected by post hoc weighting or coefficient changes. No individual-level predictive accuracy, sensitivity, specificity, calibration, area under the receiver-operating-characteristic curve (AUROC), or prospective complication prediction was derived from the available group summaries. Likewise, published cross-sectional associations with retinopathy were not treated as incident-risk predictions.
Candidate feasibility was evaluated in terms of algebraic definition, source-data availability, denominator compatibility, and concordance with directly measured mechanical outcomes, without an invented threshold or performance statistic (Table 5).
2.11. Methodological Safeguards, Reproducibility, and Inference Boundaries
The observational reports were examined for source-level selection and comparator definitions, clinical confounding, measurement reliability, assay geometry and calibration, outcome-specific denominators, appropriateness of participant-level statistical independence, and uncertainty in published dispersion values. Experimental and in silico studies were interpreted separately in relation to model assumptions, parameter identifiability, validation domain, and correspondence to human microcirculation; they were not assigned observational clinical risk-of-bias scores. This source-specific appraisal was descriptive rather than a completed formal JBI assessment. Mixed-diabetes findings, small study groups, questionable variance values, potentially overlapping cohorts, and incompatible assay families were identified and not treated as interchangeable or independent evidence. The CTUC analysis used the complete 36-combination grid of inlet pressure, outlet pressure, and Hill coefficient rather than selecting only favorable boundary conditions. The separate lower-P₅₀ case and the behavior of φcrit > 1 were retained to test interpretation when the alternative state had lower calculated unloading under the specified pressure conditions.
Effective flux values remained hypothetical throughout: no patient-level relationship between deformability, CBC variables, and φ was inferred, and no mechanical group contrast was back-solved to obtain a clinical oxygen deficit. CBC comparisons were restricted to the available published samples and were not treated as participant-matched when the source denominators differed.
The mathematical calculations were specified by Equations (1)–(13). In the CTUC component, S(p), U(P₅₀), R, φcrit, and Lcrit were evaluated subject to the input constraints p_in > p_out > 0, n > 0, and P₅₀ > 0, with the stated parameter combinations. Mechanical effect calculations retained the original group means, SDs, outcome-specific independent N, measurement direction, and confidence-interval approximation. Throughout, source-reported clinical observations, author-derived contrasts, aggregate CBC plug-in values, and hypothetical model outputs were distinguished. Table 6 consolidates source-specific limitations and the corresponding inferential safeguards.
Interpretation was restricted to observational associations and conditional biophysical model behavior. This analysis did not directly measure in-vivo capillary RBC flux, parenchymal oxygenation, tissue oxygen consumption, or incident complications, and therefore cannot establish a causal sequence from impaired RBC mechanics to tissue injury. Candidate molecular mechanisms—including oxidative stress, PIEZO1/Ca²⁺ signaling, Gardos-dependent volume regulation, plasma-membrane Ca²⁺-ATPase (PMCA), scramblase activity, and eryptosis—were retained only as source-qualified pathophysiological context and were not fitted as CTUC parameters. Proposed mechanisms such as pathological cation leakage caused by glycated Band 3 or flexoelectric activation of PIEZO1 in T2DM were not treated as established model premises.
3 Results
3.1. Included Evidence and Measurement Compatibility
The currently audited evidence set comprises primary human reports of shear-gradient ektacytometry, microfluidic extensional deformation, cell-flow elongation, retinal capillary hemodynamics, and objective retinal imaging, supplemented by nonclinical microfluidic and biophysical studies used solely to constrain interpretation. Eight human anchor studies directly inform the mechanical, microvascular, or routine hematology questions (Table 7); further experimental and computational publications inform model assumptions but do not contribute patients to clinical effect estimates. These sources are an initial purposive evidence inventory, not a final count of screened eligible articles.
Endpoint-specific denominators varied substantially. Ebenuwa et al., 2024 [17] enrolled 81 participants with diabetes and 78 controls for shear-gradient ektacytometry, but the diabetes group included 61 patients with type 2 and 20 with type 1 disease; the simultaneous SS₁/₂–P₅₀ analysis included only 58 diabetic participants and 75 controls. Tan et al., 2020 [21] enrolled 118 persons (86 with T2DM and 32 controls), while only 93 had usable cross-slot deformation measurements. Han et al., 2026 [22] measured erythrocyte elongation in 79 patients but used as many as 147 eyes for certain retinal-image analyses. These denominators cannot be interchanged for standardized differences or uncertainty intervals.
Measurement incompatibility was substantial: the percentage elongation index (EI@3 Pa), half-maximal shear stress (SS₁/₂, Pa), dimensionless cell-flow elongation ratio (ER), and cross-slot extensional EI are not directly exchangeable effect scales. Accordingly, normalized changes were calculated within original assay protocols; pooled mean mechanical effects across incompatible devices were not estimated. The direct artificial-microvascular-network experiment of Sosa et al., 2014 [26] and the transport analysis of Lücker et al., 2017 [6] additionally showed why measured deformation cannot be converted into an observed capillary cell-flux fraction without independent calibration.
3.2. Reconstructed Magnitude of Erythrocyte Mechanical Impairment
In Ebenuwa et al., 2024 [17], mean SS₁/₂ was 1.63 ± 0.45 Pa in diabetes (n = 81) and 1.39 ± 0.28 Pa in controls (n = 78). The independently reconstructed difference was +0.24 Pa, corresponding to a 17.27% increase relative to the control mean (greater SS₁/₂ denotes worse deformation). The pooled-SD standardized contrast yielded Hedges’ g = 0.635 (approximate 95% CI, 0.316–0.953); reconstruction from rounded group summaries gave two-sided t-test P < 0.001. These estimates quantify an observed mixed-diabetes mechanical contrast, not a T2DM-exclusive effect or a causal effect of glycation. In the two small diabetic cohorts compared by Cahn et al., 2016 [23], mean ER was 1.64 ± 0.07 in participants with foot ulcers and 1.71 ± 0.10 in diabetic controls (n = 11 per group).
The reconstructed impairment-oriented difference was 0.07 ER units (4.09% of the comparator mean), with Hedges’ g = 0.780 and an approximate 95% CI spanning −0.090 to 1.650. The minimally deformable fraction was higher by 7.28 percentage points (37.89 ± 8.12% versus 30.61 ± 10.17%; g = 0.761), whereas the highly deformable fraction was lower by 5.02 points (12.47 ± 4.43% versus 17.49 ± 8.17%; g = 0.735). All three standardized contrasts were imprecise in this n = 22 comparison; their published P values were not reproduced by straightforward two-sided independent t tests of the rounded summary data (see Section 3.7). Other human cohorts supported descriptive within-study differences but did not provide a sufficient corresponding denominator set for an independently defensible standardized contrast. Moon et al., 2016 [20] reported EI@3 Pa of 30.53 ± 1.95% in patients with retinopathy versus 31.20 ± 1.53% without retinopathy, equivalent to a 0.67-percentage-point (2.15% relative) decrement. Tan et al., 2020 [21] reported mean cross-slot EI of 2.43 ± 0.41 in proliferative retinopathy versus 2.77 ± 0.27 in healthy controls (12.27% lower) and 2.64 ± 0.38 in diabetes without retinopathy (7.95% lower); cell elongation under this extensional assay is not numerically comparable to EI@3 Pa. In Han et al., 2026 [22], EI@3 Pa declined from 31.13 ± 1.78% in mild/moderate nonproliferative disease to 26.77 ± 0.18% in proliferative disease, a 4.36-percentage-point (14.01%) published-mean decrement. Because its proliferative-stage dispersion is internally problematic, no new standardized effect or reconstructed confidence interval was accepted for that contrast.

Table 8.
Newly reconstructed within-study erythrocyte mechanical contrasts.
| Study / contrast | Source group values (affected vs reference) | Derived impairment | Hedges’ g (approx 95% CI) | Interpretation |
|---|---|---|---|---|
| Ebenuwa et al., 2024 [17]; SS₁/₂ | 1.63 ± 0.45 (81) vs 1.39 ± 0.28 (78) Pa | +0.240 Pa; +17.27% | 0.635 (0.316, 0.953) | Mixed diabetes vs controls |
| Cahn et al., 2016 [23]; ER | 1.64 ± 0.07 (11) vs 1.71 ± 0.10 (11) | −0.070 ER; 4.09% lower | 0.780 (−0.090, 1.650) | Ulcer vs diabetic comparator |
| Cahn et al., 2016 [23]; minimally deformable | 37.89 ± 8.12 vs 30.61 ± 10.17% | +7.28 percentage points | 0.761 (−0.107, 1.630) | Same 22 participants |
| Cahn et al., 2016 [23]; highly deformable | 12.47 ± 4.43 vs 17.49 ± 8.17% | −5.02 percentage points | 0.735 (−0.131, 1.601) | Same 22 participants |
| Moon et al., 2016 [20]; EI@3 Pa | 30.53 ± 1.95 vs 31.20 ± 1.53% | −0.67 percentage points; 2.15% lower | Not estimable | Retinopathy subgroups Ns unavailable |
| Tan et al., 2020 [21]; cross-slot EI | PDR 2.43 ± 0.41 vs control 2.77 ± 0.27 | −0.34; 12.27% lower | Not estimable | N differs by assay subset |
| Han et al., 2026 [22]; EI@3 Pa | PDR 26.77 ± 0.18 vs mild/moderate 31.13 ± 1.78% | −4.36 points; 14.01% lower | Withheld pending audit | Published SD/analy sis discordance |
Signs in the “derived impairment” column preserve the physical source direction; g is oriented positive for greater mechanical impairment. Percent differences are descriptive ratios of published means; CIs for g use normal approximations, not exact noncentral-t methods. Multiple Cahn rows are dependent estimates from the same participants and must not be counted as independent studies.
3.3. Associations with Objective Microvascular Abnormalities and Clinical Complications
An early quantitative relationship between erythrocyte rigidity and a retinal-flow-related composite was reported by Chung et al., 1993 [19] in 22 patients with T2DM and 19 controls: rigidity correlated inversely with a calculated oxygen transport-efficiency variable at shear rates of 225 s⁻¹ (r = −0.80) and 450 s⁻¹ (r = −0.84), in the pooled cohort. Fisher-transformed approximate 95% CIs using N = 41 were −0.889 to −0.653 and −0.912 to −0.718, respectively. These correlations represent two dependent measurements in the same people; the original composite was not equivalent to direct measurement of tissue PO₂ or independently validated cellular oxygen flux. In Han et al., 2026 [22], among 49 non-edematous eyes contributing to the reported OCTA comparison, lower EI@3 Pa was associated with lower deep-capillary-plexus vessel density (39.50 ± 4.89% versus 46.45 ± 4.02%), a reconstructed between-stratum difference of −6.95 percentage points (−14.96% relative to the high-EI group). The deep plexus foveal avascular zone was greater in the low-EI group (0.62 ± 0.27 versus 0.51 ± 0.21 mm²; +0.11 mm²). The article reported an EI–DCP vessel density correlation of r = 0.3893 (P = 0.007), while the peripheral ischemic index was negatively associated with EI (r = −0.206; P = 0.035); additionally, the low-EI group had an ischemic index of 0.242 ± 0.203 versus 0.144 ± 0.213 in the high-EI group (difference +0.098). Neither standard errors nor Fisher CIs were reconstructed for these imaging correlations because the eye-level and person-level dependency could not be resolved from aggregate reports. The clinical retinopathy association in Moon et al., 2016 [20] was distinct from a direct measure of oxygen delivery: after adjustment for age, sex, hypertension, smoking, diabetes duration, HbA1c, glomerular filtration rate and triglycerides, the lowest versus highest EI@3 Pa quartile had an odds ratio for prevalent retinopathy of 2.81 (95% CI, 1.21–6.49). This is a cross-sectional prevalence association, not a prospective risk ratio.
Tan et al., 2020 [21] reported an ordinal group difference in extensional EI across no retinopathy, nonproliferative retinopathy and proliferative retinopathy (overall P = 0.018), without allowing a common-scale pooled effect with shear-gradient ektacytometry. Together, the available studies exhibited concordant directional associations between poorer erythrocyte mechanics and retinal vascular abnormalities, but their outcomes differed across blood-flow velocity, derived transport efficiency, imaging vessel density, peripheral nonperfusion, and clinical retinopathy. The evidence therefore did not support collapsing these estimands into a single pooled microvascular oxygen-delivery coefficient.
Table 9.
Human mechanical–microvascular or clinical associations retained as separate estimands.
| Source / endpoint | Reported relationship | Independently derived or retained result | Inference boundary |
|---|---|---|---|
| Chung et al., 1993 [19]; rigidity–TE | r = −0.80 (225 s⁻¹); −0.84 (450 s⁻¹), pooled N = 41 | Fisher approximate 95% CIs: (−0.889, −0.653); (−0.912, −0.718) | Two dependent correlations; TE calculated, not tissue PO₂ |
| Han et al., 2026 [22]; DCP vessel density | Low vs high EI: 39.50 ± 4.89 vs 46.45 ± 4.02%; r = +0.3893, P = 0.007 | −6.95 percentage points (−14.96%); published r retained | 49 eyes for comparison; clustered eye measurements |
| Han et al., 2026 [22]; DCP FAZ | Low vs high EI: 0.62 ± 0.27 vs 0.51 ± 0.21 mm² | +0.11 mm² | No independent patient-level CI |
| Han et al., 2026 [22]; peripheral ischemia | r = −0.206, P = 0.035; ischemic index low vs high EI: 0.242 vs 0.144 | Difference = +0.098 | Eye/person correlation not resolved |
| Moon et al., 2016 [20]; prevalent retinopathy | Adjusted OR = 2.81 (95% CI 1.21–6.49) | Retained adjusted prevalence OR | Not an incidence estimate |
| Tan et al., 2020 [21]; DR severity | Extensional EI across control/no-DR/NPDR/PDR; omnibus P = 0.018 | Directional severity association | Different instrument and incomplete EI subset |
| Cahn et al., 2016 [23]; foot ulcer | ER lower in diabetic foot ulcers | 4.09% decrease in ER; g 0.780 | Different disease, modest sample and confounding |
Microvascular endpoints are not automatically interchangeable or direct measurements of tissue oxygenation. Unadjusted group-value reconstructions are not substitutes for the primary articles’ multivariable models.
3.4. Conditional Capillary Transport–Unloading Crossover: Scenarios and Sensitivity
Using empirically reported P₅₀ tertile means of 26.7 and 28.3 mmHg from the mixed-diabetes subgroup of Ebenuwa et al., 2024 [17,24], we evaluated Equations (7)–(10) using a fixed-pressure Hill oxygen saturation model with an assumed Hill coefficient of n = 2.7, inlet PO₂ = 100 mmHg and outlet PO₂ = 40 mmHg. The calculated saturation differences were Uref = 0.2238495 and Ualt = 0.2500246, an 11.693% increase in the idealized potential unloading difference for the higher-P₅₀ condition. These values are dimensionless saturation fractions; they are not measured oxygen extraction fractions in vivo.
From Equation (10), the corresponding crossover was φcritical = 0.8953099, equivalent to a 10.469% reduction in hypothetical effective erythrocyte flux relative to the reference scenario. Thus, under the fixed assumptions, a modeled flux loss greater than 10.469% would eliminate the normalized unloading advantage attributable to the higher P₅₀. The calculation does not imply that participants in the source cohort experienced this flux reduction: neither capillary cell flux nor an EI-to-flux transfer function was available. At unchanged flux (φ = 1.00), the normalized proxy for P₅₀ = 28.3 mmHg was 111.693% of reference; at φ = 0.90 it fell to 100.524%, and at φ = 0.80 to 89.355% (Table 10). In the opposite illustrative direction, reducing P₅₀ to 26.2 mmHg produced an unloading proxy of 96.359% at φ = 1.00 and 86.723% at φ = 0.90, showing how the same multiplicative model represents concurrent reduced unloading potential and reduced effective flux. The 26.2-mmHg value is used here solely as a prespecified sensitivity scenario, not as a newly recruited or independently validated patient group. Across the 36 prespecified combinations of inlet PO₂ (80, 90, 100 mmHg), outlet PO₂ (20, 30, 40, 50 mmHg), and n (2.5, 2.7, 3.0), while fixing P₅₀ at 26.7 and 28.3 mmHg, the positive crossover flux-loss boundary ranged from 3.521% (80/20 mmHg, n = 2.5) to 13.596% (100/50 mmHg, n = 3.0). These extrema are conditional on the finite explored grid, not clinical reference limits or uncertainty intervals. When the alternative P₅₀ falls below 26.7 mmHg, its U can be smaller than Uref and φcritical exceeds unity; in that case, no positive flux-loss allowance exists and matching the reference requires a relative increase rather than a decrease in erythrocyte flux. The baseline transport–unloading crossover and the variation in its critical flux-loss threshold across the 36 prespecified pressure–cooperativity scenarios are illustrated in Figure 1.
3.5. Mathematical Behavior of the CBC-Derived eRMI₀ Candidate
The prespecified CBC-only candidate defined by Equation (11) was evaluated using published group-mean CBC data from Ebenuwa et al., 2024 [17] and Tan et al., 2020 [21]. Under the standard volume-CV identity RDW-CV ≈ 100 × SD(VRBC) / MCV, substitution yields eRMI₀ ≈ 100 × SD(VRBC) × MCHC / MCV². The candidate therefore contains explicit MCV dependence and an additional inverse MCV factor through RDW-CV; this mathematical feature is not evidence that MCV should physiologically receive a squared weight.
Using Ebenuwa cohort means (RDW 12.98 vs 13.40%, MCV 86.2 vs 87.9 fL, MCHC 33.1 vs 33.2 g/dL), the aggregate plug-in index (Equation (11)) equaled 4.9842 in diabetes versus 5.0612 in controls, 1.52% lower in the group with worse measured SS₁/₂. This sign conflicts with the a priori proposal that a larger eRMI₀ denotes greater mechanical impairment. The diabetes cohort included type 1 disease, so the discrepancy is not a T2DM-specific validation result.
Using Tan group means (RDW 14.55 vs 13.72%, MCV 86.3 vs 86.46 fL, MCHC 32.95 vs 33.38 g/dL), the plug-in value was 5.5553 in diabetes versus 5.2969 in controls, 4.88% higher, in a direction compatible with poorer extensional EI. However, these CBC statistics represent all 118 enrolled participants, whereas extensional EI was measured in 93; the index and the mechanical endpoint therefore cannot be assumed paired for the same persons. Neither calculation equals the mean of the nonlinear index across individuals, E(RDW × MCHC / MCV).
Table 11.
Published CBC input means and newly calculated aggregate eRMI₀ contrasts.
| Study / group | RDW (%) | MCV (fL) | MCHC (g/dL) | Group plug-in eRMI₀ | Relation to mechanics |
|---|---|---|---|---|---|
| Ebenuwa et al., 2024 [17]; diabetes | 12.98 | 86.2 | 33.1 | 4.9842 | Worse SS₁/₂ despite lower score |
| Ebenuwa et al., 2024 [17]; controls | 13.40 | 87.9 | 33.2 | 5.0612 | Comparator |
| Tan et al., 2020 [21]; diabetes | 14.55 | 86.3 | 32.95 | 5.5553 | Lower cross-slot EI; CBC and EI Ns differ |
| Tan et al., 2020 [21]; controls | 13.72 | 86.46 | 33.38 | 5.2969 | Comparator |
These are ratios of independently reported group means; they are not individual-index means, associations, sensitivity/specificity, AUROCs or clinical validation. The proposed numerical score has scale-dependent units unless its inputs are standardized.
3.6. Comparator Indices and Falsification of CBC-Only Mechanical Surrogacy
Using the identical group reports, RDW alone moved in the same direction as eRMI₀ across cohorts: 12.98 versus 13.40% in Ebenuwa (3.13% lower in diabetes) and 14.55 versus 13.72% in Tan (6.05% higher in diabetes). Thus, the compound candidate did not demonstrably rescue the inconsistency of its simplest component at the aggregate level. MCV was lower in diabetes in both cohorts (−1.93% in Ebenuwa and −0.19% in Tan), whereas MCHC was modestly lower in both (−0.30% and −1.29%). No a priori scalar weighting of these variables was supported by these four group-level input vectors alone.
The available participant-level correlations published by Tan et al., 2020 [21] provided a direct negative benchmark: among 93 subjects with cross-slot EI, RDW correlated weakly with EI (Pearson r = −0.0965, P = 0.496; independently reconstructed approximate Fisher 95% CI, −0.294 to +0.109). Associations for MCV (r = −0.0054, P = 0.969) and MCHC (r = +0.1217, P = 0.390) were also nonsignificant. By contrast, urea (r = −0.4099, P = 0.003) and absolute reticulocyte count (r = −0.3431, P = 0.026) showed stronger univariate associations; the latter two are exploratory correlates, not grounds to retrofit a new diagnostic formula. These observations directly limit the assumption that traditional CBC indices universally encode the mechanically relevant phenotype.
Patel et al., 2013 [27] reported adjusted coefficients for standardized EI in a separate community sample (N = 293): MCV coefficient +0.104, MCHC −0.228, and an RDW spline above 14% coefficient −0.242, with model-adjusted R² = 0.37. This study supports evaluating nonlinear CBC-mechanics relationships, but its multivariable coefficients cannot be inserted into the current candidate without reproducing the original coding and covariate context.
No individual-level model fit, discrimination (AUROC), calibration, diagnostic cutoff or clinical prediction equation was estimable from the extracted aggregates. Accordingly, the candidate remains an unvalidated arithmetic construct rather than a usable biomarker.
3.7. Sensitivity, Source-Data Anomalies, and Inferential Boundaries
The numerical checks identified two source-level discrepancies that materially affected evidentiary certainty (Table 12). First, Cahn et al., 2016 [23] reported P = 0.036 for the mean ER contrast, P = 0.039 for the minimally deformable fraction, and P = 0.046 for the highly deformable fraction. Independent conventional two-sided equal-variance t tests reconstructed from the printed n = 11 per group, means and SDs produced approximate P = 0.0717, 0.0784 and 0.0884, respectively. The source states that an unpaired t test was used; the published exact test implementation or unrounded inputs cannot be recovered from group summaries. This discrepancy is reported for audit, not resolved by assuming a one-sided test or labeling the original findings erroneous. Second, the Han et al., 2026 [22] severity table gives EI@3 Pa means 31.13, 28.79 and 26.77%, Ns 14, 28 and 37, and a published proliferative-stage SD of 0.18 despite reporting an overall SD of 2.41% and a one-way ANOVA P = 0.010. Direct aggregation of the printed stage SDs reconstructs an overall SD of approximately 2.079% and an ANOVA F(2,76) ≈ 59.20 (P ≈ 3.2 × 10⁻¹⁶), incompatible with the published combination under a conventional one-way ANOVA. Replacing the PDR SD by a hypothetical 1.8 (NOT an observed or accepted correction) reconstructs the overall SD near 2.409% but still gives an ANOVA P far smaller than 0.010.
No corrected SD, effect size or participant-level inference was imputed; the discrepancy instead identifies a necessary author/supplement audit before quantitative use. Across the remaining evidence, three inferential limitations were non-negotiable. First, mixed diabetes in Ebenuwa precludes a T2DM-only mechanical estimate without stratified results. Second, eye-based image observations in Han cannot be treated as independent erythrocyte measurements without patient-level clustering. Third, Sosa et al., 2014 [26] demonstrated that mechanical assays may not predict perfusion of artificial capillary networks; consequently there is no identified function φ = f(EI) or φ = f(SS₁/₂) for transforming our CTUC mathematical boundary into an empirical patient flow estimate. Separately, Lücker et al., 2017 [6] demonstrated that tissue PO₂ may vary at the same RBC flux as capillary hematocrit and oxygen-diffusion resistance change. The CTUC ranges must therefore remain conditional on model structure, rather than interpreted as established physiological reserve boundaries or evidence of diabetic tissue hypoxia.
Audit values are based on the published rounded group summaries and the declared statistical formulas; they do not replace source authors’ analyses or claim access to participant records. Direct author clarification and complete screening may modify the final evidentiary dataset.
4. Discussion
The present quantitative reanalysis advances a cell-centered interpretation of diabetic microvascular dysfunction by examining the interaction between erythrocyte mechanics, hemoglobin oxygen-unloading potential, and the effective passage of oxygen-carrying cells through the capillary network. Its principal contribution is not the identification of a uniform mechanical lesion in type 2 diabetes mellitus (T2DM), but the reconstruction of measurable mechanical abnormalities, their association with microvascular pathology, and the conditional quantitative boundary at which a theoretical oxygen-unloading advantage can be counterbalanced by reduced cellular transport.
The mixed-diabetes comparison reported by Ebenuwa et al. yielded a 17.27% increase in the shear stress required for half-maximal elongation, with a reconstructed Hedges’ g of 0.635 (approximate 95% CI, 0.316–0.953) [17]. In contrast, the foot-ulcer comparison of Cahn et al. produced a standardized elongation-ratio impairment of g = 0.780, but its wide interval (−0.090 to 1.650) reflected the limited precision of two 11-person groups [23]. These measurements represent different cell-mechanical constructs and cannot be combined into a single diabetes-specific stiffness estimate. Rather, they show that mechanical dysfunction can be quantified within defined assays while its magnitude and generalizability remain dependent on population, disease context, and measurement method (Table 8).
The clinical relevance of these findings is strengthened by their correspondence with retinal microvascular abnormalities, although the endpoints are not equivalent to direct tissue oxygenation. Moon et al. associated lower erythrocyte elongation with prevalent retinopathy, with adjusted odds of 2.81 (95% CI, 1.21–6.49) for the lowest relative to the highest deformability quartile [20], whereas Tan et al. observed worsening extensional deformation across retinopathy severity categories using a distinct microfluidic assay [21]. Han et al. connected the mechanical phenotype to objective imaging measures: lower-deformability strata exhibited 6.95 percentage points less deep-capillary-plexus vessel density, a larger deep foveal avascular zone (0.62 versus 0.51 mm²), and a higher peripheral ischemic index (0.242 versus 0.144) [22]. Earlier correlations between erythrocyte rigidity and calculated retinal oxygen-transport efficiency were also strongly negative (r = −0.80 and −0.84), although that derived efficiency measure cannot be equated with measured tissue PO₂ [19]. Together, these observations support an association between abnormal erythrocyte mechanics and microvascular disease severity (Table 9), but do not distinguish whether cellular stiffness precedes vascular injury, follows metabolic or inflammatory damage, or acts as an amplifier of established disease.
A coherent transport explanation is that altered deformability and hydration can change resistance to capillary entry, transit through narrow segments, partitioning at bifurcations, and local capillary hematocrit. Anatomically reconstructed retinal simulations showing local hematocrit redistribution of approximately ±40% and RBC velocity changes of −30% to +40% demonstrate the plausibility of this spatially heterogeneous response [8]. Those simulations are mechanistic evidence, not patient-level estimates of flow impairment or proof of hypoxia. At the molecular level, the mechanical phenotype is more plausibly understood as the variable net product of glycation, oxidative injury, membrane–cytoskeletal integrity, and ionic volume control than as the consequence of a single lesion.
Glycation and oxidative modification of β-spectrin, ankyrin, and protein 4.2 provide an experimentally grounded route by which chronic hyperglycemia may weaken membrane–skeleton organization, disturb cell shape recovery, and modify deformation under shear [14]. These effects intersect with cytoplasmic viscosity, hemoglobin concentration, surface-area-to-volume ratio, and erythrocyte age, which can independently modify assay performance [9,10,11,12,17]. A second, partially separable pathway couples mechanical stimulation to PIEZO1-mediated Ca²⁺ entry, Gardos/KCa3.1 activation, KCl and water loss, and potentially altered cellular hydration [15]. Sustained Ca²⁺ loading could also favor calpain activation, phospholipid scrambling, and eryptotic susceptibility under appropriate conditions, but these downstream outcomes were not measured in the source cohorts and cannot be assigned as established mediators of the reported mechanical contrasts. Importantly, Kuck et al. observed higher intracellular Ca²⁺ and altered insulin-associated Ca²⁺ responses in a diabetes-like murine model despite preserved mean deformability and increased single-cell mechanical dispersion [16]. Oxidant exposure has likewise been shown to inhibit rather than uniformly sensitize PIEZO1 activation [31], while maximal Ca²⁺ extrusion by the plasma-membrane Ca²⁺-ATPase was preserved in the intact diabetic erythrocytes and high-glucose conditions studied by Raftos et al. [32]. Thus, neither obligatory PIEZO1 hyperactivation nor universal PMCA failure is justified as a starting assumption. Glycation-associated membrane injury and redox-sensitive Ca²⁺ handling should instead be treated as competing or cooperating mechanisms whose sequence, magnitude, and net mechanical expression require direct testing. The vascular consequences could extend beyond cell passage itself: erythrocytes isolated from patients with T2DM have experimentally impaired endothelium-dependent vasodilation through arginase I-associated reactive oxygen signaling [33].
This establishes a plausible erythrocyte–endothelial feedback component, without demonstrating that membrane deformation caused the endothelial effect in the present datasets. The relationship between cellular transport and hemoglobin oxygen affinity exposes the principal physiological question addressed by our model.
Within the mixed-diabetes cohort of Ebenuwa et al., poorer deformability was associated with a higher P₅₀ (SS₁/₂–P₅₀ r = 0.35; P = 0.008), with mean values of 28.3 and 26.7 mmHg across the mechanically least and most deformable strata [17,24]. A higher P₅₀ can favor oxygen dissociation within a specified oxygen-pressure interval, yet the theoretical amount released per perfusing erythrocyte is not the same as the effective delivery of oxygen-bearing cells to exchange vessels. The capillary transport–unloading crossover (CTUC) formulation makes this distinction explicit through a normalized product of a Hill-derived saturation difference and a separately specified relative erythrocyte flux.
For the illustrative P₅₀ contrast of 26.7 versus 28.3 mmHg, an assumed inlet PO₂ of 100 mmHg, outlet PO₂ of 40 mmHg, and Hill coefficient of 2.7, modeled fractional unloading rose from 0.22385 to 0.25002, an 11.69% relative advantage. That advantage disappears algebraically if effective RBC flux falls to approximately 89.53% of its reference value: a hypothetical 10.47% reduction under these fixed conditions. Across the 36 prespecified pressure–cooperativity scenarios, the cancellation boundary varied from approximately 3.52% to 13.60% (Table 10). These are sensitivity calculations, not measured patient flows, clinically validated thresholds, or probabilities of tissue hypoxia. In particular, no source establishes a transferable function converting elongation index or SS₁/₂ into capillary flux. The difficulty of predicting artificial-network perfusion from conventional deformability assays [26], together with the dependence of tissue PO₂ on capillary hematocrit and diffusion resistance even at equal RBC flux [6], prevents such an inference. The conditional crossover is therefore a transparent mass-balance proxy and a testable design constraint, not a new oxygen-transport law. A complementary lower-P₅₀ scenario illustrates the possibility of concordant disadvantages: when an independently reported P₅₀ of 26.2 mmHg is used solely as a model input [30], the proxy falls to approximately 86.72% of reference at an assumed flux ratio of 0.90. Because the affinity and mechanical inputs were obtained from separate sources, this is a counterfactual scenario, not a reconstructed individual or cohort phenotype.
The broader pathophysiological hypothesis emerging from these analyses is that chronic glycemic stress may act on three physiologically distinct but interacting erythrocyte domains: hemoglobin oxygen-binding regulation, metabolic–redox adaptation, and membrane–cytoskeletal mechanics. Glycation-associated changes in hemoglobin allostery can influence oxygen-release potential; modification of bisphosphoglycerate mutase (BPGM), including glycation at Lys158, provides a route through which chronic glycemia could affect the regulatory machinery of 2,3-bisphosphoglycerate (2,3-BPG) [34]; and structural membrane injury or disordered hydration could restrict cellular deformation and passage. Because BPGM participates in both formation and degradation of 2,3-BPG, its modification does not establish the direction of the steady-state metabolite concentration.
Moreover, 2,3-BPG has direct effects on membrane-associated protein interactions involving Band 3, ankyrin, and protein 4.1 [35], while oxygenation-dependent hemoglobin binding to Band 3 can reorganize erythrocyte metabolic activity [36]. These experimentally demonstrated connections provide mechanistic plausibility for coupling between allostery, metabolic allocation, and cell mechanics, but do not demonstrate simultaneous failure of all three processes in T2DM.
Indeed, human erythrocyte metabolomics revealed a positive association of HbA1c with 2,3-BPG (Spearman ρ = 0.4919; P = 0.0003) alongside an inverse association with reduced glutathione (ρ = −0.5944; P < 0.0001), indicating that glycemic exposure can coexist with divergent metabolic and redox responses [37]. Consequently, glycation should not be assumed to produce a uniform fall in P₅₀, a universal depletion of 2,3-BPG, or an inevitable decline in mean deformability. Rather, the present analysis motivates a conditional glycation-associated erythrocyte transport–unloading mismatch: intrinsic oxygen-release potential and the effective transit of oxygen-carrying cells may respond differently to chronic metabolic injury and, under particular combinations of changes, become functionally discordant. This interpretation broadens the physiological questions surrounding glycohypoxia without redefining it as generic erythrocyte stiffness or impaired perfusion. Glycohypoxia remains a proposed functional disturbance of oxygen unloading in the setting of glycation-associated affinity changes; mechanical transport constraints are a potentially interacting downstream determinant of its tissue significance, not evidence that the original unloading disturbance has occurred. A reduction in both unloading and effective transit would be expected to compound the modeled impairment, whereas an increase in unloading potential could be offset by sufficiently impaired transit. Neither configuration establishes actual tissue oxygen deficiency in the absence of paired microvascular and oxygenation measurements.
The translational CBC analysis provides a necessary counterweight to this mechanistic synthesis. Although RDW, MCV, and MCHC were associated with deformability in the multivariable adult cohort studied by Patel et al. [27], the exploratory eRMI₀ candidate—RDW-CV multiplied by MCHC and divided by MCV—was not directionally consistent across the available group-level summaries. Its plug-in value was 1.52% lower in the diabetes group showing worse shear-gradient mechanics in Ebenuwa et al. [17], but 4.88% higher in the diabetes group studied by Tan et al. [21] (Table 11). The latter comparison also involved different CBC and mechanical-testing denominators, precluding a matched individual-level interpretation. Tan et al. reported a weak, nonsignificant association between RDW and extensional deformability (r = −0.0965; P = 0.496) [21]. In addition, RDW-CV already incorporates an inverse dependence on MCV, so the composite score imposes a second inverse volume factor without demonstrated mechanistic justification.
The available evidence therefore neither validates eRMI₀ nor establishes that its numerical ordering corresponds to a latent mechanical phenotype across assay platforms. This negative directional result is scientifically informative: a useful surrogate must demonstrate measurement validity and added value over its individual CBC components in matched patient-level data, rather than acquire apparent predictive performance through reweighting a small number of published group means. No sensitivity, specificity, calibration, or area under the receiver-operating-characteristic curve can be inferred from the present aggregates. Several limitations define the inferential boundary of the study. The evidence base remains a targeted, audited set of published reports rather than the product of a completed exhaustive systematic search, and many clinical estimates are cross-sectional or derive from mixed type 1/type 2 diabetes populations. Assay geometry, stress regime, disease definitions, anemia, renal impairment, inflammation, erythrocyte age, and glycemic treatment may contribute to apparently discordant results. Selected source summaries also require clarification: conventional tests reconstructed from rounded values in Cahn et al. did not reproduce all reported P values [23], while the published severity dispersion and ANOVA summaries in Han et al. were not mutually reproducible under a straightforward one-way model [22]. Neither discrepancy justifies silently correcting the original data; both support withholding overly precise secondary estimates until source-level resolution (Table 12). Retinal data collected from two eyes per participant introduce further dependence, and separate aggregate studies cannot establish molecular-to-tissue causality. Most importantly, there is no available patient-level dataset simultaneously quantifying glycation burden, P₅₀, 2,3-BPG, membrane biomechanics, effective capillary erythrocyte flux, and local tissue oxygenation. Future investigations should measure these variables in the same participants or experimentally controlled microvascular systems, with oxygen-pressure boundary conditions, erythrocyte distribution, and transit times measured rather than stipulated. Orthogonal perturbation of glycation, oxidative stress, PIEZO1/Gardos signaling, and PMCA activity could distinguish mechanical causes from consequences and calibrate the relation between deformability and network flux. Such work would test whether the CTUC boundary predicts any empirically observable transport–unloading interaction and whether a residual oxygen-unloading disturbance is amplified by concurrent cellular transport constraints. Taken together, the present results support a narrower but more defensible conclusion than proof of diabetic tissue hypoxia: erythrocyte mechanical abnormalities are reproducibly measurable in selected diabetic settings, they track several microvascular endpoints, and their interaction with oxygen-affinity changes can be posed quantitatively under explicit assumptions. The resulting transport–unloading mismatch offers a falsifiable physiological extension for investigating when glycation-associated erythrocyte abnormalities may become consequential for tissue oxygen supply.
5. Conclusion
This study places erythrocyte mechanics alongside hemoglobin oxygen affinity as a potentially important, yet independently variable, determinant of microvascular oxygen supply in diabetes. Reconstructed human data indicate measurable mechanical impairment and associations with retinal vascular abnormalities, but do not establish that reduced deformability causes impaired capillary oxygenation. The CTUC model demonstrates that a theoretical unloading advantage can be offset by a sufficiently large reduction in effective erythrocyte flux; its 10.47% illustrative crossover is parameter-dependent and cannot be interpreted as a patient-derived threshold. At the molecular level, glycation-sensitive hemoglobin regulation, spectrin–ankyrin–Band 3 integrity, oxidative stress, and PIEZO1–Ca²⁺–Gardos-mediated hydration may constitute interacting pathways rather than a single obligatory cascade. The inconsistent behavior of eRMI₀ precludes its current use as a clinical mechanical biomarker. Simultaneous measurements of oxygen affinity, deformability, capillary cell flux, and tissue oxygenation are essential to test whether a transport–unloading mismatch amplifies susceptibility to glycohypoxia.
Authors’ Contributions:
Maher Monir Akl: Conception and design, data collection, analysis, and interpretation; writing and critical revision. Amr Ahmed: Supervision. No statistical expertise, funding, administrative, technical, or material support was received.
Funding information:
The authors received no financial support for the research and publication of this article.
Data Availability Statement
The datasets analyzed for this study are available from the corresponding author upon reasonable request.
Declaration: of AI and AI-assisted Technologies in the Writing Process
The authors declare that no generative artificial intelligence (AI) or AI-assisted technologies were used in the preparation of this manuscript.
Competing Interest Declaration
The authors declare that there are no conflicts of interest.
References
- Munoz, C. J.; Lucas, A.; Williams, A. T.; Cabrales, P. A Review on Microvascular Hemodynamics: The Control of Blood Flow Distribution and Tissue Oxygenation. Crit. Care Clin. 2020, 36(2), 293–305. [Google Scholar] [CrossRef]
- Roy, T. K.; Secomb, T. W. Functional implications of microvascular heterogeneity for oxygen uptake and utilization. Physiol. Rep. 2022, 10(10), e15303. [Google Scholar] [CrossRef]
- Tomaiuolo, G. Biomechanical properties of red blood cells in health and disease towards microfluidics. Biomicrofluidics 2014, 8(5), 051501. [Google Scholar] [CrossRef]
- Zhang, J. Convection Effect of Plasma Flow on Oxygen Transport in Capillaries: An In-Depth Numerical Investigation. In Microcirculation; New York, N.Y., 2025; Volume 32, 3, p. e70011. [Google Scholar] [CrossRef]
- Tsai, A. G.; Intaglietta, M. Local tissue oxygenation during constant red blood cell flux: a discrete source analysis of velocity and hematocrit changes. Microvasc. Res. 1989, 37(3), 308–322. [Google Scholar] [CrossRef]
- Lücker, A.; Secomb, T.W.; Weber, B.; Jenny, P. The relative influence of hematocrit and red blood cell velocity on oxygen transport from capillaries to tissue. Microcirculation 2017, 24, e12337. [Google Scholar] [CrossRef]
- Cabrales, P. Effects of erythrocyte flexibility on microvascular perfusion and oxygenation during acute anemia. Am. J. Physiol. Heart Circ. Physiol. 2007, 293, H1206–H1215. [Google Scholar] [CrossRef]
- LeCompte, S.; Pangilinan, P.; Ding, Y.; Bedggood, P.; Metha, A.; Bagchi, P. Diabetes-mediated changes in red blood cell biomechanics reorganize capillary network hemodynamics through altered cellular trafficking. In Biophysical Journal; Advance online publication; 2026. [Google Scholar] [CrossRef]
- Bennett, V. The molecular basis for membrane - cytoskeleton association in human erythrocytes. J. Cell. Biochem. 1982, 18(1), 49–65. [Google Scholar] [CrossRef]
- Pajic-Lijakovic, I.; Milivojevic, M.; Barshtein, G.; Gural, A. The Mechanical Properties of Erythrocytes Are Influenced by the Conformational State of Albumin. Cells 2025, 14(15), 1139. [Google Scholar] [CrossRef]
- Nigra, A. D.; Casale, C. H.; Santander, V. S. Human erythrocytes: cytoskeleton and its origin. Cell. Mol. Life Sci. CMLS 2020, 77(9), 1681–1694. [Google Scholar] [CrossRef]
- Vallese, F.; Kim, K.; Yen, L. Y.; Johnston, J. D.; Noble, A. J.; Calì, T.; Clarke, O. B. Architecture of the human erythrocyte ankyrin-1 complex. Nat. Struct. Mol. Biol. 2022, 29(7), 706–718. [Google Scholar] [CrossRef]
- Khalid, M.; Petroianu, G.; Adem, A. Advanced Glycation End Products and Diabetes Mellitus: Mechanisms and Perspectives. Biomolecules 2022, 12(4), 542. [Google Scholar] [CrossRef]
- Schwartz, Robert S; Madsen, John W; Rybicki, Anne C; Nagel, Ronald L. Oxidation of Spectrin and Deformability Defects in Diabetic Erythrocytes. Diabetes 1991, 40(6), 701–708. [Google Scholar] [CrossRef]
- Cahalan, Stuart M; Lukacs, Viktor; Ranade, Sanjeev S; Chien, Shu; Bandell, Michael; Patapoutian, Ardem. Piezo1 links mechanical forces to red blood cell volume. eLife 2015, 4, e07370. [Google Scholar] [CrossRef]
- Kuck, L.; Griffith, T.A.; McNamee, A.P.; Peart, J.N.; Wilson, J.H.; Sharma, A.; Sharma, L.A.; Robertson, K.; Du Toit, E.F.; Simmonds, M.J. Insulin facilitates entry of calcium ions into human and murine erythrocytes via Piezo1: a newly identified mechanism with implications for type 2 diabetes. FEBS J. 2025, 292, 5457–5474. [Google Scholar] [CrossRef]
- Ebenuwa, I.; Violet, P.C.; Tu, H.; et al. Altered RBC deformability in diabetes: clinical characteristics and RBC pathophysiology. Cardiovasc Diabetol. 2024, 23, 370. [Google Scholar] [CrossRef]
- Sohn, M.; Lee, J.E.; Ahn, M.; et al. Correlation of dynamic membrane fluctuations in red blood cells with diabetes mellitus and cardiovascular risks. Sci. Rep. 2021, 11, 7007. [Google Scholar] [CrossRef]
- Chung, T. W.; Liu, A. G.; Yu, J. H. Increased red cell rigidity might affect retinal capillary blood flow velocity and oxygen transport efficiency in type II diabetes. Diabetes Res. 1993, 23(2), 75–82. [Google Scholar]
- Moon, J. S.; Kim, J. H.; Kim, J. H.; Park, I. R.; Lee, J. H.; Kim, H. J.; Lee, J.; Kim, Y. K.; Yoon, J. S.; Won, K. C.; Lee, H. W. Impaired RBC deformability is associated with diabetic retinopathy in patients with type 2 diabetes. Diabetes Metab. 2016, 42(6), 448–452. [Google Scholar] [CrossRef]
- Tan, J.K.S.; Wei, X.; Wong, P.A.; Fang, J.; Kim, S.; Agrawal, R. Altered red blood cell deformability—A novel hypothesis for retinal microangiopathy in diabetic retinopathy. Microcirculation 2020, 27, e12649. [Google Scholar] [CrossRef]
- Han, Y.E.; Lim, J.S.; Kim, Y.; Kim, I.; Moon, J.S.; Lee, J. Erythrocyte deformability correlates with microvascular ischemia and disease severity in diabetic retinopathy. J. Diabetes Investig. 2026, 17, 483–491. [Google Scholar] [CrossRef]
- Cahn, A.; Livshits, L.; Srulevich, A.; Raz, I.; Yedgar, S.; Barshtein, G. Diabetic foot disease is associated with reduced erythrocyte deformability. Int. Wound J. 2016, 13(4), 500–504. [Google Scholar] [CrossRef]
- Di Santo, R.; Niccolini, B.; Rizzi, A.; Bertini, L.; Marafon, D. P.; Vaccaro, M.; Cristallo, F.; Rosa, E.; Tartaglione, L.; Leo, L.; De Spirito, M.; Ciasca, G.; Pitocco, D. Sensing Biomechanical Alterations in Red Blood Cells of Type 1 Diabetes Patients: Potential Markers for Microvascular Complications. Biosensors 2024, 14(12), 587. [Google Scholar] [CrossRef]
- Phan, C.; Rowe, E.M.; Yazdanbakhsh, M.; Kurach, J.; Brandon-Coatham, M.; Devine, D.V.; et al. Manufacturing stresses do not differentially impact red blood cells from donors with diabetes. Vox Sang. 2025, 120, 1093–1102. [Google Scholar] [CrossRef]
- Sosa, J.M.; Nielsen, N.D.; Vignes, S.M.; Chen, T.G.; Shevkoplyas, S.S. The relationship between red blood cell deformability metrics and perfusion of an artificial microvascular network. Clin. Hemorheol. Microcirc. 2014, 57(3), 275–289. [Google Scholar] [CrossRef]
- Patel, K.V.; Mohanty, J.G.; Kanapuru, B.; Hesdorffer, C.; Ershler, W.B.; Rifkind, J.M. Association of the Red Cell Distribution Width with Red Blood Cell Deformability. In Oxygen Transport to Tissue XXXIV. Advances in Experimental Medicine and Biology; Welch, W.J., Palm, F., Bruley, D.F., Harrison, D.K., Eds.; Springer: New York, NY, 2013; vol 765. [Google Scholar] [CrossRef]
- Ebenuwa, I.; Violet, P.C.; Teng, S.; et al. Altered RBC aggregability in diabetes: a threshold for pathophysiological structure-function RBC changes. Cardiovasc. Diabetol. – Endocrinol. Rep. 2025, 11, 44. [Google Scholar] [CrossRef]
- Lee, H.; Na, W.; Lee, S.B.; Ahn, C.W.; Moon, J.S.; Won, K.C.; Shin, S. Potential Diagnostic Hemorheological Indexes for Chronic Kidney Disease in Patients With Type 2 Diabetes. Front. Physiol. 2019, 10, 1062. [Google Scholar] [CrossRef]
- Akl, M.; Ahmed, A. Quantitative and preliminary clinical assessment of glycohypoxia as an oxygen-unloading defect linking chronic hyperglycemia to low-grade tissue hypoxia in type 2 diabetes: a targeted translational meta-regression with exploratory blood-sample validation. Front. Clin. Diabetes Healthc. 2026, 7, 1897413. [Google Scholar] [CrossRef]
- Novosolova, N.; Braidotti, N.; Patinen, T.; Laitinen, T.; Ciubotaru, C.; Huttunen, K. M.; Levonen, A. L.; Cojoc, D.; Giniatullin, R.; Malm, T. Oxidative modulation of Piezo1 channels. Redox Biol. 2025, 86, 103797. [Google Scholar] [CrossRef]
- Raftos, J. E.; Edgley, A.; Bookchin, R. M.; Etzion, Z.; Lew, V. L.; Tiffert, T. Normal Ca²⁺ extrusion by the Ca²⁺ pump of intact red blood cells exposed to high glucose concentrations. Am. J. Physiology–Cell Physiol. 2001, 280(6), C1449–C1454. [Google Scholar] [CrossRef]
- Zhou, Z.; et al. Erythrocytes from patients with type 2 diabetes induce endothelial dysfunction via arginase I. J. Am. Coll. Cardiol. 2018, 72(7), 769–780. [Google Scholar] [CrossRef]
- Fujita, T.; et al. Human erythrocyte bisphosphoglycerate mutase: Inactivation by glycation in vivo and in vitro. J. Biochem. 1998, 124(6), 1237–1244. [Google Scholar] [CrossRef]
- Moriyama, R.; Lombardo, C. R.; Workman, R. F.; Low, P. S. Regulation of linkages between the erythrocyte membrane and its skeleton by 2,3-diphosphoglycerate. J. Biol. Chem. 1993, 268(15), 10990–10996. Available online: https://pubmed.ncbi.nlm.nih.gov/8496163/. [CrossRef]
- Chu, H.; McKenna, M. M.; Krump, N. A.; Zheng, S.; Mendelsohn, L.; Thein, S. L.; Garrett, L. J.; Bodine, D. M.; Low, P. S. Reversible binding of hemoglobin to band 3 constitutes the molecular switch that mediates O₂ regulation of erythrocyte properties. Blood 2016, 128(23), 2708–2716. [Google Scholar] [CrossRef]
- Palomino-Schätzlein, M.; Lamas-Domingo, R.; Ciudin, A.; Gutiérrez-Carcedo, P.; Marés, R.; Aparicio-Gómez, C.; Hernández, C.; Simó, R.; Herance, J. R. A translational in vivo and in vitro metabolomic study reveals altered metabolic pathways in red blood cells of type 2 diabetes. J. Clin. Med. 2020, 9(6), 1619. [Google Scholar] [CrossRef]
Figure 1.
Conditional capillary transport–unloading crossover (CTUC) and model sensitivity. (A) Normalized transport–unloading proxy (R) under three theoretical conditions. With an assumed inlet/outlet PO₂ of 100/40 mmHg and Hill coefficient of 2.7, increasing P₅₀ from 26.7 to 28.3 mmHg increases calculated fractional oxygen unloading by 11.69% relative to reference at unchanged effective erythrocyte flux. This advantage is exactly offset at the model-derived crossover flux ratio (φcrit = 0.8953), corresponding to a hypothetical 10.47% reduction in effective erythrocyte flux. (B) Critical flux-loss thresholds calculated for 36 combinations of inlet PO₂ (80, 90, and 100 mmHg), outlet PO₂ (20, 30, 40, and 50 mmHg), and Hill coefficient (n = 2.5, 2.7, and 3.0), holding the P₅₀ contrast fixed at 26.7 versus 28.3 mmHg. Thresholds range from 3.52% to 13.60%. Connecting lines indicate grouped deterministic scenarios rather than statistical uncertainty.All plotted quantities are conditional model outputs, not observed patient-level erythrocyte flux, measured tissue oxygen delivery, confidence intervals, or clinically validated thresholds.
Figure 1.
Conditional capillary transport–unloading crossover (CTUC) and model sensitivity. (A) Normalized transport–unloading proxy (R) under three theoretical conditions. With an assumed inlet/outlet PO₂ of 100/40 mmHg and Hill coefficient of 2.7, increasing P₅₀ from 26.7 to 28.3 mmHg increases calculated fractional oxygen unloading by 11.69% relative to reference at unchanged effective erythrocyte flux. This advantage is exactly offset at the model-derived crossover flux ratio (φcrit = 0.8953), corresponding to a hypothetical 10.47% reduction in effective erythrocyte flux. (B) Critical flux-loss thresholds calculated for 36 combinations of inlet PO₂ (80, 90, and 100 mmHg), outlet PO₂ (20, 30, 40, and 50 mmHg), and Hill coefficient (n = 2.5, 2.7, and 3.0), holding the P₅₀ contrast fixed at 26.7 versus 28.3 mmHg. Thresholds range from 3.52% to 13.60%. Connecting lines indicate grouped deterministic scenarios rather than statistical uncertainty.All plotted quantities are conditional model outputs, not observed patient-level erythrocyte flux, measured tissue oxygen delivery, confidence intervals, or clinically validated thresholds.
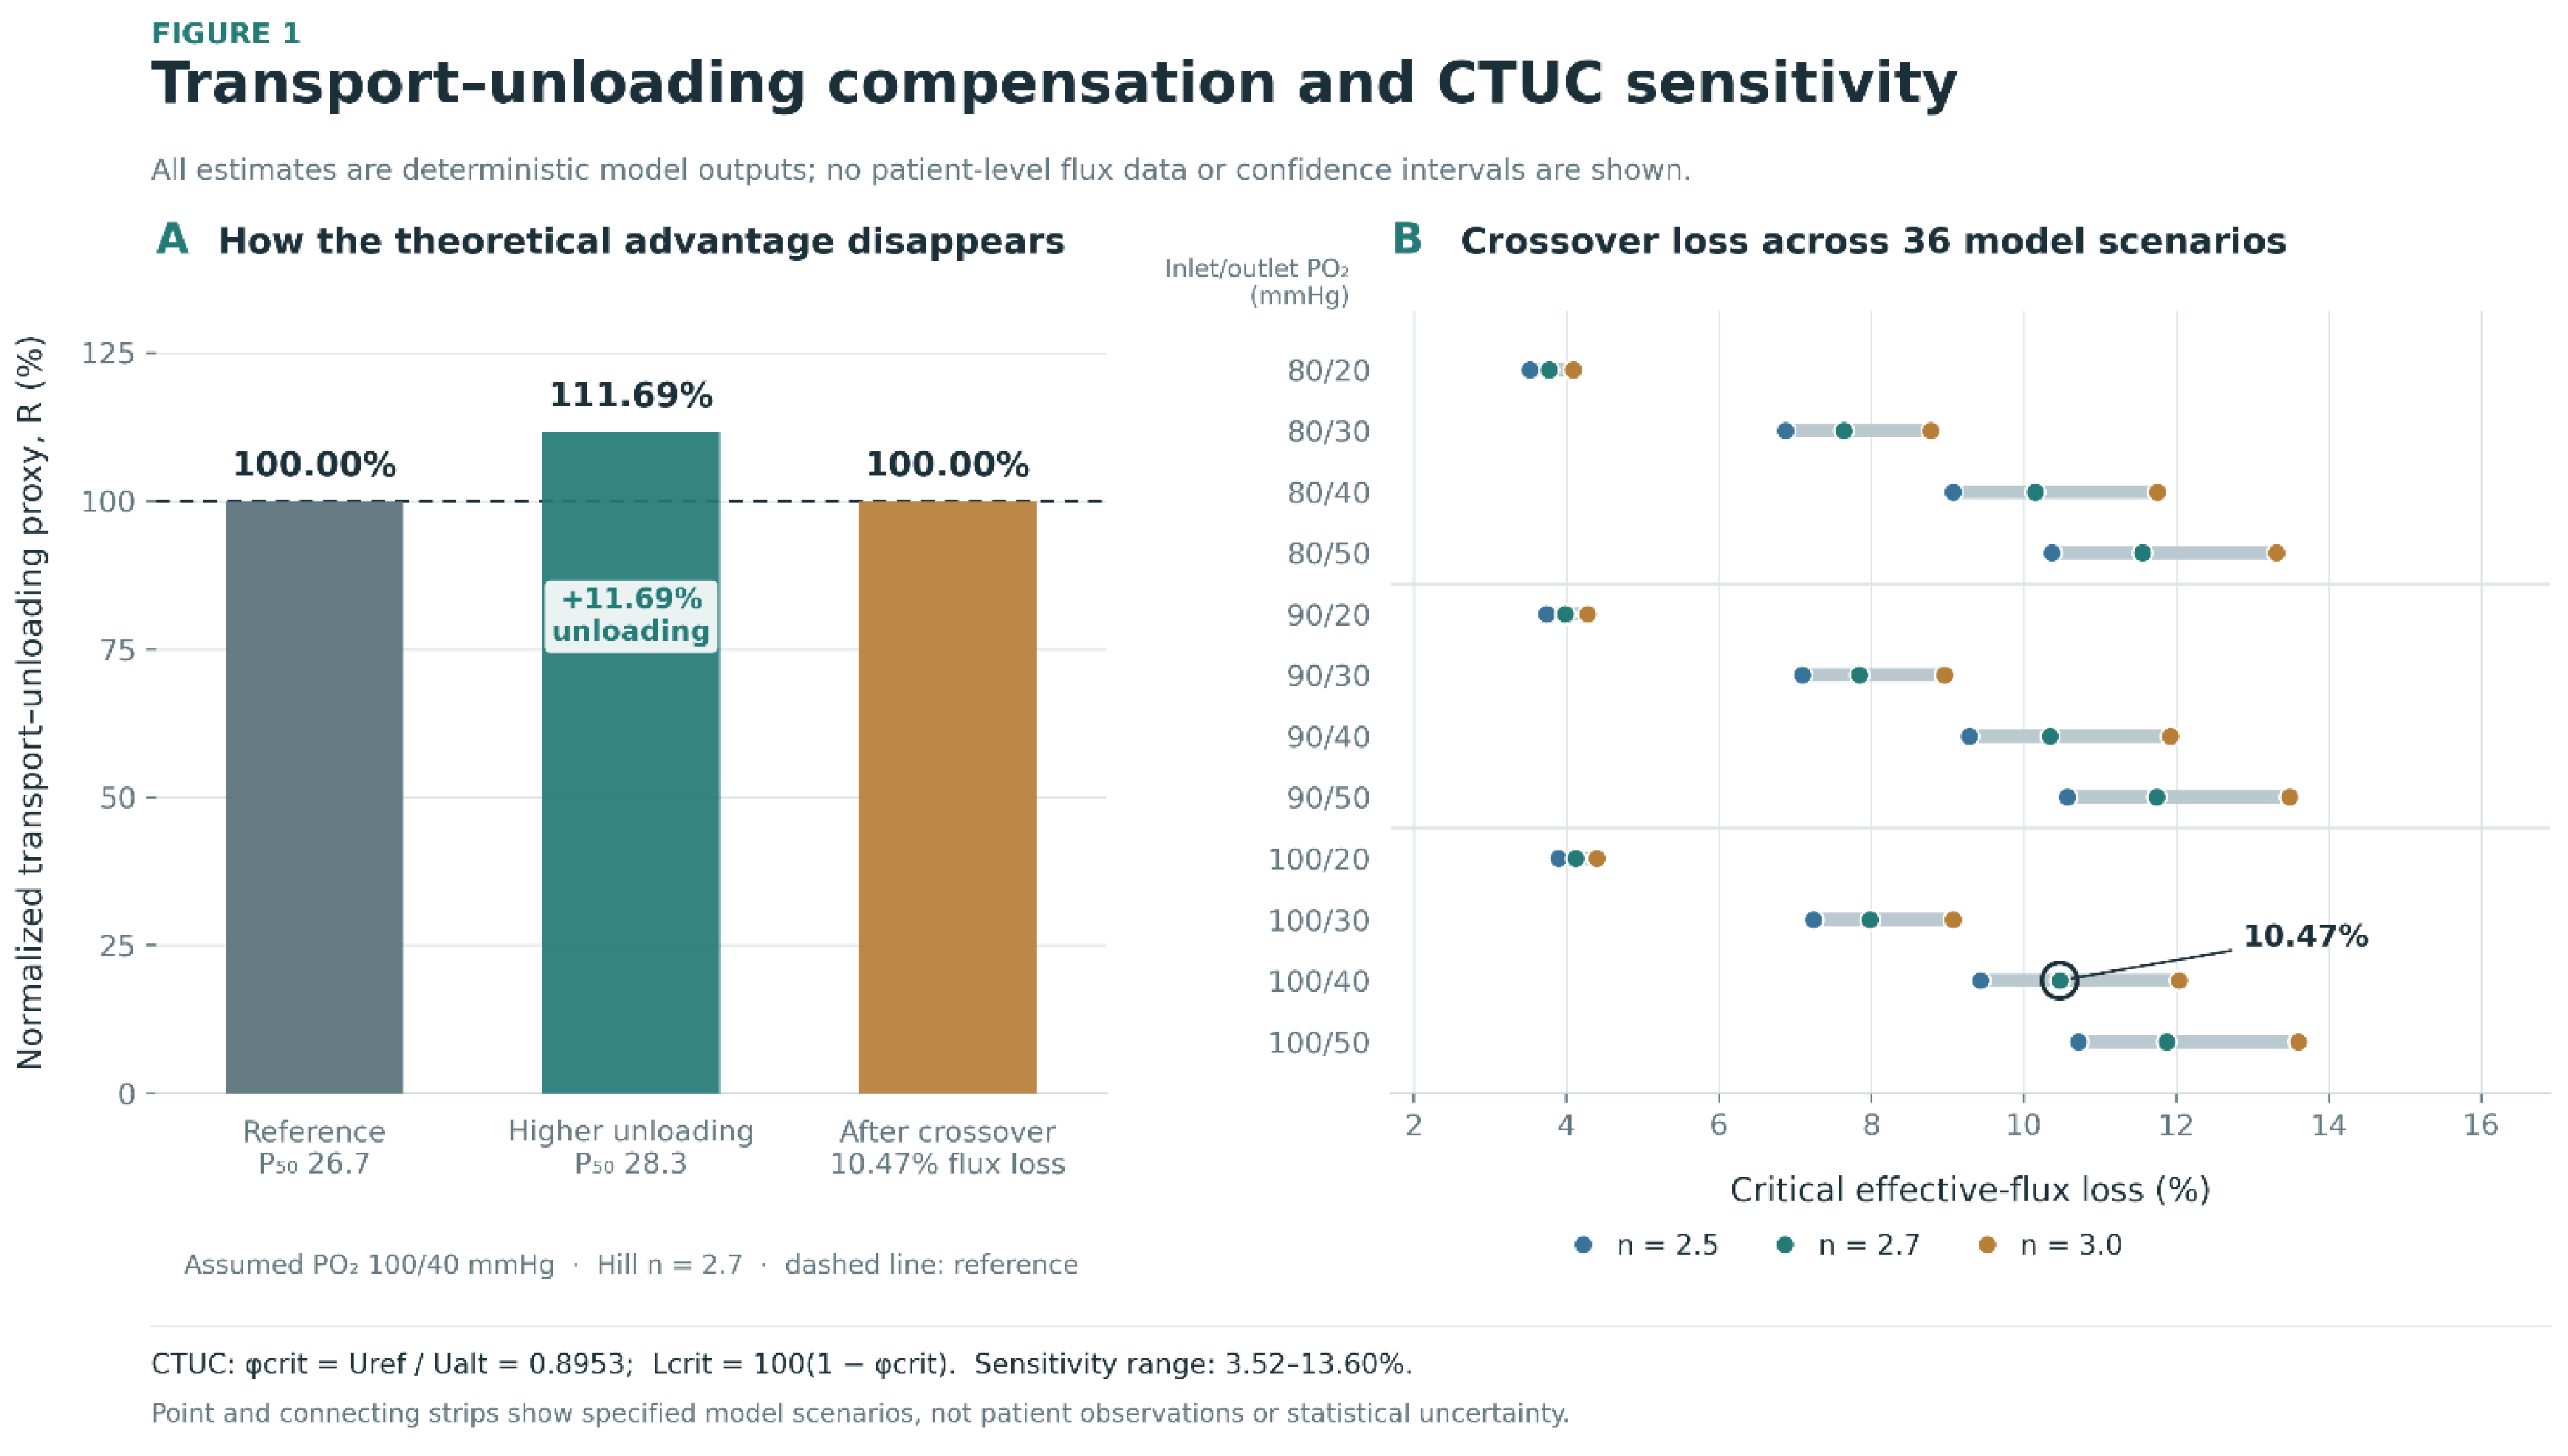
Table 1.
Source studies, analytical roles, and accessible primary outcomes.
| Study | Population / N | Accessible outcomes | Quantitative role / safeguard |
|---|---|---|---|
| Ebenuwa et al., 2024 [17] | 81 diabetes (61 T2DM; 20 T1DM); 78 controls | SS₁/₂, CBC; P₅₀ in 58 diabetes / 75 controls | Mechanical contrast; P₅₀ scenario values only. Mixed diabetes subtype. |
| Tan et al., 2020 [21] | 86 T2DM; 32 controls; 93 with EI | Cross-slot extensional EI; CBC in 118 | CBC and mechanical samples not identical; no assumed pairing. |
| Han et al., 2026 [22] | 79 people with DR; some analyses of 147 eyes | EI@3Pa, DCP VD, FAZ, ischemia | Patient/eye dependence; published PDR EI SD flagged for audit. |
| Moon et al., 2016 [20] | 373 analyzed T2DM | EI@3Pa, retinopathy, adjusted OR | Subgroup denominators needed for standardized group contrast. |
| Cahn et al., 2016 [23] | 11 diabetic foot ulcer; 11 diabetic controls | ER and RBC subfractions | Small-sample within-assay mechanical contrast. |
| Chung et al., 1993 [19] | 22 T2DM; 19 controls | Rigidity, retinal velocity, calculated O₂ efficiency | Reported efficiency definition requires source-specific interpretation. |
| Patel et al., 2013 [27] | 293 adults; not T2DM-specific | RDW/MCV/MCHC and standardized EI regression | Candidate-score rationale; no individual T2DM calibration. |
| Sosa et al., 2014 [26] | Artificial network / modified RBCs | Ektacytometry vs network perfusion | Contextual evidence against assuming EI-to-flux equivalence. |
| Lücker et al., 2017 [6] | Analytical/computational capillary study | RBC flux, hematocrit, oxygen transport | Constraints on simplified CTUC interpretation. |
| LeCompte et al., 2026 [8] | Simulated retinal capillary networks | Cell-trafficking hemodynamic variation | Simulation context, not a patient-level outcome. |
| Phan et al., 2025 [25] | 11 T2DM donors; 11 controls | P₅₀ and RBC mechanics | Contextual affinity/mechanics decoupling; no flux mapping. |
Abbreviations: T1DM, type 1 diabetes; DR, diabetic retinopathy; DCP VD, deep capillary plexus vessel density; FAZ, foveal avascular zone; EI, elongation index; ER, elongation ratio.
Table 2.
Orientation and interchangeability rules for erythrocyte mechanical measures.
| Measurement | Favorable direction | Comparable setting | Restriction |
|---|---|---|---|
| Shear EI@3Pa | Higher EI | Matched shear stress, EI formula, instrument family | Percent/fraction convertible only for an identical EI definition. |
| SS₁/₂ (Pa) | Lower SS₁/₂ | Same shear-gradient protocol and fit model | Higher stress denotes greater impairment. |
| Cross-slot EI | Higher EI | Matched extensional microfluidic protocol | No pooling of raw scale with shear EI. |
| Cell-flow ER | Higher ER | Same analyzer and ER definition | Distinct from conventional EI geometry. |
| Aggregation index | Context dependent | Aggregation-specific comparison | Not an interchangeable deformability outcome. |
| Osmotic fragility / osmoscan | Protocol dependent | Matched osmotic-gradient conditions | Separate hydration/structural phenotypes. |
| Membrane fluctuations | Context dependent | Matched imaging conditions | Nanometer displacement is not an EI unit. |
EI, elongation index; SS₁/₂, shear stress required for half-maximal elongation; ER, elongation ratio. Instrument-specific scales and shear/extensional regimes are preserved.
Table 3.
Clinical reconstruction targets and denominator safeguards.
| Evidence | Mechanical predictor | Microvascular endpoint | Unit / restriction |
|---|---|---|---|
| Chung et al., 1993 [19] | Rigidity | Retinal velocity; modeled O₂ efficiency | 22 T2DM / 19 controls; efficiency is a derived measure. |
| Moon et al., 2016 [20] | EI@3Pa | Prevalent DR; adjusted OR | 373 participants; DR subgroup N unresolved for SMD. |
| Tan et al., 2020 [21] | Cross-slot EI | DR stage | 93 mechanically evaluated; distinct extensional EI. |
| Han et al., 2026 [22] | EI@3Pa | DCP VD; FAZ; ischemic index | 79 people; nested eye-level measurements. |
| Cahn et al., 2016 [23] | Cell-flow ER | Prevalent foot ulcer | Independent groups of 11 each. |
| Lee et al., 2019 [29] | Rheology composite | Prevalent microalbuminuria | Not a CBC-only index; contextual comparison. |
Table 4.
CTUC model inputs, provenance, and sensitivity values.
| Parameter | Baseline | Sensitivity / comparison | Source and interpretation |
| P₅₀, reference | 26.7 mmHg | Fixed for the main contrast | Published within-diabetes stratum; Ebenuwa et al., 2024 [17]. |
| P₅₀, alternative | 28.3 mmHg | 26.2 mmHg higher-affinity case | 28.3 from Ebenuwa [17]; 26.2 from separate T2DM cohort [30], not paired with mechanics. |
| Inlet pressure, p_in | 100 mmHg | 80, 90, 100 mmHg | Illustrative fixed-pressure input; not measured capillary pressure. |
| Outlet pressure, p_out | 40 mmHg | 20, 30, 40, 50 mmHg | Illustrative model input; not measured tissue saturation. |
| Hill coefficient, n | 2.7 | 2.5, 2.7, 3.0 | Assumed cooperative-binding parameter. |
| Effective flux ratio, φ | 1.0 | 1.0, 0.9, 0.8 | Hypothetical relative RBC flux; not derived from EI or CBC. |
| Model outputs | R; φcrit; Lcrit | 36 combinations + lower-P₅₀ case | Conditional scenario thresholds, not clinical cutoffs. |
Table 5.
CBC candidate/comparator definitions and permissible level of inference.
| Variable / candidate | Inputs | Permissible evidence | Invalid inference |
|---|---|---|---|
| eRMI₀ | RDW-CV × MCHC / MCV | Algebraic sensitivity; available aggregate plug-in contrasts | Individual prediction, AUROC, or RBC-flux conversion. |
| RDW-CV alone | RDW-CV (%) | Group contrasts and published individual correlations | Assuming one universal linear relationship. |
| MCV alone | MCV (fL) | Group contrast; source-reported regression direction | Equating cell volume with membrane stiffness. |
| MCHC alone | MCHC (g/dL) | Group contrast; source-reported regression direction | Ignoring RBC hydration or hemoglobin differences. |
| Piecewise RDW | RDW above/below 14% | Source-reported adjusted association in Patel [27] | Transferring coefficients to T2DM without calibration. |
Table 6.
Source-specific limitations, handling rules, and implications for inference.
| Issue | Evidence-specific concern | Methodological handling |
|---|---|---|
| Mixed diabetes | Ebenuwa et al., 2024 [17]: combined T1DM and T2DM; smaller P₅₀ subset. | Label the clinical source as mixed-diabetes; do not identify the CTUC input as T2DM-only. |
| Incomplete subgroup N | Moon et al., 2016 [20]: retinopathy subgroup denominators unavailable in the accessible summary. | Retain the raw descriptive comparison; do not calculate a standardized group contrast without subgroup N. |
| Assay-denominator mismatch | Tan et al., 2020 [21]: CBC summaries for 118; mechanical EI for 93. | Do not claim that group-level CBC plug-in scores and mechanical measurements are participant-matched. |
| Eye/person dependence | Han et al., 2026 [22]: 79 people; some outcomes measured across 147 eyes. | Preserve the person as the unit of clinical inference; avoid naive eye-independent confidence intervals. |
| Questionable dispersion | Han et al., 2026 [22]: reported PDR EI SD of 0.18 requires verification. | Do not use the flagged value for a precision-weighted standardized effect without source confirmation. |
| Overlapping clinical cohort | Ebenuwa et al., 2024 [17] and Ebenuwa et al., 2025 [28] may describe overlapping NIH participants. | Do not count the reports as independent clinical replication. |
| RBC flux unobserved | Direct EI/SS₁/₂ values do not quantify effective in-vivo φ; Sosa et al., 2014 [26]. | Restrict CTUC conclusions to conditional mathematical scenarios rather than clinical hypoxia estimates. |
| Uncalibrated CBC score | No matched participant-level joint CBC and deformability distribution was available for T2DM calibration. | Do not infer diagnostic cutoffs, AUROC, individual prediction, or prospective risk. |
| Targeted evidence base | Source identification was targeted; no complete systematic database screening and PRISMA flow were performed. | Do not describe the work as an exhaustive systematic review or formal JBI appraisal. |
Abbreviations: T1DM, type 1 diabetes; T2DM, type 2 diabetes; PDR, proliferative diabetic retinopathy; EI, elongation index; SD, standard deviation; CTUC, capillary transport–unloading crossover; CBC, complete blood count; AUROC, area under the receiver-operating-characteristic curve.
Table 7.
Audited human evidence inventory and outcome-specific unit-of-analysis restrictions.
| Source | Participants / endpoint N | Quantitative endpoint | Restriction |
|---|---|---|---|
| Ebenuwa et al., 2024 [17] | 81 diabetes (61 T2DM, 20 T1DM); 78 controls; paired P₅₀ N = 58 diabetes / 75 controls | SS₁/₂, CBC, P₅₀ | Mixed diabetes for principal mechanics contrast and P₅₀ subset |
| Tan et al., 2020 [21] | 86 T2DM; 32 controls; extensional EI N = 93 | Cross-slot EI, CBC | CBC N = 118 differs from EI N = 93 |
| Han et al., 2026 [22] | 79 T2DM patients; up to 147 eyes | EI@3 Pa; DCP VD, FAZ, ischemic index | Eyes clustered within persons; reported PDR SD inconsistent |
| Moon et al., 2016 [20] | 373 analyzed T2DM patients | EI@3 Pa, adjusted retinopathy OR | Disease-stratum Ns not available in inspected abstract |
| Cahn et al., 2016 [23] | 11 diabetic foot ulcers; 11 diabetic controls | ER and RBC deformation strata | Small cohorts; published P values require audit |
| Chung et al., 1993 [19] | 22 T2DM; 19 controls | Rigidity, retinal flow velocity, calculated transport efficiency | Two correlations share the same sample; TE formula not reconstructed |
| Patel et al., 2013 [27] | 293 adults, unselected for T2DM | CBC–EI multivariable regression | General adult population; coefficients not portable as T2DM calibration |
| Lee et al., 2019 [29] | 248 T2DM, 222 prediabetes (published study) | Existing composite with albuminuria | Comparator includes fibrinogen, ESR, direct EI; not CBC-only |
Only the initial study inventory is described; no database search denominators, flow diagram counts, or pooled sample size are implied. DCP, deep capillary plexus; FAZ, foveal avascular zone; TE, transport efficiency.
Table 10.
CTUC model outputs and prespecified physiological sensitivity scenarios (model-generated values only).
Table 10.
CTUC model outputs and prespecified physiological sensitivity scenarios (model-generated values only).
| P₅₀ (mmHg) | φ = 1.00: R (% ref) | φ = 0.90: R (% ref) | φ = 0.80: R (% ref) | Model interpretation |
|---|---|---|---|---|
| 26.2 (lower-P₅₀; higher-affinity) | 96.359 | 86.723 | 77.088 | Reduced unloading potential at equal pressures |
| 26.7 (reference) | 100.000 | 90.000 | 80.000 | Reference Hill curve |
| 28.3 (higher-P₅₀ source tertile) | 111.693 | 100.524 | 89.355 | Higher theoretical unloading; advantage lost near φ = 0.8953 |
| Sensitivity minimum, 36-grid | — | — | — | Flux-loss boundary 3.521%; pin 80 / pout 20, n 2.5 |
| Sensitivity maximum, 36-grid | — | — | — | Flux-loss boundary 13.596%; pin 100 / pout 50, n 3.0 |
R is a dimensionless normalized proxy, not observed oxygen delivery, tissue hypoxia, saturation at the venous end of a measured capillary, or a validated diagnostic threshold. Model assumptions hold hemoglobin carriage, oxygen pressures and other determinants fixed while perturbing hypothetical cell flux. Sensitivity extrema are calculated, not patient-derived confidence limits.
Table 12.
Numerical audit and prespecified barriers to quantitative inference.
| Item | Observation / reconstructed check | Analytical disposition |
|---|---|---|
| Cahn significance reproduction | Published ER P 0.036, low-ER P 0.039, high-ER P 0.046; two-sided t from rounded summaries ≈ 0.0717, 0.0784, 0.0884 | Display both; do not claim verified significance or infer testing direction |
| Han 2026 summary inconsistency | Reported PDR EI SD 0.18, overall SD 2.41, ANOVA P 0.010; printed stage data imply F(2,76) ≈ 59.20, P ≈ 3.2 × 10⁻¹⁶ | No PDR standardized effect or corrected SD; seek original clarification |
| Ebenuwa diabetes type | 61 T2DM + 20 T1DM among 81 diabetes; P₅₀ subset n 58 diabetes | Do not label mixed estimates T2DM-only |
| Tan denominator mismatch | CBC n 118; cross-slot EI n 93 | No person-level CBC–EI index calculation from full-group mean data |
| Moon complication strata | Total n 373, DR/without-DR n not verified for extracted means | No standardized g for mean EI contrast |
| Han eye clustering | 79 persons; some eye outcomes use up to 147 eyes | No naive eye-independent CIs for blood–retina associations |
| CTUC calibration | No paired EI/SS₁/₂-to-capillary φ transfer function available | Purely conditional threshold; no clinical cutoff |
| CBC index transportability | Ebenuwa eRMI₀ −1.52% and Tan +4.88%; Tan direct RDW-EI r nonsignificant | Unvalidated and inconsistent aggregate sign |
| Clinical synthesis completeness | Audited targeted seed set; comprehensive screened database search not yet finished | No fabricated PRISMA counts or pooled summary |
Disclaimer/Publisher’s Note: The statements, opinions and data contained in all publications are solely those of the individual author(s) and contributor(s) and not of MDPI and/or the editor(s). MDPI and/or the editor(s) disclaim responsibility for any injury to people or property resulting from any ideas, methods, instructions or products referred to in the content. |
© 2026 by the authors. Licensee MDPI, Basel, Switzerland. This article is an open access article distributed under the terms and conditions of the Creative Commons Attribution (CC BY) license (http://creativecommons.org/licenses/by/4.0/).
Copyright: This open access article is published under a Creative Commons CC BY 4.0 license, which permit the free download, distribution, and reuse, provided that the author and preprint are cited in any reuse.