

Submitted:
31 October 2026
Posted:
03 November 2026
You are already at the latest version
Abstract
Atrial fibrillation (AF) is a common atrial-origin arrhythmia. Left atrial image segmentation is critical for timely diagnosis and intervention. The traditional manual annotation is inefficient and inconsistent. Semi-supervised learning (SSL) has thus become a practical way to alleviate the annotation bottleneck in medical imaging. Existing SSL segmentation methods still suffer from fixed confidence thresholds, accumulated pseudo-label noise, and insufficient local perturbations. To address these challenges, this paper proposes a semi-supervised medical image segmentation method based on uncertainty-guided dynamic pseudo-label enhancement. This method dynamically adjusts the confidence threshold to better adapt to the dynamic characteristics of data distribution and feature changes. And it introduces an uncertainty-guided region mixing (UMIX) module, which uses prediction entropy to identify high uncertainty regions and achieves data enhancement through cross-sample feature replacement. UniMatch serves as the backbone, with strong and weak perturbations applied at both image and feature levels to enable more effective supervised learning and improve segmentation. The proposed method was compared against competing methods on two public datasets. Through comparative experiments with other methods on two public datasets, together with ablation studies, we validated the superior performance of the proposed method in image segmentation tasks and the effectiveness of its individual components.
Keywords:
semi-supervised learning
; medical image segmentation
; pseudo-labels
; threshold optimization
; uncertainty
; data augmentation
1. Introduction
Rapid advances in medical technology and enhanced quality of life have raised public health awareness. However, cardiovascular disease remains a leading health threat. The AHA 2025 Statistical Report reports a global age-adjusted mortality rate of 235.18 per 100,000 and a total prevalence of 612 million cases, underscoring its substantial burden worldwide. Atrial fibrillation (AF), a common cardiac arrhythmia originating in the atria, is a major component. Accurate segmentation of left atrial images therefore holds significant clinical and societal value, facilitating precise diagnosis, optimal treatment planning, and improved prognostic evaluation for AF patients.
With deep learning is developing, full supervised learning achieved extremely remarkable results in tasks of medical image segmentation [1,2,3]. However, such methods often rely on high-quality and large-scale labelled data, which brings two major challenges to left atrial image annotation.
First, the cost of medical image annotation is so high. Traditional manual annotation methods are extremely inefficient for annotating medical images. An experienced medical staff needs to invest lots of time in labelling. Secondly, the quality of image annotation results varies greatly. Because the collection of medical images is influenced by noise easily, and image edges are blurred, contrast is low, this will lead to significant differences in labelling results among clinical imaging physicians with different experiences [4].
To overcome annotation and generalization challenges, semi-supervised learning (SSL) has been widely adopted for medical image segmentation, combining labelled and unlabelled data to train effectively with limited annotations. The pseudo-labelling approach [5] is key, yet existing methods face three shortcomings: low-confidence predictions near ambiguous boundaries cause progressive noise accumulation; a fixed confidence threshold fails to adapt to training dynamics, potentially impairing optimization [6]; and random augmentations lack purposeful design. Uncertainty-based augmentation [7] has proven effective in guiding augmentations to mitigate these issues.
Given the above research background, we propose a semi-supervised medical image segmentation method based on uncertainty-guided dynamic pseudo-label augmentation, it’s useful for left atrial image segmentation. In this approach, the confidence threshold is dynamically optimized to better accommodate the evolving characteristics of data distribution and feature variations. An Uncertainty-Guided Region Mix (UMIX) module is further introduced to enable targeted data augmentation. Built upon the UniMatch backbone, we incorporate an additional unlabelled data stream and apply both image-level and feature-level perturbations to it, thereby strengthening the supervisory signals and improving the reliability of pseudo labels as well as the model’s generalization capability.
2. Materials and Methods
Semi-supervised learning partitions data into labelled and unlabelled subsets, using pseudo-labels from the model trained on labelled data to improve performance. Since no ground truth is available, pseudo-label quality is critical [8]. Accordingly, this paper focuses on refining the generation and filtering modules of pseudo-labels.
Current confidence thresholds are fixed or heuristic-based, causing early discarding of useful signals and later noise retention, which undermines accuracy and robustness [6]. Such global thresholds cannot adapt to dynamic data distribution changes. Su et al. proposed a novel adaptive loss function to mitigate the impact of large gradients on the model during the early training stage [9]. Medical images have ambiguous boundaries, making pseudo-labels prone to noise accumulation, so directed guidance is needed for low-confidence regions. Inspired by UniMatch, we simultaneously apply image-level and feature-level weak-strong perturbations to enhance performance [10].
The left atrium exhibits scale-dependent morphological characteristics, requiring simultaneous capture of global positional information and local boundary details. Su et al. proposed a proposal-free fully convolutional network, PF-FCN, which incorporates an innovative “box map” mechanism (comprising a bounding box size map, a correlation score map, and a classification score map) along with a channel-spatial context subnetwork. By reducing fully connected layers and filtering center points, PF-FCN significantly decreases the parameter count [11].
It should be noted that GenAI was used in this paper to assist with literature reading, grammar checking, and translation.
2.1. Overall Network Framework
The proposed method is built upon a dynamic pseudo-label augmentation strategy, with the overall architecture depicted in Figure 1. It comprises the following core modules (1) a dynamic pseudo-label refinement module, which jointly optimizes pseudo-label quality through adaptive threshold selection and UMIX-based local enhancement, (2) a dual-task multi-perturbation module, which, building upon the UniMatch model, simultaneously applies both image-level and feature-level weak and strong perturbations to one of the unlabelled data streams. The framework of the UniMatch model is illustrated in Figure 2.
2.2. Algorithmic Description of Each Module
In the dynamic pseudo-label refinement module, our method performs dynamic confidence threshold optimization, which is realized by designing a threshold update function based on exponential decay to balance the quality requirements for pseudo-labels across different training stages.
The τ(t) is a dynamic threshold that varies over time, the initial confidence threshold τbase = 0.85. The initial confidence threshold τbase and τ gradually increases with the number of iterations t:
τ(t)=τbase+(1-τbase)⋅sigmoid_rampup(t,Tmax)
Here,Tmax represents the maximum number of iterations, and the ramp function is defined as:
This function slowly raises the threshold in the early stage of training to retain more samples, and then quickly approaches 1 in the later stage to prevent noise from contaminating the correct supervision signal. Model-generated prediction probability for unlabelled data Pu and screens out high-confidence regions:
Here, I(⋅) is the indicator function, and only predictions with a confidence level higher than the threshold are retained, the arg max operator selects the class with the highest predicted probability.
2.3. UMIX Local Uncertainty Enhancement
In medical images, organ boundaries (e.g., the heart) and lesion margins are examples of regions where predictive uncertainty tends to be high. UMIX mitigates this by replacing features in such high-uncertainty regions, thereby strengthening the model’s robustness to complex boundaries. First, calculate the voxel-by-voxel entropy of the model prediction result.
Divide the feature map into local blocks of K × K × K (default is 16 × 16 × 16), and calculate the average entropy within the blocks:
Select the k block with the highest entropy value (default k = 2) as the area to be replaced. Then extract the low-entropy block features at the corresponding positions from another unlabelled sample and perform the replacement:
The variable denotes the target sample features in the current batch after UMIX-based mixing augmentation. The notation [Blockk] serves as an index indicating the position of the k-th local block, which is determined by the high-entropy selection procedure as described in Equation 5.
The algorithm of this module is as follows:
| Algorithm 1: UMIX |
| Input: Feature map, number of swap blocks k = 2, patch size K = 16. Output: The feature map x after exchange. 1. Begin 2. Calculate the voxel-by-voxel entropy for the model prediction result. 3. Divide the feature map into local blocks of K×K×K, where default is 16×16×16, and calculate the average entropy within the blocks. 4. Select the k block with the highest entropy value, where default k = 2, as the area to be replaced. 5. Then extract the low-entropy block features at the corresponding positions from another unlabelled sample and perform the replacement. 6. End |
2.4. UMIX Local Uncertainty Enhancement
The Cross-Entropy Loss function [12] and the Dice loss function [2] are both commonly used loss functions in image segmentation tasks. The cross-entropy loss function is shown in Formula 7, and the Dice loss function is shown in Formula 8. Here, ε = 1e - 8 is the smoothing term.
CE(p,y) = −(plogy + (1 − p)log(1 − y))
Supervised Loss effectively alleviates the common class imbalance problem in medical images by jointly optimizing the classification boundaries (using CE) and the region overlap (using Dice). For the labeled data Dl = {(xi, yi)}, the supervised loss combines the cross-entropy loss and the Dice loss to simultaneously optimize segmentation accuracy and region overlap with the ground truth. It is shown in Formula 9.
Here, px = Softmax(fθ(x)) denotes the model’s predicted probability distribution, which is typically normalized via a Softmax function, with each dimension corresponding to the probability of a respective class. yx represents the ground-truth label corresponding to the input sample x. Moreover, refers to the probability map of the foreground class, i.e., the response intensity of the target region.
Unsupervised Loss enforces consistency across two augmentation branches, thereby enhancing the model’s robustness to data perturbations. For the unlabelled data Du = {xj}, we define the unsupervised loss based on the pseudo-labels generated by the model and the dynamic confidence threshold τ(t), as formulated in Equation 10.
Among them, is the prediction from the k-th unsupervised augmentation branch (either weak or strong), I(⋅) is the indicator function that retains only regions with confidence above the dynamic threshold τ(t).
To enhance the quality of pseudo-labels, we adopt a knowledge distillation loss based on feature perturbation, which consists of the following two components. First, the predictions obtained after image-level strong perturbation and feature-level weak-strong perturbations are both required to be consistent with the pseudo-labels derived from image-level weak perturbation, as formulated in Equation 11. Second, the predictions from feature-level weak-strong enhancements under image-level strong perturbation are enforced to align in the feature space via a KL divergence constraint [13], as shown in Equation 12.
Among them, is the foreground probability map predicted by the weakly augmented branch for the unlabelled data (i.e., the probability distribution over the target region). is the foreground probability map predicted by the strongly augmented branch for the same unlabelled data.
Lconsist = KL(pweak‖pstrong)
Among them, KL(⋅∥⋅) is The Kullback-Leibler (KL) divergence, which quantifies the dissimilarity between two probability distributions and is asymmetric in nature. pstrong is the full predictive probability distribution produced by the strongly augmented branch. pweak The full predictive probability distribution produced by the weakly augmented branch (covering all classes).
The overall distillation loss is then defined as a weighted sum of these two terms, where η ∈ [0, 1] controls the supervision strength, as given in Equation 13.
LKD = ηLws + (1 − η)Lconsist
The overall objective function, which combines the supervised loss, the unsupervised loss, and the distillation loss, is presented in Equation 14.
The design of this total loss function achieves the following goals by balancing the contributions of each loss term. First, labelled data dominates the optimization direction. Lx provides reliable gradients to avoid model shifts caused by pseudo-annotation noise. Second, unlabelled data enhances generalization ability. Dual branch and improve the model’s adaptability to the variability of medical image data. Third, the knowledge distillation term prevents the model from over-learning erroneous information. Specifically, LKD enforces prediction consistency under feature-space perturbations, which mitigates the adverse effects of pseudo-label noise and thereby strengthens model robustness.
3. Experimental Design and Result Analysis
3.1. Dataset
According to the experimental requirements, in this work, the training sets of the LA dataset and the ACDC dataset were randomly divided into subsets with a proportion of labelled data of 5%, 10%, and 20%, and subsets with a proportion of labelled data of 5% and 10% respectively, for model training. All the datasets used are public datasets.
The LA dataset was used in the 2018 Left Atrial Segmentation Challenge of the Heart. This dataset contains 100 cases of 3D cardiac MRI data, among which 80 cases are used as the training set and the remaining 20 cases are used as the validation set, with the labelled target being the left atrium.
The ACDC dataset is a public dataset used by the Automated Cardiac Diagnosis Challenge. This dataset covers 100 cases. Among them, 70 cases were used as the training set and 30 cases as the validation set.
3.2. Evaluation Metrics
All the datasets in this paper are evaluated for the performance of the proposed model using the same four evaluation indicators.
Dice score is a statistical indicator used to evaluate the degree of overlap between segmentation results and real labelling. Its value ranges from 0 to 1, with 1 indicating complete overlap and 0 indicating no overlap at all. We use it to evaluate the accuracy of medical image segmentation, such as organ or tumour segmentation [2], as given in Equation 15.
where Ypred is the predicted partition region,Ygt is the true partition region, and |Ypred ∩ Ygt| is the intersection area of the two regions.
The IoU (Intersection over Union) or Jaccard index is used to measure the overlap of two sets and also has a value between 0 and 1. Similar to Dice score, it is used to evaluate the accuracy of segmentation, but IoU is more sensitive to the case of small overlapping areas [14], as given in Equation 16, where |Ypred ∪ Ygt| denote the area of the union of the two regions.
Hausdorff Distance, which measures the maximum distance between two-point sets, that is, the maximum minimum distance of all points from one-point set to another. Evaluate the maximum deviation between the segmentation boundary and the true boundary [15], as given in Equation 17.
where ‖p − g‖ is the Euclidean distance between points p and g, typically defined as the straight-line distance in two-dimensional or three-dimensional space. To mitigate the influence of outliers, the 95% Hausdorff Distance is commonly employed, which is defined as the 95th percentile of the Hausdorff Distance. A smaller value of this metric indicates that the segmentation boundary is closer to that of the ground truth.
The Average Surface Distance (ASD) serves as a metric for quantifying the mean distance between the model’s segmentation output and the corresponding ground-truth labels and is computed as Equation 18.
3.3. Experimental Evaluation and Comparative Analysis
Table 1 summarizes the quantitative experimental results on the LA dataset. As can be observed from the table, our proposed method achieves competitive performance across all four-evaluation metrics. When using only 5% labelled data, our method attains a Dice score of 90.35%, which outperforms the BCP method by 2.83 percentage points. Furthermore, with 8% labelled data, our method surpasses all competing approaches across all four metrics. Table 2 presents the quantitative results on the ACDC dataset. It is evident that our method also yields strong performance on this dataset against the same four evaluation criteria. With 5% labelled data, our method achieves superior scores on all metrics compared with the baselines, with a Dice score of 87.83%, exceeding that of the URCA method by 4.52 percentage points.
Table 3 shows the experimental results of ablating different modular components on the LA dataset, where A denotes the baseline model without any of the proposed modules, B represents the UMIX uncertainty-guided module, C stands for the dynamic confidence threshold module, and D refers to the dual-task multi-perturbation module. For a fair comparison, all ablation studies were performed under identical parameter settings.
From the experimental results, we can make the following observations:
- ▪ UMIX uncertainty-guided module: Removing this module leads to a decrease in Jaccard index scores by 0.88%, 2.51%, and 0.67% respectively, indicating that uncertainty-guided local feature replacement effectively suppresses edge noise.
- ▪ Dynamic confidence threshold module: Its removal consistently lowers the Dice scores across all settings, which verifies the validity of the progressive adjustment strategy.
- ▪ Dual-task multi-perturbation module: A comparison of Dice scores before and after removing this module reveals that the performance gap enlarges as the proportion of unlabelled data decreases.
Figure 3 visually presents a comparative display of segmentation results produced by various methods on the LA dataset, where the GT (ground truth) images denote the manually annotated labels. As can be observed, our proposed method yields superior segmentation outcomes relative to the other comparative approaches, which is consistent with the qualitative findings discussed above. Notably, the segmentation results achieved by our method exhibit better boundary continuity and preserve more detailed structures, aligning more closely with the GT images.
The UMIX uncertainty-guided module proposed in this paper effectively reduces the uncertainty associated with pseudo-labels and enhances segmentation performance along the boundaries of medical structures such as the left atrium. Figure 4 provides a visual comparison of uncertainty heatmaps with and without the UMIX module. The lack of interpretability can severely undermine clinical confidence [32], while the UMIX module provides a certain degree of interpretability through entropy heatmaps. The heatmap colour mapping adopts the Plasma colormap from the Matplotlib library, where colours range from deep purple to bright yellow, representing low to high uncertainty. A representative sample from the LA dataset is shown, with the central slice selected for display and visualized across three different views. The results demonstrate that the heatmap of the model optimized with the UMIX module (on the right) exhibits a more stable and consistently deeper purple tone overall compared to the unoptimized version (on the left), with finer and more detailed processing along the edges. These observations substantiate the effectiveness of the proposed module.
4. Discussion
Table 1, Table 2 and Table 3 quantitatively validate the effectiveness of our proposed semi-supervised medical image segmentation method based on dynamic pseudo-label augmentation. By comparing our method with state-of-the-art approaches reported in recent literature, we observe that our method consistently achieves competitive performance across various proportions of labeled data, as measured by four evaluation metrics, namely the Dice coefficient, Intersection over Union (IoU), Hausdorff distance, and Average Surface Distance (ASD). Furthermore, the ablation study results reveal that the inclusion or removal of individual modules directly affects the Dice coefficient and other metrics, confirming that the UMIX uncertainty-guided module effectively suppresses edge noise through uncertainty-guided local feature replacement, while the dual-task multi-perturbation strategy enhances supervision both among unlabeled data and from labeled to unlabeled data, thereby effectively reducing the generation of erroneous pseudo-labels. Furthermore, Figure 3 and Figure 4 qualitatively illustrate that our method yields more stable segmentation results with more refined handling of boundary regions, further substantiating the effectiveness of the proposed approach.
5. Conclusions
Targeting the task of left atrial image segmentation, this paper proposes a semi-supervised medical image segmentation method based on uncertainty-guided dynamic pseudo-label augmentation, with the primary aim of addressing the issues of rigidly fixed confidence thresholds for pseudo-labels and the lack of purposeful guidance in data augmentation. The main contributions are summarized as follows:
To overcome the limitation that a fixed confidence threshold fails to adapt to the dynamic training process, leading to suboptimal utilization of pseudo-labels, we design a threshold update function inspired by exponential decay, which meets the varying quality demands for pseudo-labels at different training stages. In response to the fact that conventional data augmentation methods are often applied indiscriminately and may disrupt the local structures of medical images, we introduce uncertainty-guided image mixing to purposefully expand data diversity and enhance the model’s generalization capability.
Motivated by the ablation study on weak-strong perturbations in the UniMatch model, we incorporate an additional unlabelled data stream and apply both image-level and feature-level weak and strong perturbations, thereby obtaining stronger supervision signals and improving segmentation performance.
Extensive experiments are conducted on two public medical image datasets, including comparisons with state-of-the-art methods, ablation studies on each innovative module, and parameter selection analyses. The experimental results demonstrate that our proposed method effectively improves the utilization of pseudo-labels, reduces predictive uncertainty, and enhances overall segmentation performance.
Nevertheless, the proposed method has certain limitations. First, it entails considerable computational resource demands, the feature replacement operation results in a training memory footprint of 23.6 GB, which constrains its deployment on low-end devices. Second, the method is sensitive to hyperparameter selection where the initial threshold τbase = 0.85 may require further tuning in scenarios with extreme class imbalance.
To address these limitations, future work can be directed toward the following aspects. (1) Lightweight model design, employing techniques such as channel pruning and dynamic adjustment of network depth to reduce computational requirements. Peng, X. et al. proposed a Fourier-spatial synergistic learning framework that operates under a frame-by-frame real-time inference setting, achieving “clinical-grade” segmentation [33]. (2) Multimodal fusion, exploring joint training on paired CT-MRI data and aligning feature spaces via contrastive learning. The future progress will depend on multi-institutional data curation, self-supervised and foundation model pre-training, privacy-preserving collaboration, and multimodal designs that remain reliable under missing modalities and real-world distribution shifts [34]. (3) Interactive segmentation, enabling clinicians to correct a small number of erroneous predictions and updating the model in real time through online learning, thereby establishing a human-in-the-loop system.
Funding
This work was supported by Universiti Kebangsaan Malaysia (UKM) through the Faculty of Information Science and Technology Research Fund (FTM1).
Abbreviations
The following abbreviations are used mainly in this manuscript:
| AF | Atrial fibrillation |
| SSL | Semi-supervised learning |
| UMIX | uncertainty-guided region mixing |
| IoU | Intersection over Union |
| ASD | Average Surface Distance |
| MRI | Magnetic Resonance Imaging |
| LA | Left Atrium |
| ACDC | Automated Cardiac Diagnosis Challenge |
| GT | ground truth |
References
- Chen, L. C.; Papandreou, G.; Kokkinos, I.; Murphy, K.; Yuille, A. L. Deeplab: Semantic image segmentation with deep convolutional nets, atrous convolution, and fully connected CRFs. IEEE Trans. Pattern Anal. Mach. Intell. 2017, 40(4), 834–848. [Google Scholar] [CrossRef] [PubMed]
- Milletari, F.; Navab, N.; Ahmadi, S. A. V-net: Fully convolutional neural networks for volumetric medical image segmentation. In 2016 Fourth International Conference on 3D Vision (3DV); IEEE, October 2016; pp. 565–571. [Google Scholar]
- Ronneberger, O.; Fischer, P.; Brox, T. U-net: Convolutional networks for biomedical image segmentation. In Medical Image Computing and Computer-Assisted Intervention–MICCAI 2015: 18th International Conference, Munich, Germany, October 5-9, 2015, Proceedings, Part III; Springer, 2015; pp. 234–241. [Google Scholar]
- Ji, W.; Yu, S.; Wu, J.; Ma, K.; Bian, C.; Bi, Q.; Zheng, Y. Learning calibrated medical image segmentation via multi-rater agreement modeling. In Proceedings of the IEEE/CVF Conference on Computer Vision and Pattern Recognition, 2021; pp. 12341–12351. [Google Scholar]
- Lee, D. H. Pseudo-label: The simple and efficient semi-supervised learning method for deep neural networks. In Workshop on challenges in representation learning, ICML; Vol. 3, No. 2, No. 2, p. 896.
- Wang, Y.; Chen, H.; Heng, Q.; Hou, W.; Fan, Y.; Wu, Z.; Xie, X. Freematch: Self-adaptive thresholding for semi-supervised learning. arXiv 2022, arXiv:2205.07246. [Google Scholar]
- Shen, Z.; Cao, P.; Yang, H.; Liu, X.; Yang, J.; Zaiane, O. R. Co-training with high-confidence pseudo labels for semi-supervised medical image segmentation. arXiv 2023, arXiv:2301.04465. [Google Scholar]
- Shan, Y.; Zhuge, Y.; Lu, H. HDVS: semi-supervised semantic segmentation via heterogeneous dual-branch voting supervision. Vis. Intell. 2026, 4(1), 4. [Google Scholar] [CrossRef]
- Su, Z.; Adam, A.; Nasrudin, M. F. Adaptive focal loss for keypoint-based deep learning detectors addressing class imbalance. IEEE Access 2025, 13, 31842–31856. [Google Scholar] [CrossRef]
- Yang, L.; Qi, L.; Feng, L.; Zhang, W.; Shi, Y. Revisiting weak-to-strong consistency in semi-supervised semantic segmentation. In 2023 IEEE/CVF Conference on Computer Vision and Pattern Recognition (CVPR); IEEE, June 2023; pp. 7236–7246. [Google Scholar]
- Su, Z.; Adam, A.; Nasrudin, M. F. Adaptive focal loss for keypoint-based deep learning detectors addressing class imbalance. IEEE Access 2025, 13, 31842–31856. [Google Scholar] [CrossRef]
- Shannon, C. E. A mathematical theory of communication. Bell Syst. Tech. J. 1948, 27(3), 379–423. [Google Scholar] [CrossRef]
- Szegedy, C.; Vanhoucke, V.; Ioffe, S.; Shlens, J.; Wojna, Z. Rethinking the inception architecture for computer vision. In Proceedings of the IEEE conference on computer vision and pattern recognition, 2016; pp. 2818–2826. [Google Scholar]
- Jaccard, P. The distribution of the flora in the alpine zone. New Phytol. 1912, 11(2), 37–50. [Google Scholar] [CrossRef]
- Huttenlocher, D. P.; Klanderman, G. A.; Rucklidge, W. J. Comparing images using the Hausdorff distance. IEEE Trans. Pattern Anal. Mach. Intell. 2002, 15(9), 850–863. [Google Scholar]
- Yu, L.; Wang, S.; Li, X.; Fu, C. W.; Heng, P. A. Uncertainty-aware self-ensembling model for semi-supervised 3D left atrium segmentation. International conference on medical image computing and computer-assisted intervention, 2019, October; Springer International Publishing: Cham; pp. 605–613. [Google Scholar]
- Li, S.; Zhang, C.; He, X. Shape-aware semi-supervised 3D semantic segmentation for medical images. In International conference on medical image computing and computer-assisted intervention; Springer International Publishing: Cham, 2020, September; pp. 552–561. [Google Scholar]
- Luo, X.; Chen, J.; Song, T.; Wang, G. Semi-supervised medical image segmentation through dual-task consistency. Proc. AAAI Conf. Artif. Intell. 2021, Vol. 35(No. 10), 8801–8809. [Google Scholar]
- Wu, Y.; Xu, M.; Ge, Z.; Cai, J.; Zhang, L. Semi-supervised left atrium segmentation with mutual consistency training. In International Conference on Medical Image Computing and Computer-Assisted Intervention; Springer International Publishing: Cham, 2021, September; pp. 297–306. [Google Scholar]
- Luo, X.; Wang, G.; Liao, W.; Chen, J.; Song, T.; Chen, Y.; Zhang, S. Semi-supervised medical image segmentation via uncertainty rectified pyramid consistency. Med. Image Anal. 2022, 80, 102517. [Google Scholar] [CrossRef] [PubMed]
- Wu, Y.; Wu, Z.; Wu, Q.; Ge, Z.; Cai, J. Exploring smoothness and class-separation for semi-supervised medical image segmentation. International conference on medical image computing and computer-assisted intervention, 2022, September; Springer Nature Switzerland: Cham; pp. 34–43. [Google Scholar]
- Wu, Y.; Ge, Z.; Zhang, D.; Xu, M.; Zhang, L.; Xia, Y.; Cai, J. Mutual consistency learning for semi-supervised medical image segmentation. Med. Image Anal. 2022, 81, 102530. [Google Scholar] [CrossRef] [PubMed]
- Bai, Y.; Chen, D.; Li, Q.; Shen, W.; Wang, Y. Bidirectional copy-paste for semi-supervised medical image segmentation. In 2023 IEEE/CVF Conference on Computer Vision and Pattern Recognition (CVPR); IEEE, June 2023; pp. 11514–11524. [Google Scholar]
- Gao, S.; Zhang, Z.; Ma, J.; Li, Z.; Zhang, S. Correlation-aware mutual learning for semi-supervised medical image segmentation. In International Conference on Medical Image Computing and Computer-Assisted Intervention; Springer Nature Switzerland: Cham, 2023, October; pp. 98–108. [Google Scholar]
- Zhao, H.; Li, H.; Ma, L. L.; Sun, D. Segment anything model meets semi-supervised medical image segmentation: A novel perspective. Adv. Neural Inf. Process. Syst. 2026, 38, 170128–170148. [Google Scholar]
- Yang, Y.; Sun, G.; Zhang, T.; Wang, R.; Su, J. Semi-supervised medical image segmentation via weak-to-strong perturbation consistency and edge-aware contrastive representation. Med. Image Anal. 2025, 101, 103450. [Google Scholar] [PubMed]
- Xie, Y.; Yin, Y.; Li, Q.; Wang, Y. Deep mutual distillation for semi-supervised medical image segmentation. In International Conference on Medical Image Computing and Computer-Assisted Intervention; Springer Nature Switzerland: Cham, 2023, October; pp. 540–550. [Google Scholar]
- Zhao, X.; Qi, Z.; Wang, S.; Wang, Q.; Wu, X.; Mao, Y.; Zhang, L. Rcps: Rectified contrastive pseudo supervision for semi-supervised medical image segmentation. IEEE J. Biomed. Health Inform. 2023, 28(1), 251–261. [Google Scholar] [CrossRef] [PubMed]
- He, A.; Li, T.; Yan, J.; Wang, K.; Fu, H. Bilateral supervision network for semi-supervised medical image segmentation. IEEE Trans. Med. Imaging 2023, 43(5), 1715–1726. [Google Scholar]
- Qin, C.; Wang, Y.; Zhang, J. URCA: Uncertainty-based region clipping algorithm for semi-supervised medical image segmentation. Comput. Methods Programs Biomed. 2024, 254, 108278. [Google Scholar] [PubMed]
- Yang, Y.; Zhuang, J.; Sun, G.; Wang, R.; Su, J. Boundary-guided contrastive learning for semi-supervised medical image segmentation. IEEE Trans. Med. Imaging 2025, 44(7), 2973–2988. [Google Scholar] [CrossRef] [PubMed]
- Su, Z.; Adam, A.; Nasrudin, M. F.; Ayob, M.; Punganan, G. Skeletal fracture detection with deep learning: A comprehensive review. Diagnostics 2023, 13(20), 3245. [Google Scholar] [PubMed]
- Peng, X.; Liu, Y.; Chen, J.; Xu, L.; Li, T.; Cao, M.; Zhang, Y. EchoSynthNet: Fourier-spatial synergistic learning for clinical-grade cardiac chamber segmentation in echocardiography. Biomed. Signal Process. Control 2026, 119, 109972. [Google Scholar]
- Peng, X.; Zhou, X.; Feng, X.; Fang, N.; Dong, X.; Hong, W.; Nasrudin, M. F. Artificial intelligence for triple-negative breast cancer from imaging to multi-omics. Front. Oncol. 2026, 16, 1834128. [Google Scholar] [CrossRef] [PubMed]
Figure 1.
The Overall Architecture: Dynamic Pseudo-annotation Enhanced Semi-supervised Medical Image Segmentation Framework.
Figure 1.
The Overall Architecture: Dynamic Pseudo-annotation Enhanced Semi-supervised Medical Image Segmentation Framework.
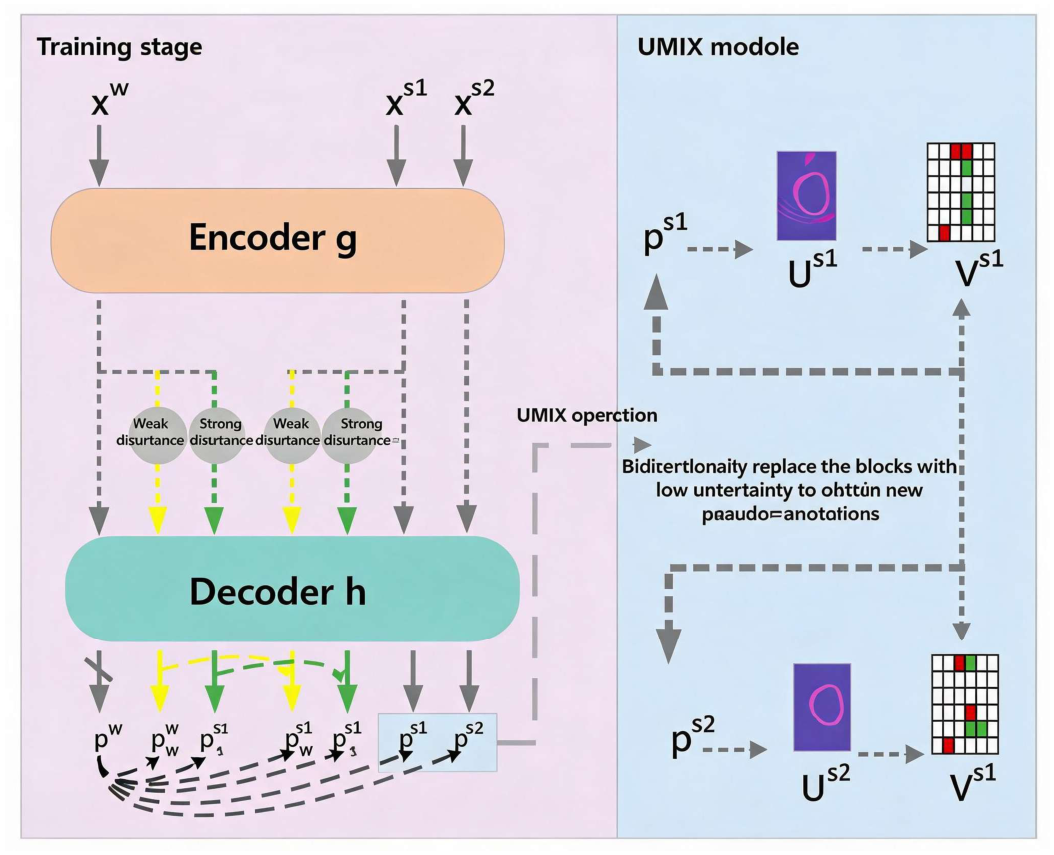
Figure 2.
UniMatch Model Framework.
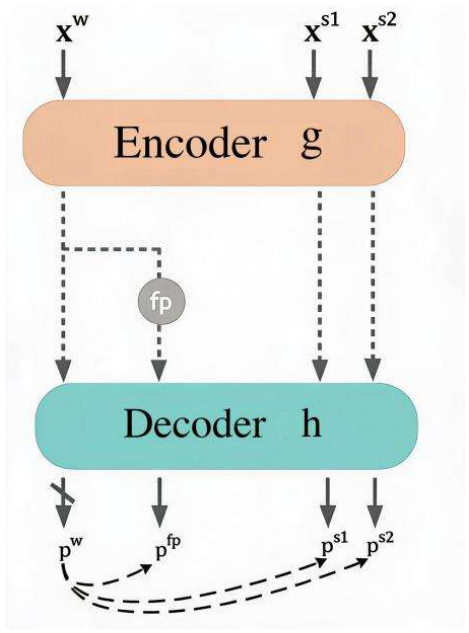
Figure 3.
Comparison of Visualization Segmentation Results of Various Methods Based on the LA Dataset.
Figure 3.
Comparison of Visualization Segmentation Results of Various Methods Based on the LA Dataset.
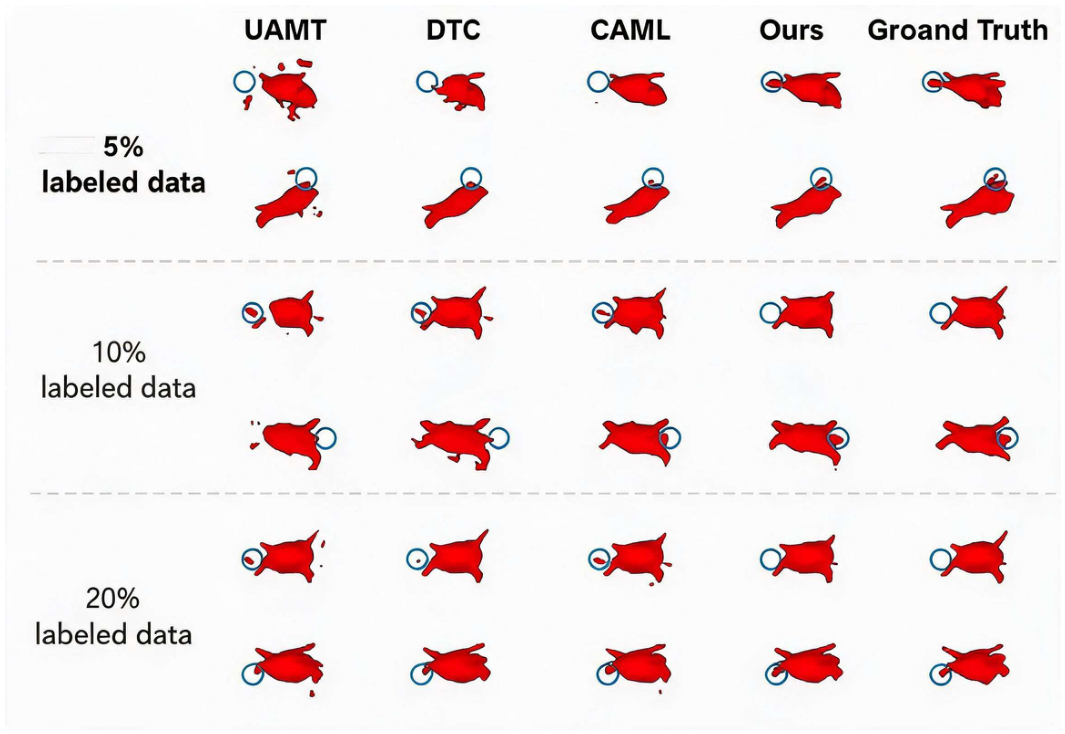
Figure 4.
Visualization Comparison of Uncertainty Heatmaps for Segmentation Results.
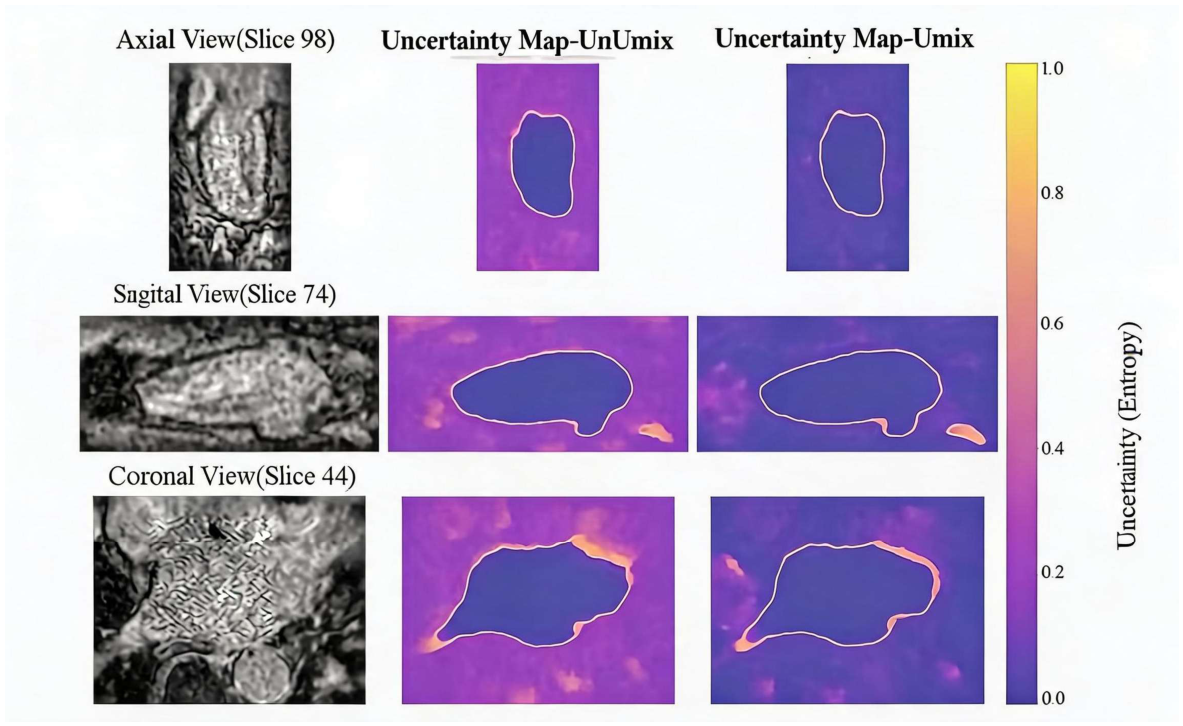

Table 1.
Comparison of Experimental Results on the LA Dataset.
| Method | Label ratio | Evaluation Metric | ||||
| Labelled data | Unlabel-led data |
Dice (%) |
IoU (%) |
HD95 (voxel) |
ASD (voxel) |
|
| V-Net | 4(5%) | 0 | 43.32 | 31.43 | 40.19 | 12.13 |
| V-Net | 8(10%) | 0 | 79.99 | 68.12 | 21.11 | 5.48 |
| V-Net | 16(20%) | 0 | 86.03 | 76.06 | 14.26 | 3.51 |
| V-Net | 80(All) | 0 | 91.14 | 85.82 | 5.75 | 1.52 |
| UA-MT [16] | 4(5%) | 76(95%) | 78.07 | 65.03 | 29.17 | 8.63 |
| SASSNet [17] | 79.61 | 67.00 | 25.54 | 7.20 | ||
| DTC [18] | 80.14 | 67.88 | 24.08 | 7.18 | ||
| MC-Net [19] | 80.92 | 68.90 | 17.25 | 2.76 | ||
| URPC [20] | 80.75 | 68.54 | 19.81 | 4.98 | ||
| SS-Net [21] | 83.33 | 71.79 | 15.70 | 4.33 | ||
| MC-Net+ [22] | 83.23 | 71.70 | 14.92 | 3.43 | ||
| BCP [23] | 87.52 | 75.83 | 12.04 | 2.85 | ||
| UniMatch [10] | 86.08 | 77.65 | 9.76 | 2.49 | ||
| CAML [24] | 87.34 | 81.54 | 5.90 | 1.85 | ||
| SAM-MIS [25] | 88.42 | 79.47 | 8.15 | 2.65 | ||
| W2SPC [26] | 89.02 | 79.83 | 10.23 | 2.18 | ||
| Our method | 90.35 | 82.47 | 6.08 | 1.72 | ||
| UA-MT [16] | 8(10%) | 72(90%) | 85.81 | 75.41 | 18.25 | 5.04 |
| SASSNet [17] | 85.71 | 75.35 | 14.74 | 4.00 | ||
| DTC [18] | 84.55 | 73.91 | 13.80 | 3.69 | ||
| MC-Net [19] | 86.87 | 78.49 | 11.17 | 2.18 | ||
| URPC [20] | 87.68 | 78.36 | 14.39 | 3.52 | ||
| SS-Net [21] | 86.56 | 76.61 | 12.76 | 3.02 | ||
| MC-Net+ [22] | 87.68 | 78.27 | 10.35 | 1.85 | ||
| DMD [27] | 89.70 | 81.42 | 6.88 | 1.78 | ||
| BCP [23] | 89.55 | 81.22 | 7.10 | 1.69 | ||
| UniMatch [10] | 89.09 | 80.47 | 12.50 | 3.59 | ||
| CAML [24] | 89.62 | 81.28 | 8.76 | 2.02 | ||
| RCPS [28] | 90.73 | - | 7.91 | 2.05 | ||
| W2SPC [26] | 90.23 | 81.52 | 7.16 | 1.95 | ||
| SAM-MIS [25] | 90.47 | 82.71 | 8.15 | 2.65 | ||
| Our method | 90.96 | 83.48 | 5.96 | 1.54 | ||
| UA-MT [16] | 16(20%) | 64(80%) | 88.18 | 79.09 | 9.66 | 2.62 |
| SASSNet [17] | 88.11 | 79.08 | 12.31 | 3.27 | ||
| DTC [18] | 87.79 | 78.52 | 10.29 | 2.50 | ||
| MC-Net [19] | 89.43 | 82.69 | 6.52 | 1.66 | ||
| URPC [20] | 87.68 | 78.36 | 14.39 | 3.52 | ||
| SS-Net [21] | 88.19 | 79.21 | 8.12 | 2.20 | ||
| MC-Net+ [22] | 90.60 | 82.93 | 6.27 | 1.58 | ||
| DMD [26] | 90.46 | 82.66 | 6.39 | 1.62 | ||
| BCP [23] | 90.18 | 82.36 | 6.64 | 1.61 | ||
| UniMatch [10] | 90.77 | 83.18 | 7.21 | 2.05 | ||
| CAML [24] | 90.78 | 83.19 | 6.11 | 1.68 | ||
| BSNet [29] | 90.43 | 83.13 | 6.21 | 1.63 | ||
| RCPS [28] | 91.21 | 84.57 | 6.54 | 1.81 | ||
| W2SPC [26] | 91.05 | 83.45 | 5.94 | 1.67 | ||
| Our method | 91.90 | 85.07 | 5.23 | 1.63 | ||
Table 2.
Comparison of Experimental Results on the ACDC Dataset.
| Method | Label ratio | Evaluation index | ||||
| Labelled data | Unlabel-led data |
Dice (%) |
IoU (%) |
HD95 (voxel) |
ASD (voxel) |
|
| U-Net | 3(5%) | 0 | 47.83 | 37.01 | 31.16 | 12.62 |
| U-Net | 7(10%) | 0 | 79.41 | 68.11 | 9.35 | 2.70 |
| U-Net | 70(All) | 0 | 91.44 | 84.59 | 4.30 | 0.99 |
| UA-MT [16] | 3(5%) | 67(95%) | 46.04 | 35.97 | 20.08 | 7.75 |
| SASSNet [17] | 57.77 | 46.14 | 20.05 | 6.06 | ||
| DTC [18] | 56.90 | 45.67 | 23.36 | 7.39 | ||
| MC-Net [19] | 62.85 | 52.29 | 7.62 | 2.33 | ||
| URPC [20] | 55.87 | 44.64 | 13.60 | 3.74 | ||
| SS-Net [21] | 65.82 | 55.38 | 6.67 | 2.28 | ||
| DMD [26] | 80.60 | 69.08 | 5.96 | 1.90 | ||
| UniMatch [10] | 84.38 | 75.54 | 5.06 | 1.04 | ||
| URCA [30] | 83.31 | - | 6.95 | 2.16 | ||
| BoCLIS [31] | 87.63 | 76.91 | 4.49 | 1.23 | ||
| Our method | 88.02 | 79.73 | 1.66 | 0.51 | ||
| UA-MT [21] | 7(10%) | 63(90%) | 81.65 | 70.64 | 6.88 | 2.02 |
| SASSNet [17] | 84.50 | 75.35 | 18.44 | 5.04 | ||
| DTC [18] | 84.29 | 73.91 | 13.80 | 3.69 | ||
| MC-Net [19] | 86.44 | 78.49 | 11.17 | 2.18 | ||
| URPC [20] | 83.10 | 78.36 | 14.39 | 3.52 | ||
| SS-Net [21] | 86.78 | 76.61 | 12.76 | 3.02 | ||
| DMD [26] | 87.52 | 81.42 | 6.88 | 1.78 | ||
| UniMatch [10] | 88.08 | 80.47 | 12.50 | 3.59 | ||
| URCA [30] | 87.86 | 84.11 | 7.91 | 2.05 | ||
| Our method | 88.47 | 80.47 | 1.70 | 0.66 | ||
Table 3.
Comparative Results of Ablation Experiments Conducted on the LA Dataset.
| Module Components | Labelled Data Proportion | Evaluation Metrics | ||||||
| A | B | C | D |
Dice (%) |
IoU (%) |
HD95 (voxel) |
ASD (voxel) |
|
| √ | √ | √ | 4(5%) | 89.76 | 81.52 | 5.89 | 1.9 | |
| √ | √ | √ | 89.07 | 80.4 | 10.9 | 2.8 | ||
| √ | √ | √ | 88.73 | 79.93 | 7.72 | 2.33 | ||
| √ | √ | √ | √ | 90.35 | 82.47 | 6.08 | 1.72 | |
| √ | √ | √ | 8(10%) | 89.18 | 80.66 | 7.62 | 1.84 | |
| √ | √ | √ | 89.9 | 81.74 | 9.72 | 2.42 | ||
| √ | √ | √ | 90.04 | 82 | 6.41 | 1.79 | ||
| √ | √ | √ | √ | 90.77 | 83.17 | 6.41 | 1.6 | |
| √ | √ | √ | 16(20%) | 91.51 | 84.4 | 5.20 | 1.68 | |
| √ | √ | √ | 91.47 | 84.38 | 5.93 | 1.76 | ||
| √ | √ | √ | 91.18 | 83.84 | 5.61 | 1.5 | ||
| √ | √ | √ | √ | 91.9 | 85.07 | 5.23 | 1.63 | |
Disclaimer/Publisher’s Note: The statements, opinions and data contained in all publications are solely those of the individual author(s) and contributor(s) and not of MDPI and/or the editor(s). MDPI and/or the editor(s) disclaim responsibility for any injury to people or property resulting from any ideas, methods, instructions or products referred to in the content. |
© 2026 by the authors. Licensee MDPI, Basel, Switzerland. This article is an open access article distributed under the terms and conditions of the Creative Commons Attribution (CC BY) license (http://creativecommons.org/licenses/by/4.0/).
Copyright: This open access article is published under a Creative Commons CC BY 4.0 license, which permit the free download, distribution, and reuse, provided that the author and preprint are cited in any reuse.