
Submitted:
02 November 2026
Posted:
03 November 2026
You are already at the latest version
Abstract
Investors value sustainability information that is financially material to a firm’s industry, but little is known about how much of it firms outside the United States and Europe report. We examine 7,278 statutory business reports of 808 non-financial KOSPI firms for fiscal years 2016–2025. A classifier trained on large language model annotations sorts every narrative sentence by environmental, social and governance (ESG) issue and specificity, and the industry standards of the Sustainability Accounting Standards Board separate material from immaterial content. The classifier outperforms dictionary and zero-shot methods; blind human coding confirms this advantage but shows that the classifier understates material content. Material ESG information is a small, slowly growing, mostly qualitative part of the reports. After Korea’s 2021 roadmap for mandatory sustainability disclosure, the largest firms expanded their ESG content more than other firms. They added specific material information but also generic and, less robustly, immaterial statements, so their disclosure did not shift significantly towards material issues; the estimates are sensitive to flexible trend controls. Material disclosure is not robustly related to firm value, and its weak association with better liquidity is shared by ESG content generally. Anticipated mandates can expand disclosure without clearly making it more useful to investors.
Keywords:
ESG disclosure
; financial materiality
; SASB
; large language models
; textual analysis
; mandatory sustainability reporting
; regulatory anticipation
; firm value
; Korea
1. Introduction
Investors increasingly use sustainability information, but not all of it is equally useful to them. Survey evidence shows that they rely on environmental, social and governance (ESG) information mainly when it bears on future cash flows and risk (Amel-Zadeh & Serafeim, 2018), and archival studies find that the capital-market benefits of sustainability performance and disclosure come mainly from issues that are financially material to a firm’s industry (Khan et al., 2016; Grewal et al., 2021; Consolandi et al., 2022). Standard setters have adopted the same principle. IFRS S1, the general sustainability disclosure standard issued under the International Financial Reporting Standards (IFRS) Foundation, requires firms to disclose sustainability-related risks and opportunities that could reasonably be expected to affect their prospects and to consider the industry-based standards of the Sustainability Accounting Standards Board (SASB Standards) when identifying them (IFRS Foundation, 2023). Because ESG ratings from different providers disagree widely (Berg et al., 2022), investors and supervisors also have reason to read what firms themselves disclose rather than rely on third-party scores alone.
Reading those disclosures at scale is difficult. Word counts and dictionaries measure how often ESG vocabulary appears, not whether a passage deals with an issue that matters for the firm (Loughran & McDonald, 2016). Transformer-based language models draw this distinction better (Bingler et al., 2022, 2024; Huang et al., 2023; Schimanski et al., 2024). Shen et al. (2026), for example, apply a zero-shot text-matching transformer to Japanese annual securities reports and show that food and beverage firms gave more emphasis to SASB-defined material topics after Japan tightened its disclosure rules. Three questions remain open. We know little about how well such measures work across many industries and in languages other than English and Japanese. Nor do we know whether frequent discussion of a material issue comes with verifiable information about it. It is also unclear whether the materiality and specificity of disclosure, as AI tools measure them, are related to market valuation and the information environment.
Korea is a useful place to study these questions. Listed firms file a statutory annual business report in a standard format, and this report is their main disclosure document for investors. Its narrative chapters cover the business, management’s discussion and analysis, governance, employees and other matters relevant to investor protection. In January 2021, the Financial Services Commission (FSC) announced that sustainability disclosure would become mandatory from 2025 for large firms listed on the KOSPI market, the main board of the Korea Exchange, and for all KOSPI firms from 2030. The FSC postponed the plan in October 2023 and in July 2026 announced a final roadmap under which sustainability disclosure is to be included in the business report from 2028, starting with the largest firms (FSC, 2021, 2023b, 2026). The business report thus holds a ten-year record of disclosure that spans the years before and after a size-based mandate was announced, and it is the document in which the mandated disclosures will appear. Korea’s persistent valuation discount, which recent corporate value-up policies try to reduce (FSC, 2024), gives the link between disclosure and firm value direct policy relevance.
We build a documented AI pipeline that measures financially material ESG disclosure in Korean business reports and use it to address three research questions. RQ1: How much financially material ESG information do Korean statutory reports contain, which issues does it cover, and how did it change between fiscal years (FY) 2016 and 2025? RQ2: Did the firms expected to be covered first under the 2021 roadmap change their statutory disclosure in anticipation, and was the added content mainly material and specific (a substantive response) or immaterial and generic (a symbolic response)? RQ3: Is material and specific ESG disclosure associated with higher firm value and a better information environment?
The sample contains 7,278 business reports filed by 808 non-financial KOSPI firms for fiscal years 2016–2025, with 2,835,919 narrative sentences. A large language model (LLM) labelled 7,000 sentences from the reports under a written guideline; a classifier learns from 6,000 of them, and the other 1,000 are held out for evaluation. Working on sentence embeddings from a multilingual transformer (Wang et al., 2024), the classifier identifies sentences that discuss ESG issues and assigns each of them to up to two of 28 categories: the 26 SASB general issue categories and two auxiliary categories, corporate governance and general ESG management. Matching the predicted issues with the SASB materiality map for each firm’s industry separates material from immaterial disclosure, and specificity classifiers separate quantitative and concrete qualitative statements from generic ones. The design keeps the semantic judgement of an LLM (Gilardi et al., 2023; de Kok, 2025) but applies it through a small classifier that is cheap to run and open to inspection; its code and fitted parameters are available from the corresponding author, and reproducing the estimates also requires the data described in the Data Availability Statement.
Against held-out LLM labels, the classifier reaches a design-weighted F1 of 0.83 for ESG sentences and 0.78 for sentences on SASB issues, far above the scores of a Korean ESG dictionary and of zero-shot semantic matching. Blind human coding of 400 sentences agrees closely with the LLM labels on ESG relevance (κ = 0.87) and confirms the classifier’s advantage (F1 of 0.84 for ESG sentences), but it also shows that the materiality measure is conservative: most sentences the classifier calls material are material, yet it misses many material sentences. In two validity tests, the measures behave as expected: firms designated under Korea’s greenhouse gas target management or emissions trading schemes discuss emissions far more than other firms in their industry, and disclosure on employee health and safety rose after the Serious Accidents Punishment Act took effect, more so (at the 10% level) where the issue is material.
Financially material ESG content is a small part of Korean statutory reports. Its share of narrative sentences rose from 1.3% in FY2016 to 1.9% in FY2025. It accounts for 46% of the SASB-issue content identified by the classifier (66% in the human-coded validation sample), and only about one material sentence in ten contains verifiable figures. After the 2021 roadmap, the firms expected to be covered first increased material disclosure by 0.51 percentage points (27% of their pre-announcement mean) and quantitative material disclosure by 44% relative to other KOSPI firms in the baseline specification, and these increases outlasted the postponement of the mandate. The same firms also added generic material and general ESG content, and their immaterial content rose by a marginally significant 0.29 points, so the composition of their SASB-issue disclosure did not change significantly. The estimates are sensitive to flexible controls for size-related and pre-existing trends.
Material disclosure is not robustly associated with Tobin’s Q. The baseline estimate rules out associations larger than about 2.6% of Q per standard deviation of material disclosure, and the cross-sectional association between immaterial disclosure and Q disappears within firms. In tests restricted to complete next-year windows (FY2016–FY2024 reports), material disclosure is not significantly associated with idiosyncratic volatility or crash risk. It is associated with slightly lower illiquidity, but this association does not differ significantly from that of immaterial content and is stronger for total SASB-issue content and for the dictionary measure.
The study contributes to three strands of research. For the AI-based measurement of ESG disclosure, it evaluates a measure that captures financial materiality and specificity in Korean filings by firms in 52 SASB industries. The evaluation uses both held-out LLM labels and blind human coding, compares the classifier with dictionary and zero-shot benchmarks and shows where LLM reference labels differ from human judgement. For research on mandatory sustainability reporting (Christensen et al., 2021; Krueger et al., 2024), it examines what firms disclose in their statutory reports between the announcement of a mandate and its entry into force and finds, in the baseline estimates, a broad expansion of ESG content that includes specific material information but no significant shift towards material topics. For the materiality literature (Khan et al., 2016; Grewal et al., 2021), it provides evidence from an emerging Asian market with disclosure measured directly from text. Neither material emphasis nor its quantitative component is robustly associated with valuation, and the small liquidity association in the following year is not specific to material content. One reading of these results is that the capital-market benefits of material disclosure depend on standardised metrics and on the channels through which investors obtain the information, although we do not test these mechanisms directly. The results also bear on the design of Korea’s planned 2028 regime, in particular the role of industry-based metrics, and on how supervisors and investors can use AI to decide which reports deserve closer review.
2. Literature Review and Hypotheses
2.1. Financial Materiality and ESG Disclosure
Disclosure theory predicts that managers release information when the benefits outweigh the proprietary and preparation costs, and that investors penalise silence when they know the firm holds relevant information (Verrecchia, 1983; Dye, 1985). Credible disclosure can reduce information asymmetry, improve liquidity and lower the cost of capital (Diamond & Verrecchia, 1991; Healy & Palepu, 2001; Leuz & Wysocki, 2016). Sustainability information fits this framework to the extent that it bears on expected cash flows or risk. Dhaliwal et al. (2011) find that firms with superior sustainability performance enjoy a lower cost of equity after they begin publishing stand-alone sustainability reports, and investors say that they use ESG information mainly because it is financially material to investment performance (Amel-Zadeh & Serafeim, 2018).
Empirical work shows why the distinction between material and immaterial issues matters. Using the SASB materiality map, Khan et al. (2016) find that firms with strong performance on material sustainability issues outperform, while performance on immaterial issues is unrelated to future returns. Grewal et al. (2021) find that disclosure of material sustainability information is associated with more informative stock prices, and Consolandi et al. (2022) find that the financial relevance of material issues varies with their intensity across industries. Standard setting follows the same logic: IFRS S1 requires entities to consider the applicability of the disclosure topics in the industry-based SASB Standards when they identify sustainability-related risks and opportunities (IFRS Foundation, 2023). Two features of this literature motivate the present study. First, ESG ratings disagree (Berg et al., 2022), which weakens tests built on ratings and strengthens the case for studying the disclosures themselves. Second, most of the evidence on materiality comes from the United States and Europe. Korean studies relate ESG ratings or governance indices to firm value (Black et al., 2006; Yoon et al., 2018), but little is known about the financial materiality of what Korean firms actually report.
2.2. Mandated and Anticipated Disclosure: Substantive or Symbolic?
Mandatory sustainability reporting can change both what firms disclose and how they behave (Christensen et al., 2021). Including social-responsibility information in financial reports has real effects (Christensen et al., 2017), mandatory corporate social responsibility (CSR) disclosure in China affected firms’ profitability and pollution (Chen et al., 2018), and the EU’s non-financial reporting directive was associated with market reactions and real effects (Grewal et al., 2019; Fiechter et al., 2022). Because mandates are usually announced several years before they take effect, firms have reasons to respond early. They may invest in data systems and controls, learn what will be required and try to shape how stakeholders see them before disclosures become comparable across firms. Korea’s 2021 roadmap singled out the largest KOSPI firms for the first phase (Section 3) and therefore allows this anticipatory response to be observed in statutory reports.
An anticipatory response can be substantive, symbolic or both. Voluntary disclosure theory predicts that firms will provide information that helps investors assess their material exposures. Legitimacy theory instead predicts that heightened scrutiny invites impression management through aspirational claims that are easier to make than to verify (Cho & Patten, 2007; Hummel & Schlick, 2016). Better environmental performers disclose more objective and verifiable information than poor performers (Clarkson et al., 2008), and firms report favourable information selectively, to a degree that depends on external scrutiny and the threat of verification (Lyon & Maxwell, 2011; Marquis et al., 2016). Textual studies find a large amount of climate-related “cheap talk” (Bingler et al., 2022, 2024) and growing boilerplate in narrative disclosures (Brown & Tucker, 2011; Dyer et al., 2017). A substantive response to an expected mandate would add specific information on financially material issues, whereas a symbolic response would add general ESG language and discussion of immaterial topics. We state the following hypotheses:
H1.
Following the 2021 roadmap announcement, KOSPI firms expected to be covered by the first phase of mandatory sustainability disclosure increase the ESG content of their statutory business reports relative to other KOSPI firms.
H2a (substantive response).
The increase is concentrated in financially material and specific disclosure.
H2b (symbolic response).
The increase is concentrated in immaterial or generic ESG disclosure.
2.3. Material Disclosure, Firm Value and the Information Environment
If material ESG disclosure tells investors something about a firm’s exposures, strategy and performance, it should be associated with higher valuation, through lower perceived risk and better-informed expectations of future cash flows. Carbon emissions and their disclosure are priced (Matsumura et al., 2014; Bolton & Kacperczyk, 2021), and the quality of voluntary environmental disclosure is related to firm value through both expected cash flows and the cost of equity (Plumlee et al., 2015). Theory adds that the price effects of sustainability depend on investors’ preferences and risk perceptions (Pástor et al., 2021), which may differ in an emerging market with concentrated ownership and a persistent valuation discount. Immaterial disclosure should carry less value-relevant information. We therefore expect:
H3.
Financially material ESG disclosure, particularly quantitative material disclosure, is positively associated with firm value, whereas immaterial ESG disclosure is not.
Material disclosure may also improve the information environment. Opaque reporting is associated with higher crash risk (Hutton et al., 2009), mandatory ESG disclosure improves stock liquidity (Krueger et al., 2024), and specific risk disclosures are more informative than boilerplate (Hope et al., 2016). By reducing information asymmetry, disclosure should also improve liquidity (Diamond & Verrecchia, 1991; Amihud, 2002). Hence:
H4.
Financially material ESG disclosure is associated with lower idiosyncratic volatility, lower illiquidity and lower crash risk in the following year.
2.4. AI-Based Measurement of ESG Disclosure
Textual analysis in finance has moved from word lists to statistical and machine-learning methods (Loughran & McDonald, 2016; Dyer et al., 2017). Word lists are transparent but cannot tell substantive discussion of an issue from incidental use of its vocabulary. Transformer language models (Devlin et al., 2019) read words in context. FinBERT extracts information from financial text more accurately than dictionaries (Huang et al., 2023), ClimateBERT separates climate commitments from cheap talk (Bingler et al., 2022, 2024), and fine-tuned models classify environmental, social and governance communication (Schimanski et al., 2024). Transformer-based measures of transition and physical risk in regulatory filings are reflected in credit-market prices (Kölbel et al., 2024), and related methods measure firm-level climate exposure from earnings calls (Sautner et al., 2023). Generative LLMs can match or exceed crowd workers in several text-annotation tasks (Gilardi et al., 2023), summarise disclosures and strip them of clutter (A. G. Kim et al., 2023) and support the analysis of sustainability reports (Ni et al., 2023). With appropriate validation, they can serve as measurement instruments in accounting research (de Kok, 2025).
The study closest to ours is Shen et al. (2026). Applying a zero-shot text-matching transformer to the annual securities reports of Japanese food and beverage firms, they find that emphasis on SASB-defined material topics rose after Japan strengthened climate and human-capital disclosure, and their difference-in-differences analysis shows that prime-market firms, which faced climate-disclosure expectations aligned with the Task Force on Climate-related Financial Disclosures, raised their environmental emphasis more than other firms. We extend this work in three directions. First, we assess a materiality measure across many industries in Korean, a language with few domain-specific resources; multilingual sentence encoders make this possible (Conneau et al., 2020; Reimers & Gurevych, 2019; Wang et al., 2024), but how well they classify disclosure has to be established empirically. Second, we separate specific, verifiable statements from generic language, because topical emphasis alone does not show that a firm discloses anything substantive. Third, we ask whether the materiality and specificity of disclosure are related to valuation and the information environment. An LLM labels a stratified sample of sentences under a written guideline, and its labels are distilled into a multilingual embedding classifier that is applied to the whole corpus and evaluated against held-out LLM labels and blind human coding.
3. Institutional Background
Korean listed firms must file an annual business report under the Financial Investment Services and Capital Markets Act within 90 days of the fiscal year-end, through the Financial Supervisory Service’s electronic disclosure system (DART). The report follows a prescribed form with standard chapters: company overview, business description, financial statements, management’s discussion and analysis, auditor information, governance bodies, shareholders, officers and employees, affiliates, related-party transactions and “other matters necessary for investor protection”. Its narrative chapters already contain sustainability-relevant information. Firms describe environmental, safety and other regulation in the business description, report sanctions imposed by regulators, describe labour relations and their workforce, and, if they are designated under the national greenhouse gas (GHG) and energy target management scheme, report their emissions and energy use. Because the report is a statutory filing that carries legal liability, its content differs from that of voluntary sustainability reports, which are still published mainly by large firms: according to Korea Exchange figures, 204 KOSPI firms published a sustainability report in 2024, including 63% of firms with assets of at least KRW 2 trillion but only 9% of smaller firms (Park, 2025). The business report therefore offers a common statutory record of sustainability-relevant information across listed firms.
Korea’s path towards mandatory sustainability disclosure has been long and uneven, and business reports record how firms disclosed while a mandate was expected. In January 2021, the FSC announced a phased roadmap: sustainability disclosure would remain voluntary until 2025, become mandatory for KOSPI firms above a size threshold from 2025 and extend to all KOSPI firms from 2030 (FSC, 2021). The announcement did not specify the threshold. Contemporaneous news coverage reported total assets of KRW 2 trillion as the expected cut-off (J. Kim, 2021), and the FSC later cited the same figure as an example, while noting that the 2021 announcement had not specified the target firms, disclosure items or standards (FSC, 2023a). Firms knew the KRW 2 trillion cut-off well: since 2019 it had determined which KOSPI firms must file a corporate governance report with the Korea Exchange, an obligation the same plan extended to smaller firms in stages (FSC, 2021). In October 2023, the FSC postponed mandatory ESG disclosure until after 2026 (FSC, 2023b). In 2024, the Korea Sustainability Standards Board (KSSB) published exposure drafts of Korean sustainability disclosure standards based on IFRS S1 and S2; the drafts took a climate-first approach and did not require industry-based information such as industry metrics (IFRS Foundation, 2025). The first two standards, on general requirements and on climate-related disclosures, were finalised in February 2026 and left disclosures on other sustainability topics and industry-based metrics optional (Samil PwC, 2026). In July 2026, the FSC announced a final roadmap for including sustainability disclosure in the business report: KOSPI firms with consolidated assets of at least KRW 10 trillion will disclose from 2028 (fiscal year 2027) and firms with at least KRW 5 trillion from 2029; an extension to KRW 2 trillion is under review, and third-party assurance is to start in 2030 (FSC, 2026).
Two features of this history shape the empirical design. First, the 2021 announcement signalled that the largest KOSPI firms would be covered first and all other KOSPI firms later. The treatment we study is this difference in the expected timing of the obligation, not a binding rule. Second, the mandate did not take effect during the sample period (fiscal years 2016–2025) and was postponed in 2023. Changes in disclosure during the period can therefore reflect anticipation and preparation, but not compliance with a sustainability-reporting mandate, and the postponement shows whether the response faded when the obligation receded. Other regulation changed as well. The Serious Accidents Punishment Act, enacted in January 2021 and effective from January 2022, exposed firms and executives to criminal liability for fatal workplace accidents; it serves as an external event against which the AI measures can be validated (Section 5.1).
4. Data and Methodology
4.1. Sample and Data Sources
The population is all original annual business reports filed by KOSPI-listed firms for fiscal years 2016–2025. We downloaded the full text of the reports from the Korea Exchange’s disclosure system (KIND), which publishes the same documents as DART, and kept the earliest original filing for each firm-year, excluding amendments. Financial statement data come from the OpenDART bulk financial statements, consolidated where available. Financial firms are excluded because banks, insurers and securities firms report in separate formats. Daily prices, trading volumes and corporate actions through 23 October 2026 come from Yahoo Finance. We reconstruct unadjusted year-end prices from split-adjusted prices and reconcile them with the monthly high and low prices reported in each business report. The numbers of common and preferred shares outstanding come from the share-count table of the report, and the ownership of the largest shareholder and its related parties from the shareholder chapter. Of the 7,370 reports processed, 7,278 firm-year reports of 808 non-financial KOSPI firms have at least 50 narrative sentences and an assigned industry; together they contain 2,835,919 narrative sentences. A usable market value for the valuation tests is available for 6,690 firm-years, 5,410 of them with prices reconciled with the monthly price table in the report. Table 1 shows the sample by fiscal year, together with the mean disclosure measures discussed in Section 5.
We assign each firm to one of the 77 industries of the SASB Sustainable Industry Classification System (SICS), starting from its Korean Standard Industrial Classification (KSIC) code. Because the codes reported in DART follow successive KSIC revisions, we use each firm’s modal three-digit code under the 10th revision (FY2017–FY2023 filings), which keeps industry membership constant over time. The 123 three-digit KSIC codes of the sample firms map to 52 SICS industries (Appendix Table A1). For 732 firms the KSIC code determines the industry directly. The 60 holding companies are assigned to the industry that generates most of their consolidated revenue. The primary annotating model (Claude Opus 5.5; Section 4.3) identified this industry under a written instruction from the overview and business description in a recent report of each company and, where these were uninformative, from well-known information on its main subsidiaries. The 16 firms in mixed KSIC groups, such as cosmetics producers classified under other chemical products, are assigned by name. The difference-in-differences results are similar when holding companies are excluded (Section 5.3). For each SICS industry, the SASB Standards specify which of the 26 general issue categories (GICs) are likely to be financially material (IFRS Foundation, 2023); in our sample, 5.5 of the 26 issues are material for the average industry.
4.2. Text Processing
Each report is divided into chapters and sections, which we classify by their titles: company overview, business description, management’s discussion and analysis (MD&A), auditor, board and governance bodies, officers and employees, related-party transactions and other investor-protection matters. We drop the financial statements, notes, detailed appendix tables, the cover, attachments and all tables, so that the corpus consists of the narrative text written by management. Paragraphs are split into sentences at Korean declarative endings and list markers, and we keep units of 15–600 characters in which at least a quarter of the characters are Hangul. The 7,370 reports contain 2,871,694 sentence instances. Statutory reports repeat boilerplate across firms and years, so we de-duplicate sentences after replacing digits with a placeholder; this leaves 967,755 unique sentences to classify, and every instance inherits the classification of its unique sentence.
4.3. AI Measurement: An LLM-Distilled Classifier on Transformer Embeddings
Figure 1 summarises the measurement pipeline. We describe its four modelling components (representation, semantic anchors, LLM annotation and the distilled classifier) and then the human validation.
Representation. Each unique, digit-normalised sentence is encoded with multilingual-E5-small (Wang et al., 2024), a 12-layer multilingual transformer that produces 384-dimensional embeddings for semantic similarity. Inputs carry the model’s query prefix and are truncated to 96 tokens. To keep the computational cost low, we run an 8-bit quantised version of the model on a central processing unit (CPU); the embeddings are mean-pooled over tokens and normalised to unit length.
Semantic anchors. Following the zero-shot matching approach of Shen et al. (2026), we write a short Korean definition and two or three prototypical disclosure sentences for each of the 26 SASB GICs and for two auxiliary categories outside the SASB taxonomy: corporate governance (board structure, independence, audit committees, executive pay and shareholder rights) and general ESG management (ESG strategy, committees, sustainability reporting and ratings that do not refer to a specific issue). Appendix B gives examples. For each category, the maximum cosine similarity between a sentence and the category’s anchors and the deviation of this similarity from the sentence’s mean similarity across categories enter the classifier as features. Used on their own, the anchors provide a zero-shot benchmark.
LLM annotation. We annotated 7,000 sentences in two rounds. In the first, design-based round, the test set of 1,000 sentences combines 800 sentences drawn uniformly from the 2,871,694 instances with 200 drawn uniformly from instances that contain an ESG keyword, which improves the coverage of less frequent ESG categories. The first training set of 3,000 sentences combines 1,800 keyword-containing sentences stratified across issue categories with 1,200 sentences drawn uniformly. In the second round, an active-learning step added 3,000 training sentences that the first-round classifier labelled with low confidence or assigned to rare categories, drawn in equal numbers from reports for FY2016–FY2019 and FY2020–FY2025. No sentence appears in both the training and the test sets. A large language model (Claude Opus 5.5, Anthropic) labelled each sentence under a written guideline (Appendix B) that defines (i) whether the sentence substantively discusses an ESG issue, (ii) up to two issue categories and (iii) specificity: quantitative or otherwise verifiable (a measured figure, the amount of a fine, a count of incidents or a quantified, time-bound target), concrete qualitative (an identifiable programme, certification, incident, lawsuit or regulation) or generic. Under the guideline, ordinary business, market, financial-risk and boilerplate legal text is non-ESG, and sanctions are classified by the underlying issue. To measure agreement between annotating models, a second, smaller model from the same provider (Claude Sonnet 5.5, Anthropic) labelled 400 randomly chosen test sentences independently under the same guideline. All annotations were produced in October 2026 with the models’ default settings.
Distilled classifier. We fit penalised logistic regressions on the sentence embedding, the anchor-similarity features, section indicators and simple lexical cues: one model for ESG relevance, one-versus-rest models for each of the 28 categories and two specificity models (quantitative; quantitative or concrete), which together classify each ESG sentence as quantitative, concrete qualitative or generic. All 6,000 training sentences are used for fitting. For ESG relevance and the issue categories, five-fold cross-validation selects the regularisation strength and the decision thresholds; for the two specificity models, the regularisation strength is fixed at C = 0.1 and cross-validation selects the thresholds. The selection maximises the F1 score over first-round training sentences, using post-stratification weights for keyword status. A sentence predicted to be ESG-relevant receives up to two categories whose probabilities exceed their thresholds or, if none does, the category with the highest probability relative to its threshold. Combined with the firm’s SICS materiality set, the predicted categories give the materiality classification: a sentence is material if at least one of its categories is material for the firm’s industry and immaterial if it is assigned only to non-material SASB issues. Because the test set over-samples keyword sentences, aggregate test metrics are design-weighted: items are post-stratified by keyword status using the population share of keyword sentences (6.6%), so that precision and recall refer to the population of narrative sentence instances. Category-level F1 scores (Appendix Table A2) are unweighted.
Human validation. Because the reference labels come from a language model, we also check them against human judgement. The two authors coded the same 400 test sentences that the second model labelled, using a coding sheet that showed neither the model labels nor the classifier’s predictions; each sentence received one human label for ESG relevance, up to two issue categories and specificity. The sheet summarised the guideline in Korean but left out some of its rules, notably that descriptions of environmentally oriented products and business lines count as ESG content only when they report environmental performance (Appendix B). We score the classifier, the benchmarks and the primary annotating model against the human labels with the same design weights and report Cohen’s κ between the human labels and the labels of the primary annotating model and of the classifier.
4.4. Disclosure Measures
For each report, the disclosure measures are percentages of narrative sentences. SASB is the share of sentences assigned to any of the 26 SASB issues; MAT and IMM divide these sentences into those that are material and those that are immaterial for the firm’s industry. MAT is further split by specificity into quantitative (MATQ), concrete qualitative (MATC) and generic (MATV) material sentences, so that MAT = MATQ + MATC + MATV. CG and GEN are the shares of corporate-governance and general ESG-management sentences; we analyse them separately because the SASB materiality map does not cover them. We also compute shares by issue and by dimension (environment, social capital, human capital, business model and innovation, leadership and governance). As a benchmark that does not rely on the language model, KW_MAT and KW_IMM count sentences containing a keyword of a material or an immaterial issue from a Korean ESG lexicon (Appendix B). Scaling by the number of narrative sentences separates emphasis from report length, which we control for separately.
4.5. Empirical Models
Regulatory anticipation. We estimate the difference-in-differences model
where D is a disclosure measure; Treat equals one for firms whose consolidated total assets at the end of fiscal year 2019 (the latest audited annual figure available when the roadmap was announced in January 2021) were at least KRW 2 trillion; Post equals one from fiscal year 2021 onward (reports filed from March 2022); and Ann equals one for fiscal year 2020, whose reports were filed two months after the announcement, leaving firms little time to adjust. X contains firm size, leverage, return on assets, a loss indicator, sales growth and tangibility; α and δ are firm and year fixed effects; and standard errors are clustered by firm (Petersen, 2009). The sample consists of the firms with an FY2019 report, for which treatment status is defined. Identification rests on the assumption that, without the roadmap, disclosure in the treatment and comparison groups would have followed parallel trends. We examine this assumption with an event-study version of (1) that interacts Treat with each fiscal year relative to 2019 (Roth et al., 2023) and with three refinements: a bandwidth sample of firms with FY2019 assets between KRW 0.5 and 8 trillion; size-decile-by-year fixed effects or, alternatively, log FY2019 assets interacted with year indicators, which absorb size-related trends; and placebo thresholds and timing. H1 predicts β1 > 0 for the ESG content of the report (SASB and GEN). Under H2a, the response is concentrated in material content, with MAT rising relative to IMM and the material share of SASB-issue sentences rising, and in its specific components MATQ and MATC. Under H2b, it is concentrated in IMM, GEN and generic material statements (MATV).
Firm value. We relate Tobin’s Q to the disclosure measures,
where Q is the market value of common equity plus total liabilities, divided by total assets (Chung & Pruitt, 1994); the disclosure measures are standardised to unit standard deviation; Z contains size, leverage, return on assets, a loss indicator, sales growth, tangibility, cash holdings, the log number of narrative sentences, the ownership of the largest shareholder and a business-group indicator; and μ are industry-by-year fixed effects. We also estimate (2) with firm and year fixed effects, which identify the association from within-firm changes, and in versions that separate the quantitative, concrete and generic components of MAT. H3 predicts β1 > 0 and β1 > β2.
Information environment. We estimate (2) for three outcomes measured over calendar year t+1: idiosyncratic volatility (the annualised standard deviation of residuals from a market model of daily returns on the KOSPI index), illiquidity (the log of one plus the Amihud (2002) ratio of absolute daily return to trading value in KRW billion) and crash risk (the negative conditional skewness of weekly firm-specific returns from a market model with leading and lagged market returns; Chen et al., 2001; Hutton et al., 2009). Each regression also controls for the current-year value of the outcome. Because the market data end on 23 October 2026, calendar year 2026 is incomplete, and we use only complete next-year windows: FY2016–FY2024 reports with outcomes over 2017–2025. FY2025 reports, filed in early 2026, therefore enter the valuation tests but not the information-environment tests, and the disclosure measures are standardised within the information-environment sample. H4 predicts negative coefficients on MAT.
5. Results
5.1. Validity of the AI Measures
Table 2 (Panel A) and Figure 2 show how well the measures reproduce the LLM reference labels on the held-out test set. The distilled classifier identifies ESG-relevant sentences with a design-weighted F1 of 0.83 (95% confidence interval [CI] 0.78–0.88; precision 0.79, recall 0.88, area under the receiver operating characteristic curve [AUC] 0.98); on the 800 uniformly drawn test sentences alone, the unweighted F1 is 0.84. ESG relevance here includes the auxiliary corporate-governance and general ESG-management categories. For sentences on the 26 SASB issues, which are the basis of the materiality measures, the F1 is 0.78 (95% CI 0.69–0.86). Both benchmarks fall well short. A keyword dictionary reaches an F1 of only 0.27 for ESG relevance and 0.39 for SASB issues: it misses most ESG content, which is often written without the standard vocabulary, and it flags many ordinary business sentences that happen to contain a keyword. Zero-shot similarity to the semantic anchors, the method closest to that of Shen et al. (2026), ranks sentences reasonably well (AUC 0.82). At the threshold chosen on the training sample, however, its F1 is only 0.51 (0.20 for SASB issues), partly because ordinary sentences about products, quality and regulation also lie close to the anchors in the embedding space.
Materiality is harder to classify because it combines relevance detection, issue assignment and the industry map. The classifier identifies material ESG sentences with an F1 of 0.66 (95% CI 0.51–0.79) and immaterial ones with an F1 of 0.79; for material sentences, the dictionary reaches 0.41 and the zero-shot benchmark 0.21. When an ESG sentence is detected correctly, its predicted primary issue matches one of the annotated issues in 91% of cases and its ESG dimension in 95%. Across the ten categories with at least five positive test sentences, the median category-level F1 is 0.74 (Appendix Table A2). The classifier also separates quantitative from non-quantitative ESG statements (F1 0.71, compared with 0.52 for a rule based on numeric cues) and specific from generic ones (F1 0.94).
The two annotating models label the sentences consistently. On 400 randomly chosen test sentences, the second model agrees with the primary model on ESG relevance in 97.3% of cases (Cohen’s κ = 0.91), on the primary issue category in 90.9% of the sentences that both models label as ESG-relevant (κ = 0.88), on materiality with κ = 0.92 and on specificity with a weighted κ of 0.91. The distilled classifier agrees with the primary model with κ = 0.80 on ESG relevance and κ = 0.74 on materiality. These values are lower than the agreement between the two models: distillation retains much, but not all, of the information in the reference labels.
Human coding of the same 400 sentences supports the reference labels on ESG relevance but shows that they are conservative on materiality, mainly because of how the guideline treats environmentally oriented products and business lines (Table 2, Panel B). The human labels agree with the primary model on ESG relevance in 96.0% of the sentences (κ = 0.87) and on the primary issue category in 90.1% of the sentences that both label as ESG-relevant. Agreement is lower on materiality (κ = 0.72) and specificity (weighted κ = 0.66). Most specificity disagreements (7 of 12) concern governance sentences that state the number of directors, which the LLM labelled quantitative and the human coders concrete; such sentences do not enter MATQ. Disagreements on relevance and materiality cluster at one boundary of the guideline. Of the 11 sentences that only the human coders treated as ESG-relevant, nine were coded under product design and lifecycle management or business model resilience, and most of them describe environmentally oriented products and business lines, such as eco-friendly vehicle parts, electrification investment, and renewable-energy or recycling businesses. The guideline treats such sentences as business description unless the firm reports its own environmental performance. The same two categories account for eight of the 11 sentences that only the human coders treated as material. Because the coding sheet did not restate this rule (Section 4.3), these disagreements reflect the human coders’ broader definition of ESG content rather than errors in applying the guideline.
Against the human coding, the classifier detects ESG-relevant sentences with an F1 of 0.84 (95% CI 0.76–0.90), close to its performance against the LLM labels, and SASB-issue sentences with an F1 of 0.72. For material sentences, its precision stays high (0.82) but its recall is low (0.44; F1 0.57), and the same holds for the primary LLM annotator. The sample contains only five sentences that the human coders labelled quantitative, too few to evaluate the quantitative classifier; in separating specific from generic ESG sentences, the classifier reaches an F1 of 0.92. The dictionary and zero-shot benchmarks are far less accurate on every task. In the design-weighted validation sample, material sentences make up 66% of SASB-issue sentences in the human coding (95% CI 48%–81%) but 45% in the classifier’s output. If the nine product and business-line sentences are recoded as non-ESG, as the guideline prescribes for most of them, the recall of the primary LLM annotator on material sentences rises from 0.57 to 0.81, that of the classifier rises from 0.44 to 0.62 (F1 0.71), and the human-coded material share of SASB-issue sentences falls to 59%. The measures therefore understate the level of material content, partly because of a boundary choice in the guideline, but most sentences that they classify as material are material in the human coding as well.
The measures also separate groups whose disclosure should differ (Table 3). Firms that state in their reports that they are controlled entities under the GHG and energy target management scheme or allocated entities under the emissions trading scheme devote 0.78 percentage points more of their narrative sentences to GHG emissions, and 0.60 points more to energy management, than other firms in the same industry and year (both p < 0.001); their mean GHG share (1.52%) is about three and a half times that of other firms (0.44%). The share of sentences on employee health and safety rose from 0.11% in FY2020 reports to 0.17% in FY2021 reports, the first filed after the Serious Accidents Punishment Act took effect, and to 0.21% by FY2025. Over FY2021–FY2025, it rose by 0.048 percentage points more (p = 0.07) in industries for which the SASB Standards deem health and safety material than in other industries.
5.2. What Korean Business Reports Disclose
Financially material ESG content is a small but slowly growing part of Korean statutory reports (Table 1, Table 4 and Figure 3). On average, 3.38% of narrative sentences address one of the 26 SASB issues; the share rose from 2.78% in FY2016 to 4.37% in FY2025, while the average report grew from 327 to 446 narrative sentences. In the classifier’s output, material sentences account for 46% of SASB-issue sentences. This figure is conservative: the human coding of the validation sample puts the share at 66%, or 59% under the guideline’s business-line rule (Section 5.1). Material sentences rose from 1.27% to 1.90% of the narrative, and immaterial sentences from 1.51% to 2.47%. Quantitative material disclosure is rare. Only 10.4% of material sentences are quantitative, slightly fewer than among immaterial sentences (12.2%), and the share of reports with at least one quantitative material sentence rose only from 22% to 30%. General statements about ESG management doubled, from 0.33% to 0.68% of narrative sentences. Corporate-governance content, concentrated in the board chapter, is far more voluminous (10.8% on average) and grew less in relative terms, from 9.8% to 10.9%.
The mix of issues changed as well. GHG emissions (15.0% of issue assignments), energy management (10.6%), the legal and regulatory environment (8.5%), business ethics (8.5%), product quality and safety (8.1%) and waste and hazardous materials (8.0%) are the issues discussed most often. Human capital grew fastest: its share of issue assignments rose from 8% in FY2016 to 18% in FY2025, driven by labour practices and by employee engagement and diversity, including new workforce disclosures such as parental leave and flexible work. The social-capital share fell from 19% to 12%, and environmental issues remained the largest dimension (36% in FY2025).
Disclosure emphasis follows the SASB materiality map only in part (Figure 4). Emission-intensive industries such as iron and steel, chemicals, construction materials, and pulp and paper concentrate on GHG emissions and energy, which the map treats as material for them. Yet firms in several industries for which the SASB Standards do not list GHG emissions as material, such as auto parts, hardware, and household and personal products, also devote much of their ESG narrative to the issue. Across industries, the share of SASB-issue sentences that are material ranges from 5% to 77%. The AI measures are correlated with their dictionary counterparts (Pearson r = 0.70 for material and 0.66 for immaterial disclosure), but the validation results show that the dictionary measures contain far more classification error.
5.3. Regulatory Anticipation
Table 5 reports the difference-in-differences estimates. Of the 725 firms with an FY2019 report, 171 had consolidated assets of at least KRW 2 trillion; the estimation sample comprises 6,747 firm-years of 719 firms (170 of them targeted) with complete controls. After the 2021 roadmap, targeted firms raised the share of narrative sentences devoted to SASB issues by 0.80 percentage points relative to other KOSPI firms (p < 0.01), about 18% of their pre-announcement mean (Panel A). Material content rose by 0.51 points (p < 0.01; 27%) and immaterial content by 0.29 points (p = 0.09; 11%). The difference between the two (0.22 points, standard error 0.20) is not statistically significant, and neither is the change in the material share of SASB-issue sentences (0.5 percentage points, standard error 1.6). ESG content thus expanded broadly, without a significant shift in its composition towards material issues.
Panel B splits material content by specificity. Quantitative material disclosure rose by 0.10 points (p = 0.02; 44% of a low pre-announcement mean), concrete qualitative material disclosure by 0.28 points (p < 0.01; 22%) and generic material disclosure by 0.13 points (p < 0.01; 33%). General ESG-management statements increased by 0.28 points (46%), corporate-governance content did not change significantly, and targeted firms’ reports became about 11% longer. The FY2020 coefficients compare reports filed two months after the announcement with the FY2016–FY2019 average. They are significantly positive for general ESG statements (p = 0.01), generic material statements (p = 0.01) and report length, but not for specific material content.
The event-study estimates in Figure 5 show that these responses differ in timing and in their pre-announcement trends. For quantitative material disclosure, the pre-announcement coefficients are flat (mean 0.004 relative to FY2019), the coefficients rise from FY2021 onward, and the average post-announcement effect relative to FY2019 is 0.11 points (standard error 0.04). For material disclosure as a whole, the pre-announcement coefficients are not jointly significant (F-test p = 0.18) but all negative (mean −0.12), which suggests that targeted firms’ material disclosure was already rising somewhat faster before the announcement; the average post-announcement effect relative to FY2019 is 0.42 points (standard error 0.12). The immaterial response peaks in FY2023 and falls to 0.04 points by FY2025. General ESG statements were already rising faster among large firms before the announcement (pre-trend p = 0.004) and declined after FY2023. The material response outlasted the postponement of October 2023: the coefficient for FY2023–FY2025 (0.56) is larger than that for FY2021–FY2022 (0.43), and the same holds for the quantitative component (0.12 against 0.07). By report section, the material response appears in the business description (0.27 points), MD&A (0.12) and, at the 10% level, other investor-protection matters (0.14), but not in the governance or employee chapters. By dimension, it is concentrated in environmental issues (0.39 points of material content), with smaller contributions from business model and innovation (0.09) and human capital (0.06); the contributions of social capital and of leadership and governance are close to zero.
Table 6 reports robustness checks. The material response is similar without controls, with report length as a control and without holding companies, and it remains significant in a bandwidth sample of firms with FY2019 assets between KRW 0.5 and 8 trillion (0.36, p = 0.04). At a placebo threshold of KRW 1 trillion among smaller firms, material disclosure shows no comparable increase (0.02, standard error 0.13); the KRW 5 trillion placebo among larger firms is too imprecise to be informative, and a placebo announcement in FY2018 produces no significant estimate. General ESG statements, by contrast, also rise at the KRW 1 trillion threshold (0.17, p = 0.03), which points to a size gradient, although their increase survives the linear pre-trend adjustment (0.31, p < 0.01). Three specifications allow for differential trends: size-decile-by-year fixed effects, log FY2019 assets interacted with year indicators, and the deviation of the event-study coefficients from a linear extrapolation of their pre-announcement path. They give material coefficients of 0.29, 0.23 and 0.29 and quantitative coefficients of 0.11, 0.09 and 0.10. The quantitative point estimates are stable, but the standard errors rise considerably, and none of these estimates is significant at conventional levels. Because treatment is defined by size, the first two specifications leave little identifying variation. The anticipation effect is therefore imprecisely identified. Dictionary-based measures rise by similar amounts for material and immaterial keyword sentences (0.62 and 0.54 points) and cannot separate specific from generic statements.
5.4. Firm Value and the Information Environment
The valuation results do not support H3 (Table 7). With industry-by-year fixed effects, a one-standard-deviation increase in material ESG disclosure is associated with a change in log Tobin’s Q of −0.001 (standard error 0.013); the 95% confidence interval rules out associations larger than about 2.6% of Q in either direction. Neither quantitative nor concrete material disclosure is significantly related to valuation (columns 2 and 5). Across firms, immaterial disclosure (columns 1 and 2), general ESG statements and corporate-governance content (column 3) are positively associated with Q. With firm and year fixed effects, the associations for immaterial content and general statements disappear, while corporate-governance content remains positively associated with Q (0.022, p = 0.03; column 6) and the material coefficient is small and at most marginally significant (0.014, p = 0.12, column 4; 0.017, p = 0.07, column 6). Within firms, the generic component of material disclosure is positively associated with Q (0.023, p = 0.007; column 5), but not across firms. The dictionary measures are not significantly related to valuation (column 7). The material coefficient also stays small and insignificant when Q is measured in levels, when size-quintile-by-year fixed effects are added, when disclosure is lagged by one year, when the sample is limited to FY2021–FY2025 or to firm-years with prices reconciled with the report, when firms with a non-December fiscal year-end are dropped, when firms with assets of at least KRW 2 trillion are allowed a separate slope, and when material disclosure is measured as the material share of SASB-issue sentences (Appendix Table A4).
The information-environment results give limited support for H4 (Table 8). In the complete-year sample of FY2016–FY2024 reports, with controls for current-year outcomes, firm characteristics and industry-by-year fixed effects, material disclosure is not significantly associated with next-year idiosyncratic volatility or crash risk. It is associated with slightly lower next-year illiquidity: a one-standard-deviation increase in material disclosure is associated with a change in ILLIQ of −0.0063 (standard error 0.0030, p = 0.04), about 2% of a standard deviation of ILLIQ. The coefficient remains negative and significant with firm and year fixed effects (−0.0132, p = 0.02), without the lagged dependent variable and without firms whose fiscal year does not end in December (Appendix Table A5). The association is not specific to material content, however. Immaterial disclosure has a smaller negative coefficient (−0.0037, standard error 0.0029) that does not differ significantly from the material coefficient (p = 0.57); none of the quantitative, concrete and generic components is significant on its own; the total share of SASB-issue sentences and the dictionary measure show stronger associations; and the material coefficient loses significance once general ESG and governance statements are controlled for (−0.0054, p = 0.11). When FY2025 reports are added, with outcomes measured over the available trading days of 2026, the coefficient is smaller and insignificant (−0.0050, p = 0.17).
6. Discussion
6.1. Anticipatory Disclosure and Its Composition
The evidence supports H1 in the baseline specification but does not clearly distinguish between H2a and H2b. Targeted firms disclosed more about issues that are material for their industries: quantitative and concrete material disclosure rose by 44% and 22% of their pre-announcement means. They also added generic material statements and general ESG-management statements, however, and their immaterial content rose for a time (0.29 points, p = 0.09), so the material share of their SASB-issue content did not change significantly. ESG content in statutory reports expanded broadly and came to include more specific information, but disclosure did not shift clearly towards material issues.
The parts of this expansion behaved differently over time. General ESG statements, which legitimacy theory associates with impression management, were already rising faster among large firms before the announcement, rose at a placebo threshold as well and declined after FY2023. The immaterial response had faded by FY2025. Material and quantitative material disclosure, by contrast, kept growing after the mandate was postponed in October 2023. One possible explanation is that preparing for mandatory disclosure requires fixed investments in data collection, internal controls and drafting routines, which continue to shape later reports. Firms may also be reluctant to cut back disclosure once investors expect it, because withholding may be read unfavourably (Verrecchia, 1983; Dye, 1985). Continued anticipation offers another explanation: the postponement changed the timing of the obligation, not its prospect, and the KSSB exposure drafts followed in 2024. The material response was led by environmental issues and appeared in the business description and MD&A. This fits the climate-first orientation of the standards that firms expected and the finding that Japanese prime-market firms facing climate-disclosure expectations increased their environmental emphasis more than other firms (Shen et al., 2026).
The increase was small in absolute terms, and its size depends on the identification assumptions. For a targeted firm whose report has the average post-announcement length (748 narrative sentences), the estimates imply roughly 4 additional material sentences, fewer than one of them quantitative. In FY2025, 34% of targeted firms’ reports still contained no quantitative statement on any material issue. At the KRW 1 trillion placebo threshold, smaller firms show no comparable increase in material disclosure, which fits a response to the expected KRW 2 trillion threshold better than a smooth size gradient. Treatment is defined by size, however, and specifications that allow flexibly for size-related or pre-existing trends give smaller or similar estimates that are not statistically significant. Quantitative material disclosure behaves most consistently: its pre-announcement coefficients are flat and its estimated response changes little across specifications. Even this estimate loses significance under flexible trend controls.
6.2. Interpreting the Capital-Market Results
The valuation tests do not support H3, and the information-environment tests support H4 only weakly. In the baseline valuation specification, the confidence interval rules out associations larger than about 2.6% of Q in either direction for a one-standard-deviation difference in material disclosure, and no robust association appears in the alternative specifications (Appendix Table A4). Material disclosure is associated with slightly lower illiquidity in the following year, but this association does not differ significantly from that of immaterial disclosure and is stronger for total SASB-issue and dictionary-measured content; volatility and crash risk are not significantly associated with material disclosure. Four explanations, which are not mutually exclusive, could account for the absence of a market association specific to material content.
First, statutory narratives may repeat what investors already know. The firms whose disclosure changed most are the largest, and nearly two-thirds of them also publish a voluntary sustainability report (Park, 2025); investors who read those reports may learn little from the discussion of the same issues in the business report. Second, specific statements may not be comparable when they appear in an unstandardised narrative. Neither quantitative nor concrete material disclosure has a robust valuation association, and the generic component is associated with Q only within firms (Table 7, column 5), even though specific risk disclosures elicit stronger investor responses than boilerplate in other settings (Hope et al., 2016). Figures reported in different formats and scattered across chapters are hard to compare, which suggests a role for standardised, industry-based metrics. Third, disclosure emphasis mixes exposure with transparency. Firms designated under the GHG and energy target management scheme or the emissions trading scheme devote about three and a half times as much of their narrative to GHG emissions as other firms (1.52% against 0.44%), or 0.78 percentage points more within the same industry and year. If exposure lowers value while transparency raises it, as Matsumura et al. (2014) find for carbon emissions and their disclosure, the two effects may offset each other; separating them would require performance data that we do not use. Fourth, prices reflect investors’ preferences and perceived risks (Pástor et al., 2021). Grewal et al. (2021) find that the informativeness benefits of material sustainability disclosure are larger where institutional investors and socially responsible funds hold more shares. In Korea, where corporate governance is a documented driver of valuation (Black et al., 2006), sustainability information may receive less attention. In line with this view, corporate-governance content is associated with Q both across and within firms. We do not test investor attention or the other mechanisms directly.
These results qualify the evidence from the United States rather than contradict it. Khan et al. (2016) study performance on material issues, not the amount of discussion devoted to them, and the informativeness gains documented by Grewal et al. (2021) depend on the investor base. Krueger et al. (2024) find that ESG disclosure mandates improve stock liquidity, especially when governments implement and enforce them. The small liquidity association we find extends to ESG content in general rather than to material content in particular. It may reflect a broader information or visibility effect of ESG narrative, whereas the benefits documented for mandates may require standardised metrics, enforcement and assurance once a mandate is in force. Our results suggest that materiality-specific capital-market benefits need not appear during the anticipation period, when material ESG content in statutory narratives is still sparse, mostly qualitative and unstandardised.
6.3. Implications for Measurement, Standard Setting and Practice
Dictionary counts, still a common measure of ESG disclosure, missed much of the ESG content identified by the LLM reference labels and by the human coders, and they often mistook sustainability vocabulary for substantive discussion. Zero-shot semantic matching ranked sentences reasonably well but, at a single threshold, did not separate ESG content well from related business language. The distilled classifier agreed far more closely with the held-out reference labels than either benchmark, at little computational cost: after a one-off annotation of 7,000 sentences, embedding the 967,755 unique sentences took a few hours on a two-core CPU, and classification took minutes. The method thus offers a practical way to classify large corpora and to separate quantitative, concrete qualitative and generic disclosure. The human validation confirms these gains for ESG relevance and SASB issues, but it also shows that LLM reference labels inherit the boundary choices of their guideline: the human coders classified more product and business-line sentences as material, and the classifier, like the model it learned from, is precise but conservative on materiality. Stating such boundary rules explicitly and checking them against human judgement matter as much as model accuracy.
Two of the results are relevant for standard setters. The KSSB standards require climate-related disclosure but leave industry-based metrics and other sustainability topics optional (Samil PwC, 2026). In the baseline estimates, ESG content expanded broadly during the anticipation period, yet the added material disclosure was mostly qualitative, and reports gave considerable space to issues classified as immaterial for the industry while often discussing material issues without figures. Industry-based metrics could address this lack of specificity, although our analysis does not estimate the effect of requiring them. The final roadmap also brings sustainability disclosure into the business report from 2028, with liability relief in the first years and third-party assurance from 2030 (FSC, 2026). The absence of a robust valuation association today provides a baseline against which the value relevance of the mandated disclosures can later be judged.
Supervisors and investors can use the pipeline as an inexpensive screening tool. Applied to annual filings, it shows whether firms discuss the issues classified as material for their industries and whether they back that discussion with figures, which can help direct supervisory review and investor engagement towards reports that say little about material issues. Because of classification error and the coarseness of industry-level materiality, flagged reports still need to be read by an informed reviewer.
6.4. Limitations and Future Research
The study has several limitations, each of which points to further work. First, the training labels come from an LLM, and the main evaluation (Panel A of Table 2) uses labels from the model whose judgements the classifier approximates; because the second annotator belongs to the same model family, agreement between the two models may partly reflect shared conventions. The human coding of 400 sentences addresses this concern only in part. Each sentence received a single human label, so agreement between human coders cannot be estimated; the coding sheet left out several of the guideline’s rules (Appendix B), most importantly the rule on environmentally oriented products and business lines; and the sample contains few sentences on rare issue categories and few quantitative statements. The human coding also suggests that the material measures understate material content on business-model issues. If targeted firms expanded such descriptions, and if these count as material disclosure, the anticipation response in material content is understated as well. The design-weighted metrics also only approximate population-level performance, because post-stratification by keyword status does not adjust for the category-stratified sampling of the training sentences used to select thresholds or for the de-duplication of sampled sentences. Second, materiality is assigned at the industry level following the SASB Standards. Firms with several business lines, holding companies in particular, may face material issues that their assigned industry does not cover, and the SASB map reflects investor-oriented judgements developed largely for US markets. Third, the measures capture emphasis and specificity, not whether the reported information is accurate or how well firms perform on sustainability issues. Without third-party ESG ratings or emissions data, we cannot tell whether firms that discuss material issues more also perform better on them. Nor do the measures cover voluntary sustainability reports or corporate websites. Fourth, treatment in the anticipation design is defined by firm size. Other rules use the same KRW 2 trillion threshold, among them corporate-governance reporting since 2019 and the board gender-composition requirement of the Capital Markets Act since August 2022. These rules concern governance, for which we find no significant disclosure response, but they complicate identification. A more direct concern is that the estimated response is sensitive to flexible controls for size-related and pre-existing trends; methods that bound the consequences of violations of parallel trends (Roth et al., 2023) could examine this sensitivity further. Fifth, the valuation and information-environment tests estimate associations. The absence of materiality-specific associations may reflect offsetting exposure and transparency effects rather than an absence of relevant information, and the small liquidity association may reflect firm characteristics that the controls do not capture. The information-environment tests also omit FY2025 reports, whose next-year window, calendar year 2026, was incomplete when the market data were collected; re-estimating them once 2026 is complete will add a year of post-announcement outcomes. Finally, the sample ends with FY2025 reports, before mandatory sustainability disclosure begins. Applying the pipeline to the 2028 filings could show whether mandated, standardised disclosure changes the materiality, specificity and value relevance of what firms report; applications to other countries with statutory annual reports, such as Japan, would test how far the findings generalise.
7. Conclusions
Financially material ESG information makes up a small, slowly growing and mostly qualitative part of what Korean firms report in their statutory business reports. We reach this conclusion by applying an LLM-distilled classifier to ten years of filings and by checking its classifications against held-out LLM labels and blind human coding; the human coding indicates that the measures understate the level of material content. In the baseline estimates, the firms expected to be covered first expanded the ESG content of their reports after the 2021 roadmap, including material and quantitative material content, mainly on environmental issues. The composition of their SASB-issue disclosure did not change significantly, and material disclosure kept increasing after the mandate was postponed, although the estimates lose statistical significance when trends are controlled flexibly. Material disclosure has no robust association with firm value. In tests restricted to complete next-year windows, it is not significantly associated with volatility or crash risk; it is associated with slightly lower illiquidity, but ESG content as a whole shows a stronger association of the same kind.
For researchers, the study shows how LLMs can serve as annotators whose labels are validated and then distilled into transparent classifiers for large corpora of financial text. The classifier clearly outperforms dictionary and zero-shot benchmarks against both LLM reference labels and human coding, and it separates specific from generic disclosure. The human coding also shows why the boundary choices behind LLM labels need to be checked against human judgement. For policymakers, the baseline findings suggest that firms change their disclosure before an announced mandate takes effect, but more text does not by itself mean more decision-useful information. As Korea prepares to bring sustainability disclosure into the business report from 2028, industry-based metrics and assurance could help remedy the lack of quantitative information documented here. The same pipeline can then show whether the mandated disclosures improve materiality and specificity and whether such improvements are associated with market outcomes.
Author Contributions
Conceptualization, Y.-C.L.; methodology, Y.-C.L.; software, Y.-C.L.; validation, Y.-C.L. and C.Y.; formal analysis, Y.-C.L.; investigation, Y.-C.L.; data curation, Y.-C.L. and C.Y.; writing—original draft preparation, Y.-C.L.; writing—review and editing, Y.-C.L. and C.Y.; visualization, Y.-C.L.; supervision, Y.-C.L.; project administration, Y.-C.L. All authors have read and agreed to the published version of the manuscript.
Funding
This research received no external funding.
Institutional Review Board Statement
Not applicable.
Informed Consent Statement
Not applicable.
Data Availability Statement
The business reports analysed in this study are publicly available from DART (https://dart.fss.or.kr) and KIND (https://kind.krx.co.kr), financial statement data from OpenDART (https://opendart.fss.or.kr) and daily market data, through 23 October 2026, from Yahoo Finance (https://finance.yahoo.com). The annotation guideline, the semantic anchors, the ESG lexicon, the industry mapping, the list of analysed reports, the code and fitted classifier parameters, the annotated sentence sample, the human validation sample and the derived firm-year disclosure measures are available from the corresponding author upon reasonable request.
Acknowledgments
During the preparation of this study, the authors used Claude Opus 5.5 (Anthropic) to annotate the sentence sample (Section 4.3), to identify the dominant business of holding companies (Section 4.1) and, under the authors’ direction, to assist with data-collection and analysis code, drafting and language editing; Claude Sonnet 5.5 (Anthropic) served as the second annotator (Section 4.3). OpenAI Codex (OpenAI) was used to assist with language editing and consistency checks. The authors have reviewed and edited all outputs and take full responsibility for the content of this publication.
Conflicts of Interest
The authors declare no conflicts of interest.
Abbreviations
The following abbreviations are used in this manuscript:
| AI | Artificial intelligence |
| AUC | Area under the receiver operating characteristic curve |
| CG | Corporate governance (auxiliary issue category) |
| CI | Confidence interval |
| CPU | Central processing unit |
| CSR | Corporate social responsibility |
| DART | Data Analysis, Retrieval and Transfer System (Financial Supervisory Service) |
| DiD | Difference-in-differences |
| ESG | Environmental, social and governance |
| FE | Fixed effects |
| FSC | Financial Services Commission |
| FY | Fiscal year |
| GEN | General ESG management (auxiliary issue category) |
| GHG | Greenhouse gas |
| GIC | SASB general issue category |
| IFRS | International Financial Reporting Standards |
| ILLIQ | Illiquidity: ln(1 + Amihud ratio) |
| IMM | Immaterial SASB-issue sentences (% of narrative sentences) |
| IVOL | Idiosyncratic volatility |
| KIND | Korea Investor’s Network for Disclosure System (Korea Exchange) |
| KOSPI | Korea Composite Stock Price Index (main board) |
| KRW | Korean won |
| KSIC | Korean Standard Industrial Classification |
| KSSB | Korea Sustainability Standards Board |
| KW_MAT, KW_IMM | Dictionary-based shares of material and immaterial SASB-issue sentences |
| LLM | Large language model |
| MAT | Financially material SASB-issue sentences (% of narrative sentences) |
| MATC | Material, concrete qualitative sentences (% of narrative sentences) |
| MATQ | Material and quantitative sentences (% of narrative sentences) |
| MATV | Material, generic sentences (% of narrative sentences) |
| MD&A | Management’s discussion and analysis |
| NCSKEW | Negative conditional skewness of firm-specific returns |
| ROA | Return on assets |
| SASB | Sustainability Accounting Standards Board |
| SICS | Sustainable Industry Classification System |
Appendix A. Industry Mapping, Issue Categories, Variable Definitions and Additional Tests

Table A1.
SASB industries (SICS) in the sample and their financially material issues.
| SICS industry | Firms | Firm-years | Material general issue categories |
| Advertising & Marketing (SV-AD) | 3 | 29 | S2, S7, H3 |
| Aerospace & Defense (RT-AE) | 4 | 40 | E3, E5, S3, S5, B1, B4, G1 |
| Agricultural Products (FB-AG) | 11 | 110 | E1, E3, E4, S5, H2, B3, B4 |
| Air Freight & Logistics (TR-AF) | 12 | 116 | E1, E2, H1, H2, B3, G4 |
| Airlines (TR-AL) | 7 | 65 | E1, H1, G2, G4 |
| Alcoholic Beverages (FB-AB) | 5 | 49 | E3, E4, S7, B1, B3, B4 |
| Apparel, Accessories & Footwear (CG-AA) | 30 | 280 | S5, B3, B4 |
| Appliance Manufacturing (CG-AM) | 3 | 29 | S5, B1 |
| Auto Parts (TR-AP) | 51 | 487 | E3, E5, S5, B1, B4, G2 |
| Automobiles (TR-AU) | 4 | 39 | S5, H1, B1, B4 |
| Biotechnology & Pharmaceuticals (HC-BP) | 52 | 479 | S1, S4, S5, S7, H3, B3, G1 |
| Building Products & Furnishings (CG-BF) | 14 | 122 | E3, S5, B1, B4 |
| Car Rental & Leasing (TR-CR) | 9 | 46 | S5, B1 |
| Casinos & Gaming (SV-CA) | 4 | 32 | E3, S6, G1 |
| Chemicals (RT-CH) | 70 | 651 | E1, E2, E3, E4, E5, S1, H2, B1, G3, G4 |
| Construction Materials (EM-CM) | 26 | 227 | E1, E2, E3, E4, E5, E6, H2, B1, G2 |
| Containers & Packaging (RT-CP) | 25 | 245 | E1, E2, E3, E4, E5, S5, B1, B3 |
| E-Commerce (CG-EC) | 2 | 15 | E3, S2, S3, H3, B1 |
| Education (SV-ED) | 3 | 30 | S3, S5, S7 |
| Electric Utilities & Power Generators (IF-EU) | 3 | 30 | E1, E2, E4, E5, S4, H2, B1, G4, G5 |
| Electrical & Electronic Equipment (RT-EE) | 24 | 211 | E3, E5, S5, B1, B4, G1 |
| Electronic Manufacturing Services & ODM (TC-ES) | 24 | 208 | E4, E5, H1, H2, B1, B4 |
| Engineering & Construction Services (IF-EN) | 46 | 381 | E6, S5, H2, B1, B2, G1 |
| Food Retailers & Distributors (FB-FR) | 5 | 46 | E1, E3, E5, S3, S5, S6, S7, H1, B3 |
| Fuel Cells & Industrial Batteries (RR-FC) | 8 | 56 | E3, H2, B1, B4 |
| Gas Utilities & Distributors (IF-GU) | 10 | 93 | S4, B1, G4 |
| Hardware (TC-HW) | 13 | 107 | S3, H3, B1, B3, B4 |
| Hotels & Lodging (SV-HL) | 3 | 30 | E3, E4, E6, H1, B5 |
| Household & Personal Products (CG-HP) | 13 | 113 | E4, S5, B1, B4 |
| Industrial Machinery & Goods (RT-IG) | 57 | 519 | E3, H2, B1, B4 |
| Internet Media & Services (TC-IM) | 10 | 92 | E3, S2, S3, H3, G2 |
| Iron & Steel Producers (EM-IS) | 39 | 350 | E1, E2, E3, E4, E5, H2, B3 |
| Leisure Facilities (SV-LF) | 1 | 10 | E3, S6, H3 |
| Marine Transportation (TR-MT) | 6 | 50 | E1, E2, E6, H2, G1, G4 |
| Meat, Poultry & Dairy (FB-MP) | 4 | 36 | E1, E3, E4, E6, S5, H2, B3, B4 |
| Media & Entertainment (SV-ME) | 14 | 122 | S7, G2 |
| Medical Equipment & Supplies (HC-MS) | 4 | 24 | S4, S5, S7, B1, B3, G1 |
| Metals & Mining (EM-MM) | 15 | 149 | E1, E2, E3, E4, E5, E6, S1, H1, H2, G1, G4 |
| Multiline and Specialty Retailers & Distributors (CG-MR) | 60 | 552 | E3, S3, H1, H3, B1 |
| Non-Alcoholic Beverages (FB-NB) | 1 | 10 | E1, E3, E4, S6, S7, B1, B3, B4 |
| Oil & Gas – Refining & Marketing (EM-RM) | 10 | 90 | E1, E2, E4, E5, H2, B1, G2, G3, G4 |
| Processed Foods (FB-PF) | 31 | 297 | E3, E4, S5, S6, S7, B1, B3, B4 |
| Professional & Commercial Services (SV-PS) | 6 | 46 | S3, H3, G1 |
| Pulp & Paper Products (RR-PP) | 11 | 104 | E1, E2, E3, E4, B3 |
| Real Estate (IF-RE) | 13 | 99 | E3, E4, B1, B5 |
| Restaurants (FB-RN) | 1 | 10 | E3, E4, E5, S5, S6, H1, B3 |
| Road Transportation (TR-RO) | 2 | 20 | E1, E2, H1, H2, G4 |
| Semiconductors (TC-SC) | 13 | 105 | E1, E3, E4, E5, H2, H3, B1, B4, G2 |
| Software & IT Services (TC-SI) | 19 | 157 | E3, S2, S3, H3, G2, G5 |
| Telecommunication Services (TC-TL) | 4 | 40 | E3, S2, S3, B1, G2, G5 |
| Tobacco (FB-TB) | 1 | 10 | S6, S7 |
| Toys & Sporting Goods (CG-TS) | 2 | 20 | S5, B3 |
Notes: Material issues follow the disclosure topics of the SASB Standards for each industry, mapped to the 26 general issue categories (codes in Table A2). Firms are assigned through their modal three-digit KSIC (revision 10) code (732 firms); 60 holding companies are assigned through their dominant business and 16 firms in mixed KSIC groups by name (Section 4.1).
Table A2.
Issue categories, annotation counts and test-set performance of the category classifiers.
| Code | Issue category | Dimension | Training labels | Test positives | Test F1 |
| E1 | GHG Emissions | Environment | 286 | 24 | 0.82 |
| E2 | Air Quality | Environment | 115 | 4 | — |
| E3 | Energy Management | Environment | 209 | 12 | 0.67 |
| E4 | Water & Wastewater Management | Environment | 128 | 8 | 0.71 |
| E5 | Waste & Hazardous Materials Management | Environment | 221 | 14 | 0.75 |
| E6 | Ecological Impacts | Environment | 61 | 0 | — |
| S1 | Human Rights & Community Relations | Social capital | 70 | 3 | — |
| S2 | Customer Privacy | Social capital | 92 | 1 | — |
| S3 | Data Security | Social capital | 39 | 3 | — |
| S4 | Access & Affordability | Social capital | 5 | 0 | — |
| S5 | Product Quality & Safety | Social capital | 109 | 4 | — |
| S6 | Customer Welfare | Social capital | 10 | 0 | — |
| S7 | Selling Practices & Product Labeling | Social capital | 53 | 4 | — |
| H1 | Labor Practices | Human capital | 128 | 3 | — |
| H2 | Employee Health & Safety | Human capital | 162 | 6 | 0.73 |
| H3 | Employee Engagement, Diversity & Inclusion | Human capital | 62 | 3 | — |
| B1 | Product Design & Lifecycle Management | Business model & innovation | 127 | 12 | 0.53 |
| B2 | Business Model Resilience | Business model & innovation | 53 | 4 | — |
| B3 | Supply Chain Management | Business model & innovation | 37 | 1 | — |
| B4 | Materials Sourcing & Efficiency | Business model & innovation | 17 | 2 | — |
| B5 | Physical Impacts of Climate Change | Business model & innovation | 21 | 1 | — |
| G1 | Business Ethics | Leadership & governance | 137 | 6 | 0.77 |
| G2 | Competitive Behavior | Leadership & governance | 159 | 4 | — |
| G3 | Management of the Legal & Regulatory Environment | Leadership & governance | 138 | 16 | 0.61 |
| G4 | Critical Incident Risk Management | Leadership & governance | 76 | 3 | — |
| G5 | Systemic Risk Management | Leadership & governance | 15 | 0 | — |
| CG | Corporate governance (auxiliary) | — | 459 | 67 | 0.88 |
| GEN | General ESG management (auxiliary) | — | 221 | 20 | 0.74 |
Notes: Training labels count sentences annotated with the category in the training set (first round and active-learning round). Test F1 is reported for categories with at least five positive test sentences (unweighted).
Table A3.
Variable definitions.
| Variable | Definition | Source |
| SASB | Share of narrative sentences (%) assigned to at least one of the 26 SASB general issue categories | Business report; AI classifier |
| MAT | Share of narrative sentences (%) assigned to at least one issue that is financially material for the firm’s SICS industry | Business report; AI classifier; SASB Standards |
| IMM | Share of narrative sentences (%) assigned only to SASB issues that are not material for the firm’s industry | As above |
| MATQ | Share of narrative sentences (%) that are material and quantitative (measured figure, amount, count or quantified target) | As above |
| MATC | Share of narrative sentences (%) that are material and concrete but not quantitative (identifiable programme, certification, incident, lawsuit or regulation) | As above |
| MATV | Share of narrative sentences (%) that are material and generic; MAT = MATQ + MATC + MATV | As above |
| GEN | Share of narrative sentences (%) on general ESG management (strategy, committees, reporting, ratings) | AI classifier |
| CG | Share of narrative sentences (%) on corporate governance (board, audit committee, executive pay, shareholder rights) | AI classifier |
| KW_MAT, KW_IMM | Dictionary counterparts of MAT and IMM: sentences containing a keyword of a material (immaterial) issue | Korean ESG lexicon |
| N | Number of narrative sentences in the report | Business report |
| Tobin’s Q | (Market value of common equity + total liabilities) / total assets at fiscal year-end | OpenDART; Yahoo Finance; business report |
| IVOL t+1 | Annualised standard deviation of residuals from a market model of daily returns on the KOSPI index, calendar year t+1 (complete years only: FY2016–FY2024 reports) | Yahoo Finance |
| ILLIQ t+1 | ln(1 + mean of |daily return| / daily trading value in KRW billion), calendar year t+1 (complete years only) | Yahoo Finance |
| NCSKEW t+1 | Negative conditional skewness of weekly firm-specific returns from a market model with lead and lag market returns, calendar year t+1 (complete years only) | Yahoo Finance |
| Treat | 1 if consolidated total assets at the end of FY2019 ≥ KRW 2 trillion | OpenDART |
| Post; Ann | Post = 1 for FY2021–FY2025; Ann = 1 for FY2020 | |
| Size | ln(total assets) | OpenDART |
| Leverage | Total liabilities / total assets | OpenDART |
| ROA | Net income / total assets | OpenDART |
| Loss | 1 if net income < 0 | OpenDART |
| Sales growth | Revenue / prior-year revenue − 1 | OpenDART |
| Tangibility | Property, plant and equipment / total assets | OpenDART |
| Cash | Cash and cash equivalents / total assets | OpenDART |
| Largest-shareholder ownership | Common-share ownership of the largest shareholder and related parties at year-end | Business report |
| Business group | 1 if the firm belongs to a business group with at least two listed affiliates (affiliates chapter, FY2021–FY2025 reports) | Business report |
| Designated GHG/energy entity | 1 if any report states that the firm is a controlled entity under the GHG and energy target management scheme or an allocated entity under the emissions trading scheme | Business report |
Table A4.
Additional valuation tests: coefficient on standardised material ESG disclosure.
| Specification | Coefficient | Std. error | Observations |
| Baseline: Table 7, column (1) | −0.001 | 0.013 | 6,260 |
| Tobin’s Q in levels | −0.004 | 0.018 | 6,260 |
| Adding size-quintile × year FE | 0.001 | 0.012 | 6,260 |
| Disclosure measured in t − 1 | −0.004 | 0.013 | 5,526 |
| FY2021–FY2025 only | −0.001 | 0.014 | 3,313 |
| Prices reconciled with the report only | 0.001 | 0.014 | 5,058 |
| Excluding firms with a non-December fiscal year-end | −0.001 | 0.013 | 6,257 |
| Interaction with assets ≥ KRW 2 tn: MAT × Large | 0.011 | 0.023 | 6,260 |
| Material focus (MAT / SASB) instead of MAT and IMM | −0.011 | 0.014 | 5,985 |
Notes: Each row reports the coefficient on standardised MAT (in the interaction row, on MAT × Large; in the last row, on standardised MAT / SASB, which replaces MAT and IMM) from a regression of ln Tobin’s Q (Q in levels where stated) on standardised MAT and IMM, the controls of Table 7 and industry-by-year fixed effects, modified as described in the first column. Large equals one for firm-years with consolidated assets of at least KRW 2 trillion. Standard errors clustered by firm. *** p < 0.01, ** p < 0.05, * p < 0.1.
Table A5.
Additional information-environment tests: coefficient on standardised material ESG disclosure.
Table A5.
Additional information-environment tests: coefficient on standardised material ESG disclosure.
| Specification | IVOL t+1 | ILLIQ t+1 | NCSKEW t+1 |
| Baseline: Table 8, columns (a) | 0.0003 | −0.0063** | −0.008 |
| (0.0023) | (0.0030) | (0.016) | |
| Without the lagged dependent variable | 0.0003 | −0.0077** | −0.012 |
| (0.0035) | (0.0038) | (0.016) | |
| Firm and year fixed effects | 0.0006 | −0.0132** | −0.012 |
| (0.0040) | (0.0058) | (0.026) | |
| Adding GEN and CG | −0.0009 | −0.0054 | −0.007 |
| (0.0025) | (0.0034) | (0.017) | |
| Excluding firms with a non-December fiscal year-end | 0.0003 | −0.0063** | −0.008 |
| (0.0023) | (0.0030) | (0.016) | |
| Adding FY2025 reports, outcomes over 1 January–23 October 2026 (partial year) | 0.0009 | −0.0050 | −0.007 |
| (0.0025) | (0.0037) | (0.015) | |
| SASB-issue share (SASB) instead of MAT and IMM | 0.0007 | −0.0076*** | −0.002 |
| (0.0021) | (0.0028) | (0.015) | |
| Dictionary measures: KW_MAT (with KW_IMM) | 0.0031 | −0.0124*** | −0.017 |
| (0.0025) | (0.0042) | (0.016) | |
| p-value: MAT = IMM (baseline) | 0.930 | 0.567 | 0.574 |
Notes: Each cell reports the coefficient on the standardised disclosure measure named in the first column (MAT unless stated otherwise), with standard errors clustered by firm in parentheses. Unless stated otherwise, the sample comprises FY2016–FY2024 reports with outcomes over calendar years 2017–2025, and the regressions include the controls of Table 7, the current-year value of the outcome and industry-by-year fixed effects. The partial-year row adds FY2025 reports with outcomes measured over the available trading days of 2026. *** p < 0.01, ** p < 0.05, * p < 0.1.
Appendix B. Annotation Guideline, Semantic Anchors and Lexicon
The annotating model received the following instructions for each sentence, written in English with Korean examples. (i) ESG relevance: label 1 if the sentence substantively discusses a sustainability issue (a risk, opportunity, impact, policy, management action, incident, sanction, target or performance metric) that belongs to one of the 26 SASB general issue categories or to one of the two auxiliary categories (corporate governance; general ESG management); label 0 for ordinary business, product, market, sales, capacity, R&D-project, financial-risk (foreign exchange, interest, liquidity, credit), capital-structure, dividend, share, history, shareholder-meeting, audit-opinion and boilerplate legal text. (ii) Category: up to two categories, ordered by relevance. Sanctions are classified by the underlying issue (environmental fines under the relevant environmental category, safety under employee health and safety, fair-trade violations under competitive behaviour, other regulators under management of the legal and regulatory environment); climate-related transition risk is classified under GHG emissions, physical risk under physical impacts of climate change and strategic portfolio shifts under business model resilience. (iii) Specificity (ESG sentences only): 2 = quantitative or verifiable (a measured figure, the amount of a fine or sanction, a count of incidents, or a quantified, time-bound target); 1 = concrete qualitative (an identifiable action, programme, system, certification, incident, lawsuit, regulation or policy without a metric); 0 = generic (a vague commitment, value statement or generic risk language). Further rules: the main content of the sentence, not isolated words, determines the label; a product described as eco-friendly only as a marketing adjective is not ESG-relevant, whereas a sentence on the environmental performance of a product is classified under product design and lifecycle management; routine statements on governance formalities, such as the number of board meetings or the attendance of outside directors, are classified as corporate governance, with specificity assigned under the rules above; industry or market descriptions that mention an environmental or social trend are not ESG-relevant unless they discuss the firm’s own exposure, strategy, performance or management of the issue; describing an environmental business line is not ESG-relevant unless the sentence reports the firm’s own environmental performance or impact; negative confirmations of compliance (“no sanctions”) are not ESG-relevant; headings that only name an ESG topic are ESG-relevant with specificity 0; uncertain cases are labelled 0.
Each category’s semantic anchors consist of a short definition and two or three prototypical disclosure sentences, all written in Korean. For GHG emissions, for example, one anchor states that the company measures its GHG emissions and has set a target to reduce them by 2030; for employee health and safety, one states that the company manages its workplace accident rate and provides safety training.
The Korean ESG lexicon used for the dictionary benchmark and as a lexical feature contains, for each of the 26 categories, between 5 and 23 Korean keywords and phrases (10 on average), such as the Korean words for “greenhouse gas” and “carbon emissions” under GHG emissions, “industrial accident” and “serious accident” under employee health and safety, and “collusion” and “fair trade” under competitive behaviour. It also contains 11 general ESG terms, such as “ESG” and the Korean words for “sustainable” and “green management”.
The coding sheet for the human validation (Section 4.3) restated these instructions in Korean, with four omissions: the classification of climate-related risks and the rules on environmental business lines, on the environmental performance of products and on routine governance statements. The full guideline, the anchor sentences for all categories and the lexicon are available from the corresponding author upon reasonable request.
References
- Amel-Zadeh, A., & Serafeim, G. (2018). Why and how investors use ESG information: Evidence from a global survey. Financial Analysts Journal, 74(3), 87–103. [CrossRef]
- Amihud, Y. (2002). Illiquidity and stock returns: Cross-section and time-series effects. Journal of Financial Markets, 5(1), 31–56. [CrossRef]
- Berg, F., Kölbel, J. F., & Rigobon, R. (2022). Aggregate confusion: The divergence of ESG ratings. Review of Finance, 26(6), 1315–1344. [CrossRef]
- Bingler, J. A., Kraus, M., Leippold, M., & Webersinke, N. (2022). Cheap talk and cherry-picking: What ClimateBert has to say on corporate climate risk disclosures. Finance Research Letters, 47, 102776. [CrossRef]
- Bingler, J. A., Kraus, M., Leippold, M., & Webersinke, N. (2024). How cheap talk in climate disclosures relates to climate initiatives, corporate emissions, and reputation risk. Journal of Banking & Finance, 164, 107191. [CrossRef]
- Black, B. S., Jang, H., & Kim, W. (2006). Does corporate governance predict firms’ market values? Evidence from Korea. Journal of Law, Economics, and Organization, 22(2), 366–413. [CrossRef]
- Bolton, P., & Kacperczyk, M. (2021). Do investors care about carbon risk? Journal of Financial Economics, 142(2), 517–549. [CrossRef]
- Brown, S. V., & Tucker, J. W. (2011). Large-sample evidence on firms’ year-over-year MD&A modifications. Journal of Accounting Research, 49(2), 309–346. [CrossRef]
- Chen, J., Hong, H., & Stein, J. C. (2001). Forecasting crashes: Trading volume, past returns, and conditional skewness in stock prices. Journal of Financial Economics, 61(3), 345–381. [CrossRef]
- Chen, Y.-C., Hung, M., & Wang, Y. (2018). The effect of mandatory CSR disclosure on firm profitability and social externalities: Evidence from China. Journal of Accounting and Economics, 65(1), 169–190. [CrossRef]
- Cho, C. H., & Patten, D. M. (2007). The role of environmental disclosures as tools of legitimacy: A research note. Accounting, Organizations and Society, 32(7–8), 639–647. [CrossRef]
- Christensen, H. B., Floyd, E., Liu, L. Y., & Maffett, M. (2017). The real effects of mandated information on social responsibility in financial reports: Evidence from mine-safety records. Journal of Accounting and Economics, 64(2–3), 284–304. [CrossRef]
- Christensen, H. B., Hail, L., & Leuz, C. (2021). Mandatory CSR and sustainability reporting: Economic analysis and literature review. Review of Accounting Studies, 26(3), 1176–1248. [CrossRef]
- Chung, K. H., & Pruitt, S. W. (1994). A simple approximation of Tobin’s q. Financial Management, 23(3), 70–74. [CrossRef]
- Clarkson, P. M., Li, Y., Richardson, G. D., & Vasvari, F. P. (2008). Revisiting the relation between environmental performance and environmental disclosure: An empirical analysis. Accounting, Organizations and Society, 33(4–5), 303–327. [CrossRef]
- Conneau, A., Khandelwal, K., Goyal, N., Chaudhary, V., Wenzek, G., Guzmán, F., Grave, E., Ott, M., Zettlemoyer, L., & Stoyanov, V. (2020). Unsupervised cross-lingual representation learning at scale. In Proceedings of the 58th Annual Meeting of the Association for Computational Linguistics (pp. 8440–8451). Association for Computational Linguistics. [CrossRef]
- Consolandi, C., Eccles, R. G., & Gabbi, G. (2022). How material is a material issue? Stock returns and the financial relevance and financial intensity of ESG materiality. Journal of Sustainable Finance & Investment, 12(4), 1045–1068. [CrossRef]
- de Kok, T. (2025). ChatGPT for textual analysis? How to use generative LLMs in accounting research. Management Science, 71(9), 7888–7906. [CrossRef]
- Devlin, J., Chang, M.-W., Lee, K., & Toutanova, K. (2019). BERT: Pre-training of deep bidirectional transformers for language understanding. In Proceedings of the 2019 Conference of the North American Chapter of the Association for Computational Linguistics: Human Language Technologies (pp. 4171–4186). Association for Computational Linguistics. [CrossRef]
- Dhaliwal, D. S., Li, O. Z., Tsang, A., & Yang, Y. G. (2011). Voluntary nonfinancial disclosure and the cost of equity capital: The initiation of corporate social responsibility reporting. The Accounting Review, 86(1), 59–100. [CrossRef]
- Diamond, D. W., & Verrecchia, R. E. (1991). Disclosure, liquidity, and the cost of capital. The Journal of Finance, 46(4), 1325–1359. [CrossRef]
- Dye, R. A. (1985). Disclosure of nonproprietary information. Journal of Accounting Research, 23(1), 123–145. [CrossRef]
- Dyer, T., Lang, M., & Stice-Lawrence, L. (2017). The evolution of 10-K textual disclosure: Evidence from Latent Dirichlet Allocation. Journal of Accounting and Economics, 64(2–3), 221–245. [CrossRef]
- Fiechter, P., Hitz, J.-M., & Lehmann, N. (2022). Real effects of a widespread CSR reporting mandate: Evidence from the European Union’s CSR Directive. Journal of Accounting Research, 60(4), 1499–1549. [CrossRef]
- Financial Services Commission. (2021, January 14). Gieop budameun jurigo, tujaja bohoreul ganghwahagi wihan gieopgongsijedo gaeseonbanganeul chujinhagetseumnida [Plan to improve the corporate disclosure system] [Press release, in Korean]. Available online: https://fsc.go.kr/no010101/75176 (accessed on 24 October 2026).
- Financial Services Commission. (2023a, February 17). ESG geumyung chujindan guseong mit je1cha hoeui gaechoe [Launch and first meeting of the ESG Finance Taskforce] [Press release, in Korean]. Available online: https://fsc.go.kr/no010101/79437 (accessed on 24 October 2026).
- Financial Services Commission. (2023b, October 16). Taskforce on ESG finance holds meeting to discuss ways to introduce ESG disclosure system [Press release]. Available online: https://www.fsc.go.kr/eng/pr010101/80913 (accessed on 24 October 2026).
- Financial Services Commission. (2024, February 26). Active support to be provided to promote voluntary efforts of listed companies in enhancing their value [Press release]. Available online: https://fsc.go.kr/eng/pr010101/81778 (accessed on 24 October 2026).
- Financial Services Commission. (2026, July 8). ESG disclosure to be required from 2028 for KOSPI-listed companies with KRW10 trillion or more in total consolidated assets [Press release]. Available online: https://fsc.go.kr/eng/pr010101/87276 (accessed on 24 October 2026).
- Gilardi, F., Alizadeh, M., & Kubli, M. (2023). ChatGPT outperforms crowd workers for text-annotation tasks. Proceedings of the National Academy of Sciences, 120(30), e2305016120. [CrossRef]
- Grewal, J., Hauptmann, C., & Serafeim, G. (2021). Material sustainability information and stock price informativeness. Journal of Business Ethics, 171(3), 513–544. [CrossRef]
- Grewal, J., Riedl, E. J., & Serafeim, G. (2019). Market reaction to mandatory nonfinancial disclosure. Management Science, 65(7), 3061–3084. [CrossRef]
- Healy, P. M., & Palepu, K. G. (2001). Information asymmetry, corporate disclosure, and the capital markets: A review of the empirical disclosure literature. Journal of Accounting and Economics, 31(1–3), 405–440. [CrossRef]
- Hope, O.-K., Hu, D., & Lu, H. (2016). The benefits of specific risk-factor disclosures. Review of Accounting Studies, 21(4), 1005–1045. [CrossRef]
- Huang, A. H., Wang, H., & Yang, Y. (2023). FinBERT: A large language model for extracting information from financial text. Contemporary Accounting Research, 40(2), 806–841. [CrossRef]
- Hummel, K., & Schlick, C. (2016). The relationship between sustainability performance and sustainability disclosure—Reconciling voluntary disclosure theory and legitimacy theory. Journal of Accounting and Public Policy, 35(5), 455–476. [CrossRef]
- Hutton, A. P., Marcus, A. J., & Tehranian, H. (2009). Opaque financial reports, R², and crash risk. Journal of Financial Economics, 94(1), 67–86. [CrossRef]
- IFRS Foundation. (2023). IFRS S1 General requirements for disclosure of sustainability-related financial information. IFRS Foundation. Available online: https://www.ifrs.org/issued-standards/ifrs-sustainability-standards-navigator/ifrs-s1-general-requirements/ (accessed on 24 October 2026).
- IFRS Foundation. (2025). South Korea: Jurisdictional snapshot (updated 12 June 2025). Available online: https://www.ifrs.org/content/dam/ifrs/publications/sustainability-jurisdictions/pdf-snapshots/south-korea-ifrs-snapshot.pdf (accessed on 24 October 2026).
- Khan, M., Serafeim, G., & Yoon, A. (2016). Corporate sustainability: First evidence on materiality. The Accounting Review, 91(6), 1697–1724. [CrossRef]
- G. Kim et al., 2023) Kim, A. G., Muhn, M., & Nikolaev, V. V. (2023). Bloated disclosures: Can ChatGPT help investors process information? [Working paper]. SSRN. [CrossRef]
- Kim, J. (2021, January 15). 2025nyeon 2jo isang daehyeongsangjangsa ESG uimugongsi [Large listed companies with assets of KRW 2 trillion or more to disclose ESG information from 2025]. Seoul Shinmun. Available online: https://www.seoul.co.kr/news/economy/finance/2021/01/15/20210115019015 (accessed on 24 October 2026).
- Kölbel, J. F., Leippold, M., Rillaerts, J., & Wang, Q. (2024). Ask BERT: How regulatory disclosure of transition and physical climate risks affects the CDS term structure. Journal of Financial Econometrics, 22(1), 30–69. [CrossRef]
- Krueger, P., Sautner, Z., Tang, D. Y., & Zhong, R. (2024). The effects of mandatory ESG disclosure around the world. Journal of Accounting Research, 62(5), 1795–1847. [CrossRef]
- Leuz, C., & Wysocki, P. D. (2016). The economics of disclosure and financial reporting regulation: Evidence and suggestions for future research. Journal of Accounting Research, 54(2), 525–622. [CrossRef]
- Loughran, T., & McDonald, B. (2016). Textual analysis in accounting and finance: A survey. Journal of Accounting Research, 54(4), 1187–1230. [CrossRef]
- Lyon, T. P., & Maxwell, J. W. (2011). Greenwash: Corporate environmental disclosure under threat of audit. Journal of Economics & Management Strategy, 20(1), 3–41. [CrossRef]
- Marquis, C., Toffel, M. W., & Zhou, Y. (2016). Scrutiny, norms, and selective disclosure: A global study of greenwashing. Organization Science, 27(2), 483–504. [CrossRef]
- Matsumura, E. M., Prakash, R., & Vera-Muñoz, S. C. (2014). Firm-value effects of carbon emissions and carbon disclosures. The Accounting Review, 89(2), 695–724. [CrossRef]
- Ni, J., Bingler, J., Colesanti-Senni, C., Kraus, M., Gostlow, G., Schimanski, T., Stammbach, D., Vaghefi, S. A., Wang, Q., Webersinke, N., Wekhof, T., Yu, T., & Leippold, M. (2023). CHATREPORT: Democratizing sustainability disclosure analysis through LLM-based tools. In Proceedings of the 2023 Conference on Empirical Methods in Natural Language Processing: System Demonstrations (pp. 21–51). Association for Computational Linguistics. [CrossRef]
- Park, Y. (2025, January 9). Jangnyeon jisokganeunggyeongyeongbogoseo gongsihan gieop chong 204gaesa…jeonnyeonboda 27% ↑ [204 companies published sustainability reports last year, up 27%]. CEO Score Daily. Available online: https://www.ceoscoredaily.com/page/view/2025010916554507751 (accessed on 24 October 2026).
- Pástor, Ľ., Stambaugh, R. F., & Taylor, L. A. (2021). Sustainable investing in equilibrium. Journal of Financial Economics, 142(2), 550–571. [CrossRef]
- Petersen, M. A. (2009). Estimating standard errors in finance panel data sets: Comparing approaches. The Review of Financial Studies, 22(1), 435–480. [CrossRef]
- Plumlee, M., Brown, D., Hayes, R. M., & Marshall, R. S. (2015). Voluntary environmental disclosure quality and firm value: Further evidence. Journal of Accounting and Public Policy, 34(4), 336–361. [CrossRef]
- Reimers, N., & Gurevych, I. (2019). Sentence-BERT: Sentence embeddings using Siamese BERT-networks. In Proceedings of the 2019 Conference on Empirical Methods in Natural Language Processing and the 9th International Joint Conference on Natural Language Processing (pp. 3980–3990). Association for Computational Linguistics. [CrossRef]
- Roth, J., Sant’Anna, P. H. C., Bilinski, A., & Poe, J. (2023). What’s trending in difference-in-differences? A synthesis of the recent econometrics literature. Journal of Econometrics, 235(2), 2218–2244. [CrossRef]
- Samil PwC. (2026). Jisokganeungseong gongsi jedo rodeumaep choan mit hwakjeong gongsigijun juyo naeyong [Draft roadmap for sustainability disclosure and main contents of the finalised disclosure standards] [Issue brief, in Korean]. Available online: https://www.pwc.com/kr/ko/insights/issue-brief/samilpwc_esg-disclosure-roadmap.pdf (accessed on 24 October 2026).
- Sautner, Z., van Lent, L., Vilkov, G., & Zhang, R. (2023). Firm-level climate change exposure. The Journal of Finance, 78(3), 1449–1498. [CrossRef]
- Schimanski, T., Reding, A., Reding, N., Bingler, J., Kraus, M., & Leippold, M. (2024). Bridging the gap in ESG measurement: Using NLP to quantify environmental, social, and governance communication. Finance Research Letters, 61, 104979. [CrossRef]
- Shen, S., Li, C., Xie, J., Fujii, H., Keeley, A. R., & Managi, S. (2026). Do firms disclose financially material ESG risks? Evidence from Japanese food and beverage firms using a text match pretrained transformer. Corporate Social Responsibility and Environmental Management. Advance online publication, e70990. [CrossRef]
- Verrecchia, R. E. (1983). Discretionary disclosure. Journal of Accounting and Economics, 5, 179–194. [CrossRef]
- Wang, L., Yang, N., Huang, X., Yang, L., Majumder, R., & Wei, F. (2024). Multilingual E5 text embeddings: A technical report. arXiv. [CrossRef]
- Yoon, B., Lee, J. H., & Byun, R. (2018). Does ESG performance enhance firm value? Evidence from Korea. Sustainability, 10(10), 3635. [CrossRef]
Figure 1.
Measurement pipeline. Narrative sentences from the statutory business reports are embedded with a multilingual transformer. A large language model labels a stratified sample of sentences under a written guideline, and its labels are checked against a second model and against human coding. A classifier distilled from these labels is applied to every sentence, and the SASB industry standards map the predicted issues to financial materiality before aggregation to firm-year measures.
Figure 1.
Measurement pipeline. Narrative sentences from the statutory business reports are embedded with a multilingual transformer. A large language model labels a stratified sample of sentences under a written guideline, and its labels are checked against a second model and against human coding. A classifier distilled from these labels is applied to every sentence, and the SASB industry standards map the predicted issues to financial materiality before aggregation to firm-year measures.
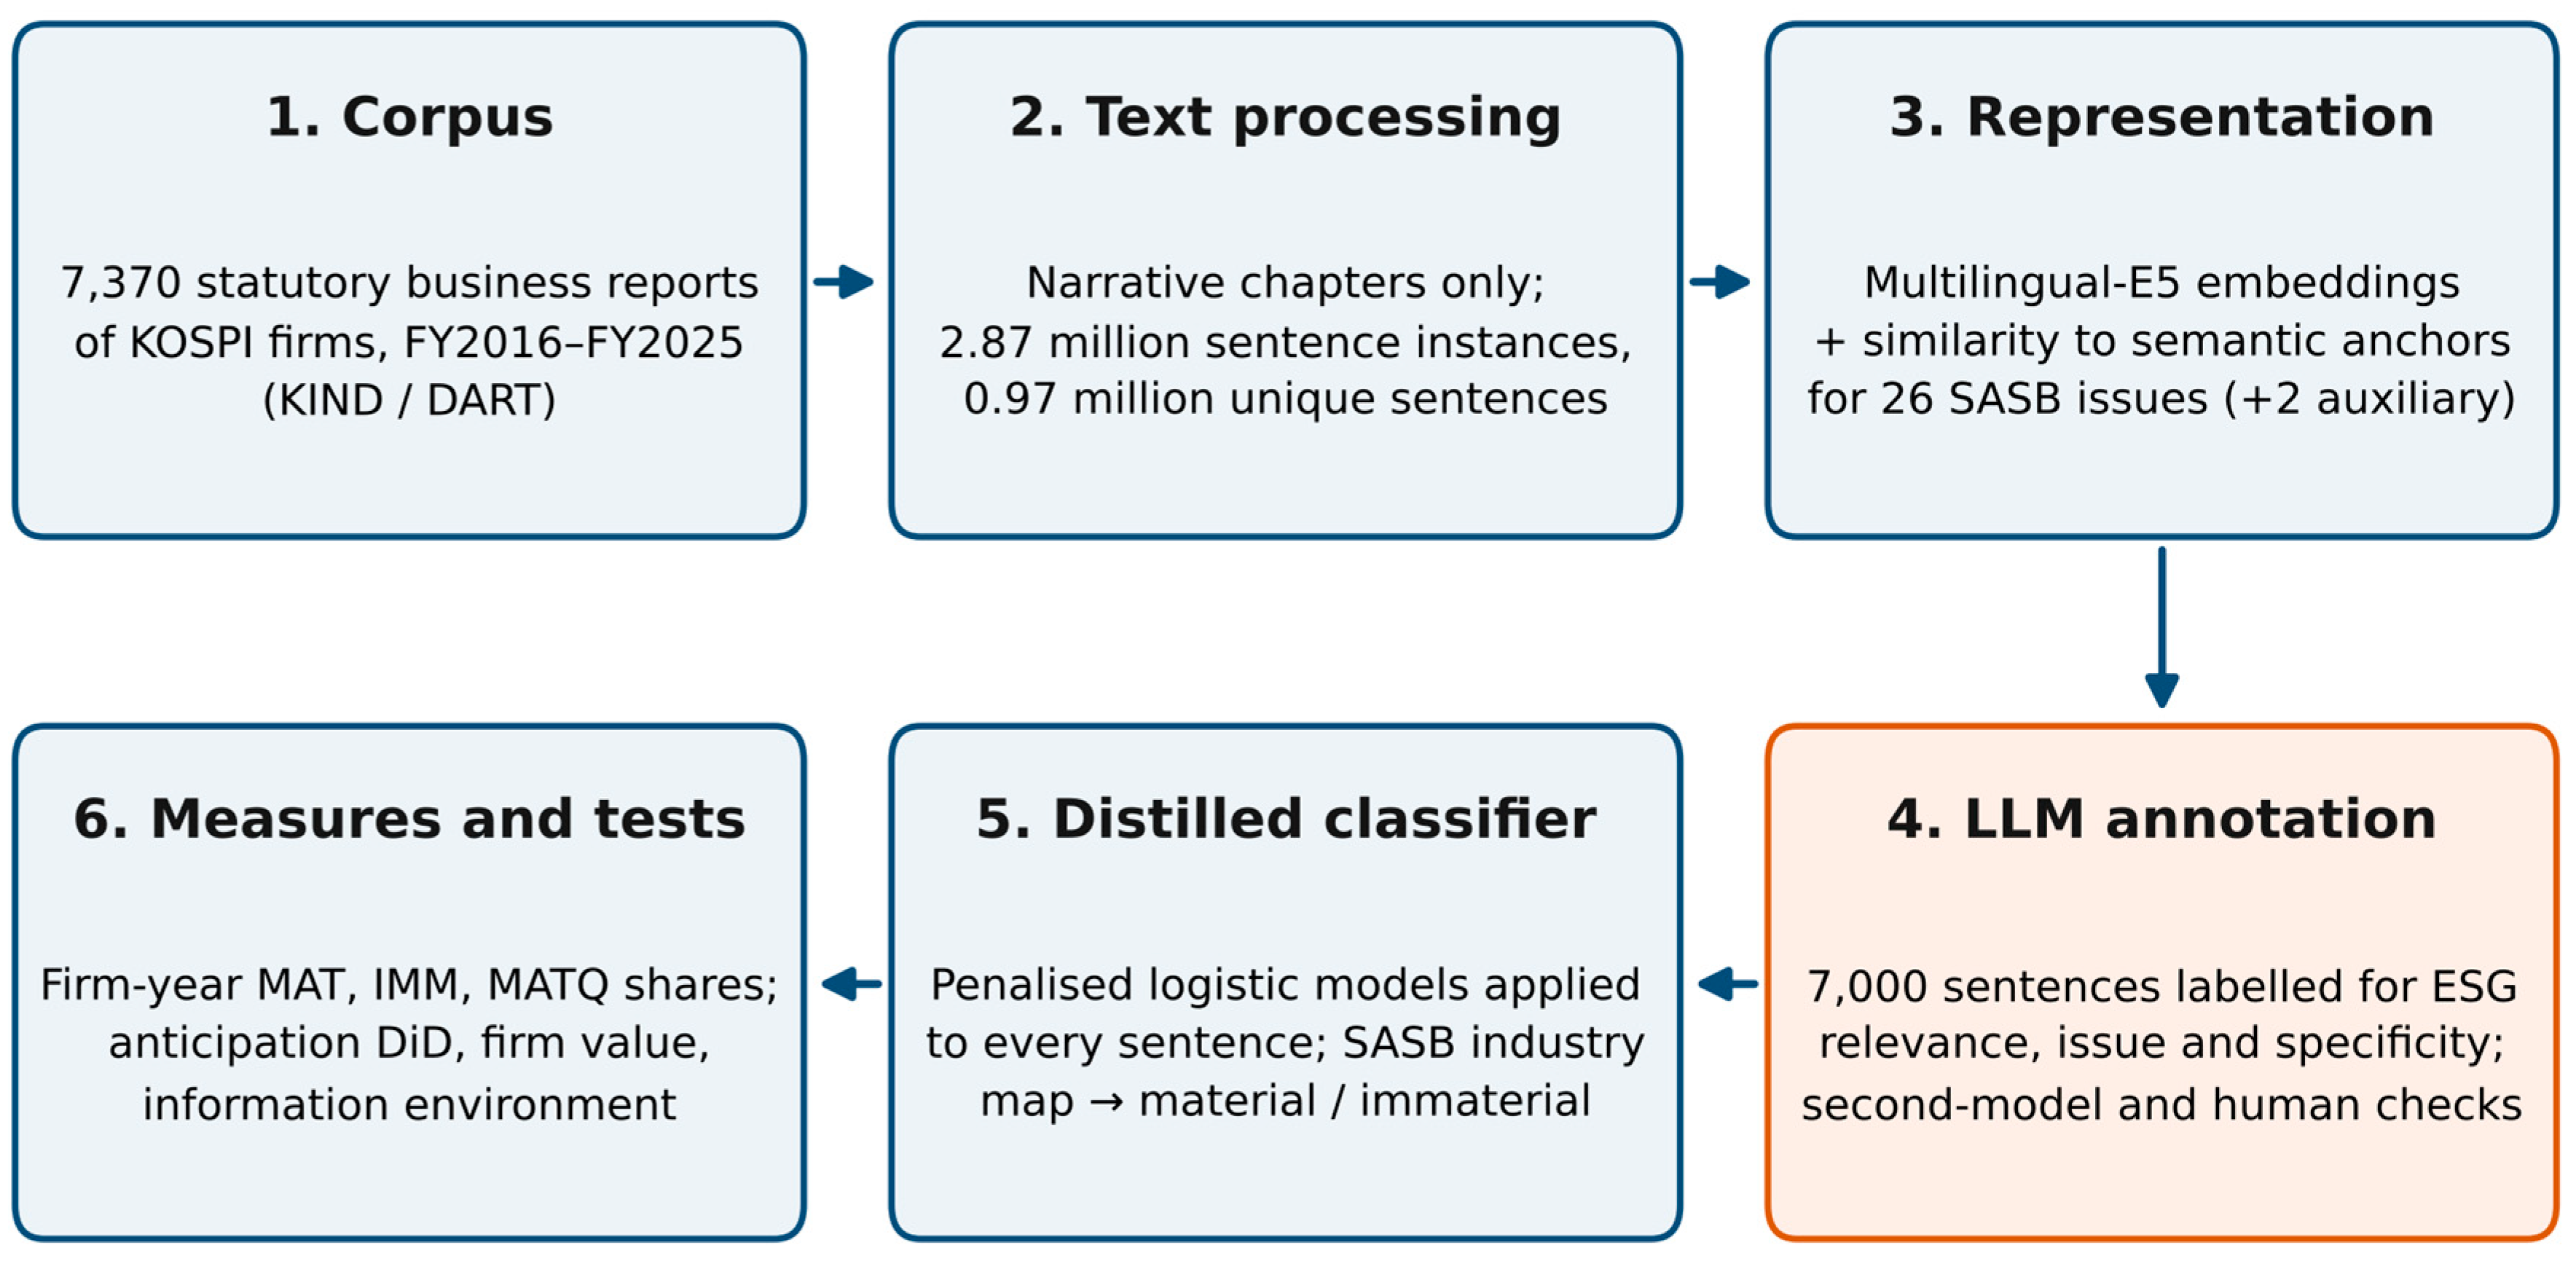
Figure 2.
Classification performance against LLM reference labels on the held-out test set. F1 scores are design-weighted to the population of narrative sentence instances; error bars show 95% stratified-bootstrap confidence intervals for the distilled classifier on the ESG-relevance and materiality tasks. The dictionary benchmark flags sentences containing an ESG keyword; the zero-shot benchmark uses the relative cosine similarity between a sentence and the semantic anchors; for quantitative specificity the benchmark is a numeric-cue rule.
Figure 2.
Classification performance against LLM reference labels on the held-out test set. F1 scores are design-weighted to the population of narrative sentence instances; error bars show 95% stratified-bootstrap confidence intervals for the distilled classifier on the ESG-relevance and materiality tasks. The dictionary benchmark flags sentences containing an ESG keyword; the zero-shot benchmark uses the relative cosine similarity between a sentence and the semantic anchors; for quantitative specificity the benchmark is a numeric-cue rule.
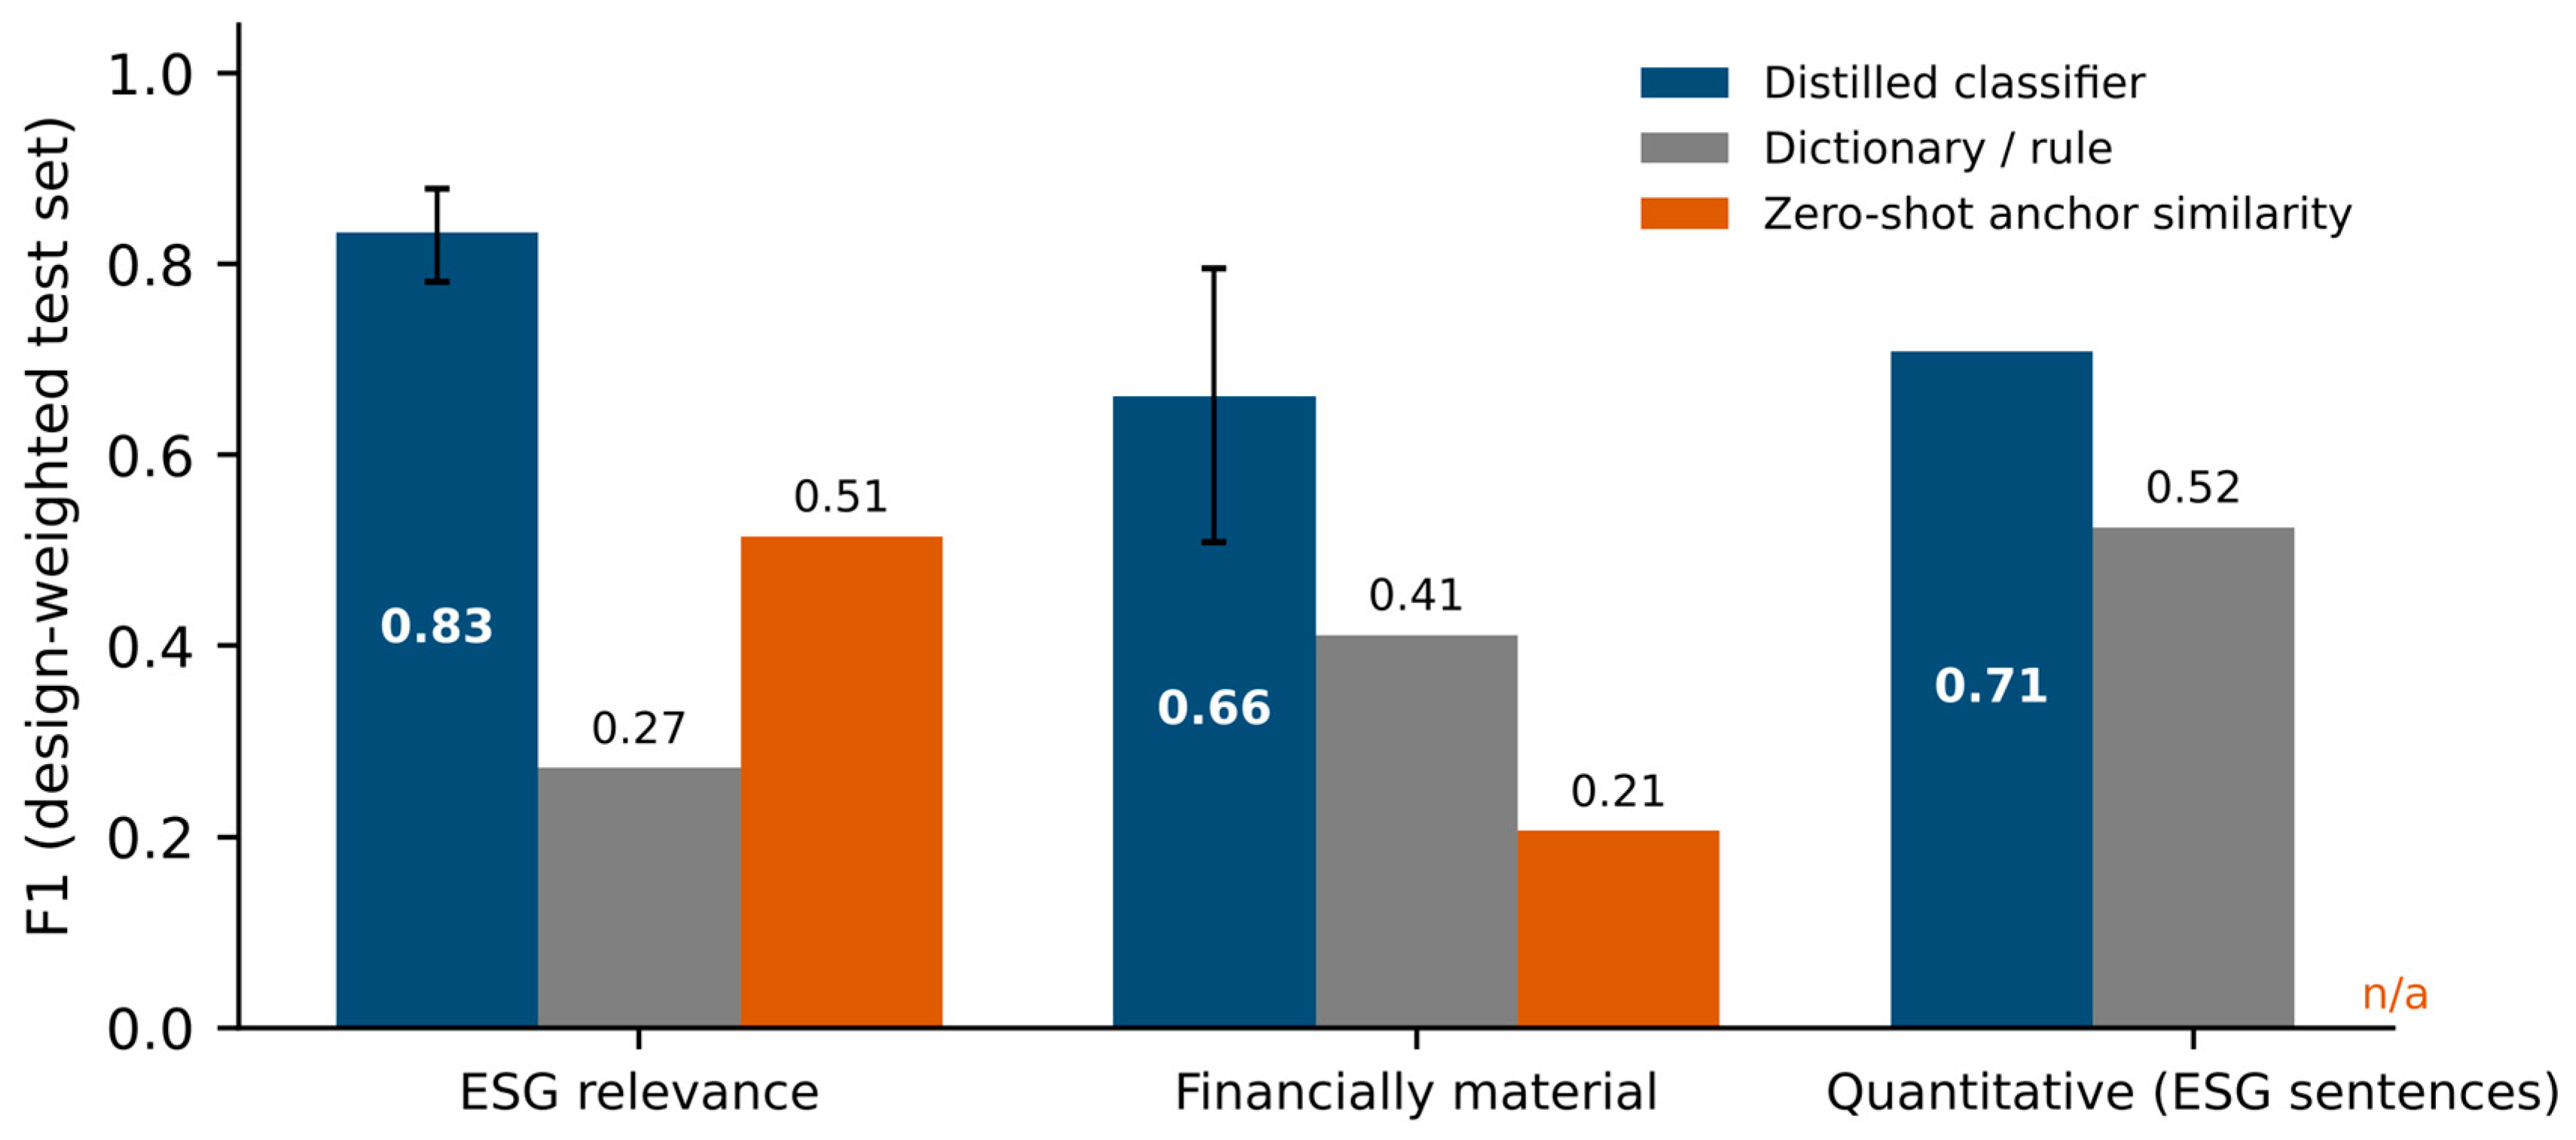
Figure 3.
Financially material and immaterial ESG disclosure in Korean business reports, FY2016–FY2025. Panel (a): mean shares of narrative sentences across all sample firms. Panel (b): mean MAT (material sentences as a percentage of narrative sentences) for firms above and below the expected KRW 2 trillion asset threshold of the 2021 roadmap (FY2019 assets). The dotted line separates FY2020 reports, filed two months after the January 2021 roadmap announcement, from FY2021 and later reports.
Figure 3.
Financially material and immaterial ESG disclosure in Korean business reports, FY2016–FY2025. Panel (a): mean shares of narrative sentences across all sample firms. Panel (b): mean MAT (material sentences as a percentage of narrative sentences) for firms above and below the expected KRW 2 trillion asset threshold of the 2021 roadmap (FY2019 assets). The dotted line separates FY2020 reports, filed two months after the January 2021 roadmap announcement, from FY2021 and later reports.
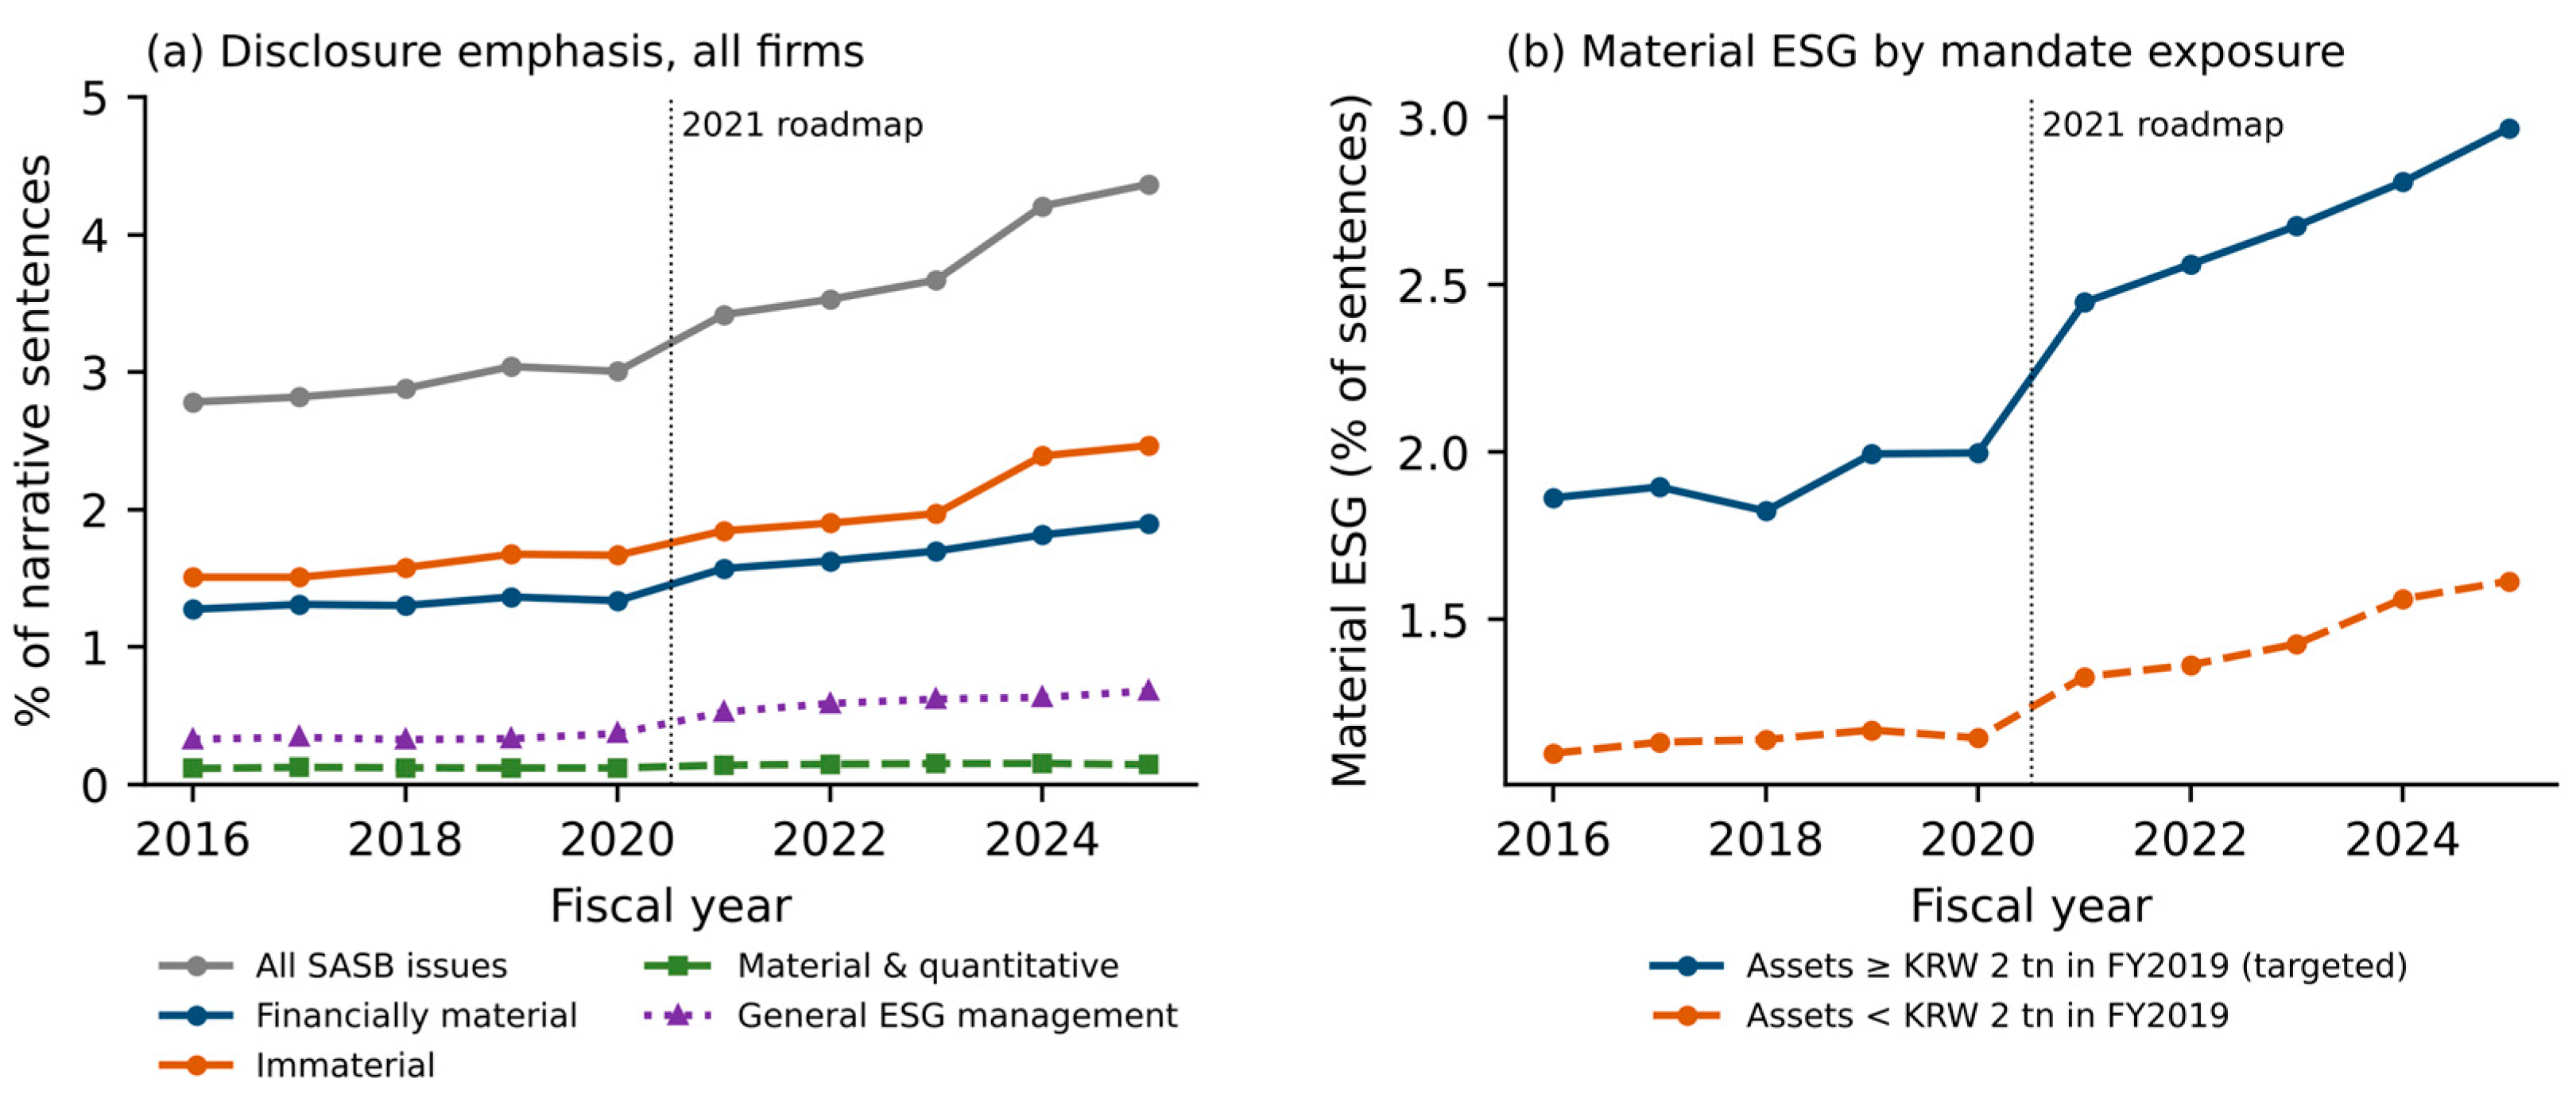
Figure 4.
Disclosure emphasis by SASB industry and issue category. Cells show the mean share of narrative sentences assigned to each issue (colour scale: log(1 + 10 × share in %)); orange frames mark issues that the SASB Standards identify as financially material for the industry. Industries with at least 60 firm-years.
Figure 4.
Disclosure emphasis by SASB industry and issue category. Cells show the mean share of narrative sentences assigned to each issue (colour scale: log(1 + 10 × share in %)); orange frames mark issues that the SASB Standards identify as financially material for the industry. Industries with at least 60 firm-years.
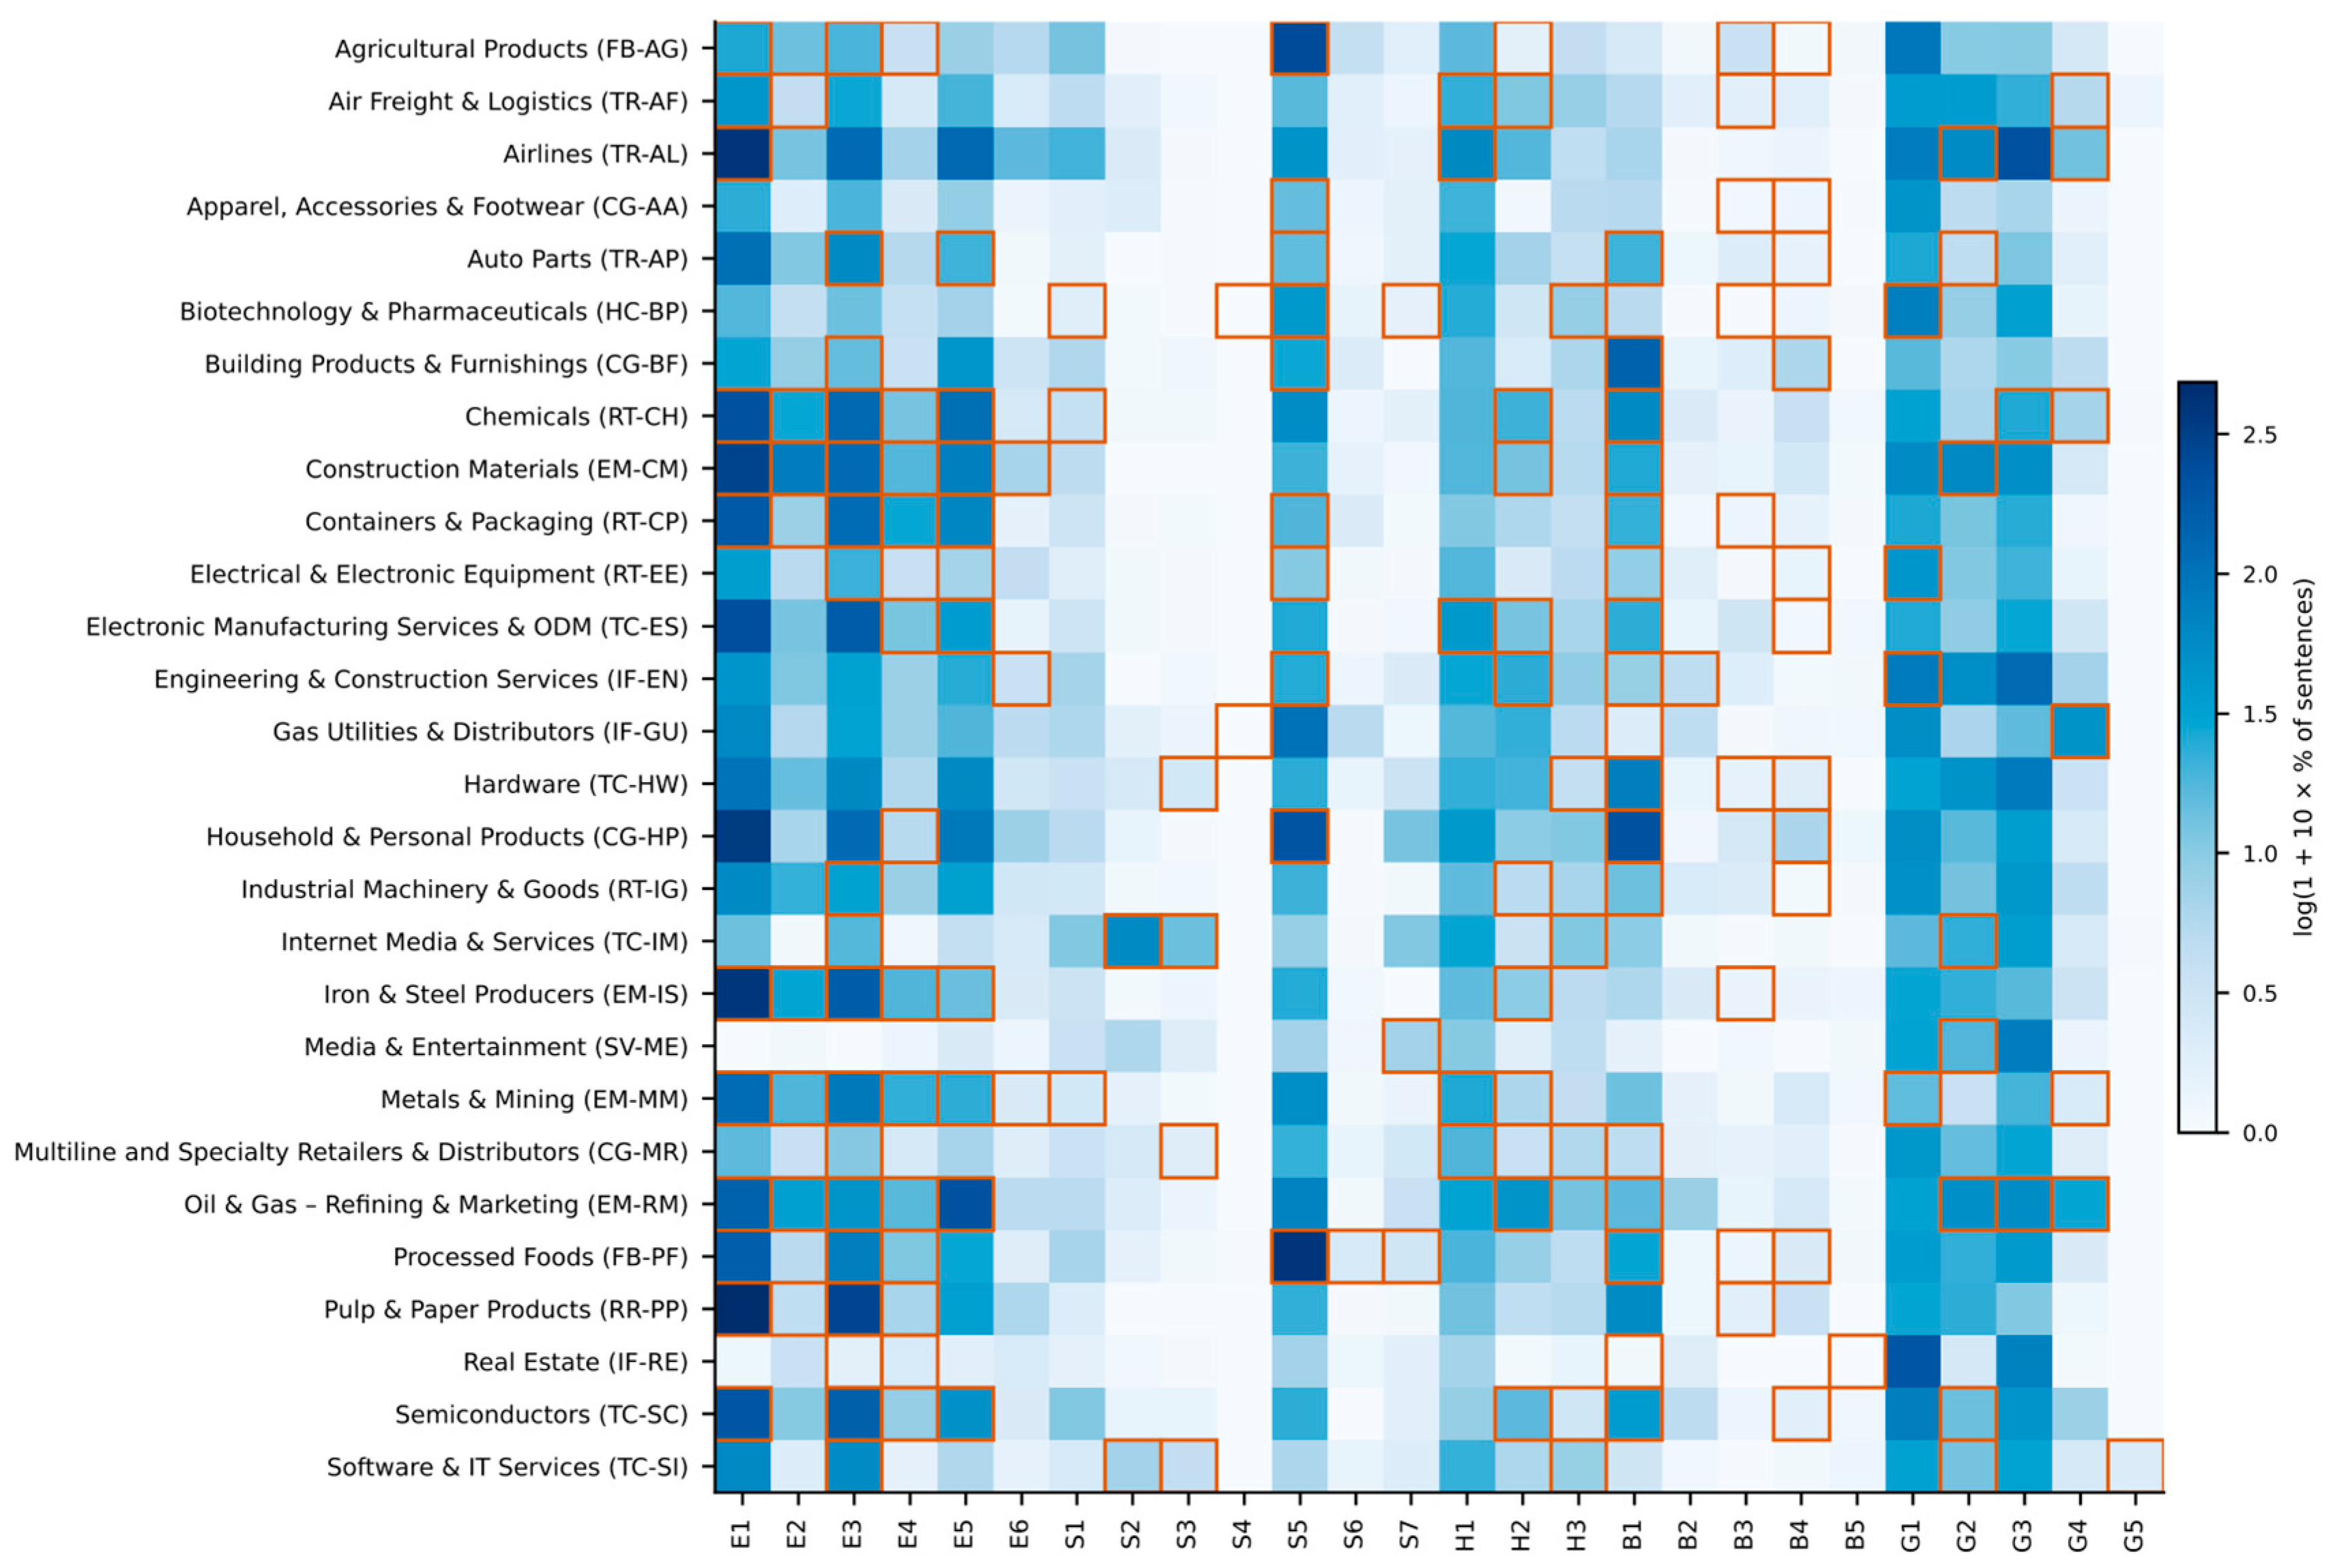
Figure 5.
Dynamic difference-in-differences estimates for (a) material, (b) material and quantitative, (c) immaterial and (d) general ESG-management disclosure. Coefficients on Treat × fiscal-year indicators relative to FY2019 with 95% confidence intervals (standard errors clustered by firm), from regressions with firm and year fixed effects and the baseline controls. The dotted line separates FY2020 reports, filed two months after the January 2021 roadmap announcement, from FY2021 and later reports.
Figure 5.
Dynamic difference-in-differences estimates for (a) material, (b) material and quantitative, (c) immaterial and (d) general ESG-management disclosure. Coefficients on Treat × fiscal-year indicators relative to FY2019 with 95% confidence intervals (standard errors clustered by firm), from regressions with firm and year fixed effects and the baseline controls. The dotted line separates FY2020 reports, filed two months after the January 2021 roadmap announcement, from FY2021 and later reports.
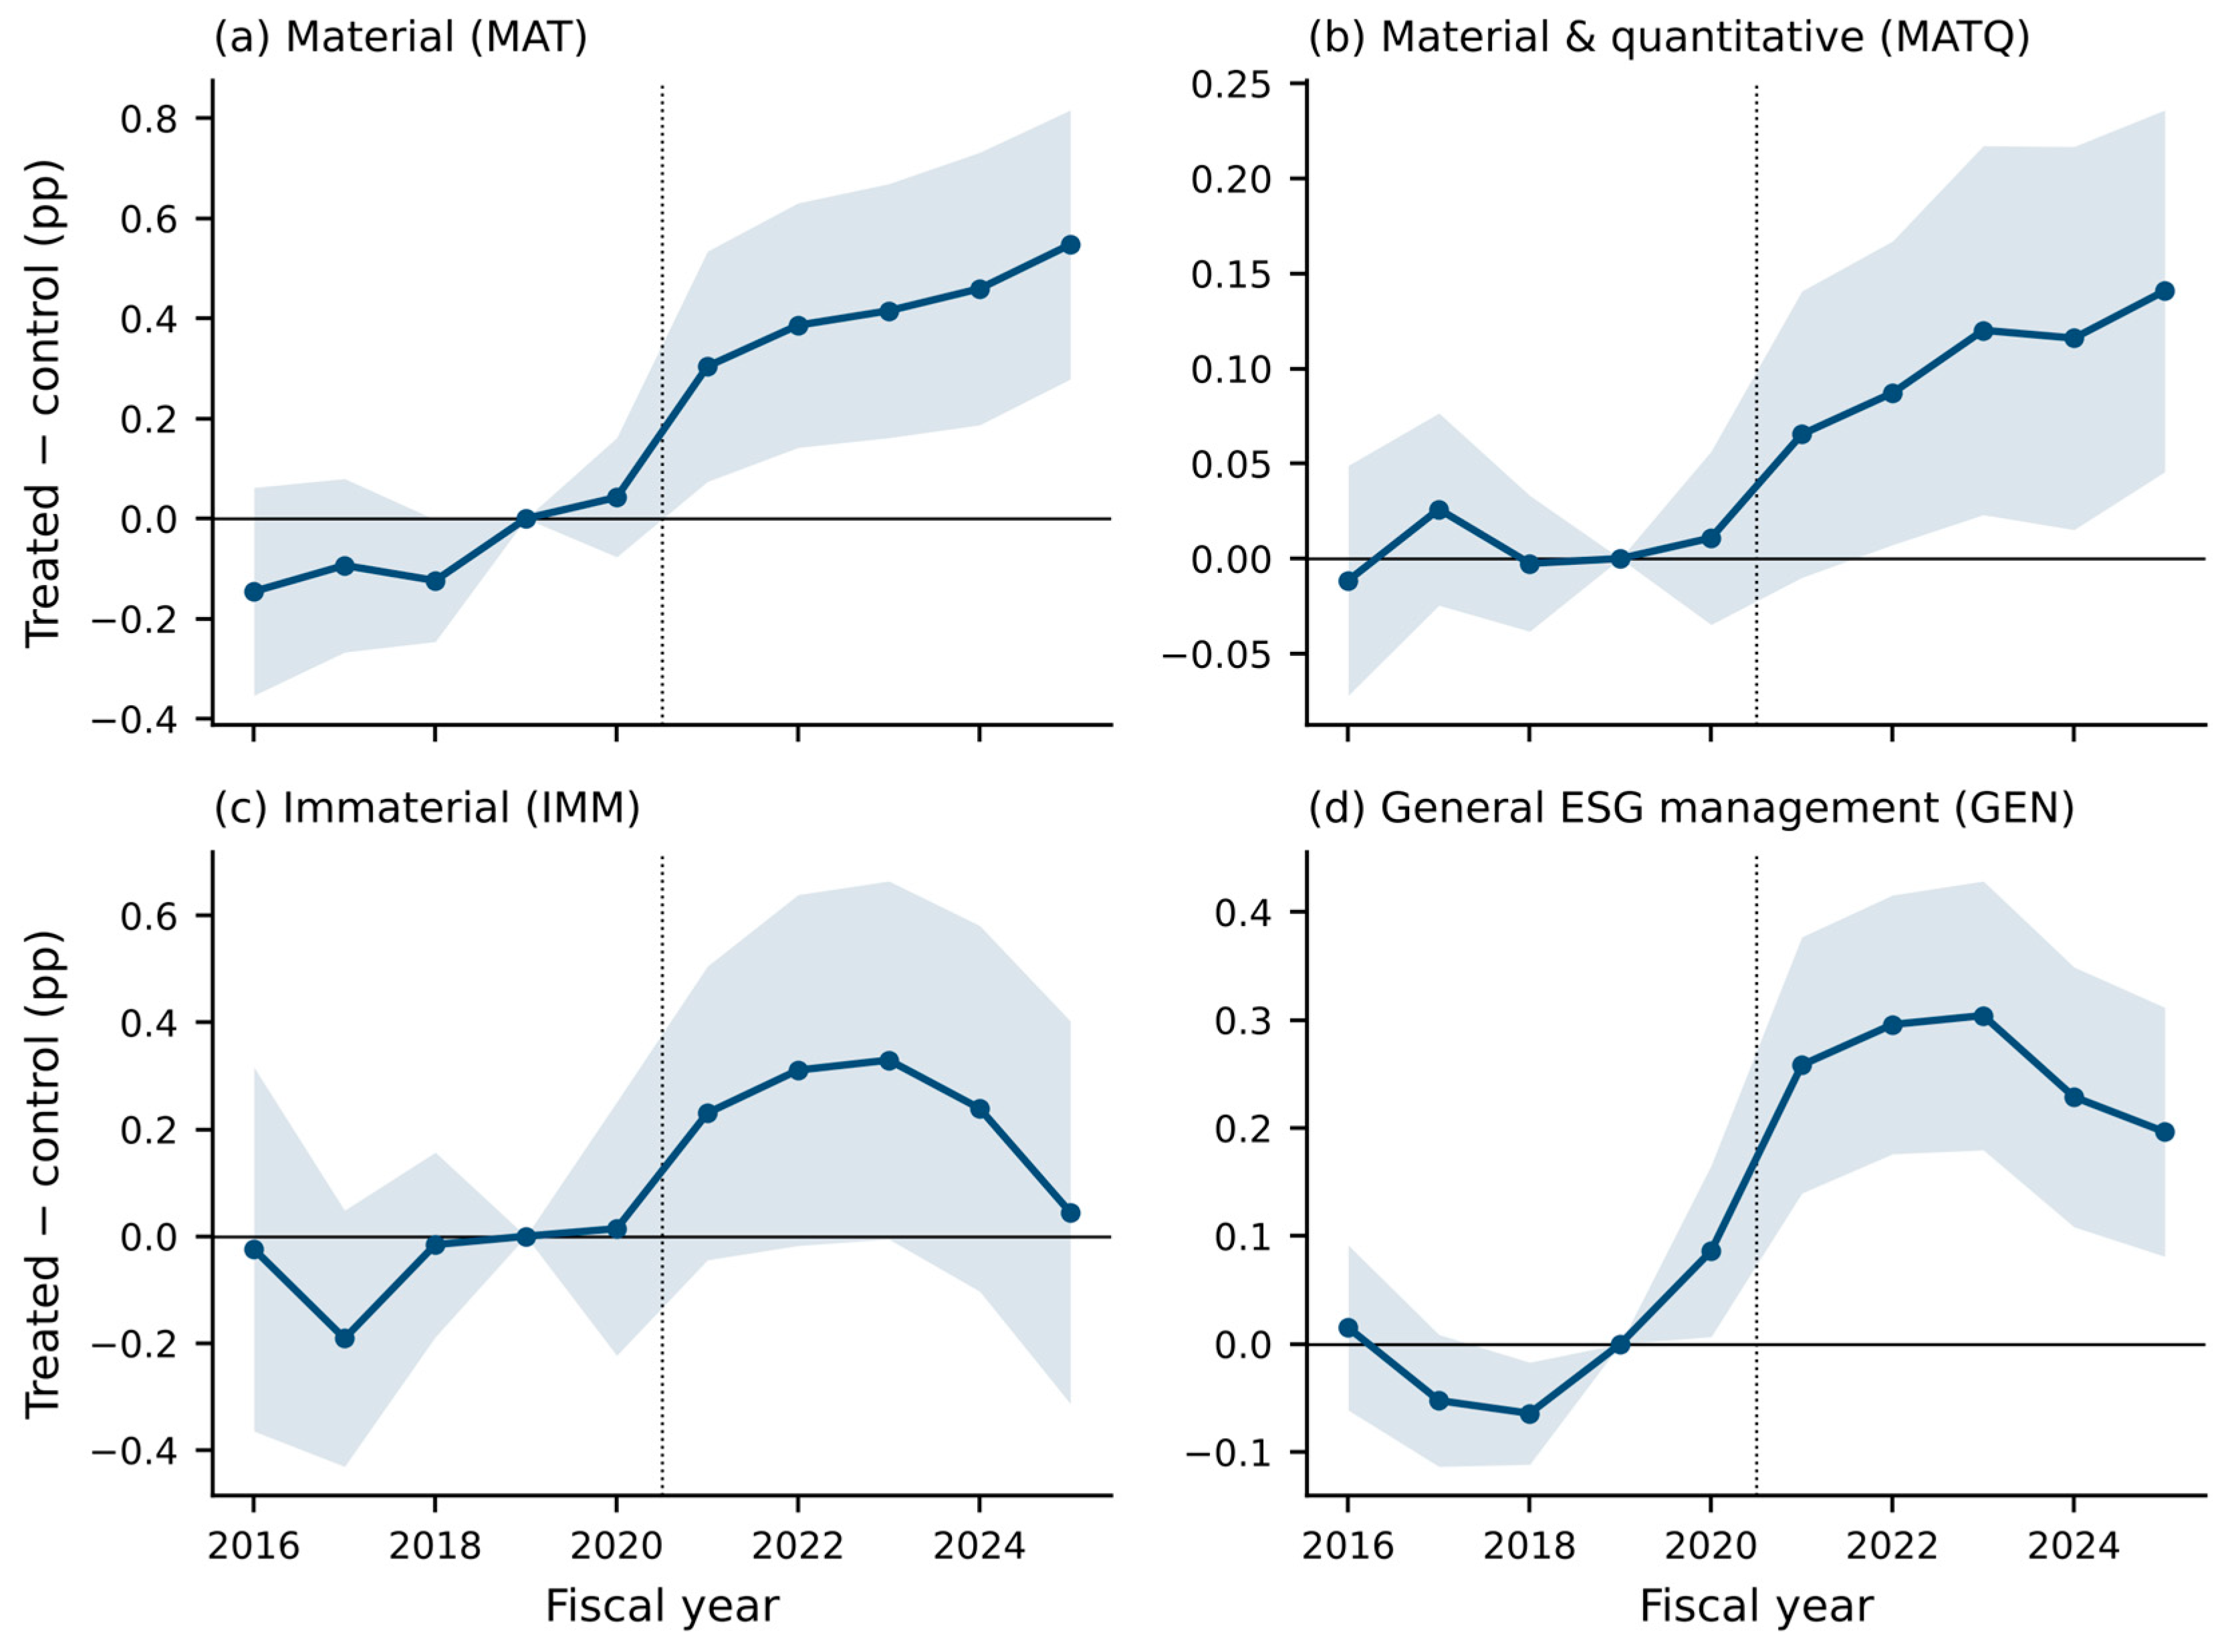
Table 1.
Sample and mean disclosure measures by fiscal year.
| Fiscal year | Reports | Sentences | SASB | MAT | IMM | MATQ | GEN | CG |
| 2016 | 681 | 327 | 2.78 | 1.27 | 1.51 | 0.12 | 0.33 | 9.81 |
| 2017 | 702 | 340 | 2.82 | 1.31 | 1.51 | 0.13 | 0.34 | 9.67 |
| 2018 | 715 | 365 | 2.88 | 1.30 | 1.58 | 0.12 | 0.33 | 10.49 |
| 2019 | 725 | 375 | 3.04 | 1.36 | 1.68 | 0.12 | 0.33 | 10.85 |
| 2020 | 728 | 386 | 3.01 | 1.34 | 1.67 | 0.12 | 0.37 | 11.13 |
| 2021 | 736 | 377 | 3.42 | 1.57 | 1.85 | 0.14 | 0.53 | 11.54 |
| 2022 | 741 | 409 | 3.53 | 1.63 | 1.90 | 0.15 | 0.59 | 11.28 |
| 2023 | 750 | 426 | 3.67 | 1.70 | 1.97 | 0.15 | 0.62 | 10.93 |
| 2024 | 750 | 434 | 4.21 | 1.82 | 2.39 | 0.15 | 0.63 | 11.18 |
| 2025 | 750 | 446 | 4.37 | 1.90 | 2.47 | 0.15 | 0.68 | 10.92 |
| All | 7,278 | 390 | 3.38 | 1.53 | 1.86 | 0.14 | 0.48 | 10.79 |
Notes: Means across reports. Sentences: number of narrative sentences per report. SASB: share of narrative sentences (%) assigned to any of the 26 SASB general issue categories; MAT/IMM: financially material/immaterial for the firm’s SICS industry; MATQ: material and quantitative; GEN: general ESG management; CG: corporate governance.
Table 2.
Validation of the AI measures against LLM reference labels and human coding.
| Task | Method | Precision | Recall | F1 [95% CI] | AUC |
| Panel A: against LLM reference labels (held-out test set, 1,000 sentences) | |||||
| ESG relevance | Distilled classifier | 0.79 | 0.88 | 0.83 [0.78, 0.88] | 0.98 |
| Dictionary | 0.40 | 0.21 | 0.27 | — | |
| Zero-shot | 0.56 | 0.48 | 0.51 | 0.82 | |
| SASB issue | Distilled classifier | 0.75 | 0.81 | 0.78 [0.69, 0.86] | — |
| Dictionary | 0.34 | 0.46 | 0.39 | — | |
| Zero-shot | 0.19 | 0.21 | 0.20 | — | |
| Material ESG | Distilled classifier | 0.64 | 0.68 | 0.66 [0.51, 0.79] | — |
| Dictionary | 0.36 | 0.47 | 0.41 | — | |
| Zero-shot | 0.30 | 0.16 | 0.21 | — | |
| Immaterial ESG | Distilled classifier | 0.75 | 0.83 | 0.79 | — |
| Issue category | Distilled classifier | 0.70 | 0.75 | 0.73 | — |
| Quantitative | Distilled classifier | 0.73 | 0.69 | 0.71 | — |
| Numeric-cue rule | 0.51 | 0.54 | 0.52 | — | |
| Specific | Distilled classifier | 0.96 | 0.92 | 0.94 | — |
| Panel B: against human coding (400-sentence reliability sample) | |||||
| ESG relevance | Distilled classifier | 0.83 | 0.85 | 0.84 [0.76, 0.90] | 0.95 |
| Dictionary | 0.44 | 0.20 | 0.27 | — | |
| Zero-shot | 0.62 | 0.57 | 0.59 | 0.83 | |
| Primary LLM | 0.94 | 0.90 | 0.92 | — | |
| SASB issue | Distilled classifier | 0.82 | 0.64 | 0.72 [0.55, 0.84] | — |
| Dictionary | 0.38 | 0.44 | 0.40 | — | |
| Zero-shot | 0.18 | 0.19 | 0.18 | — | |
| Primary LLM | 0.97 | 0.74 | 0.84 | — | |
| Material ESG | Distilled classifier | 0.82 | 0.44 | 0.57 [0.33, 0.76] | — |
| Dictionary | 0.35 | 0.29 | 0.32 | — | |
| Zero-shot | 0.27 | 0.12 | 0.16 | — | |
| Primary LLM | 0.94 | 0.57 | 0.71 | — | |
Notes: Metrics are design-weighted to the population of narrative sentence instances (Section 4.3); 95% confidence intervals from a bootstrap stratified by keyword status (2,000 draws) are reported for the classifier. ESG relevance includes the auxiliary corporate-governance (CG) and general ESG-management (GEN) categories; SASB issue refers to the 26 SASB general issue categories; issue category is micro-averaged; quantitative and specific (quantitative or concrete) are evaluated among ESG sentences. Dictionary: Korean ESG keyword lexicon; zero-shot: similarity to the semantic anchors; numeric-cue rule: figures with units or target years. Panel A uses the labels of the primary annotating model. Panel B uses the human coding of the 400 test sentences that also form the reliability sample (materiality: the 395 sentences with an assigned industry); the primary LLM row scores the primary annotating model’s labels against the human coding. Cohen’s κ on these 400 sentences (ESG relevance; material sentence): primary and second annotating model, 0.91 and 0.92; human coding and primary model, 0.87 and 0.72; human coding and classifier, 0.76 and 0.59.
Table 3.
Known-group validity of the AI measures.
| Test | Coefficient | Std. error | N | Fixed effects |
| Designated GHG/energy entity → GHG emissions (E1) | 0.780*** | (0.087) | 7,226 | Industry × year |
| Designated GHG/energy entity → Energy management (E3) | 0.599*** | (0.070) | 7,226 | Industry × year |
| FY2021–FY2025 × industry with material employee health and safety → Employee health and safety | 0.048* | (0.027) | 7,268 | Firm, year |
Notes: Dependent variables are issue shares of narrative sentences (%). Designated entities state in their report that they are controlled entities under the GHG and energy target management scheme or allocated entities under the emissions trading scheme. Controls: size and log narrative sentences. Standard errors clustered by firm. *** p < 0.01, ** p < 0.05, * p < 0.1.
Table 4.
Descriptive statistics.
| Variable | N | Mean | SD | P25 | Median | P75 |
| SASB (%) | 7,278 | 3.385 | 2.782 | 1.333 | 2.727 | 4.698 |
| MAT (%) | 7,278 | 1.526 | 1.726 | 0.270 | 1.000 | 2.214 |
| IMM (%) | 7,278 | 1.859 | 1.849 | 0.621 | 1.335 | 2.500 |
| MATQ (%) | 7,278 | 0.135 | 0.336 | 0.000 | 0.000 | 0.146 |
| MATC (%) | 7,278 | 1.017 | 1.206 | 0.000 | 0.650 | 1.483 |
| MATV (%) | 7,278 | 0.373 | 0.523 | 0.000 | 0.187 | 0.583 |
| GEN (%) | 7,278 | 0.480 | 0.704 | 0.000 | 0.253 | 0.692 |
| CG (%) | 7,278 | 10.793 | 4.690 | 7.407 | 10.120 | 13.500 |
| KW_MAT (%) | 7,278 | 2.098 | 2.259 | 0.483 | 1.421 | 2.941 |
| KW_IMM (%) | 7,278 | 2.928 | 2.202 | 1.384 | 2.419 | 3.943 |
| Narrative sentences | 7,278 | 389.656 | 328.645 | 236.000 | 312.000 | 441.750 |
| Tobin’s Q | 6,690 | 1.095 | 0.759 | 0.720 | 0.889 | 1.188 |
| IVOL t+1 | 6,149 | 0.391 | 0.174 | 0.264 | 0.356 | 0.480 |
| ILLIQ t+1 | 6,127 | 0.106 | 0.264 | 0.006 | 0.023 | 0.070 |
| NCSKEW t+1 | 6,121 | −0.298 | 0.892 | −0.751 | −0.290 | 0.120 |
| Size (ln assets) | 7,276 | 27.393 | 1.654 | 26.276 | 27.171 | 28.343 |
| Leverage | 7,273 | 0.460 | 0.205 | 0.293 | 0.473 | 0.613 |
| ROA | 7,198 | 0.016 | 0.077 | 0.000 | 0.024 | 0.052 |
| Loss | 7,278 | 0.245 | 0.430 | 0.000 | 0.000 | 0.000 |
| Sales growth | 7,122 | 0.084 | 0.267 | −0.041 | 0.041 | 0.144 |
| Tangibility | 7,201 | 0.324 | 0.188 | 0.182 | 0.319 | 0.446 |
| Cash | 7,262 | 0.083 | 0.068 | 0.035 | 0.066 | 0.111 |
| Largest-shareholder ownership | 7,088 | 0.447 | 0.165 | 0.332 | 0.455 | 0.559 |
| Business group | 7,278 | 0.564 | 0.496 | 0.000 | 1.000 | 1.000 |
Notes: Continuous financial and market variables are winsorised at the 1st and 99th percentiles. Next-year (t+1) market variables are available for FY2016–FY2024 reports only, because calendar year 2026 was incomplete when the market data were collected. Variable definitions are given in Appendix Table A3.
Table 5.
Anticipation of mandatory sustainability disclosure: difference-in-differences estimates.
| Panel A: content and composition | SASB | MAT | IMM | MAT − IMM | MAT/SASB (%) | |
| Treat × Post | 0.797*** | 0.509*** | 0.288* | 0.222 | 0.454 | |
| (0.225) | (0.127) | (0.169) | (0.197) | (1.561) | ||
| Treat × Ann (FY2020) | 0.201 | 0.130* | 0.071 | 0.060 | 1.692 | |
| (0.176) | (0.076) | (0.149) | (0.158) | (1.395) | ||
| Pre-treatment mean, treated | 4.501 | 1.896 | 2.605 | −0.709 | 42.851 | |
| Observations | 6,747 | 6,747 | 6,747 | 6,747 | 6,453 | |
| Within R² | 0.021 | 0.023 | 0.007 | 0.002 | 0.003 | |
| Panel B: specificity and other content | MATQ | MATC | MATV | GEN | CG | ln N |
| Treat × Post | 0.103** | 0.280*** | 0.126*** | 0.283*** | −0.267 | 0.108*** |
| (0.043) | (0.085) | (0.036) | (0.057) | (0.313) | (0.024) | |
| Treat × Ann (FY2020) | 0.008 | 0.060 | 0.063** | 0.112** | −0.013 | 0.049*** |
| (0.025) | (0.056) | (0.025) | (0.045) | (0.236) | (0.015) | |
| Pre-treatment mean, treated | 0.233 | 1.277 | 0.386 | 0.611 | 8.721 | 6.203 |
| Observations | 6,747 | 6,747 | 6,747 | 6,747 | 6,747 | 6,747 |
| Within R² | 0.013 | 0.014 | 0.011 | 0.027 | 0.014 | 0.055 |
| Controls; firm and year FE | Yes | Yes | Yes | Yes | Yes | Yes |
Notes: Treat = 1 for KOSPI firms with consolidated assets of at least KRW 2 trillion at the end of FY2019; Post = 1 for FY2021–FY2025; Ann = 1 for FY2020 (reports filed in March 2021, two months after the roadmap). Dependent variables are shares of narrative sentences (%), except MAT / SASB (material sentences as a percentage of SASB-issue sentences, reports with at least one SASB-issue sentence) and ln N (log number of narrative sentences). MATQ, MATC and MATV split MAT into quantitative, concrete qualitative and generic sentences. Pre-treatment means refer to targeted firms in FY2016–FY2019. Controls: size, leverage, ROA, loss, sales growth and tangibility. Standard errors clustered by firm in parentheses. *** p < 0.01, ** p < 0.05, * p < 0.1.
Table 6.
Robustness of the anticipation effect (coefficient on Treat × Post).
| Specification | MAT | MATQ | IMM | GEN |
| Baseline | 0.509*** | 0.103** | 0.288* | 0.283*** |
| (0.127) | (0.043) | (0.169) | (0.057) | |
| Size-decile × year FE | 0.294 | 0.115 | 0.367 | 0.015 |
| (0.276) | (0.100) | (0.329) | (0.112) | |
| ln FY2019 assets × year controls | 0.225 | 0.090 | −0.156 | 0.141 |
| (0.181) | (0.061) | (0.233) | (0.090) | |
| Bandwidth: FY2019 assets KRW 0.5–8 tn | 0.359** | 0.089 | −0.016 | 0.244*** |
| (0.170) | (0.062) | (0.219) | (0.081) | |
| Excluding holding companies | 0.582*** | 0.113** | 0.357** | 0.305*** |
| (0.144) | (0.050) | (0.181) | (0.062) | |
| No controls | 0.501*** | 0.098** | 0.284* | 0.299*** |
| (0.127) | (0.043) | (0.166) | (0.057) | |
| Adding ln N (report length) as a control | 0.493*** | 0.098** | 0.274 | 0.282*** |
| (0.125) | (0.042) | (0.174) | (0.057) | |
| Deviation from linear pre-trend (event study, FY2021–FY2025 mean) | 0.290 | 0.100 | 0.153 | 0.313*** |
| (0.187) | (0.064) | (0.267) | (0.074) | |
| Placebo: KRW 1 tn threshold, firms < KRW 2 tn | 0.018 | 0.010 | 0.245 | 0.170** |
| (0.134) | (0.032) | (0.201) | (0.078) | |
| Placebo: KRW 5 tn threshold, firms ≥ KRW 2 tn | 0.056 | 0.001 | −0.208 | −0.030 |
| (0.236) | (0.079) | (0.321) | (0.104) | |
| Placebo timing: FY2018–FY2019 vs FY2016–FY2017 (pre-period only) | 0.061 | −0.014 | 0.128 | −0.012 |
| (0.073) | (0.021) | (0.101) | (0.026) | |
| Dictionary measures (KW_MAT, KW_IMM in the MAT and IMM columns) | 0.621*** | 0.541*** | ||
| (0.154) | (0.160) |
Notes: Each cell reports the coefficient on Treat × Post (standard error clustered by firm) from model (1). Unless stated otherwise, regressions include the baseline controls, Treat × Ann, and firm and year fixed effects. The pre-trend row reports the mean FY2021–FY2025 event-study coefficient minus a linear trend fitted to the FY2016–FY2019 coefficients (Figure 5 specification). *** p < 0.01, ** p < 0.05, * p < 0.1.
Table 7.
Financially material ESG disclosure and firm value (dependent variable: ln Tobin’s Q).
| (1) | (2) | (3) | (4) | (5) | (6) | (7) | |
| MAT | −0.001 | −0.011 | 0.014 | 0.017* | |||
| (0.013) | (0.013) | (0.009) | (0.009) | ||||
| MATQ | 0.006 | 0.004 | |||||
| (0.008) | (0.005) | ||||||
| MATC | −0.015 | −0.006 | |||||
| (0.014) | (0.010) | ||||||
| MATV | 0.014 | 0.023*** | |||||
| (0.013) | (0.009) | ||||||
| IMM | 0.029** | 0.029** | 0.020 | −0.001 | 0.001 | 0.000 | |
| (0.014) | (0.014) | (0.013) | (0.007) | (0.007) | (0.007) | ||
| GEN | 0.026* | −0.006 | |||||
| (0.014) | (0.009) | ||||||
| CG | 0.032** | 0.022** | |||||
| (0.014) | (0.010) | ||||||
| KW_MAT | 0.020 | ||||||
| (0.015) | |||||||
| KW_IMM | 0.012 | ||||||
| (0.014) | |||||||
| p-value: material = immaterial | 0.140 | 0.172 | 0.128 | 0.225 | 0.739 | 0.182 | 0.682 |
| Controls | Yes | Yes | Yes | Yes | Yes | Yes | Yes |
| Industry × year FE | Yes | Yes | Yes | No | No | No | Yes |
| Firm and year FE | No | No | No | Yes | Yes | Yes | No |
| Observations | 6,260 | 6,260 | 6,260 | 6,288 | 6,288 | 6,288 | 6,260 |
| Within R² | 0.139 | 0.140 | 0.145 | 0.088 | 0.090 | 0.090 | 0.138 |
Notes: Disclosure measures are standardised (mean 0, SD 1). MATQ, MATC and MATV split material sentences into quantitative, concrete qualitative and generic ones; KW_MAT and KW_IMM are dictionary counterparts. Controls: size, leverage, ROA, loss, sales growth, tangibility, cash, ln narrative sentences, largest-shareholder ownership and business-group affiliation (absorbed by the firm fixed effects in columns 4–6). The p-value tests equality of the first material coefficient and the IMM (or KW_IMM) coefficient. Standard errors clustered by firm in parentheses. *** p < 0.01, ** p < 0.05, * p < 0.1.
Table 8.
Financially material ESG disclosure and the information environment in the following year.
| IVOL t+1 (a) | IVOL t+1 (b) | ILLIQ t+1 (a) | ILLIQ t+1 (b) | NCSKEW t+1 (a) | NCSKEW t+1 (b) | |
| MAT | 0.0003 | −0.0063** | −0.008 | |||
| (0.0023) | (0.0030) | (0.016) | ||||
| MATQ | 0.0004 | −0.0030 | 0.015 | |||
| (0.0018) | (0.0026) | (0.011) | ||||
| MATC | −0.0013 | −0.0013 | −0.017 | |||
| (0.0025) | (0.0034) | (0.016) | ||||
| MATV | 0.0019 | −0.0047 | 0.000 | |||
| (0.0024) | (0.0033) | (0.015) | ||||
| IMM | 0.0006 | 0.0006 | −0.0037 | −0.0037 | 0.005 | 0.004 |
| (0.0019) | (0.0019) | (0.0029) | (0.0029) | (0.014) | (0.014) | |
| Lagged dependent variable | Yes | Yes | Yes | Yes | Yes | Yes |
| Controls | Yes | Yes | Yes | Yes | Yes | Yes |
| Industry × year FE | Yes | Yes | Yes | Yes | Yes | Yes |
| Observations | 5,691 | 5,691 | 5,661 | 5,661 | 5,630 | 5,630 |
Notes: IVOL: annualised idiosyncratic volatility from a market model of daily returns; ILLIQ: ln(1 + Amihud ratio); NCSKEW: negative conditional skewness of weekly firm-specific returns; all measured over calendar year t+1. The sample comprises FY2016–FY2024 disclosures with outcomes over 2017–2025; FY2025 disclosures are excluded because calendar year 2026 was incomplete when the market data were collected. Disclosure measures are standardised within the sample. Controls as in Table 7. Standard errors clustered by firm in parentheses. *** p < 0.01, ** p < 0.05, * p < 0.1.
Disclaimer/Publisher’s Note: The statements, opinions and data contained in all publications are solely those of the individual author(s) and contributor(s) and not of MDPI and/or the editor(s). MDPI and/or the editor(s) disclaim responsibility for any injury to people or property resulting from any ideas, methods, instructions or products referred to in the content. |
© 2026 by the authors. Licensee MDPI, Basel, Switzerland. This article is an open access article distributed under the terms and conditions of the Creative Commons Attribution (CC BY) license (http://creativecommons.org/licenses/by/4.0/).
Copyright: This open access article is published under a Creative Commons CC BY 4.0 license, which permit the free download, distribution, and reuse, provided that the author and preprint are cited in any reuse.