

Submitted:
01 November 2026
Posted:
03 November 2026
You are already at the latest version
Abstract
This paper documents how financial depth and banking-system stability evolved together in China between 2000 and 2021. Using 22 annual observations from the World Bank Global Financial Development Database, it examines private credit by deposit money banks to GDP, deposit money banks' assets to GDP, and China's banking-system Z-score. Private credit rose from 111.01% to 178.13% of GDP and bank assets from 118.39% to 214.23% of GDP, while the Z-score increased from 19.24 to 25.02. In levels, both depth indicators are positively correlated with the Z-score (0.671 and 0.670). Simple robustness checks, however, show that this association is fragile: year-to-year changes in depth and stability are essentially uncorrelated, and within 2006–2014, a period with a consistent data source, the correlation is close to zero. The full-period correlation is driven mainly by long-run trends and by two level shifts in the Z-score, in 2006 and in 2015, the latter coinciding with a change in the underlying data source. The results are descriptive and do not identify a causal effect; they point to bank-level panel data as the next step.
Keywords:
financial development
; banking stability
; bank Z‐score
; private credit
; China
1. Introduction
China's banking sector is one of the largest in the world and remains the main channel through which savings are allocated to firms and households. Over the past two decades it has expanded rapidly: by 2021, private credit extended by banks was close to 180% of GDP. A natural question is whether this rapid financial deepening was accompanied by a more or a less stable banking system.
Economic theory gives no single answer. Financial development can support growth by improving the allocation of capital, but rapid credit expansion is also a well-known source of financial fragility (Loayza & Rancière, 2006; Rajan, 2005). Whether deeper banking systems are safer or riskier is therefore an empirical question, and the answer may differ across countries and periods.
This paper takes a first, descriptive step toward that question for China. It asks: how did financial depth and banking-system stability evolve between 2000 and 2021, and how closely did they move together? The analysis uses three standard indicators from the World Bank Global Financial Development Database (GFDD) and combines descriptive statistics, trend analysis and Pearson correlation analysis.
The paper makes two modest contributions. First, it brings together long-run series on depth and stability for China in one place. Second, it shows, with simple robustness checks, that the positive full-period correlation between them does not survive in annual changes or within a period with consistent data, which matters for how such aggregate evidence should be read. The rest of the paper is organized as follows. Section 2 reviews related work, Section 3 describes the data and methods, Section 4 presents the results, Section 5 discusses their interpretation and limitations, and Section 6 concludes.
2. Related Literature
A large literature links financial development to economic growth, and standard measures of financial depth, such as private credit to GDP, come from this work (Beck, Demirgüç-Kunt & Levine, 2000; Čihák, Demirgüç-Kunt, Feyen & Levine, 2012). The same literature recognizes that depth and stability are distinct: Loayza and Rancière (2006) show that financial deepening supports growth in the long run, while short-run credit surges are associated with financial fragility.
Banking stability is commonly measured with the Z-score, which goes back to Roy (1952). It compares a bank's capital and returns with the volatility of its returns, so a higher value indicates a greater distance from insolvency. Laeven and Levine (2009) use the Z-score to study bank risk-taking, and Čihák et al. (2012) adopt a system-level version as the main stability indicator in the GFDD.
For China, Allen, Qian and Qian (2005) describe a financial system dominated by large state-owned banks, in which bank credit has played a central role in development. Much recent work studies Chinese bank risk with bank-level data. This paper does not attempt such analysis; instead, it documents the aggregate patterns that motivate it.
3. Data and Methodology
3.1. Data
All data come from the World Bank Global Financial Development Database, September 2022 version, which contains data through 2021 (World Bank, 2022). The sample consists of 22 annual observations for China from 2000 to 2021. Three indicators are used:
Private credit by deposit money banks to GDP (%) (GFDD.DI.01): credit extended to the private sector by deposit money banks, relative to GDP. It measures financial depth.
Deposit money banks' assets to GDP (%) (GFDD.DI.02): total assets of deposit money banks, relative to GDP. It measures the size of the banking system.
Bank Z-score (GFDD.SI.01): a system-level measure of stability, computed as
where ROA is the return on assets and σ(ROA) its standard deviation. A higher Z-score indicates that the banking system is further from insolvency. The Z-score is built from bank-level financial statements, which the GFDD draws from Bankscope for 2000–2014 and from Orbis for 2015 onward. This change of source is relevant when interpreting movements around 2015.
Z = (ROA + Equity/Assets) / σ(ROA)
3.2. Methods
The analysis has four parts. First, descriptive statistics report each indicator's level in 2000 and 2021, its percentage change, and its mean, minimum and maximum. Second, trend analysis plots each series over time to identify phases of expansion, decline and recovery. Third, Pearson correlation coefficients measure the linear association between the indicators over the full period. Fourth, three simple robustness checks test whether this association survives when common trends and level shifts are taken into account: correlations of annual changes, correlations within subperiods, and correlations within 2006–2014, the period before the Z-score's data source changes. The analysis was carried out in Python and Excel. Given the short sample, all results are interpreted as descriptive associations, not causal effects.
4. Results
4.1. Descriptive Statistics
All three indicators were higher in 2021 than in 2000 (Table 1). Private credit rose by about 60% relative to its 2000 level, bank assets by about 81%, and the Z-score by about 30%. Bank assets grew faster than private credit, consistent with banks expanding into assets other than private-sector loans.
4.2. Trends
The two depth indicators move almost in parallel (Figure 1 and Figure 2). Both rose until 2003, declined until 2008, jumped in 2009 and then increased steadily, peaking in 2020 before a small decline in 2021. The jump in 2009 coincides with the large credit expansion that followed the global financial crisis.
The Z-score follows a very different path (Figure 3). It fell from 19.24 in 2000 to between 9.5 and 11.6 in 2001–2005, returned to 19.24 in 2006 and stayed between 18.6 and 20.4 until 2014. It then jumped to 23.63 in 2015 and reached 25.02 in 2021. The abrupt recovery in 2006 coincides with the restructuring and public listing of China's large state-owned banks in the mid-2000s, which is one possible explanation that this paper does not test. The jump in 2015 coincides with the change in the underlying bank-level data source from Bankscope to Orbis (World Bank, 2022), so part of it may reflect a measurement break rather than a real change in stability.
4.3. Correlation Analysis
Table 2 reports Pearson correlations over the full period. Private credit and bank assets are almost perfectly correlated (0.993), which shows that the two indicators capture largely the same dimension of financial depth. Each is positively correlated with the Z-score, at 0.671 and 0.670 respectively. Figure 4 plots private credit against the Z-score.
4.4. Robustness Checks
Because both depth and the Z-score trend upward, a positive correlation in levels may simply reflect common trends. Table 3 therefore repeats the correlation under three alternative specifications.
The results change sharply across specifications. Year-to-year changes in depth are essentially uncorrelated with changes in the Z-score. Within 2006–2014, when the stability series comes from a single data source, the correlation is close to zero. The strong positive correlation for 2006–2021 comes largely from the jump in 2015, while in 2000–2005 the relationship is negative. Taken together, these checks suggest that the baseline correlation of about 0.67 reflects long-run trends and level shifts rather than a stable year-to-year link between depth and stability.
5. Discussion and Limitations
Taken at face value, the baseline results suggest that China's banking system became both deeper and more stable between 2000 and 2021. The trend analysis and robustness checks show why this reading is incomplete. The positive correlation comes mainly from the fact that both depth and the Z-score were low in the early 2000s and high in the late 2010s, and from two level shifts in the Z-score. Year to year, and within the period with a consistent data source, there is almost no association.
Four limitations remain. First, with only 22 annual observations and strong common trends, the study cannot separate an economic relationship from coincident trends; the subperiod checks rest on even fewer observations. Second, the Z-score series contains a break in 2015, when its source changes from Bankscope to Orbis, which affects any full-period comparison. Third, aggregate indicators hide differences across banks: large state-owned banks, joint-stock banks and city and rural commercial banks may have followed very different paths. Fourth, the analysis covers a single country and does not control for macroeconomic, regulatory or institutional factors.
These findings do not make the descriptive evidence uninformative, but they define what it can and cannot show. It shows that depth and measured stability both rose over the period as a whole. It does not show a stable link between the two, and it cannot show that financial deepening caused greater stability.
6. Conclusions
This paper documented the evolution of financial depth and banking-system stability in China from 2000 to 2021. Private credit and bank assets relative to GDP expanded substantially, and the Z-score was higher at the end of the period than at the start. The full-period correlation between depth and stability is positive, but it disappears in annual changes and within the period with a consistent data source, and it cannot be interpreted as causal.
The main lesson is methodological: national averages over a short time series can show broad patterns but not the mechanisms behind them. Future work should use bank-level panel data, which would allow researchers to control for bank and year effects and to compare how credit growth relates to stability across different types of Chinese banks.
References
- Allen, F.; Qian, J.; Qian, M. Law, finance, and economic growth in China. J. Financ. Econ. 2005, 77(1), 57–116. [Google Scholar] [CrossRef]
- Beck, T.; Demirgüç-Kunt, A.; Levine, R. A new database on the structure and development of the financial sector. World Bank. Econ. Rev. 2000, 14(3), 597–605. [Google Scholar]
- Čihák, M.; Demirgüç-Kunt, A.; Feyen, E.; Levine, R. Benchmarking financial systems around the world; World Bank Policy Research Working Paper No. 6175; 2012. [Google Scholar]
- Laeven, L.; Levine, R. Bank governance, regulation and risk taking. J. Financ. Econ. 2009, 93(2), 259–275. [Google Scholar] [CrossRef]
- Loayza, N. V.; Rancière, R. Financial development, financial fragility, and growth. J. Money Credit Bank. 2006, 38(4), 1051–1076. [Google Scholar]
- Rajan, R. G. Has financial development made the world riskier? NBER Working Paper No. 11728. 2005. [Google Scholar] [CrossRef]
- Roy, A. D. Safety first and the holding of assets. Econometrica 1952, 20(3), 431–449. [Google Scholar] [CrossRef]
- World Bank. Global Financial Development Database, September 2022 version [Data set and metadata; World Bank, 2022. [Google Scholar]
Figure 1.
Private credit by deposit money banks to GDP in China, 2000–2021 (%).
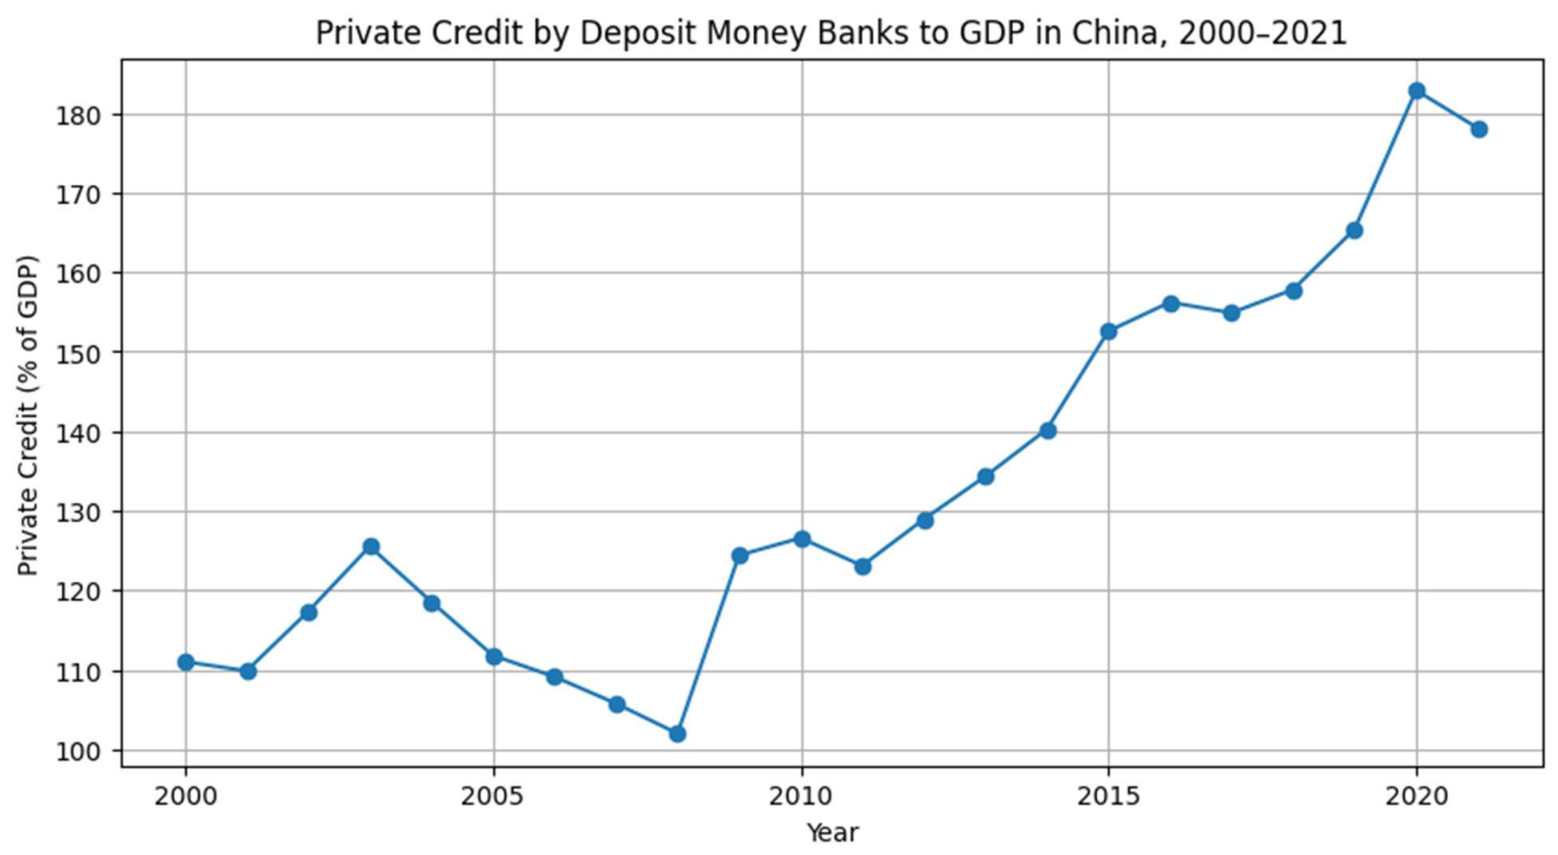
Figure 2.
Deposit money banks' assets to GDP in China, 2000–2021 (%).
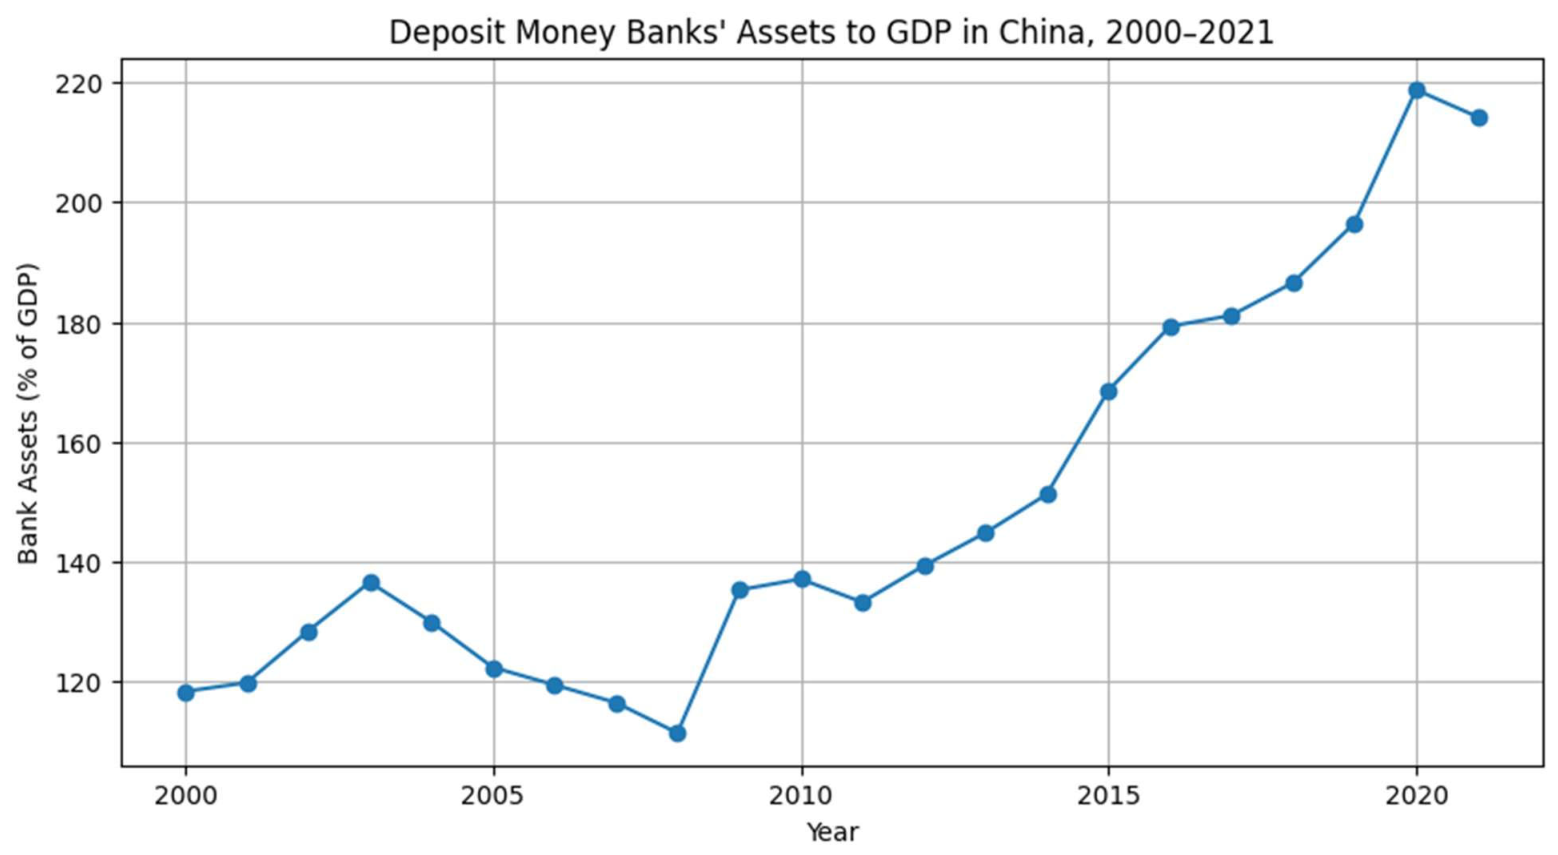
Figure 3.
Bank Z-score in China, 2000–2021.
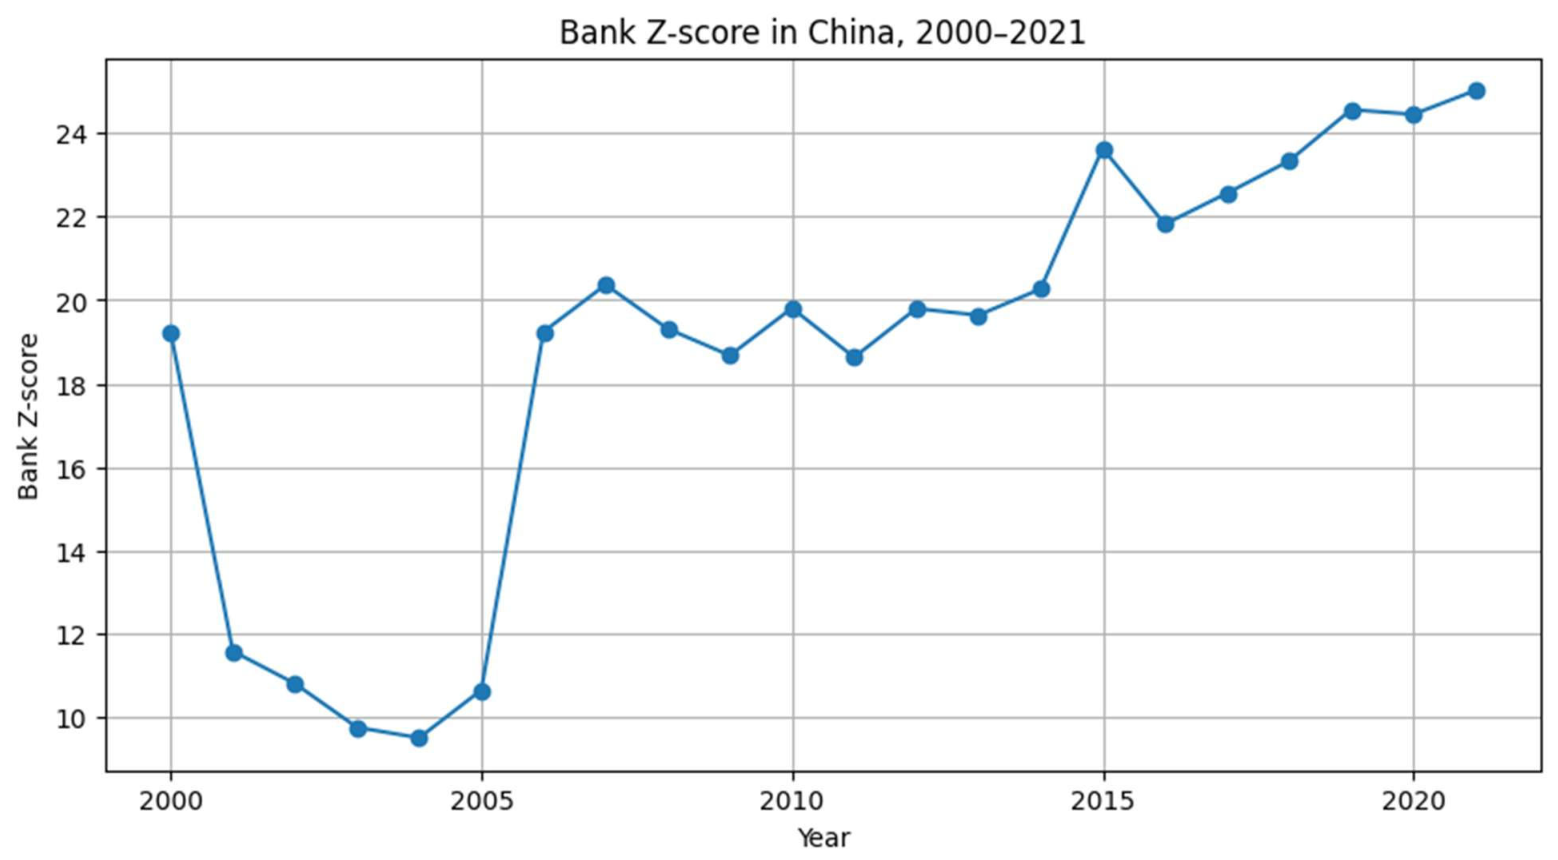
Figure 4.
Private credit to GDP and the bank Z-score in China, 2000–2021.
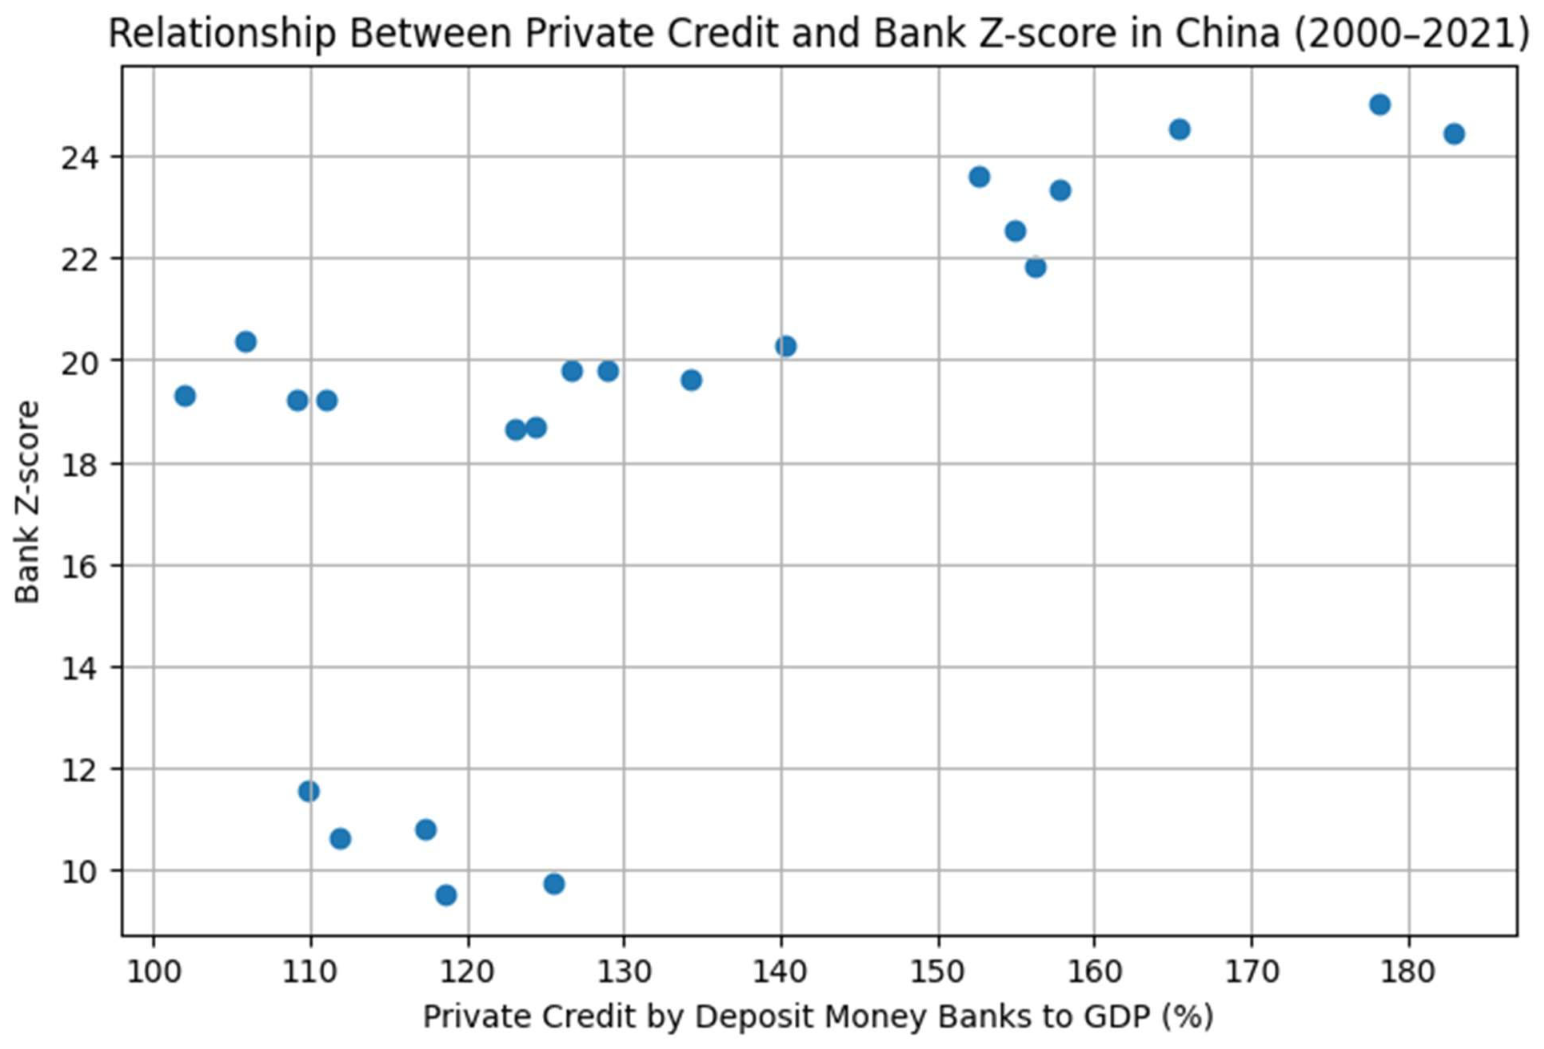

Table 1.
Descriptive statistics, China, 2000–2021.
| Indicator | 2000 | 2021 | Change (%) | Mean | Min (year) | Max (year) |
|---|---|---|---|---|---|---|
| Private credit to GDP (%) | 111.01 | 178.13 | 60.46 | 133.47 | 101.99 (2008) | 182.87 (2020) |
| Bank assets to GDP (%) | 118.39 | 214.23 | 80.96 | 149.51 | 111.45 (2008) | 218.74 (2020) |
| Bank Z-score | 19.24 | 25.02 | 30.05 | 18.75 | 9.51 (2004) | 25.02 (2021) |
Source: World Bank, Global Financial Development Database (2022). Change is relative to the 2000 level.
Table 2.
Correlation matrix, 2000–2021 (n = 22).
| Private credit | Bank assets | Bank Z-score | |
|---|---|---|---|
| Private credit | 1.000 | 0.993 | 0.671 |
| Bank assets | 0.993 | 1.000 | 0.670 |
| Bank Z-score | 0.671 | 0.670 | 1.000 |
Note: Pearson correlation coefficients computed on annual levels.
Table 3.
Correlation with the bank Z-score under alternative specifications.
| Specification | n | Private credit | Bank assets |
|---|---|---|---|
| Levels, 2000–2021 (baseline) | 22 | 0.671 | 0.670 |
| Annual changes, 2001–2021 | 21 | −0.02 | −0.06 |
| Levels, 2000–2005 | 6 | −0.52 | −0.66 |
| Levels, 2006–2021 | 16 | 0.89 | 0.92 |
| Levels, 2006–2014 (Bankscope period only) | 9 | 0.14 | 0.15 |
Note: Pearson correlation coefficients. Subperiod results rest on very few observations and are indicative only.
Disclaimer/Publisher’s Note: The statements, opinions and data contained in all publications are solely those of the individual author(s) and contributor(s) and not of MDPI and/or the editor(s). MDPI and/or the editor(s) disclaim responsibility for any injury to people or property resulting from any ideas, methods, instructions or products referred to in the content. |
© 2026 by the authors. Licensee MDPI, Basel, Switzerland. This article is an open access article distributed under the terms and conditions of the Creative Commons Attribution (CC BY) license (http://creativecommons.org/licenses/by/4.0/).
Copyright: This open access article is published under a Creative Commons CC BY 4.0 license, which permit the free download, distribution, and reuse, provided that the author and preprint are cited in any reuse.