

Submitted:
26 October 2026
Posted:
03 November 2026
You are already at the latest version
Abstract
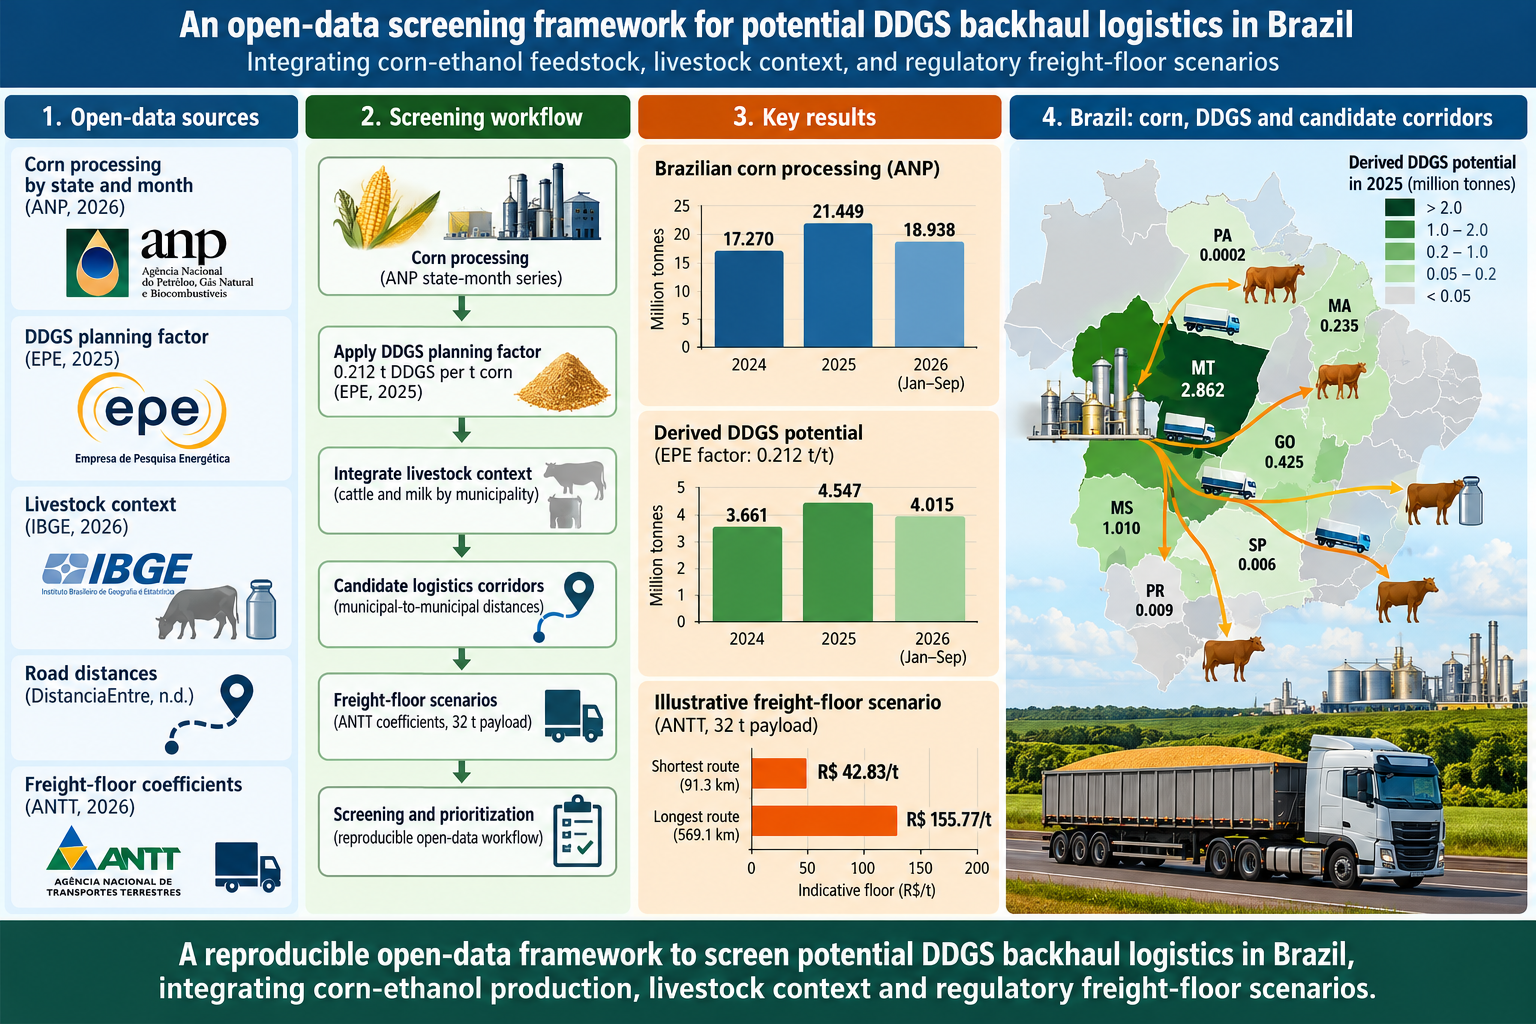
Brazil’s expanding corn-ethanol sector generates distillers dried grains with solubles (DDGS), a coproduct used in animal nutrition, while road freight logistics may create opportunities to coordinate agricultural supply chains. Yet public production, livestock and distance indicators do not establish plant-level saleable supply, buyer demand, or an actual empty return movement. This study develops a reproducible open-data screening workflow linking an ANP-derived state-month corn-processing series, an EPE planning conversion factor, municipal livestock context, eight candidate municipal corridors, and an illustrative minimum-freight-floor scenario based on ANTT coefficients. The integrated series indicates 17.270 million tonnes of corn processed in 2024 and 21.449 million tonnes in 2025 (+24.2%). Applying the EPE planning factor of 0.212 tonnes of DDGS per tonne of corn yields derived estimates of 3.661 and 4.547 million tonnes, respectively; these are planning-factor estimates, not measured DDGS production. For January–September, reported corn processing rises from 15.509 million tonnes in 2025 to 18.938 million tonnes in 2026 (+22.1%). Eight candidate corridors span 91.3–569.1 km. Under the selected ANTT scenario and an assumed 32-tonne payload, the full-trip floor ranges from R$ 42.83 to R$ 155.77/t. Sensitivity cases allocating 25–50% of that floor to DDGS produce scenario allocations of R$10.71–R$77.89/t across the route set, but these are not observed savings. A break-even margin equation is provided for readers to populate with their own product prices, handling costs, buyer values and verified freight quotations. The study’s contribution is an auditable screening and reproduction protocol that distinguishes observations, derived estimates and assumptions, and makes explicit which commercial data are needed to assess market-specific profitability.
Keywords:
DDGS
; corn ethanol
; backhaul
; freight logistics
; livestock
; open data
; Brazil
; reproducibility
1. Introduction
Industrial corn-ethanol production creates coproduct streams that can be used in animal feeding, including distillers dried grains with solubles (DDGS). Brazilian studies have characterized corn-ethanol coproducts for animal nutrition, while also showing that coproduct categories and nutritional properties should not be treated as interchangeable (Costa et al., 2018; Corassa et al., 2024). At the same time, agricultural freight systems often involve imbalanced flows, scheduling constraints and empty vehicle movements. The potential to combine coproduct distribution with existing freight movements is therefore a relevant logistics question, but it cannot be answered from production and livestock statistics alone.
Research on empty running and backhauling emphasizes that matching loads is constrained by geography, timing, vehicle compatibility, contracts, and information availability (Dejax & Crainic, 1987; McKinnon & Ge, 2006). Recent work also treats backhaul coordination as an optimization and market-design problem rather than a simple distance-matching exercise (Emadikhiav et al., 2024; Farren et al., 2024; Ryan et al., 2025). A geographically nearby livestock population is not equivalent to a buyer with a verified ration, price, volume, storage capacity and delivery window. Likewise, a state-level coproduct estimate does not establish saleable inventory at a particular plant.
This study develops an open-data screening framework for potential DDGS backhaul logistics in Brazil. It integrates an ANP-derived state-month corn-processing series, a planning conversion factor published by the Empresa de Pesquisa Energética (EPE), municipal cattle and milk indicators, public municipal-to-municipal road-distance references, and an illustrative scenario using coefficients from Brazil’s National Land Transport Agency (ANTT) (ANP, 2026; ANTT, 2026; DistanciaEntre, n.d.; EPE, 2025; IBGE, 2026). The intended output is a reproducible prioritization tool for subsequent primary-data collection, not a claim that any route is commercially viable.
The research questions are: (1) what recent trend in corn processing is visible in the supplied state-month series; (2) what DDGS quantities follow if the EPE planning yield is applied transparently; (3) how do candidate corridor distances and indicative regulatory freight-floor scenarios compare; and (4) what evidence is still required before evaluating backhaul economics?
2. Data and Methods
2.1. Design and evidence classes.
The analysis is a descriptive, exploratory screening study. Each input is classified as an observed or reported public-data field, a derived quantity, a scenario assumption, or a missing primary commercial observation. The classification is retained in the project data files and README. No missing commercial quantity is imputed as if observed.
2.2. Corn processing.
The main time series is the integrated state-month table supplied in ANP_UF_Mensal_Integrado_v13.csv, covering January 2017 through September 2026. The column milho_processado_t is aggregated by calendar year and state. The supplied extract has nine months for 2026; therefore, 2026 is treated as year-to-date and is not annualized. This study does not equate total ethanol production with corn ethanol production. The input is a processed-data extract assembled from source files attributed to ANP (2026), so the original files and the integrated workbook are included in the reproducibility package; researchers should verify the current official files and any revisions before extending the series.
2.3. DDGS potential estimate.
The EPE PDE 2035 Caderno de Oferta de Biocombustíveis reports an average planning conversion factor of 0.212 tonnes of DDGS per tonne of corn (EPE, 2025, p. 13). For each state-year, estimated DDGS is calculated in (I) as:
(〖DDGS〗_((s,y) ) ) ̂="CornProcesse" "d" _("(" s,y")" )∙0.212
Where:
(〖"DDGS" 〗_(s,y) ) ̂: estimated DDGS production in state \( s\) during year \( y\) , expressed in tonnes (t).
"CornProcesse" "d" _("(" s,y")" ): total mass of corn processed for ethanol production in state \( s\) during year \( y\) , expressed in tonnes (t), based on ANP data.
s: Brazilian state (federative unit).
y: reference year.
This is a derived planning estimate, not a measurement of actual DDGS output, sales, inventory, or availability. The factor is a mean planning assumption and EPE notes that some units may achieve higher factors. Sensitivity analysis should be performed when plant-specific yields become available.
2.4. Livestock context and candidate corridors.
Eight candidate corridors were retained from the preceding screening workflow. The route distances are public municipal-seat-to-municipal-seat road-distance references obtained from IBGE road-distance reference database, not verified gate-to-gate routes; the source URLs for each pair are preserved in the processed route file and source register. Destination bovine inventories and milk production are retained as territorial context only, based on the supplied municipal data snapshots (IBGE, 2026). They are not converted into DDGS demand, feed intake, or market size. Candidate plant or company labels in the source screening file are not treated as proof of the exact origin facility or a commercial relationship.
2.5. Freight-floor scenario.
The route scenario applies the formula (II), with CCD = R$7.5641/km and CC = R$680.01/trip for the specific scenario documented in ANTT Portaria SUROC No. 22/2026: Table A, solid bulk, six loaded axles, and contracting the complete vehicle combination, conventional operation (ANTT, 2026).
F_min=d_"km" ∙CCD+CC
Where:
F_min: indicative minimum freight charge per trip (BRL/trip).
d_"km" : reference road distance between the origin and destination, in kilometers (km).
CCD: Coeficiente de Custo de Deslocamento (displacement cost coefficient), expressed in BRL per kilometer (BRL/km), according to the applicable ANTT freight table and vehicle/cargo category.
CC: Coeficiente de Custo de Carga e Descarga (loading and unloading cost coefficient), expressed in BRL per trip (BRL/trip).
Assumed 32-tonne payload converts the trip amount to R$/t. This default is only a scenario. The applicable ANTT classification depends on the actual operation and must be reproduced using the official calculator. The floor is not a market quote, actual freight cost, or estimate of savings. The base floor calculation excludes tolls and other contract-specific costs unless entered separately.
2.6. Reproducibility.
The package includes input extracts, processed tables, scripts, figures, an Excel workbook, a source register, a dependency list and instructions. The main script rebuilds annual totals, the state estimates and the route scenario from the packaged CSV files. Results are deterministic given the included inputs and assumptions. Source-data changes can alter results; the package therefore preserves the exact processed input snapshots used in this version.
2.7. Freight allocation and break-even margin
For economic screening, the equation (III) is:
F_(min,"tonne" )=(d_"km" ∙CCD+CC)/P
Where:
F_(min,"tonne" ): indicative full-trip minimum freight floor per tonne of cargo (BRL/t).
d_"km" : reference road distance between the origin and destination (km).
CCD: distance-related cost coefficient under the applicable ANTT freight table (BRL/km).
CC: loading and unloading cost coefficient (BRL/trip).
P: assumed payload carried per trip (tonnes/trip).
Sensitivity cases allocate 0.25, 0.50, 0.75, or 1.00 of this amounts to the DDGS movement. The difference relative to 100% allocation is reported only as an allocation-sensitivity measure. Conditional unit margin in equation (IV) is defined as:
⧵[M=V_b-C_p-C_h-F_a-C_o ⧵]
Where:
M: estimated net contribution margin per tonne of DDGS (BRL/t).
V_b: assumed buyer value or selling price per tonne of DDGS (BRL/t).
C_p: DDGS purchase or ex-works acquisition cost per tonne (BRL/t).
C_h: handling, loading, storage, and related logistics costs per tonne (BRL/t).
F_a: allocated freight cost per tonne (BRL/t), based on the selected freight scenario.
C_o: other applicable costs per tonne (BRL/t), such as additional handling, transaction, or operational costs not included in the other terms.
The equation estimates the residual contribution per tonne after subtracting acquisition, handling, allocated freight, and other applicable costs from the assumed buyer value. If \( M>0\) , the scenario indicates a positive estimated contribution margin, if \( M=0\) , the scenario reaches break-even, and if \( M<0\) , the scenario indicates a negative estimated contribution margin.
Missing commercial inputs remain blank; no values are imputed from livestock statistics or national DDGS estimates.
3. Results and Discussions
3.1. Corn processing trend
The integrated series totals 17.270 million tonnes in 2024 and 21.449 million tonnes in 2025, a 24.2% increase. The 2025 total is an aggregate of the state-month values in the supplied extract. For January–September, the total increases from 15.509 million tonnes in 2025 to 18.938 million tonnes in 2026, a 22.1% increase. The 2026 value is partial-year data and should not be compared with a full-year total without matching the observation window. Table 1 reports the annual and partial-year totals, while Figure 1 shows the time trend.
3.2. Derived DDGS potential
Applying the EPE factor yields 3.661 million tonnes for 2024 and 4.547 million tonnes for 2025 (EPE, 2025). For January–September 2026, the corresponding derived estimate is 4.015 million tonnes. These figures represent the result of applying a planning factor to the supplied corn-processing series; they are not measured DDGS production, plant-level output, saleable inventory, or observed sales. Table 2 presents the state-level 2025 estimates and shares, and Figure 2 visualizes the derived state distribution.
3.3. Candidate corridor screen.
The eight distances range from 91.3 km (Luís Eduardo Magalhães–Barreiras) to 569.1 km (Dourados–Corumbá), based on public municipal-distance references (DistanciaEntre, n.d.). Under the selected ANTT scenario and assumed 32-tonne payload, the indicative floor ranges from R$42.83/t to R$155.77/t (ANTT, 2026). These values are regulatory-floor scenarios, not current carrier quotations or verified costs. Table 3 presents the corridor-level inputs and calculated scenario values; Figure 3 compares the indicative per-tonne floors.
3.4. Data-quality signals
The supplied state series reports zero corn processing for Bahia in 2025 even though the corridor screening file includes a Bahia corridor and a candidate industrial locality. This discrepancy is a data-coverage warning, not evidence that no corn-ethanol coproduct is produced or sold there. It illustrates why state-level reporting, plant-level industrial inventories and route candidates should not be treated as interchangeable. The prior DDG plant inventory also contains inconsistent totals under differing status and capacity definitions; those values are not used as actual production in the present analysis.
3.5. Freight-allocation and break-even economic scenarios
To make the economic implications transparent using the available open-data inputs, we calculated a sensitivity range in which 25%, 50%, 75%, or 100% of the indicative full-trip ANTT floor is allocated to the DDGS movement (ANTT, 2026). Across the eight candidate corridors, the 25% allocation is R$10.71–R$38.94/t, while the 50% allocation is R$21.42–R$77.89/t. These are allocation scenarios—not measured cost reductions, freight savings, or realized profitability.
The model also specifies a break-even margin equation that readers can populate with their own commercial data: margin per tonne = buyer net value at destination − ex-works product cost − product handling/storage costs − allocated freight − other documented costs. In the current open-data dataset, buyer value, ex-works DDGS/WDG price, plant-level saleable volume, nutritional equivalence, and transaction-specific freight quotes are not available. Accordingly, the model calculates the freight component and exposes the break-even equation, but it cannot calculate an observed positive or negative commercial margin. The Excel workbook includes input fields for buyer value and product/handling cost; once filled with the reader’s own verified values, it calculates a conditional margin per tonne.
Table 4 summarizes the freight allocation sensitivity. The 25%, 50%, 75%, and 100% fractions are illustrative assumptions. A lower allocated cost can represent a plausible backhaul case only if the relevant trip would otherwise occur, the product can be loaded in the equipment, delivery windows align, and the carrier accepts the rate. Otherwise, the relevant cost may be closer to a dedicated trip or a separately negotiated market rate.
4. Discussion
The framework provides a reproducible way to move from dispersed public data toward a prioritized data-collection plan. The annual processing series indicates growth in the corn feedstock represented in the supplied ANP-derived extract, while the EPE yield factor gives a transparent order-of-magnitude coproduct estimate. State concentration suggests that plant-level verification in Mato Grosso, Mato Grosso do Sul and Goiás may yield the greatest initial coverage of the estimated national potential. That prioritization is for data collection only, not an investment recommendation.
The freight scenario makes assumptions visible instead of using an undocumented per-kilometre cost. However, a regulatory minimum floor is a compliance reference, not a price prediction. Actual freight depends on operational classification, route, equipment, tolls, loading and unloading, contract structure, availability of return cargo, and market conditions. The official ANTT calculator must be used for each real movement. In particular, a hypothetical fraction of a trip cost allocated to DDGS cannot be interpreted as savings unless the carrier’s actual counterfactual trip, incremental costs and payment terms are documented.
The same caution applies to demand. Municipal cattle numbers and milk production indicate where livestock activity occurs, but cannot determine whether feedlots, dairy farms, cooperatives or feed manufacturers buy DDGS, at what volume, at what price, or with which nutritional specifications (IBGE, 2026). DDGS and wet distillers grains (WDG) should not be merged: moisture, shelf life, storage, transport and feed formulation differ, and nutritional characterization literature underscores that coproduct type matters (Costa et al., 2018; Corassa et al., 2024). The package’s primary-data collection sheet therefore requires product type, proximate/nutritional analysis, moisture, price basis, monthly quantity, delivery terms and buyer confirmation.
Prior literature on empty running demonstrates that theoretical proximity does not guarantee a feasible backhaul, because suitable loads may be limited by timing, distance and operational constraints (Dejax & Crainic, 1987; McKinnon & Ge, 2006). Recent economic and optimization studies likewise frame empty trips and backhaul coordination as problems shaped by market conditions, matching frictions, and operational constraints (Farren et al., 2024; Ryan et al., 2025). The contribution here is an auditable integration protocol for a specific emerging agricultural coproduct chain, including explicit boundaries between public observations, planning-factor estimates and commercial evidence.
5. Limitations and future work
This is an exploratory screening study, not a validated logistics optimization or economic feasibility assessment. First, the main ANP-derived series is a processed extract assembled from source files supplied for this project; the exact files are included, but a new extraction from the current ANP system and a reconciliation of revisions remain necessary before journal submission (ANP, 2026). Second, the 0.212 conversion factor is a planning average, not plant-specific yield (EPE, 2025). Third, public distance sources represent municipal references and may disagree; exact facility coordinates and route recalculation are required. Fourth, state-level processing cannot be allocated to individual plants. Fifth, livestock indicators are not demand measurements (IBGE, 2026). Sixth, the ANTT scenario requires route-specific confirmation, and no carrier quote is available (ANTT, 2026). Seventh, no empirical truck trajectory, empty-return probability, fuel consumption, greenhouse-gas inventory, product price or feed substitution value is included.
Future validation should collect plant-level DDGS/WDG volumes and monthly availability; buyer-specific demand and acceptance specifications; laboratory analyses; ex-works and delivered prices; formal freight quotes; exact gate-to-gate distances; tolls; equipment and payload; loading/unloading times; scheduling windows; proof of a return movement; and the carrier’s incremental cost allocation. With these inputs, a later study could estimate delivered-cost competitiveness, solve a constrained network-flow or vehicle-routing model, and test environmental outcomes. Those analyses should be reported separately from this open-data screen.
6. Conclusion
This study presents a reproducible open-data screening workflow for investigating potential DDGS backhaul logistics in Brazil. In the supplied ANP-derived series, corn processing totals 21.449 million tonnes in 2025, and the EPE planning factor produces a derived estimate of 4.547 million tonnes of DDGS. Eight candidate municipal corridors span 91.3–569.1 km, with scenario-specific indicative freight-floor values of R$42.83–155.77/t under the stated ANTT assumptions. These outputs help prioritize primary-data collection but do not establish actual plant supply, buyer demand, a compatible empty return, cost savings, or commercial viability. The key scientific contribution is methodological transparency: observations, derived estimates, and assumptions are separated, and the workflow is packaged for independent reproduction and future validation.
Funding
Funding information was not established in the materials available for this package. The author must state the accurate funding position in the submission system and manuscript declarations before submission.
CRediT Author Statement
Draft for author confirmation: Conceptualization; methodology; data curation; formal analysis; software; visualization; writing—original draft; writing—review and editing. Confirm that each role accurately reflects the author’s contributions before submission.
Declaration of Competing Interests
Author confirmation required: disclose any competing financial or personal interests, or declare that none exist if that is accurate.
Data Availability
The reproducibility package includes the processed input snapshots used for the main calculations, analysis script, output tables, figures, workbook, source register and instructions. Original source data may be updated; snapshots and their hashes are included to identify the versions used. A permanent repository DOI has not been assigned and should be added if the data/code are deposited in a repository.
Ethics Statement
The study uses aggregated secondary public data and does not involve experiments on animals or human participants.
Generative AI Disclosure
The author must review the journal’s current policy and accurately disclose any generative-AI assistance used in preparation of the manuscript. Do not submit a generic disclosure without confirming the policy and the actual use.
References
- Agência Nacional de Transportes Terrestres (ANTT). Portaria SUROC nº 22, de 28 de setembro de 2026. 2026. Available online: https://anttlegis.antt.gov.br/action/ActionDatalegis.php?acao=abrirTextoAto&cod_menu=7782&cod_modulo=421&link=S&numeroAto=00000022&orgao=SUROC%2FANTT%2FMT&seqAto=000&tipo=POR&valorAno=2026.
- Agência Nacional do Petróleo; Gás Natural e Biocombustíveis (ANP). Dados abertos: arquivos de produção de etanol, capacidade e matérias-primas processadas [conjunto de arquivos de dados]. 2026. Available online: https://www.gov.br/anp/pt-br/centrais-de-conteudo/dados-abertos.
- Corassa, A.; Straub, I. W. W.; Sbardella, M.; Ton, A. P. S.; Kiefer, C.; Brito, C. O.; Rothmund, V. L.; Freitas, L. W. Brazilian corn ethanol coproducts for pigs: Feeding value and blood parameters. Animals 2024, 14, 2108. [Google Scholar] [CrossRef]
- Costa, I.; Silva, A. A.; Barata, F. G.; Moreira, A. L. S.; Resende, L. R. Coprodutos da indústria de etanol de milho na alimentação de ruminantes. Pubvet 2018, 12, 1–7. [Google Scholar] [CrossRef]
- Dejax, P. J.; Crainic, T. G. Survey paper—A review of empty flows and fleet management models in freight transportation. Transp. Sci. 1987, 21, 227–248. [Google Scholar] [CrossRef]
- DistanciaEntre. (n.d.). Estimativas de distâncias rodoviárias entre sedes municipais utilizadas na triagem de corredores. Route-specific pages are listed in the source register and processed route dataset. Available online: https://www.distanciaentre.com.br/.
- Emadikhiav, M.; Bhattacharjee, S.; Day, R.; Bergman, D. A decision support framework for integrated lane identification and long-term backhaul collaboration using spatial analytics and optimization. Decis. Support Syst. 2024, 180, 114186. [Google Scholar] [CrossRef]
- Empresa de Pesquisa Energética (EPE). Plano Decenal de Expansão de Energia 2035: Caderno de Oferta de Biocombustíveis. 2025. Available online: https://www.epe.gov.br/pt/publicacoes-dados-abertos/publicacoes/plano-decenal-de-expansao-de-energia-2035.
- Farren, D.; Giesen, R.; Rizzi, L. I. The economics of empty trips. Econ. Transp. 2024, 39, 100361. [Google Scholar] [CrossRef]
- Instituto Brasileiro de Geografia e Estatística (IBGE). Pesquisa da Pecuária Municipal (PPM): resultados e tabelas municipais. 2026. Available online: https://www.ibge.gov.br/estatisticas/economicas/agricultura-e-pecuaria/9107-producao-da-pecuaria-municipal.
- McKinnon, A. C.; Ge, Y. The potential for reducing empty running by trucks: A retrospective analysis. Int. J. Phys. Distrib. Logist. Manag. 2006, 36, 391–410. [Google Scholar] [CrossRef]
- Ryan, D.; Lam, T.; Dong, Y.; Olinick, E. Practical and effective heuristics for the backhaul profit maximization problem. Netw. Spat. Econ. 2025, 25, 957–984. [Google Scholar] [CrossRef]
Figure 1.
Annual corn processing in the supplied ANP-derived state-month series. The 2026 point is partial-year data through September.
Figure 1.
Annual corn processing in the supplied ANP-derived state-month series. The 2026 point is partial-year data through September.
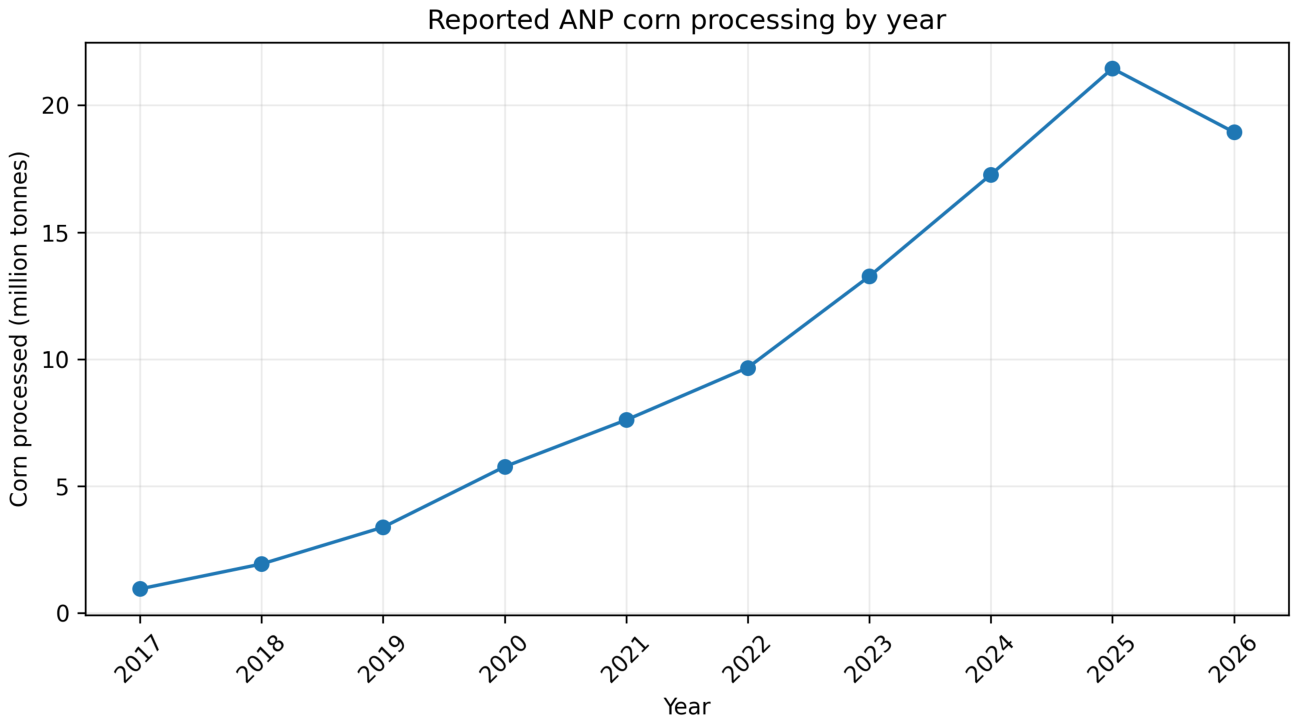
Figure 2.
Derived state-level DDGS potential in 2025. This is not plant-level production or saleable inventory.
Figure 2.
Derived state-level DDGS potential in 2025. This is not plant-level production or saleable inventory.
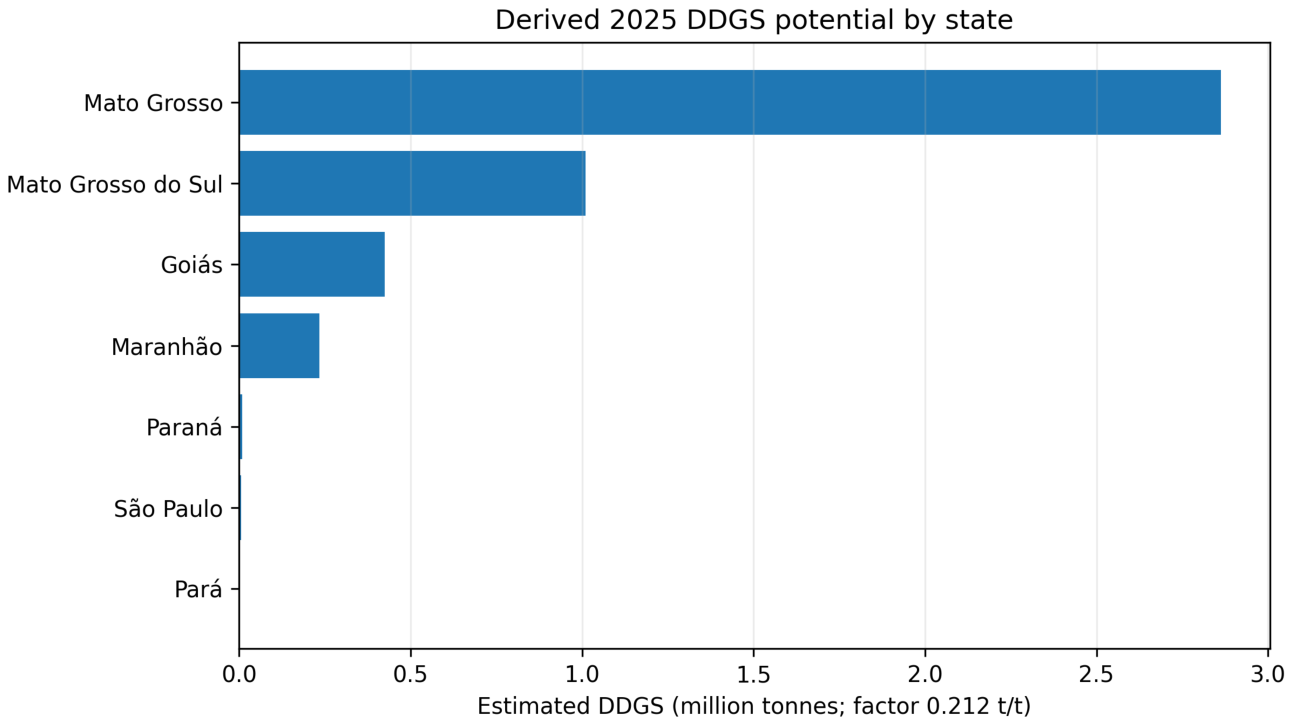
Figure 3.
Indicative floor scenario based on a single assumed ANTT classification and 32-tonne payload. Not a market freight quote.
Figure 3.
Indicative floor scenario based on a single assumed ANTT classification and 32-tonne payload. Not a market freight quote.
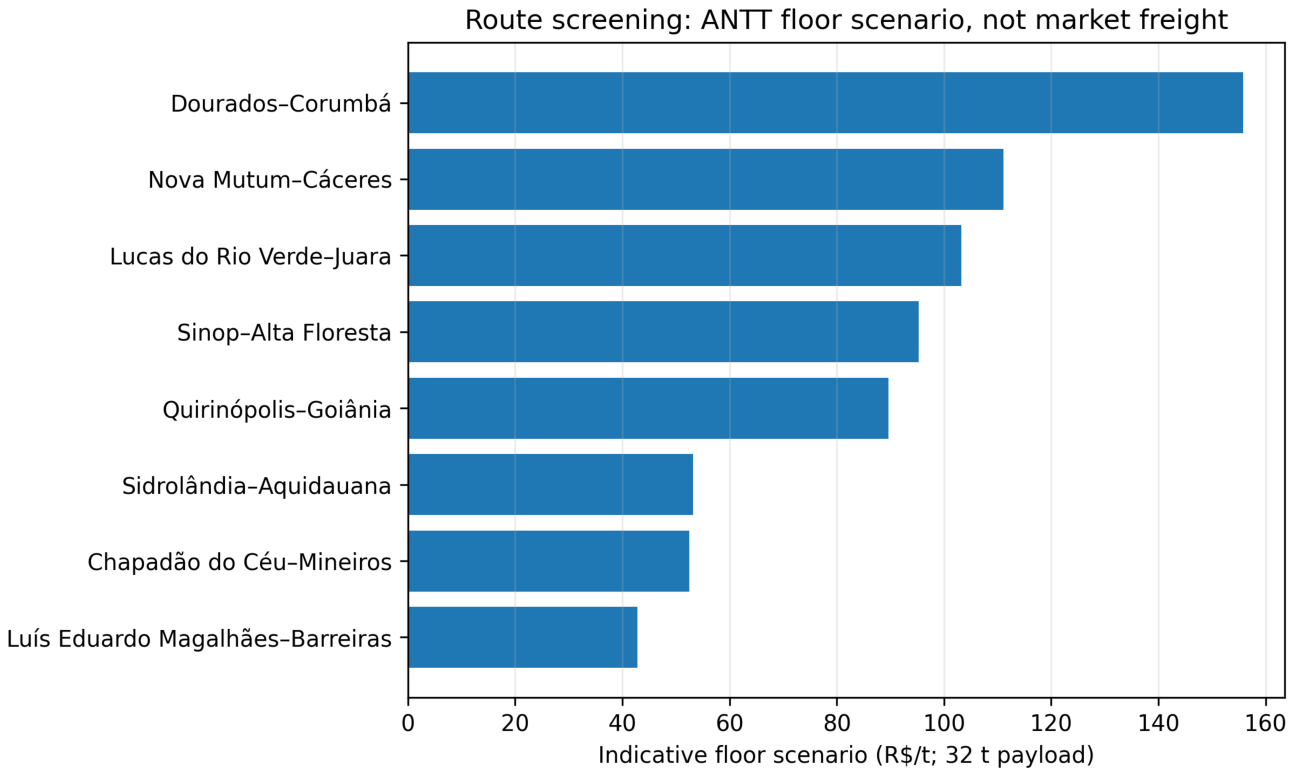

Table 1.
National annual corn processing and derived DDGS estimate.
| PERIOD | CORN PROCESSED (Mt) | DDGS ESTIMATE (Mt) | INTERPRETATION |
|---|---|---|---|
| 2024 | 17.270 | 3.661 | Full year; DDGS is derived using 0.212 t/t |
| 2025 | 21.449 | 4.547 | Full year; DDGS is derived using 0.212 t/t |
| 2026 (Jan–Sep) | 18.938 | 4.015 | Jan–Sep only; DDGS is derived using 0.212 t/t |
Table 2.
State-level 2025 estimates (largest recorded corn-processing states).
| STATE | CORN PROCESSED (Mt) | SHARE (%) | DDGS ESTIMATE (Mt) |
|---|---|---|---|
| Mato Grosso (MT) | 13.501 | 62.95 | 2.862 |
| Mato Grosso do Sul (MS) | 4.765 | 22.22 | 1.010 |
| Goiás (GO) | 2.004 | 9.34 | 0.425 |
| Maranhão (MA) | 1.107 | 5.16 | 0.235 |
| Paraná (PR) | 0.043 | 0.20 | 0.009 |
| São Paulo (SP) | 0.027 | 0.13 | 0.006 |
| Pará (PA) | 0.001 | 0.01 | 0.0002 |
Table 3.
Candidate corridor distance and indicative freight-floor scenario.
| ORIGIN | DESTINATION | DISTANCE (km) | INDICATIVE FLOOR (R$/trip) | INDICATIVE FLOOR (R$/t) |
|---|---|---|---|---|
| Luís Eduardo Magalhães (BA) | Barreiras (BA) | 91.3 | 1,370.61 | 42.83 |
| Chapadão do Céu (GO) | Mineiros (GO) | 132.1 | 1,679.23 | 52.48 |
| Sidrolândia (MS) | Aquidauana (MS) | 135.0 | 1,701.16 | 53.16 |
| Quirinópolis (GO) | Goiânia (GO) | 289.3 | 2,868.30 | 89.63 |
| Sinop (MT) | Alta Floresta (MT) | 313.2 | 3,049.09 | 95.28 |
| Lucas do Rio Verde (MT) | Juara (MT) | 347.0 | 3,304.75 | 103.27 |
| Nova Mutum (MT) | Cáceres (MT) | 380.3 | 3,556.64 | 111.14 |
| Dourados (MS) | Corumbá (MS) | 569.1 | 4,984.74 | 155.77 |
Table 4.
Freight allocation sensitivity across eight candidate corridors (scenario values; not observed savings).
Table 4.
Freight allocation sensitivity across eight candidate corridors (scenario values; not observed savings).
| ALLOCATION SHARE | FLOOR ALLOCATION RANGE (R$/t) | DIFFERENCE VS 100% (R$/t) | MEANING | EVIDENCE NEEDED TO CALL IT SAVINGS |
|---|---|---|---|---|
| 25% | R$10.71–R$38.94 | R$32.12–R$116.83 | Assumed fraction of full-trip floor | Verified counterfactual trip, return load, incremental cost and contract |
| 50% | R$21.42–R$77.89 | R$21.42–R$77.89 | Assumed fraction of full-trip floor | Verified counterfactual trip, return load, incremental cost and contract |
| 75% | R$32.12–R$116.83 | R$10.71–R$38.94 | Assumed fraction of full-trip floor | Verified counterfactual trip, return load, incremental cost and contract |
| 100% | R$42.83–R$155.77 | R$0.00–R$0.00 | Assumed fraction of full-trip floor | Verified counterfactual trip, return load, incremental cost and contract |
Disclaimer/Publisher’s Note: The statements, opinions and data contained in all publications are solely those of the individual author(s) and contributor(s) and not of MDPI and/or the editor(s). MDPI and/or the editor(s) disclaim responsibility for any injury to people or property resulting from any ideas, methods, instructions or products referred to in the content. |
© 2026 by the authors. Licensee MDPI, Basel, Switzerland. This article is an open access article distributed under the terms and conditions of the Creative Commons Attribution (CC BY) license (http://creativecommons.org/licenses/by/4.0/).
Copyright: This open access article is published under a Creative Commons CC BY 4.0 license, which permit the free download, distribution, and reuse, provided that the author and preprint are cited in any reuse.