
Submitted:
31 October 2026
Posted:
02 November 2026
You are already at the latest version
Abstract
The sustainable transition of rail transit is central to sustainable mobility under China's dual-carbon goals, yet energy use and carbon emissions from operations keep rising as networks expand, and most of the evidence is city- or line-level, with little known about what operators' own green practices deliver. Using a 2017–2025 panel of eight A-share listed rail transit operators, this study applies a two-way fixed-effects difference-in-differences specification to compare changes in estimated carbon intensity and financial performance around firms' green practices — an exploratory descriptive comparison, since identification rests on a single treated firm — and then simulates four pathways for 2026–2030 — business as usual, green electricity and technology, inclusion in carbon trading, and their combination — calibrated on Shentong Metro's 2025 operating data, and extrapolates the results to industry level. Existing green practices remain marginal: green electricity purchased by Beijing–Shanghai High-Speed Railway in 2025 covered about 1% of its estimated electricity use, and the comparison detects no statistically significant change in carbon intensity (β = 0.225, p = 0.421) or on financial performance. The green-technology pathway cuts carbon intensity by 41.6% below the baseline by 2030, with cumulative abatement of about 39.8 kt CO2 and a cumulative net profit gain of 9.15 million CNY over five years; the combined pathway delivers the same abatement with stronger cost resilience under tightening quotas. Raising the green-electricity share of China's urban rail transit to 40% would abate about 6.46 Mt CO2 per year. By quantifying and monitoring the sustainability performance of rail operators at the firm level, this study provides reproducible measurement tools and evidence-based references for sustainability policy and corporate sustainable strategy in the transport sector.
Keywords:
sustainability
; sustainable transport
; rail transit
; carbon intensity
; green electricity
; carbon trading
; difference-in-differences
; scenario simulation
1. Introduction
The green and low-carbon transition of transport is a standing item in China's carbon peaking deployment. Both the Action Plan for Carbon Peaking before 2030 and the Energy Conservation and Carbon Reduction Action Plan for 2024–2025 encourage the construction of photovoltaic facilities at transport hubs and along transport networks. Rail transit is known as a low-carbon mode of travel, but operations themselves consume large amounts of energy. According to the annual statistical and analytical reports on urban rail transit issued by the China Association of Metros, by the end of 2025 urban rail was in operation in 58 cities, covering 13,067.89 km of lines and carrying 33.383 billion passenger trips in the year, with total electricity consumption of 29.008 billion kWh, of which traction accounted for 52.22%; both figures are record highs. On the railway side, the statistical bulletins of the National Railway Administration report 4.601 billion passenger trips and 5.277 billion tonnes of freight sent in 2025, and a comprehensive energy intensity of national railways of 3.90 tce per million converted tonne-km. Existing studies estimate that operating carbon emissions of China's urban rail transit grew by about 217% between 2015 and 2022, and that emissions of the railway operation sector rose from 57.75 million to 64.21 million tonnes between 2016 and 2021, with the share of indirect electricity-based emissions climbing to 78.8%. Networks are still expanding, and industry energy use and emissions are unlikely to turn downward in the short run. How to cut emissions from operations is therefore a question the rail transit industry has to answer.
A considerable body of causal evidence already exists on the environmental externalities and abatement effects of rail transit. At the facility level, opening a metro line lowers downtown particulate concentrations by roughly 4% in initially heavily polluted cities [1]. At the city level, the opening of high-speed rail [2,3], better metro network accessibility [4], the launch of urban rail transit [5] and the operation of China-Europe freight trains [6] have all been shown to reduce carbon emissions significantly. High-speed rail networks also lower residents' exposure to pollution [7] and encourage substitution towards electric vehicles [8], which brings additional health and carbon benefits. Systematic reviews group these mechanisms into a mode-shift effect and a ridership-scale effect, and note that the net outcome depends on factors such as the generation mix of the power system [9]. On emission accounting, studies have quantified operating emissions of urban rail at the national scale [10], examined the spatiotemporal heterogeneity of railway operating emissions [11], estimated life-cycle emission intensities and carbon payback periods [12,13,14], forecast operating emissions and evaluated abatement measures [15], characterised the operating emissions of regional high-speed railways and railway bureaus [16,17], measured the carbon emission efficiency of railway transport enterprises [18], assessed the contribution of rail transit to urban transport decarbonisation [19,20], modelled operating energy consumption [21] and decomposed the drivers of transport-sector emissions [22]. Together they describe the level, structure and determinants of emissions in the industry.
Research on mechanisms and policy offers further reference points. General-equilibrium assessments of China's national carbon market find that an intensity-based tradable performance standard yields environmental benefits well above its costs, and that allowance auctioning would lower economy-wide costs by a further 30% [23,24]. Broadening the coverage of emissions trading improves social welfare [25], and studies of carbon pricing for railway freight show that, with well-designed allowances and carbon prices, transport firms can earn surplus revenue from their quotas [26]. Equilibrium sorting models at the city level indicate that combining congestion charging with metro expansion delivers the largest efficiency gains [27], while work on frictions in transport markets cautions that policy evaluation should not ignore the efficiency properties of the market itself [28]. At the firm level, ESG ratings significantly promote the green transition of listed companies [29], information disclosure alone produces behavioural and health benefits [30], and energy prices are the core driver of transport electrification [31]. Evidence from European railways shows that carbon emission efficiency rises with passenger efficiency, with the economy-wide share of freight turnover and with competition in the passenger market, whereas fiercer competition in freight may induce substitution towards low-cost diesel traction and lower efficiency [32]. On pathway design, multi-scenario peaking simulations [33,34], forecasts of peaking dates for the transport sector [35], measurements of the abatement effects of freight restructuring [36], pathway design for urban rail peaking [37], coordinated pollution-and-carbon control frameworks [38] and estimates of industry abatement costs [39] supply methods and parameters. At the technical level, key technologies for integrating photovoltaics into AC/DC traction power supply [40], demonstration of distributed photovoltaics on the Shanghai network [41], technoeconomic analysis of rooftop PV at elevated stations [42], measured savings across the source-grid-load-storage-operation chain [43], network-level estimates of multi-technology savings [44] and the integrated application of new energy technologies [45] together support the feasibility of green-electricity substitution and retrofits by rail operators.
Several gaps remain. First, causal evidence is concentrated at the city and facility levels and rarely reaches the firm: how much carbon the green practices of rail operators actually abate, and whether they pay, is still an open micro question. Second, assessments of carbon markets mostly target power and other industrial sectors; how the cost and revenue structure of rail operating firms would change if they were included in emissions trading has not been quantified. Third, the effects of scaling up green electricity, photovoltaics and carbon trading at the firm level have not been examined in scenario assessments calibrated with real firm data. Listed companies are the micro actors with the most complete disclosure in the industry and are a suitable window onto its low-carbon transition. Practice has already started. Shentong Metro (600834.SH) set up its wholly owned subsidiary Shanghai Metro New Energy at the end of 2018; by the end of 2025 it had built and operated, or managed under trust, about 67.3 MWp of photovoltaic plants, the largest installed capacity in China's rail transit sector, abating about 29,704 tonnes of CO2 in 2025 alone (according to the company's annual and ESG reports). Beijing-Shanghai High-Speed Railway (601816.SH) signed a strategic cooperation agreement with China Power International Development in January 2022 giving priority to clean electricity; in 2025 it purchased 7,339.30 MWh of green electricity and generated 16,228.90 MWh from rooftop photovoltaics at its stations (according to the company's annual and sustainability reports). Guanghui Logistics (600603.SH) completed the electrification of the Hongnao railway in September 2024, replacing diesel locomotives with electric ones and cutting energy costs by 60-70% (according to company announcements). Under the Beijing carbon trading management measures, the Beijing carbon market already manages five urban rail operators as key emitters, and rail transit firms will soon face carbon constraints directly.
Building on a 2017–2025 panel of eight A-share listed rail transit companies, this paper combines operating data, a DID model and scenario simulation. It first uses a two-way fixed-effects DID model to test the net impact of corporate green practices (photovoltaic and new energy operations, purchases of green electricity and green certificates) on carbon intensity and financial performance. It then takes Shentong Metro's 2025 actuals as the benchmark and simulates four pathways, business as usual, green electricity and technology, carbon trading inclusion and their combination, over the 15th Five-Year Plan period (2026–2030), and extrapolates the results to the industry level. The paper makes three contributions. First, it moves the unit of analysis down: causal evidence on rail transit abatement has so far been city- and line-based, whereas here DID identification is applied to the green practices of listed operators, tracing the chain from practice scale to emission intensity to financial performance. Second, it links micro evidence with forward-looking simulation: following the practice of combining econometric estimation with scenario analysis in transport policy evaluation and carbon market assessment, the scenario parameters are calibrated with real operating data. Third, it reports a null result as it is and interprets it quantitatively; on that basis it sizes the abatement and profit space of scaled-up pathways over 2026–2030, providing a reproducible quantitative reference for corporate low-carbon strategy and industry incentive design. In doing so, the paper also responds to the broader agenda of defining, quantifying and monitoring sustainability in the transport sector: it measures corporate-level sustainability performance with reproducible operating data and links that measurement to sustainability-oriented policy design for the rail industry.
2. Theoretical Analysis and Research Hypotheses
2.1. Decarbonisation Pathways for Rail Transit Operators
Rail transit in this paper covers urban rail transit and national railway operators. Low-carbon development refers to a development model that reduces carbon emissions per unit of transport work while maintaining service supply, through a cleaner energy mix, higher energy efficiency and management innovation. In the emission structure, indirect emissions from purchased electricity dominate and their share keeps rising: the indirect-emission share of the 18 railway group companies rose from 67.9% in 2016 to 81.4% in 2021 [18], individual bureaus already reached 90.9% in 2022, and electric traction accounts for more than nine tenths of traction emissions [17]. Nearly all operating emissions of urban rail come from purchased electricity. Green-electricity substitution is therefore the most effective lever available to the industry. Tracing the source-grid-load-storage-operation chain, three firm-level pathways stand out.
The first is green-electricity substitution. Rail operators hold contiguous space resources, including depot rooftops, elevated stations and land along lines, and their power loads are stable, which favours distributed photovoltaics and green-electricity consumption. Key technologies for connecting photovoltaics to AC/DC traction supply are mature, demonstration projects on the Shanghai network have confirmed operational feasibility, and the economics of rooftop PV at elevated stations has been quantified; integrating transport and energy infrastructure has been made a national policy orientation. The second is energy-efficiency retrofits. Traction takes about half of metro energy use, and station ventilation and air conditioning another 16–30% [14,43,44]. Permanent-magnet synchronous traction, regenerative braking recovery, storage devices, smart lighting and high-efficiency air conditioning can further cut unit consumption, and the measured saving rate of permanent-magnet traction already exceeds 20% [43]. The third pathway combines efficiency improvement with market mechanisms. European experience shows that passenger efficiency, the economy-wide share of freight turnover and competition in the passenger market all raise railway carbon efficiency [32]; better transport organisation is itself an abatement measure, while purchases of green electricity and green certificates and participation in carbon trading shape low-carbon incentives from the energy mix and the cost side respectively.
2.2. Research Hypotheses
Three hypotheses follow. H1: adopting green electricity, photovoltaics and other new energy technologies lowers the carbon intensity of listed rail transit companies and improves low-carbon benefits. H2: once included in the carbon market, the internalisation of carbon costs pushes firms to increase low-carbon investment and further reduce emissions. H3: relative to business as usual, the green-electricity and technology pathway and the carbon trading pathway abate more, and the combination of the two performs best. Since no listed company in the sample is yet under carbon quota management, H1 is tested directly with the DID model; H2 and H3 cannot be identified within the listed sample and are recast as scenario questions examined quantitatively in Section 5.
3. Research Design
3.1. Sample and Data
Three criteria govern sample selection: the core business must be rail transport services, the firm must be listed on A-shares with publicly available data, and the sample should cover both urban rail and railway operations. Eight firms meet them: Shentong Metro (urban rail operation plus new energy), Beijing-Shanghai High-Speed Railway (high-speed passenger transport), Daqin Railway (railway freight, mainly coal), Guangshen Railway (railway passenger and freight transport), Tielong Logistics (special container transport and logistics), Xibu Chuangye (railway freight within Ningxia), Guanghui Logistics (freight on the Hongnao railway in Xinjiang, now trading as ST Guangwu) and China Railway Special Cargo (transport of commodity cars, cold-chain and outsize cargo, listed in 2021). The sample period is 2017–2025 (Table 1). Financial data come from annual reports, operating volumes from annual reports and announcements, and industry statistics from the association reports and railway bulletins cited above. Two caveats apply. Guanghui Logistics was administratively penalised by the CSRC in October 2024 for prematurely recognising revenue in its property business, and its 2023 annual report restated the 2022 figures; this paper uses the restated data (according to the annual report and the restatement announcement). Hongnao railway volumes for 2019–2021 follow the disclosure of Guanghui Energy and those from 2023 follow Guanghui Logistics announcements; the 2022 value is not disclosed precisely and is treated as missing, with the two calibres marked line by line in the data files. For China Railway Special Cargo the main operating indicator is the number of commodity cars dispatched (8.0587 million units in 2025), which is not comparable with freight tonnage; the firm is therefore excluded from the carbon intensity calculations and included only in the financial performance models.
Operating scales differ widely across the sample. In 2025 Daqin Railway recorded revenue of about 77.65 billion CNY and net profit attributable to shareholders of about 5.90 billion CNY, the largest in the sample; Beijing-Shanghai High-Speed Railway recorded revenue of about 43.06 billion CNY and net profit of about 13.17 billion CNY, the most profitable; Shentong Metro recorded revenue of about 596 million CNY, the smallest. Treatment status and timing are set as follows: Shentong Metro from 2020, the first full operating year of its new energy business, and Beijing-Shanghai High-Speed Railway from 2022, the year of the green electricity cooperation; the other six firms form the control group. Both treatment dates are firm decisions rather than external policy shocks, so self-selection cannot be ruled out: the timing of green investment may correlate with unobserved business conditions. Two institutional anchors nonetheless narrow the window for discretion. Shentong Metro's new energy subsidiary was incorporated in late 2018 under Shanghai's distributed photovoltaic promotion programme, which makes 2020 the first full operating year rather than a discretionary pick; Beijing-Shanghai HSR's green-electricity cooperation in 2022 followed the national green-electricity trading pilots launched in 2021. The estimates below are therefore interpreted as associations around these events rather than as the effect of an exogenous treatment (Section 6.3).
3.2. Estimation of Carbon Intensity
Listed companies do not disclose operating emissions, so emissions are estimated from operating volumes and public factors. For the railway firms, converted turnover equals (passengers sent × national average trip length + freight sent × national average haul) / 106, in million converted tonne-km, and CO2 equals converted turnover × the comprehensive energy intensity of national railways × 2.66 tCO2 per tonne of standard coal, where average trip length, average haul and energy intensity are taken from the railway statistical bulletins. For Shentong Metro, CO2 equals passenger trips × the national average metro electricity use per trip × 0.5568 kgCO2/kWh, where electricity use per trip is computed from the association's statistics on total electricity use and ridership for the year, and 0.5568 kgCO2/kWh is the 2021 national average emission factor for electricity published by the Ministry of Ecology and Environment. Carbon intensity is defined as estimated CO2 over operating revenue (tCO2 per 10,000 CNY of revenue). Three properties of this estimator matter for what follows. First, the electricity factor and the railway energy intensity are national values common to all firms in a given year; in logarithmic form such common factors are absorbed by the year fixed effects, so switching to year-varying national factors — the Ministry of Ecology and Environment and the National Bureau of Statistics published 0.5366 kgCO2/kWh for 2022 in December 2024 — changes estimated levels but not the DID coefficients. Second, applying the national average energy intensity to every railway firm introduces firm-specific level errors (a high-speed passenger line plausibly runs below the freight-heavy national average), but time-invariant level errors are absorbed by the firm fixed effects; bias would arise only if the treated firm's measurement error trended differently around treatment, which the event study in Section 4.3 examines directly. Third, revenue is an imperfect denominator because it mixes transport and non-transport business; Section 4.2 therefore repeats the test with ln(CO2) as the outcome, which removes the denominator altogether. Estimates carry uncertainty proportional to the factor error: a ±10% error in the energy intensity factor shifts firm-level intensity by the same proportion but does not affect the sign or significance of the DID estimates. Throughout the paper, 'authors' estimates' refers to values calculated from public data with the methods of this section, and 'authors' simulation' refers to the scenario outputs of Section 5.
The main limitation is that Xibu Chuangye and Guanghui Logistics are regional short-haul freight carriers, and applying the national average haul probably overstates their turnover and emissions; a robustness regression that excludes Xibu Chuangye addresses this, and the results should be read as exploratory. The calibration is consistent with earlier studies. The 0.5568 kgCO2/kWh factor used here is the 2021 national average, close to the 2022 national factor of 0.581 kgCO2/kWh used in life-cycle studies. At the 2025 national railway energy intensity of 3.90 tce per million converted tonne-km, emissions per unit of converted turnover are about 10.4 tCO2 per million converted tonne-km, near the lower bound of the 13.59–19.1 range reported in bureau-level studies, which is what one would expect, since the national average mixes in passenger services while the bureau-level figures are dominated by coal freight.
3.3. Model Specification and Variables
A two-way fixed-effects DID model is specified:
where the dependent variables Y are ln(carbon intensity), ROA (net profit attributable to shareholders over total assets) and the gross margin; DIDit is the treated × post interaction; the controls X are ln(total assets), the debt-to-asset ratio and ln(number of employees); αi and λt are firm and year fixed effects; and standard errors are clustered at the firm level (CR1). The specification follows common practice for staggered and multi-period DID in transport studies. Because Shentong Metro disclosed ridership only from 2020, it has no pre-treatment observations in the intensity model, and the carbon-intensity DID is in effect identified by Beijing-Shanghai High-Speed Railway alone (42 observations, 6 firms); the financial performance models use all eight firms (72 observations). Identification checks comprise an event study with the year before treatment as the base (parallel trends), a placebo test with 500 random permutations of treated status and timing, and a robustness regression excluding Xibu Chuangye. Because the intensity model is identified by a single treated firm whose treatment date is self-selected, the DID results are reported as an exploratory descriptive comparison rather than definitive causal estimates. Pre-treatment balance is limited. Over 2017–2021, standardised mean differences between the treated firm and the five control firms in the intensity sample are −2.64 for ln carbon intensity, +2.73 for ln total assets, −3.16 for ln staff and +1.17 for the gross margin, with ROA closer (−0.18) and the debt ratio moderate (−0.42); in the eight-firm financial sample the differences are +0.12 for ln total assets, −2.62 for ln staff, +0.62 for the debt ratio and −0.39 for ROA. Firm and year fixed effects and the control variables absorb time-invariant gaps and common shocks, but the remaining imbalance is a further reason to read the estimates descriptively.
Yit = αi + λt + βDIDit + γ'Xit + εit (1)
4. Empirical Results
4.1. Descriptive Statistics
Table 2 reports sample-period means of the main indicators. Estimated carbon intensity differs sharply across firms: Beijing-Shanghai High-Speed Railway is the lowest at 0.049 tCO2 per 10,000 CNY of revenue and Xibu Chuangye the highest at 3.805, the latter reflecting the likely overstatement of turnover under a regional short-haul profile. Figure 1 shows that national urban rail operating length and ridership nearly doubled between 2017 and 2025, with electricity use climbing in step. Figure 2 shows that firm-level intensity drifted down or stayed flat at a low level, with the centre of Shentong Metro's intensity shifting down after 2020.
4.2. Baseline Estimates
Table 3 reports the DID estimates, which, given the single treated firm, should be read as a descriptive comparison around the green-practice events. In column (1), the carbon-intensity model, the DID coefficient is 0.225 with a cluster-robust standard error of 0.279 (p = 0.421) and is statistically insignificant; excluding Xibu Chuangye in column (2) gives 0.188 (p = 0.540) and leaves the conclusion unchanged. Replacing the revenue-deflated outcome with ln(CO2), which removes the denominator and the dilution concern, gives 0.371 (p = 0.253), again insignificant. In columns (3) and (4), the effects on ROA (β = 0.006, p = 0.477) and on the gross margin (β = 0.087, p = 0.245) are insignificant as well.
The explanation lies in treatment intensity. Beijing-Shanghai High-Speed Railway purchased 7,339.30 MWh of green electricity in 2025, only about 1% of its estimated operating electricity use (according to the annual and sustainability reports). Shentong Metro's photovoltaic output has grown fast, but it is booked mainly as revenue of the new energy business rather than as abatement of the operator's own emissions. Corporate green practice is still in its infancy and too small in scale to move firm-level carbon intensity by an identifiable margin. A decomposition confirms that scale, not direction, binds. Between 2022 and 2024 the treated firm's estimated emissions rose by ln 1.02, of which the recovery of converted turnover from the pandemic trough accounts for about ln 1.04 (101%), while the national energy-intensity factor contributes −0.01; against volume swings of this size, abatement from a green-electricity share of about 1% cannot be identified statistically. The alternative reading that green abatement was offset by volume growth therefore reinforces, rather than contradicts, the conclusion that current practice is too small to register. This null result does not contradict the significant city-level evidence on metro opening, high-speed rail opening and network expansion: those estimates capture the macro effect of rail networks substituting for high-carbon travel, whereas this paper captures the net effect of green practices inside the operator's own operations, which are two different margins. For the purposes of this paper the null carries information: the abatement potential of current corporate practice is far from exhausted, and that is precisely what motivates the scaled-up settings of the scenario analysis in Section 5. H1 therefore receives no empirical support at the current scale of practice.
4.3. Parallel Trends and Placebo Tests
Figure 3 reports the event study with 2021, the year before treatment, as the base. The coefficient at lead 2 is insignificant, and so are the coefficients in the treatment year and afterwards, consistent with the baseline. The coefficient at lead 3 (2019) is large and carries a wide confidence interval, which reflects the disruption that the pandemic inflicted on intensity estimates through swings in ridership between 2020 and 2022; the parallel-trends assumption is supported outside that disturbed interval. In the placebo test, treated status and timing are randomly permuted 500 times. The placebo coefficients centre on zero, the true estimate (β = 0.225) lies inside the distribution, and the share of |placebo| ≥ |true| is 0.594, so the baseline estimate is not distinguishable from random assignment and is unlikely to be driven by omitted variables. Given the small number of firms, the DID results should be read as exploratory, descriptive evidence (Section 6.3).
The central fact of this section is that existing green practices have not yet produced a statistically significant net effect on the aggregate carbon intensity or the financial performance of listed operators, and the reason is scale rather than direction. The new energy segment of Shentong Metro earned a net margin of about 42% in 2025 (net profit of 20.04 million CNY on revenue of 47.71 million CNY, according to the annual report), which shows that the photovoltaic business itself is economically sound at project level.
5. Scenario Simulation
5.1. Scenario Design and Parameters
Following the benchmark-plus-policy structure of the scenario literature, the simulation uses the actual 2025 operating and new energy data of Shentong Metro as the carrier; it is the only A-share listed company whose main business is urban rail operation and whose new energy disclosure is complete. The simulation covers 2026–2030, the 15th Five-Year Plan period. All base parameters come from public sources or are stated as assumptions (Table 4): 2025 revenue of 596.33 million CNY, net profit attributable to shareholders of 54.22 million CNY and 54.69 million passenger trips (annual report); a national average metro electricity use of 0.869 kWh per trip (association statistics for 2025); an electricity emission factor of 0.5568 kgCO2/kWh (Ministry of Ecology and Environment); an average on-line allowance price of 111 CNY/t in the Beijing carbon market in 2024 (Beijing Municipal Ecology and Environment Bureau); an average CCER price of 70.76 CNY/t in the national market in 2025 (Ministry of Ecology and Environment); an average green electricity price in Beijing of about 0.4 CNY/kWh over the past three years; a 2030 green-electricity target share of 40%; a photovoltaic yield of 1,051 kWh/kWp per year and a new energy net margin of about 42% (2025 actuals); a traction share of 52.22% and a technology saving rate of 10%. The traction share lies within the 50–53% range reported in measurement studies, and the assumed saving rate is well below the measured saving of permanent-magnet traction and similar technologies, which exceeds 20%; the parameters are thus conservative and the simulation results should be read as a lower bound on abatement. Shentong Metro is small — its 2025 revenue is about 0.8% of Daqin Railway's and 1.4% of Beijing-Shanghai HSR's — and is not claimed to be a statistically representative operator. It serves as the carrier because the parameters that drive the pathway mechanics are national rather than firm-specific: electricity use per trip is the national metro average, the emission factor is the national value and green-electricity accounting follows national rules. Two firm-specific features cut in known directions: its photovoltaic endowment is the largest in China's rail transit sector, so PV-specific gains are best read as an upper bound for an average city, whereas its per-trip revenue of about 10.9 CNY includes non-fare business and exceeds the sector's fare-only level, which makes the profit impacts conservative. Scale itself is not a parameter: the industry extrapolation in Section 5.3 multiplies national aggregates, not Shentong Metro's own size.
Four scenarios are specified. S1 (business as usual) assumes no additional low-carbon action: ridership grows 5% a year, and unit electricity use and the emission factor stay constant. S2 (green electricity and technology) raises the green-electricity share year by year to 40% by 2030, with purchased green electricity counted as zero-emission under the accounting rules, adds 5 MWp of photovoltaic capacity a year, and extends traction retrofits to 50% of the network by 2030. S3 (carbon trading inclusion) puts the firm under quota management: the free allocation ratio starts at 95% and tightens by one percentage point a year, and the internalisation of carbon costs induces an additional 2% energy saving a year. S4 (synergy) combines S2 and S3. Accounting rules follow current practice: purchased green electricity is counted as zero-emission (Beijing rule since 2023); photovoltaic output is sold to the operator under the business model and enters as new energy revenue; and CCER offsets may not exceed 5% of the allowances to be surrendered (national market rule).
5.2. Simulation Results
Table 5 and Figure 4 report the results. On abatement, S2 and S4 clearly outperform S3. By 2030 carbon intensity falls to 2.83 tCO2 per 10,000 passenger trips, 41.6% below the baseline, with cumulative abatement of about 39.8 thousand tonnes of CO2 over 2026–2030; S3 abates about 9.5 thousand tonnes cumulatively and lowers intensity by 10.0%. On the economic side, S2 adds about 4.11 million CNY to annual net profit by 2030 and 9.15 million CNY cumulatively over five years, as new energy revenue and electricity savings more than cover the technology outlay; S3 adds 6.10 million CNY cumulatively under the assumption that energy savings exceed carbon costs; S4 adds 8.41 million CNY, slightly less than S2 because the firm bears carbon costs, but it is more resilient if quotas tighten further or carbon prices rise (Figure 5). Sensitivity checks support these rankings. Varying annual ridership growth between 3% and 7% (baseline 5%) leaves the 2030 intensity cut of S2 unchanged at 41.6% — the intensity ratio is scale-invariant — and moves cumulative abatement only between 37.0 and 42.7 thousand tonnes for S2 (8.9–10.2 thousand tonnes for S3) and the five-year profit gain between 8.95 and 9.36 million CNY, so the ordering S2 ≈ S4 ≫ S3 is robust to the volume assumption. H2 is supported: inclusion in carbon trading produces additional abatement and net gains through cost internalisation. H3 is supported as well: the green-electricity and technology pathway abates most, and the synergy pathway performs best overall once policy adaptability is taken into account. The finding is consistent with earlier work on carbon trading in railway freight: with well-designed allowances and prices, transport firms can earn surplus revenue from quotas.
5.3. Industry-Level Extrapolation
Extending the S2 pathway to the industry: if the green-electricity share of national urban rail rose to 40%, the total electricity use of 29.008 billion kWh in 2025 and the 0.5568 kgCO2/kWh factor imply annual abatement of about 6.46 million tonnes of CO2, worth about 720 million CNY a year at the Beijing carbon price of 111 CNY/t. Adding traction retrofits (a 10% saving over 50% of the network) would abate a further 0.42 million tonnes. Indirect electricity emissions account for close to four fifths of railway operating emissions, so green-electricity substitution is the most effective lever for the railway sector as well. Following the idea of coordinated pollution and carbon control, the key at the industry level is to build a mechanism that links green electricity, the carbon market and green certificates, so that abatement becomes measurable revenue for firms. The extrapolation is deliberately simple: it applies a uniform 40% share and the national average factor to all cities, although green-electricity endowments differ widely — eastern cities rely on inter-provincial green-electricity trading at a premium, whereas north-western cities can draw on local wind and solar at lower cost. The direction of the resulting bias is ambiguous, so the 6.46 Mt figure should be read as an order-of-magnitude estimate under uniform policy reach; region-differentiated simulation is left to future work.
6. Conclusions and Policy Implications
6.1. Main Findings
Three findings stand out. First, the abatement delivered by existing green practices is small relative to the operating scale of listed rail companies, and the DID estimates detect no statistically significant net effect on carbon intensity (β = 0.225, p = 0.421) or on financial performance. The result complements the significant city-level evidence on rail networks: substitution by the macro network abates visibly, while the abatement potential inside the operators' own operations is far from realised. Second, the simulations show that the green-electricity and technology pathway is the main abatement lever: by 2030 it cuts the carbon intensity of a representative metro operator by 41.6% relative to the baseline, abates about 39.8 thousand tonnes of CO2 over five years and adds about 9.15 million CNY to cumulative net profit through new energy revenue and electricity savings, so abatement and profit improvement can go together. Third, under carbon trading inclusion the firm abates about 9.5 thousand tonnes cumulatively as carbon costs induce energy saving, and the synergy pathway preserves the same abatement while strengthening cost resilience under tightening policy. Extrapolation suggests that a 40% green-electricity share in national urban rail would abate about 6.46 million tonnes of CO2 a year, roughly a tenth of the 2021 emissions of China's railway operation sector, so the industry-level value of green-electricity substitution is substantial. This direction is consistent with bureau-level evidence that indirect emissions from electric traction and net purchased electricity dominate, which makes the cleaning of electricity the focus of operating abatement. Taken together, the findings show how firm-level measurement can support the monitoring of sustainability performance in rail transit, and how green-electricity substitution and carbon trading can be combined into a coherent sustainable-transition pathway for the industry.
6.2. Policy Implications
At the firm level, green electricity and distributed photovoltaics should be scaled up first. The Shentong model of photovoltaics plus metro can be replicated by making full use of depot rooftops, elevated stations and land along lines; the share of green electricity purchased should enter corporate energy strategy and performance appraisal, with long-term power purchase agreements locking in prices; and retrofits such as permanent-magnet traction and regenerative braking recovery should proceed in step, with measured savings above 20% on existing networks.
At the industry level, the green electricity, green certificate and carbon market mechanisms need to be coordinated. Metro operators could take part in green electricity trading and CCER development collectively, and the abatement from photovoltaics could be developed into tradable carbon assets. Industry associations could take the lead in drawing up accounting rules for operating emissions and green electricity consumption in urban rail, unifying calibres and lowering transaction costs. The concrete mix should differ by region. In eastern cities with mature trading markets, the priority is aggregated green-electricity purchasing and long-term power purchase agreements, because local renewable resources are limited and green power carries a premium. In central and western cities with wind and solar endowments, self-built distributed photovoltaics with storage is usually the cheaper route and can proceed before trading markets deepen. In smaller cities under fiscal pressure, efficiency retrofits with short payback periods should come first, with market-based instruments phased in as local carbon and electricity markets mature.
At the policy level, rail operating firms should be brought into the carbon market steadily, with transition arrangements. Beijing already manages five rail firms under its quota system; other cities that follow are advised to set reasonable free allocation ratios and gradual tightening schedules, so as to avoid cost shocks to firms with a public service mandate. Allowance auctioning and other cost-saving devices deserve consideration; general-equilibrium estimates suggest that auctioning can cut economy-wide costs by about 30%. The supply of green electricity trading should expand, grid connection and subsidies for distributed photovoltaics along rail lines should be eased, and abatement performance should enter green transport appraisal.
6.3. Limitations and Future Research
Several limitations remain. First, emissions are estimated from operating volumes; accuracy would improve if firms disclosed measured emissions, and passenger- and freight-specific energy intensities would remove the level errors of the national-factor method. Second, the DID evidence is weak by construction: the intensity model is identified by a single treated firm whose treatment date is self-selected, and the control firms differ in scale and business mix, so the estimates are reported as an exploratory descriptive comparison. More exogenous variation will become available as municipal carbon markets bring rail operators under quota management — Beijing has already included five — and event-study designs around those inclusion dates are a promising extension. Third, the simulation is carried by one small operator and extrapolated under uniform regional assumptions; differentiating green-electricity endowments and carbon-market coverage by region would sharpen the industry estimates. Future work could also compare listed with unlisted operators, refine the accounting of green certificate revenue and examine carbon accounting treatment.
Author Contributions
Li Yunyan: Conceptualization, Methodology, Supervision, Funding acquisition, Writing – review and editing. Wu Huiting: Conceptualization, Data curation, Formal analysis, Methodology, Software, Visualization, Writing – original draft. Chen Xi: Investigation, Resources, Validation, Writing – review and editing. Leng Qiuping: Data curation, Investigation, Validation.
Funding
Key Project of the Beijing Social Science Fund, “Research on the Mechanism, Effects and Pathways of Coordinated Promotion of Carbon Reduction, Pollution Reduction, and Green Growth in the Capital from the Perspective of New Quality Productive Forces” (24GLA007).
Data Availability Statement
The data that support the findings of this study were derived from public sources (annual and sustainability reports of listed companies, statistical reports of the China Association of Metros and statistical bulletins of the National Railway Administration), which are publicly available. The data presented in this study are available on request from the corresponding author due to (specify the reason for the restriction).; Declaration of generative AI and AI-assisted technologies in the manuscript preparation process; During the preparation of this work the author(s) used basic grammar and spelling checking tools only. No generative AI or AI-assisted technologies were used for content creation or scientific writing. After using these basic tools, the author(s) reviewed and edited the content as needed and take(s) full responsibility for the content of the published article.
Conflicts of Interest
The authors declare that they have no known competing financial interests or personal relationships that could have appeared to influence the work reported in this paper.
References
- Gendron-Carrier, N.; Gonzalez-Navarro, M.; Polloni, S.; et al. Subways and urban air pollution. Am. Econ. J. Appl. Econ. 2022, 14, 164–196. [Google Scholar] [CrossRef]
- Xu, C.; Xu, Z. Mechanisms and effects of high-speed rail opening on urban carbon emissions under the dual-carbon goals. J. Chang. Univ. Sci. Technol. (Social Science Edition) (in Chinese). 2023, 38, 117–130. [Google Scholar]
- Huang, H.; Xie, Y. Carbon abatement effects of high-speed rail opening: with a discussion of the dual constraints of economic and environmental objectives. J. Environ. Econ. (in Chinese). 2022, 1–22. [Google Scholar]
- Gao, Z.; Wang, Y. Carbon reduction effects of metro network development. J. Financ. Econ. (in Chinese). 2026, 52, 64–78. [Google Scholar]
- Xu, S.; Chen, Y.; Liu, M. Can urban rail transit in China reduce carbon dioxide emissions? An investigation of the resource allocation perspective. Sustainability 2025, 17, 3901. [Google Scholar] [CrossRef]
- Qiu, Z.; Liu, D.; Liao, Q. Can the opening of China railway express reduce urban carbon emissions? A difference-in-differences analysis in China. Front. Environ. Sci. 2023, 10, 1073208. [Google Scholar] [CrossRef]
- Barwick, P.J.; Donaldson, D.; Li, S.; et al. Transportation networks, short-term mobility, and pollution exposure: evidence from high-speed rail in China; NBER Working Paper No. 30462; Cambridge, MA, 2022. [Google Scholar] [CrossRef]
- Fang, H.; Li, M.; Wang, L.; et al. High-speed rail and China's electric vehicle adoption miracle; NBER Working Paper No. 33489; Cambridge, MA, 2025. [Google Scholar] [CrossRef]
- Yuan, Z.; Yuan, X.; Yang, Y.; et al. A review of research on the low-carbon effects of urban rail transit. Railw. Transp. Econ. (in Chinese). 2024, 46, 8–23, 57. [Google Scholar]
- Pu, J.; Cai, C.; Guo, R.; et al. Carbon emissions of urban rail transit in Chinese cities: a comprehensive analysis. Sci. Total Environ. 2024, 921, 171092. [Google Scholar] [CrossRef]
- Li, M.; Zhu, Z.; Liu, Q.; et al. Spatiotemporal heterogeneity of carbon emissions and their drivers in China's railway operation sector. Environ. Eng. (in Chinese). 2026, 44, 225–235. [Google Scholar]
- Chen, K.; Zhou, D.; Su, Y.; et al. Life-cycle carbon emission intensity and abatement potential of urban rail transit. Railw. Stand. Des. (in Chinese). 2022, 66, 1–7. [Google Scholar]
- Yang, Y.; Wang, X.; Yuan, Z.; et al. Measuring the carbon reduction effect of urban rail transit based on the carbon payback period. J. Transp. Syst. Eng. Inf. Technol. (in Chinese). 2023, 23, 1–11. [Google Scholar]
- Li, X.; Wang, L.; Luan, C.; et al. Life-cycle carbon emissions of an operational metro line. Urban Rapid Rail Transit (in Chinese). 2024, 37, 82–87. [Google Scholar]
- Li, Y.; Yang, Y.; Wen, Y.; et al. Carbon emission prediction and abatement measures for the operation of urban rail transit. Rail Transit Equip. Technol. (in Chinese). 2025, 7–12. [Google Scholar]
- Liang, Y. Carbon emission characteristics and energy-saving strategies of regional high-speed railway operation. Railw. Energy Sav. Environ. Prot. Occup. Saf. Health (in Chinese). 2025, 15, 7–14. [Google Scholar]
- Ding, Z.; Zhang, H.; Cao, B.; et al. Carbon emission characteristics of railway transport enterprises. China Railw. (in Chinese). 2024, 108–114. [Google Scholar]
- Zhao, R.; Zhao, Y.; Xiong, X.; et al. Carbon emission efficiency of railway transport enterprises based on the SBM-Malmquist-Tobit model. Railw. Transp. Econ. (in Chinese). 2025, 47, 11–23. [Google Scholar]
- Yue, Y.; Yang, X.; Zhou, H.; et al. Contribution of rail transit to urban carbon abatement: the case of Shanghai. Chin. J. Environ. Eng. (in Chinese). 2025, 19, 548–558. [Google Scholar]
- Li, L.; et al. Carbon abatement benefits of the rapid development of urban rail transit during the Shanghai World Expo. China Environ. Sci. (in Chinese). 2012, 1141–1147. [Google Scholar]
- Chen, B.; Lin, Y. Construction of a prediction model for energy consumption in urban rail transit operations using a bottom-up approach. Energies 2025, 18, 888. [Google Scholar] [CrossRef]
- Wang, S.; Kuai, L. Driving factors and peaking pathways of carbon emissions in China's transport sector. Resour. Sci. (in Chinese). 2022, 44, 2415–2427. [Google Scholar] [CrossRef]
- Goulder, L.H.; Long, X.; Lu, J.; et al. China's unconventional nationwide CO2 emissions trading system: cost-effectiveness and distributional impacts. J. Environ. Econ. Manag. 2022, 111, 102561. [Google Scholar] [CrossRef]
- Goulder, L.H.; Long, X.; Qu, C.; et al. China's nationwide CO2 emissions trading system: a general equilibrium assessment. Am. Econ. J. Econ. Policy in press. [Google Scholar] [CrossRef]
- Long, X.; Astier, N.; Zhang, D. Is broader trading welfare improving for emission trading systems? J. Environ. Econ. Manag. 2025, 130, 103110. [Google Scholar] [CrossRef]
- Wei, X.; Wang, H. Research on China's railway freight pricing under a carbon emissions trading mechanism. Sustainability 2025, 17, 5265. [Google Scholar] [CrossRef]
- Barwick, P.J.; Li, S.; Waxman, A.; et al. Efficiency and equity impacts of urban transportation policies with equilibrium sorting. Am. Econ. Rev. 2024a, 114, 3161–3205. [Google Scholar] [CrossRef]
- Brancaccio, G.; Kalouptsidi, M.; Papageorgiou, T.; et al. Search frictions and efficiency in decentralized transport markets. Q. J. Econ. 2023, 138, 2451–2503. [Google Scholar] [CrossRef]
- Hu, J.; Yu, X.; Han, Y. Can ESG ratings promote corporate green transition? Evidence from a staggered difference-in-differences approach. J. Quant. Technol. Econ. (in Chinese). 2023, 40, 90–111. [Google Scholar]
- Barwick, P.J.; Li, S.; Lin, L.; et al. From fog to smog: the value of pollution information. Am. Econ. Rev. 2024b, 114, 1338–1381. [Google Scholar] [CrossRef]
- Bushnell, J.; Muehlegger, E.; Rapson, D. Energy prices and electric vehicle adoption; NBER Working Paper No. 29842; Cambridge, MA, 2022. [Google Scholar] [CrossRef]
- Xu, Z. Carbon emission efficiency of the European railway industry and its determinants. Railw. Econ. Res. (in Chinese). 2025, 38–49, 80. [Google Scholar]
- Hong, J.; Li, Y.; Cai, W. Multi-scenario simulation of China's carbon peaking pathways based on the RICE-LEAP model. Resour. Sci. (in Chinese). 2021, 43, 639–651. [Google Scholar]
- Huang, Y.; Guo, H.; Liao, C.; et al. Low-carbon development pathways for urban transport based on the LEAP model: a case study of Guangzhou. Adv. Clim. Change Res. (in Chinese). 2019, 15, 670–683. [Google Scholar]
- Zhu, C.; Yang, S.; Liu, P.; et al. Predicting the carbon peaking time of China's transport sector. J. Transp. Syst. Eng. Inf. Technol. (in Chinese). 2022, 22, 291–299. [Google Scholar]
- Zhu, L.; Liu, Z.; Wang, R.; et al. Measuring the carbon abatement effects of freight structure optimisation in China. J. Transp. Syst. Eng. Inf. Technol. (in Chinese). 2022, 22, 309–315. [Google Scholar]
- Su, T.; Zheng, L.; Li, Z. Pathways to carbon peaking for urban rail transit under the new situation. China Eng. Consult. (in Chinese). 2023, 68–71. [Google Scholar]
- Deng, H.; Liang, Q.; Liu, L. Coordinated control of pollution and carbon reduction in transport: review and outlook. Chin. J. Environ. Manag. (in Chinese). 2023, 15, 24–29, 23. [Google Scholar]
- Tian, J.; Tong, Q.; Liang, D. Carbon abatement costs and abatement potential of China's transport sector. J. Beijing Jiaotong Univ. (Social Sciences Edition) (in Chinese). 2025, 24, 86–98. [Google Scholar]
- Deng, W.; Dai, C.; Chen, W. Application of photovoltaics in AC/DC traction power supply systems in the context of the rail transit energy internet. Proc. Chin. Soc. Electr. Eng. (in Chinese). 2019, 39, 5692–5702. [Google Scholar]
- Zheng, X.; Zhuang, Y.; Xu, W. Demonstration application and prospects of distributed photovoltaics in Shanghai rail transit. Green Build. (in Chinese). 2018, 10, 17–20. [Google Scholar]
- Guan, B.; Yang, H.; Zhang, T.; et al. Technoeconomic analysis of a rooftop PV system in an elevated metro station for cost-effective operation and clean electrification. Renew. Energy 2024, 226, 120305. [Google Scholar] [CrossRef]
- Tian, C.; Zhang, X. Research and application of comprehensive energy saving in urban rail transit under the dual-carbon goals. Energy Conserv. (in Chinese). 2026, 45, 153–156. [Google Scholar]
- Li, Z.; Xia, X.; Zheng, X.; et al. Energy-saving and carbon-reduction strategies for Beijing rail transit driven by multi-technology coordination. Energy Sav. Environ. Prot. (in Chinese). 2025, 3–9. [Google Scholar]
- Cui, T.; Li, L.; Li, M. Application of new energy technologies in urban rail transit. Urban Rapid Rail Transit (in Chinese). 2022, 35, 19–24. [Google Scholar]
Figure 1.
Operating scale and electricity consumption of China's urban rail transit, 2017–2025. Source: annual statistical and analytical reports on urban rail transit, China Association of Metros.
Figure 1.
Operating scale and electricity consumption of China's urban rail transit, 2017–2025. Source: annual statistical and analytical reports on urban rail transit, China Association of Metros.
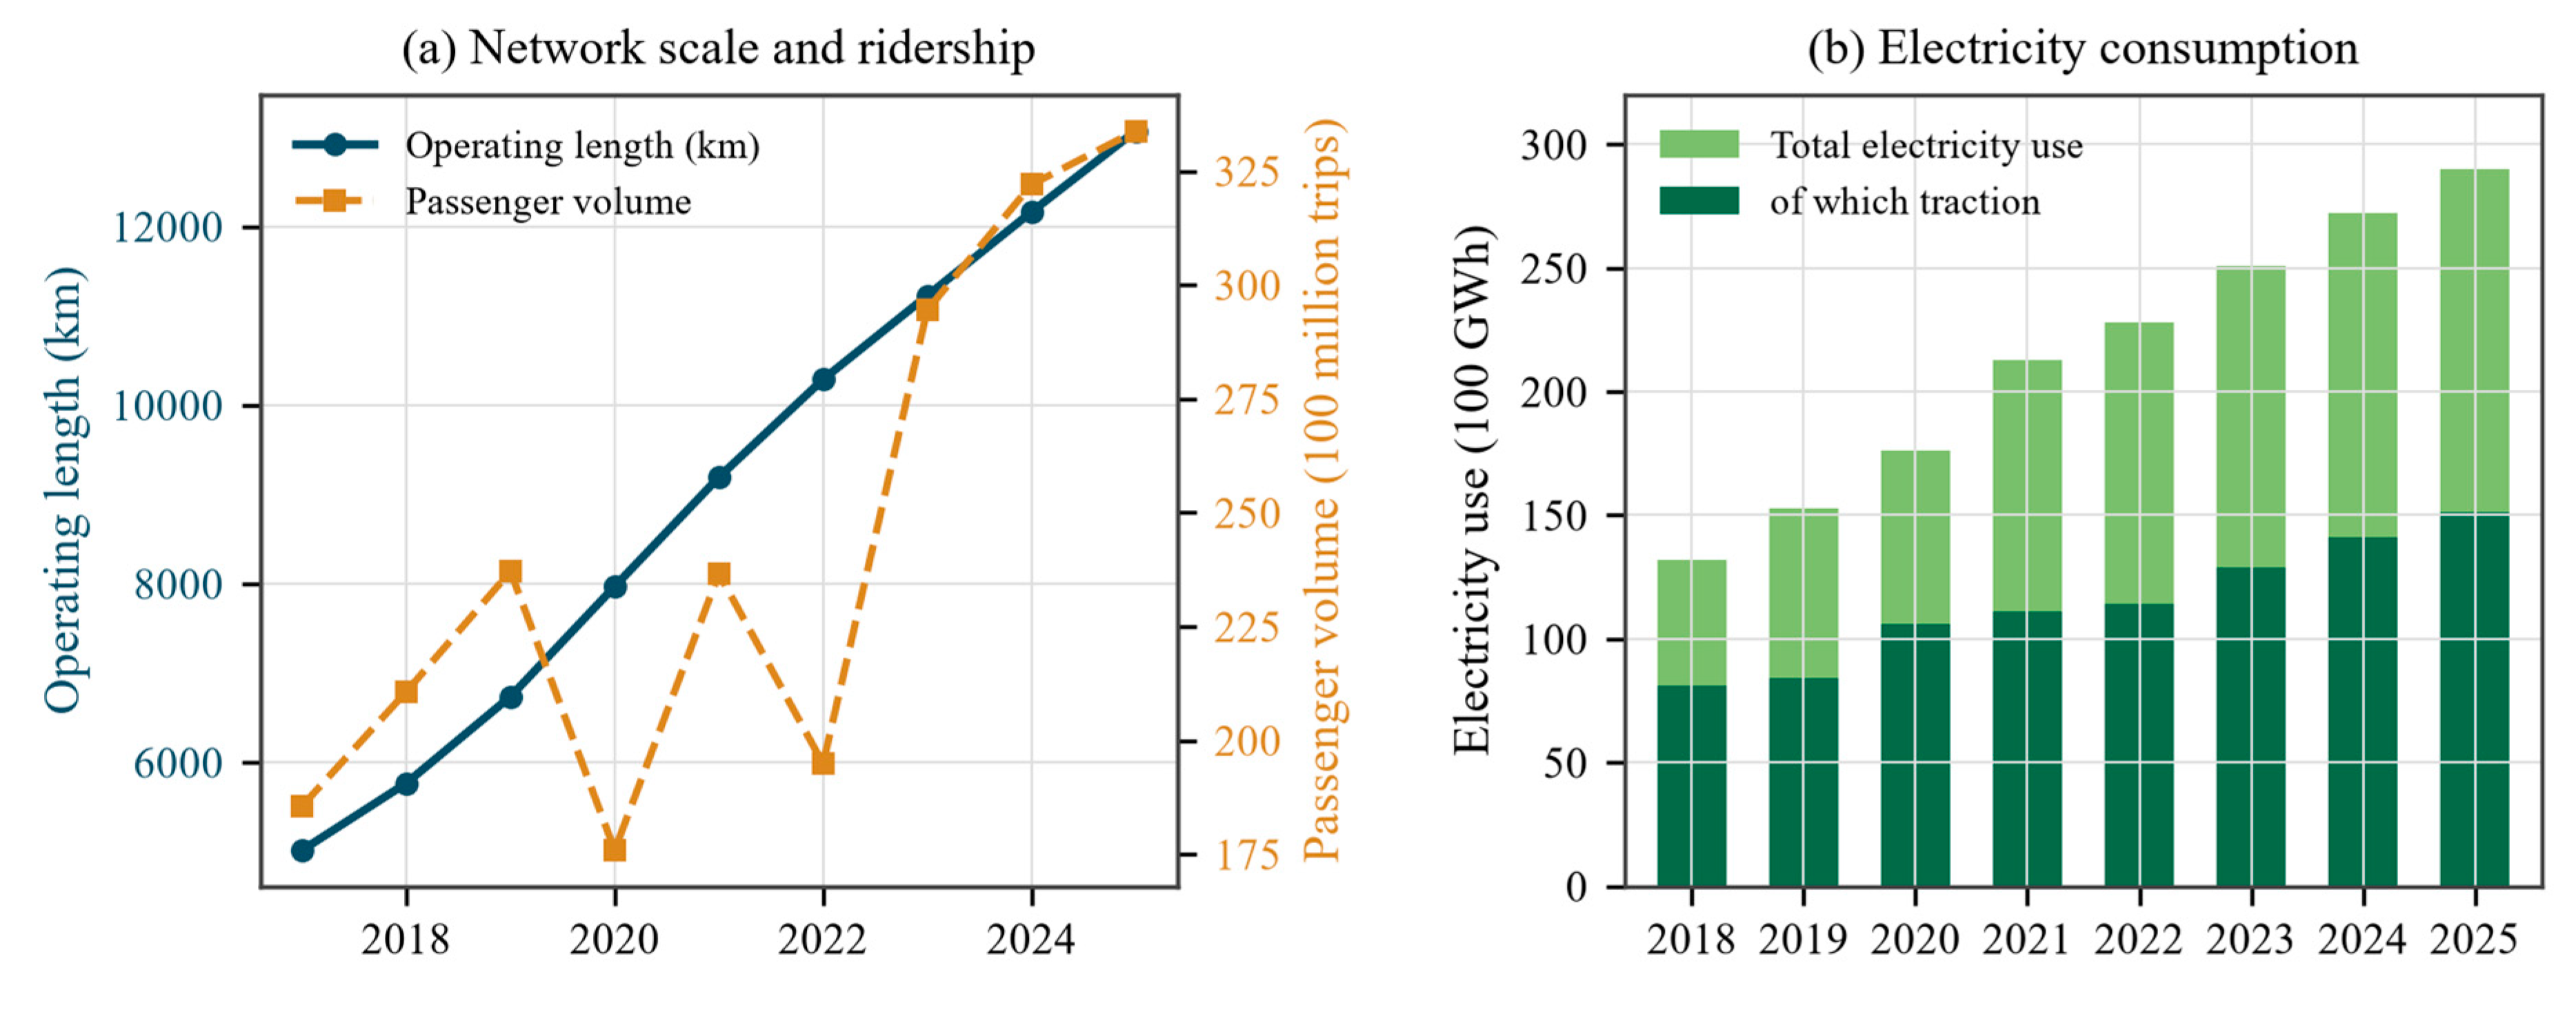
Figure 2.
Estimated carbon intensity of the sample listed rail transit companies. Carbon intensity is estimated as described in Section 3.2. Source: authors' estimates.
Figure 2.
Estimated carbon intensity of the sample listed rail transit companies. Carbon intensity is estimated as described in Section 3.2. Source: authors' estimates.
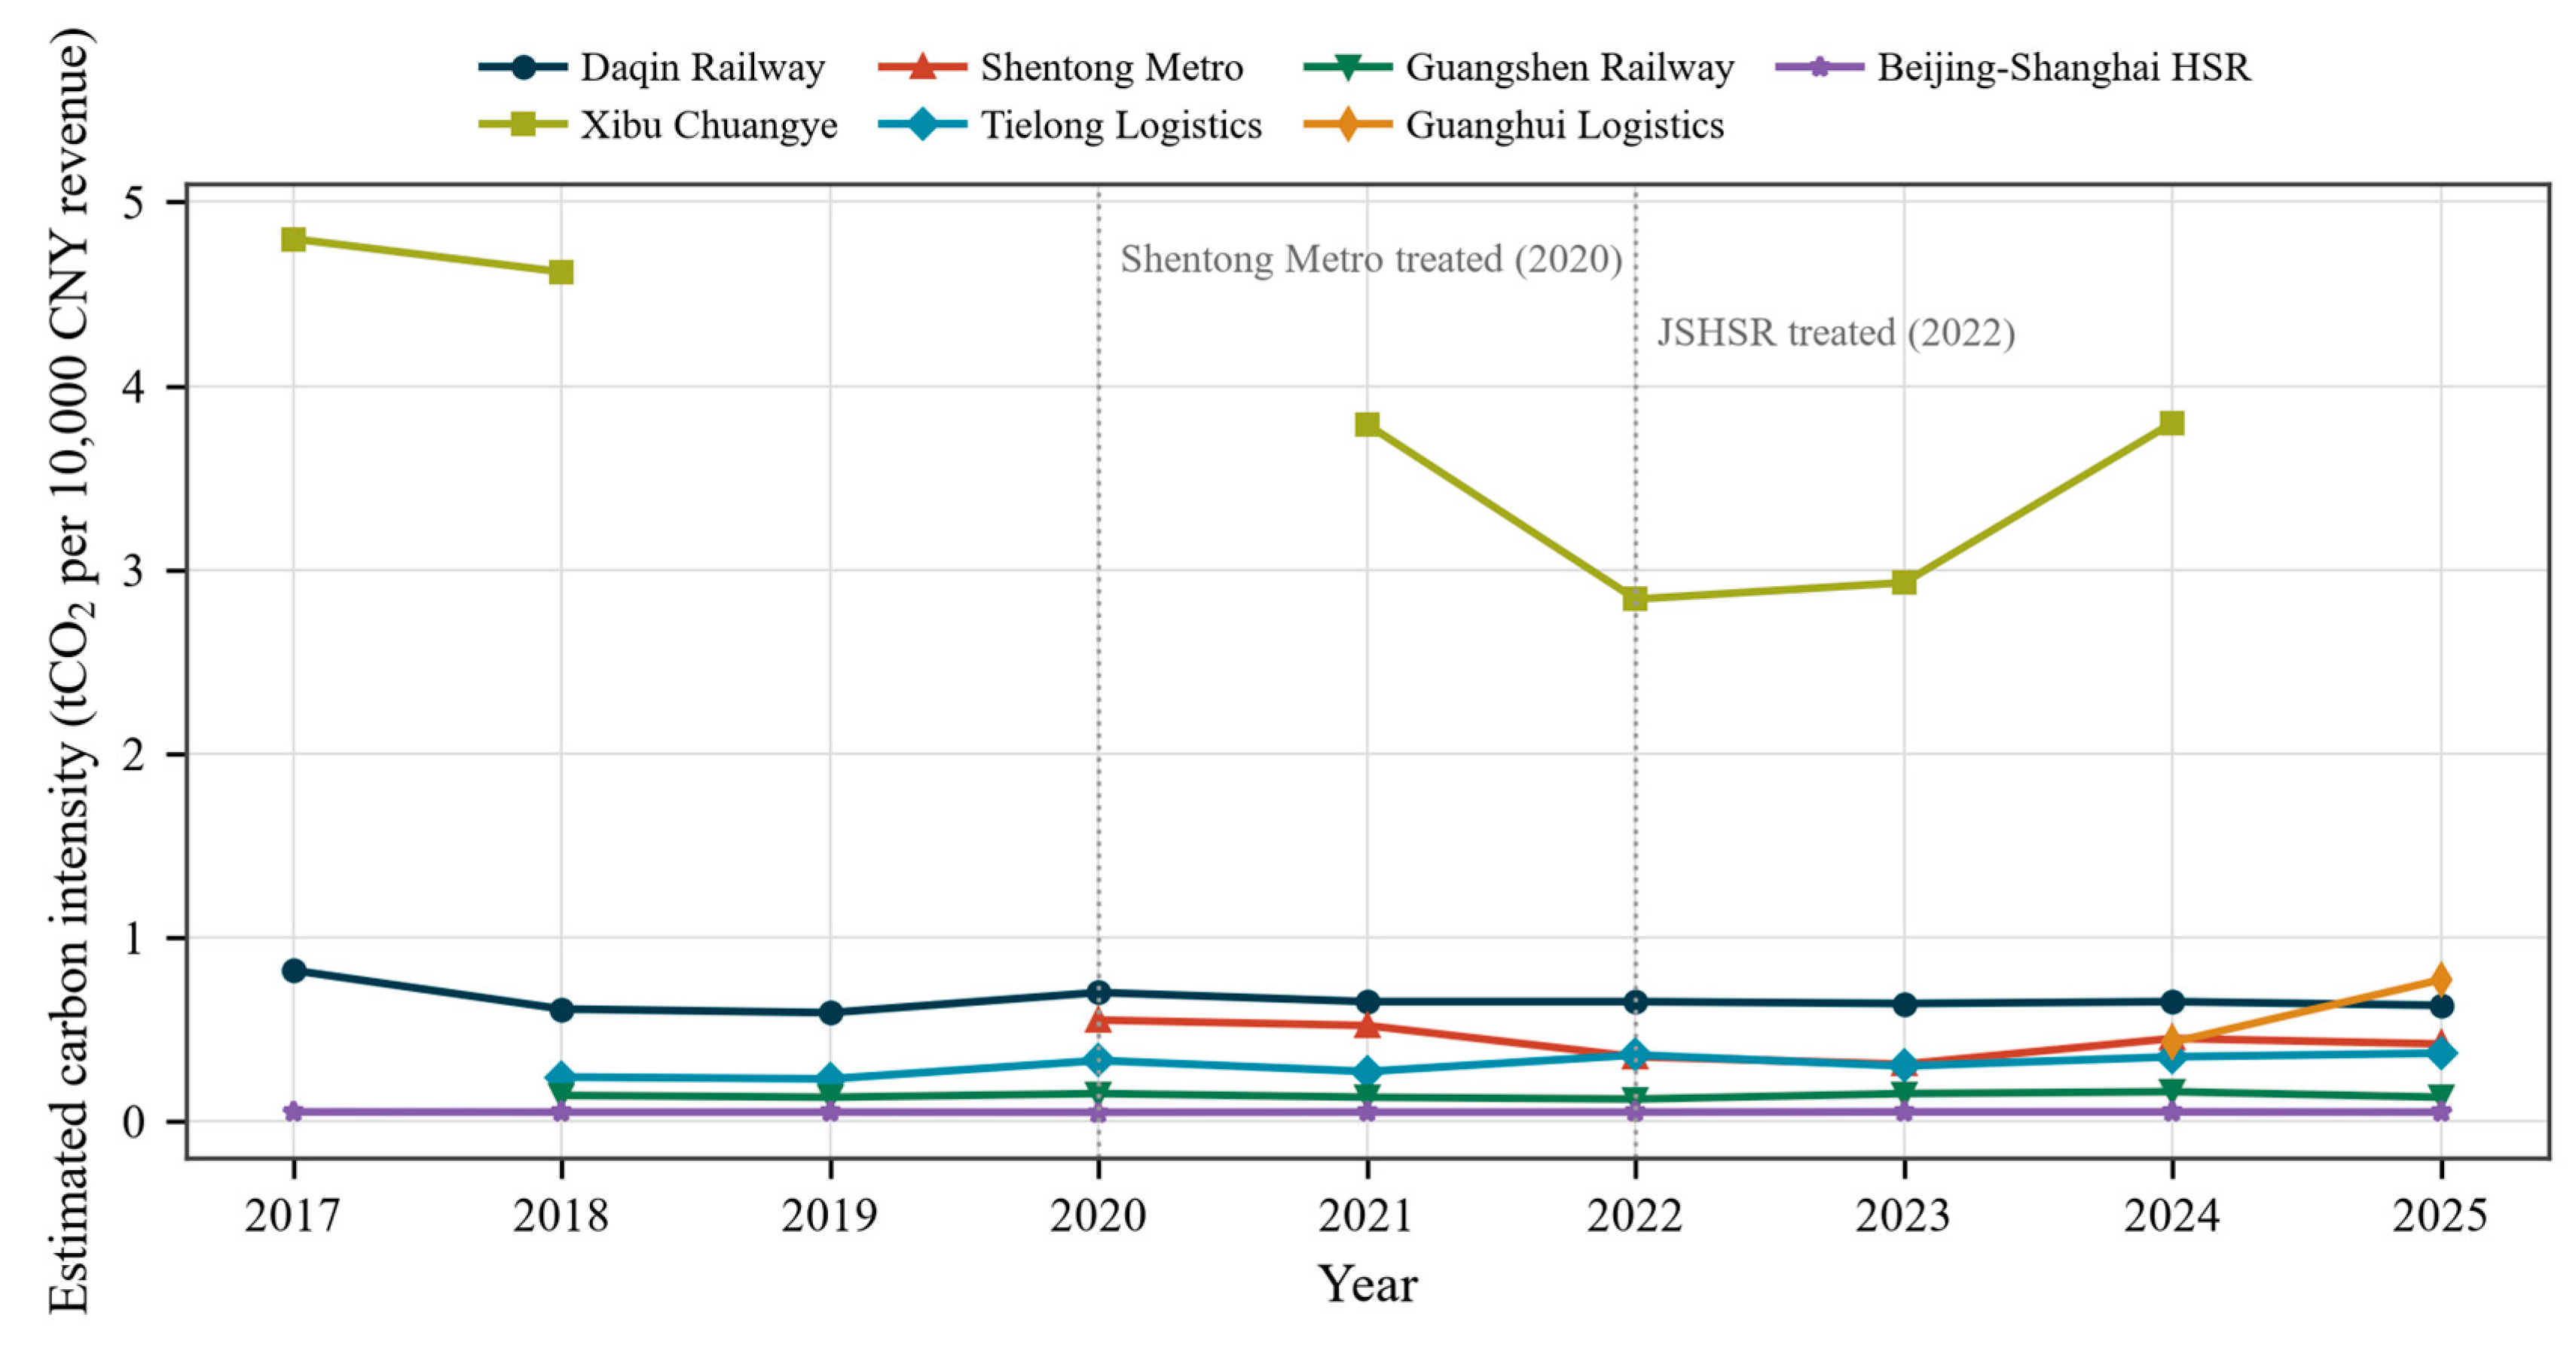
Figure 3.
Event study: change in carbon intensity around the green-electricity practice of Beijing-Shanghai HSR (base year = 2021). Source: authors' estimates.
Figure 3.
Event study: change in carbon intensity around the green-electricity practice of Beijing-Shanghai HSR (base year = 2021). Source: authors' estimates.
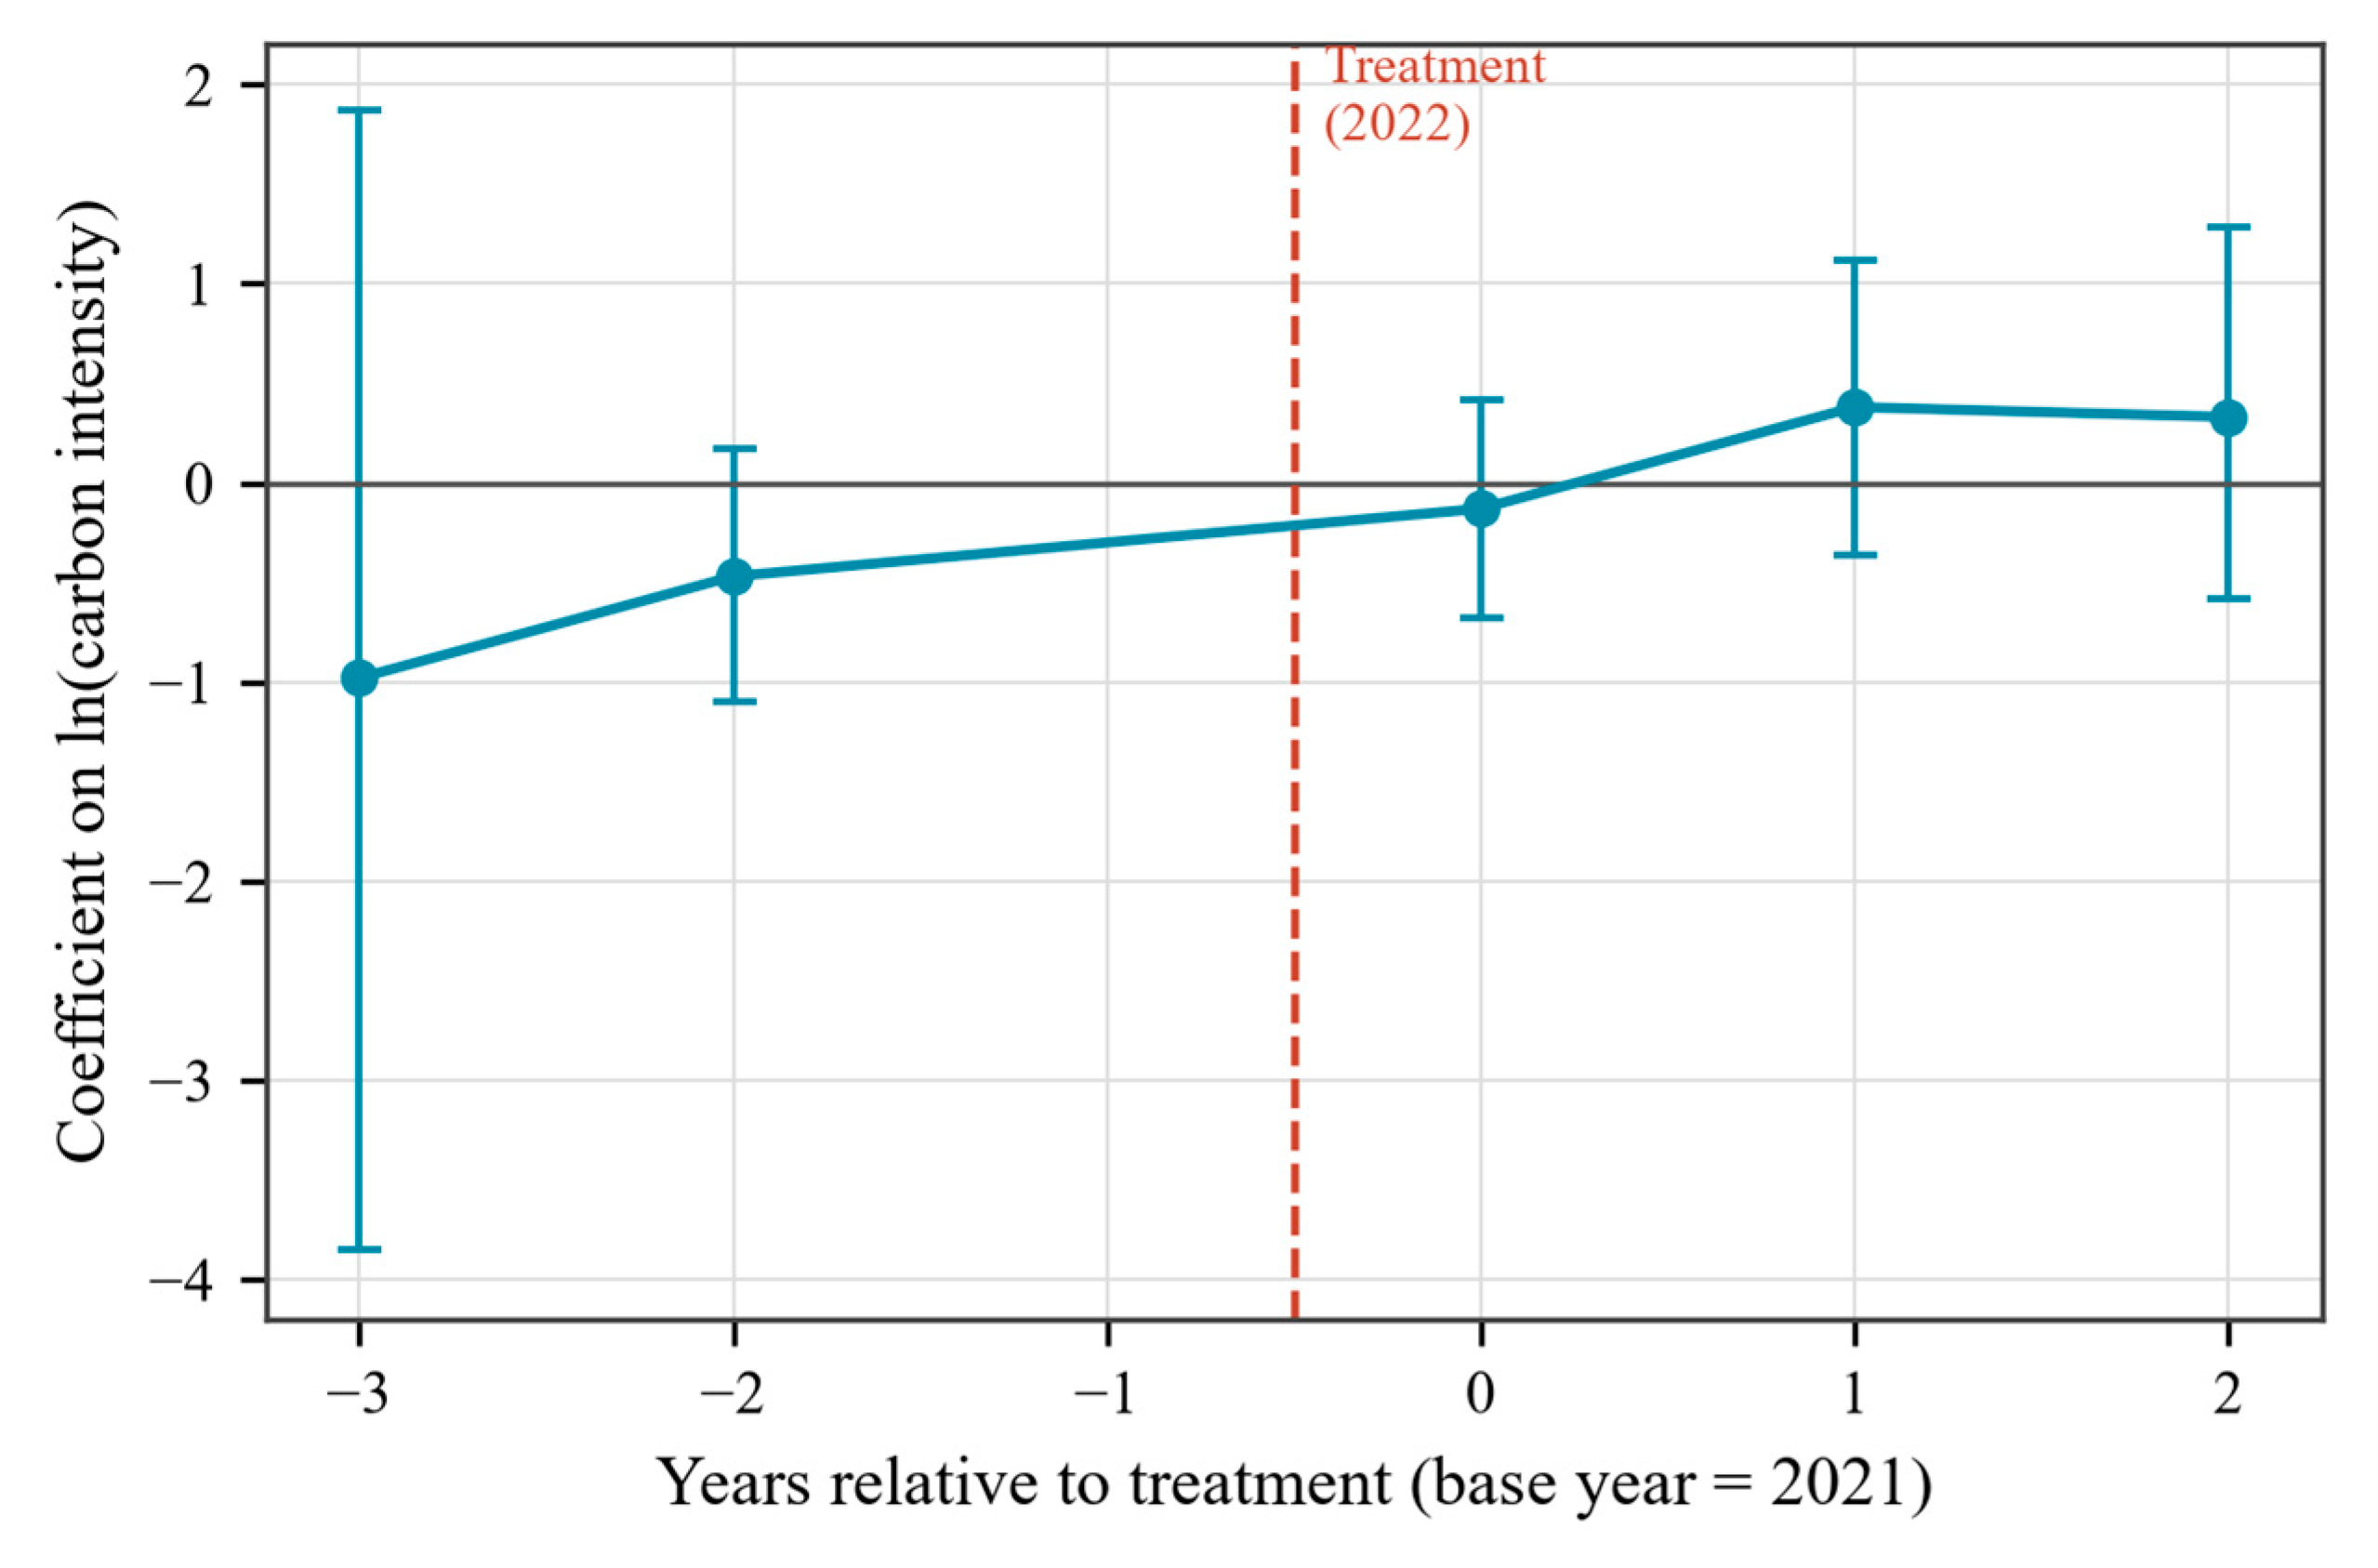
Figure 4.
Emission pathways and economic effects of the four scenarios, 2026–2030. Source: authors' simulation.
Figure 4.
Emission pathways and economic effects of the four scenarios, 2026–2030. Source: authors' simulation.
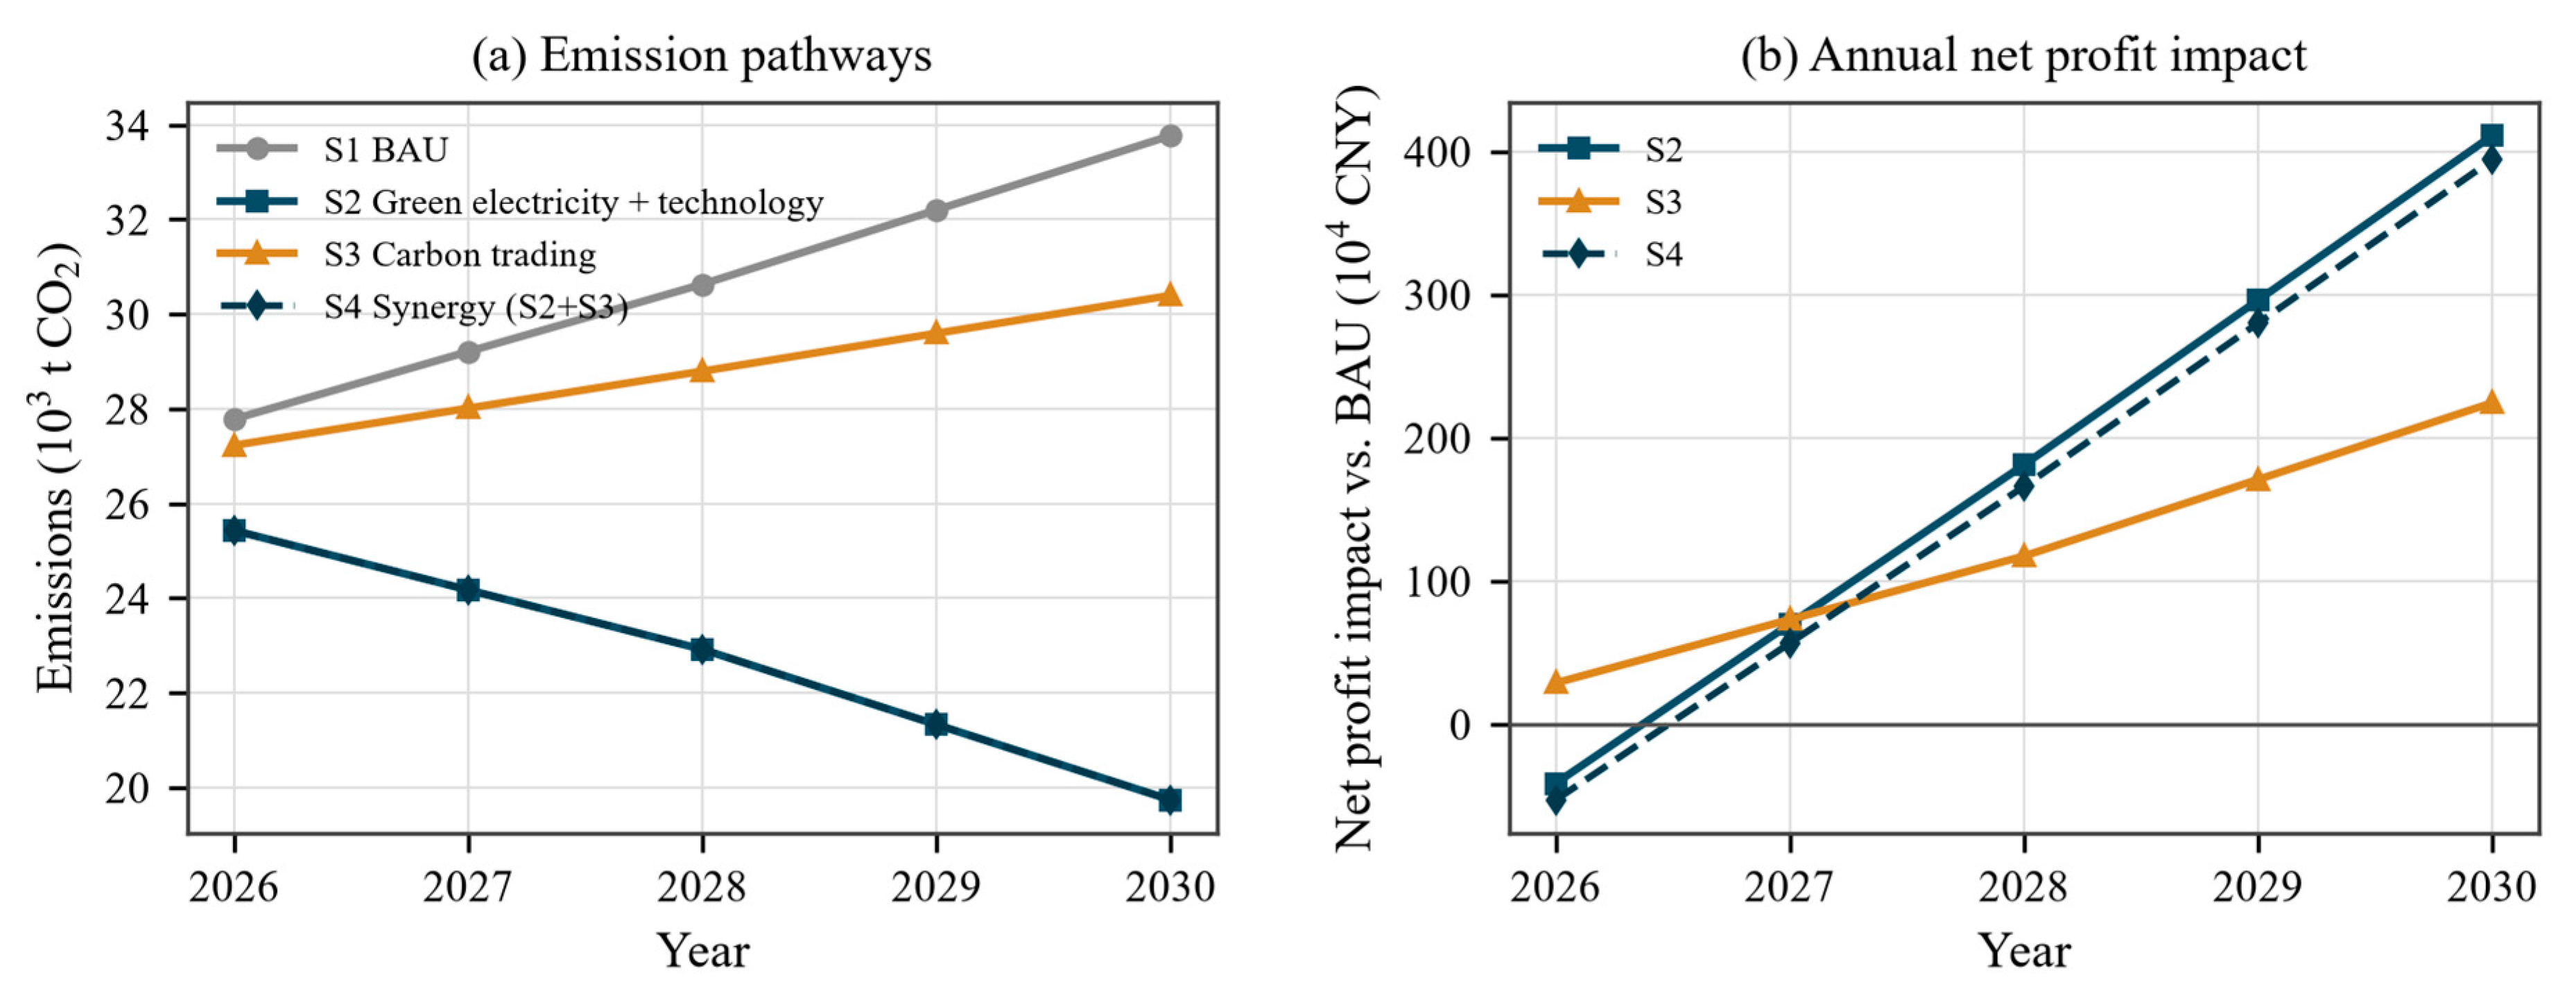
Figure 5.
Cumulative effects of the scenarios over 2026–2030. Source: authors' simulation.
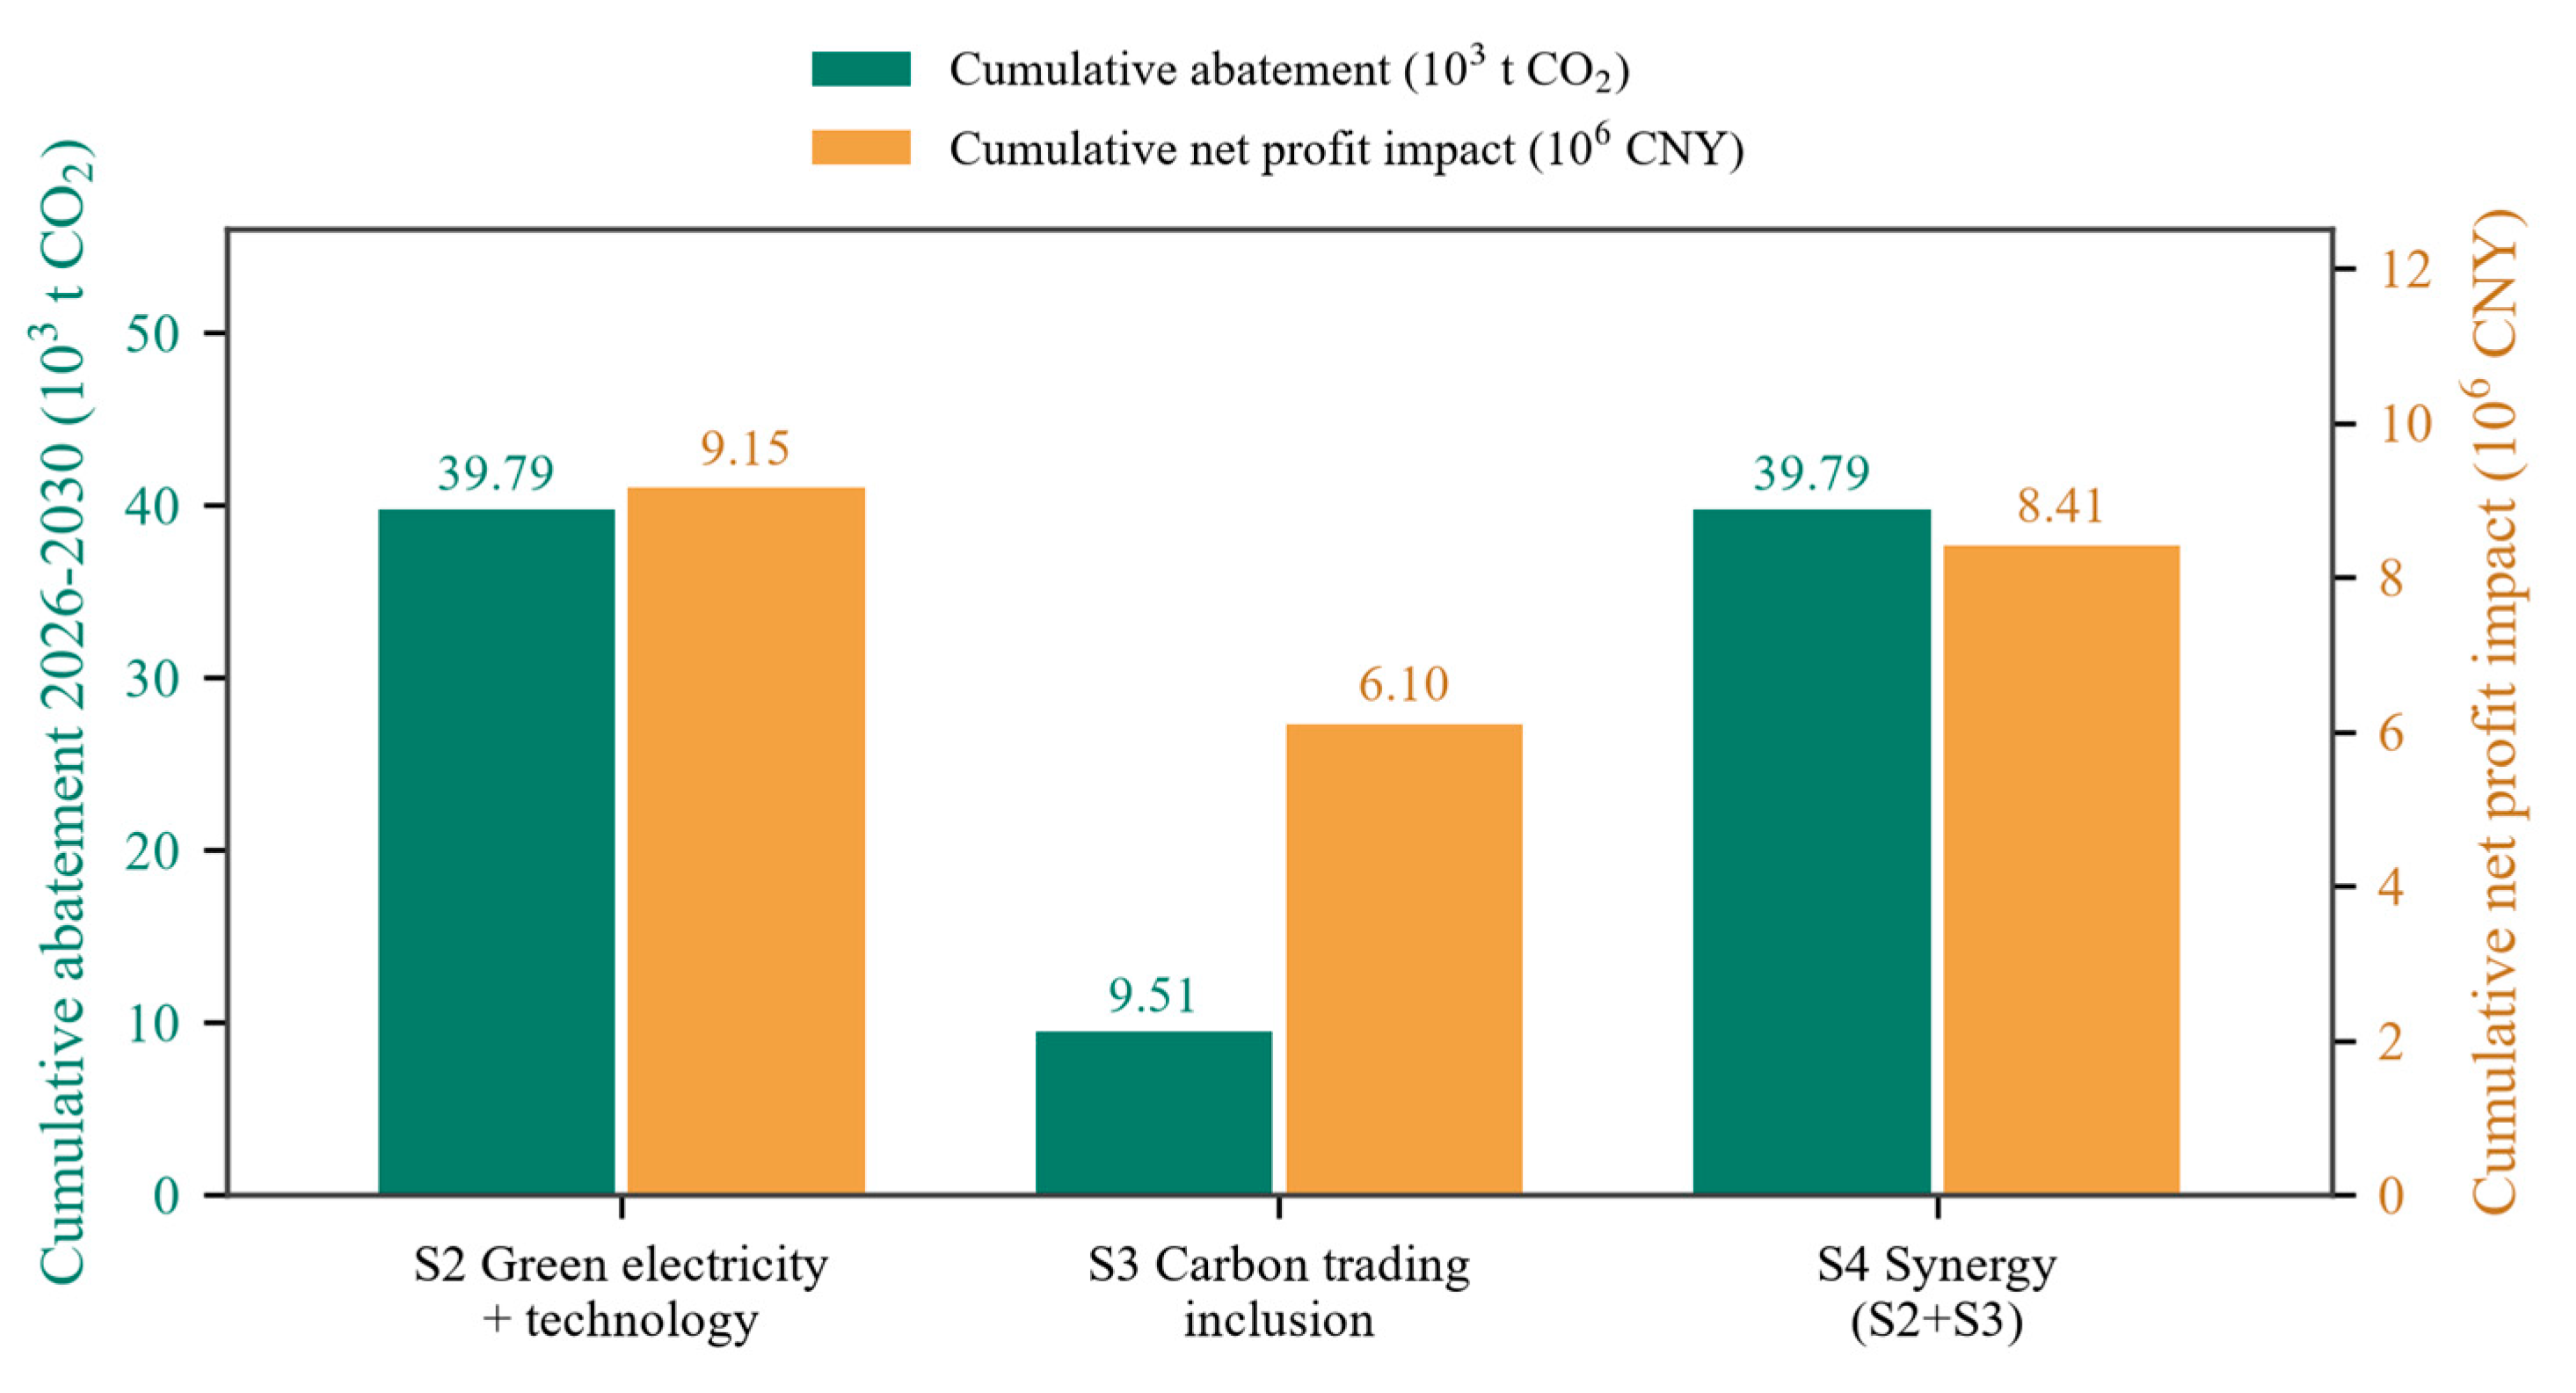

Table 1.
Basic information of the sample listed companies.
| Code | Company | Listing venue | Main business | Role in the sample |
|---|---|---|---|---|
| 600834.SH | Shentong Metro | Shanghai | Urban rail transit operation; new energy (photovoltaics) | Treated (from 2020; dropped from the intensity model for lack of pre-treatment ridership) |
| 601816.SH | Beijing-Shanghai HSR | Shanghai | High-speed railway passenger transport | Treated (from 2022) |
| 601006.SH | Daqin Railway | Shanghai | Railway freight (mainly coal) | Control |
| 601333.SH | Guangshen Railway | Shanghai | Railway passenger and freight transport | Control |
| 600125.SH | Tielong Logistics | Shanghai | Railway special container transport and logistics | Control |
| 000557.SZ | Xibu Chuangye | Shenzhen | Railway freight (within Ningxia) | Control |
| 600603.SH | Guanghui Logistics | Shanghai | Energy logistics (Hongnao railway freight in Xinjiang); now ST Guangwu | Control |
| 001213.SZ | China Railway Special Cargo | Shenzhen | Railway special cargo transport (commodity cars, cold chain, outsize logistics) | Control |
Source: company annual reports; see Section 3.3 for the treatment assignment.
Table 2.
Descriptive statistics of the sample firms (means over 2017–2025).
| Company | Period | Revenue (100 mn CNY) | Net profit (100 mn CNY) | Debt-to-asset ratio | Carbon intensity (tCO2 per 10,000 CNY) |
|---|---|---|---|---|---|
| Shentong Metro | 2017–2025 | 5.63 | 0.61 | 36.5% | 0.451 |
| Beijing-Shanghai HSR | 2017–2025 | 328.17 | 83.69 | 23.9% | 0.049 |
| Daqin Railway | 2017–2025 | 751.66 | 113.97 | 23.7% | 0.678 |
| Guangshen Railway | 2017–2025 | 219.79 | 2.85 | 24.1% | 0.145 |
| Tielong Logistics | 2017–2025 | 140.75 | 4.16 | 33.1% | 0.308 |
| Xibu Chuangye | 2017–2025 | 11.64 | 1.90 | 9.8% | 3.805 |
| Guanghui Logistics | 2017–2025 | 31.41 | 5.30 | 59.8% | 0.308 |
| China Railway Special Cargo | 2017–2025 | 92.56 | 4.72 | 9.1% | — |
Note: carbon intensity is estimated as described in Section 3.2. Data sources: company annual reports, railway statistical bulletins, and statistics of the China Association of Metros. Estimation method: CO2 of railway firms = converted turnover × national railway energy intensity × 2.66 tCO2/tce; CO2 of the metro operator = passenger trips × national average electricity use per trip × 0.5568 kgCO2/kWh.
Table 3.
Two-way fixed-effects DID estimates.
| Variables | (1) ln carbon intensity | (2) ln carbon intensity (excl. Xibu Chuangye) | (3) ROA | (4) Gross margin |
|---|---|---|---|---|
| DID (treated × post) | 0.2250 | 0.1881 | 0.0064 | 0.0868 |
| (0.2794) | (0.3072) | (0.0090) | (0.0747) | |
| ln(total assets) | -0.1370 | -0.1817 | -0.0271 | -0.1879*** |
| (1.6125) | (1.7658) | (0.0384) | (0.0713) | |
| Debt-to-asset ratio | 0.8146 | 0.7299 | -0.0174 | -0.0064 |
| (2.6378) | (3.1495) | (0.0687) | (0.2239) | |
| ln(number of employees) | -0.8885 | -0.8874 | 0.0007 | 0.0164 |
| (0.8616) | (0.8972) | (0.0019) | (0.0139) | |
| Firm fixed effects | Yes | Yes | Yes | Yes |
| Year fixed effects | Yes | Yes | Yes | Yes |
| Observations | 42 | 36 | 72 | 72 |
| Number of firms | 6 | 5 | 8 | 8 |
Note: cluster-robust standard errors at the firm level (CR1) in parentheses; ***, **, * denote significance at the 1%, 5% and 10% levels. In columns (1)–(2) the treated firm is Beijing-Shanghai HSR (from 2022) and the controls are Guangshen Railway, Daqin Railway, Tielong Logistics, Xibu Chuangye and Guanghui Logistics; in columns (3)–(4) the treated firms are Shentong Metro (from 2020) and Beijing-Shanghai HSR (from 2022). Group means for the treated firm versus the five control firms in columns (1)–(2) are, before treatment (2017–2021): carbon intensity 0.053 vs 1.049 tCO2 per 10,000 CNY, ROA 0.034 vs 0.039 and gross margin 0.418 vs 0.238; after treatment (2022–2024): 0.045 vs 0.963, 0.027 vs 0.030 and 0.356 vs 0.169. Source: authors' estimates based on the panel described in Section 3.1; DID estimates with firm-clustered standard errors.
Table 4.
Base parameters of the scenario simulation and data sources.
| Parameter | Value | Source / note |
|---|---|---|
| 2025 revenue / net profit / ridership | 596.333 mn CNY / 54.224 mn CNY / 54.69 mn trips | Shentong Metro 2025 annual report |
| Average metro electricity use | 0.869 kWh per trip | Association statistics for 2025 (29.008 bn kWh / 33.383 bn trips) |
| Electricity emission factor | 0.5568 kgCO2/kWh | 2021 national average factor, Ministry of Ecology and Environment |
| PV capacity / generation / business net margin | 67.3 MWp / 70.725 GWh / about 42% | Shentong Metro 2025 annual report |
| Carbon price | 111 CNY/t | Beijing carbon market, 2024 average on-line price |
| CCER price / offset cap | 70.76 CNY/t / 5% of allowances | Ministry disclosures; national market rules |
| Free allocation ratio / tightening pace | 95% / 1 pp per year | Assumption (free allocation dominates in the pilots) |
| 2030 green-electricity target / price | 40% / about 0.40 CNY/kWh | Beijing SOE appraisal basis; Beijing green power prices (survey) |
| Conventional power benchmark / PV settlement price | 0.4155 CNY/kWh | Shanghai desulphurised coal benchmark price (approximation) |
| Annual PV additions / unit yield | 5 MWp / 1,051 kWh/kWp | Assumption (below the actual 9.6 MWp p.a. of 2019–2025); 2025 actual |
| Ridership growth | 5% per year | Assumption (conservative, based on network growth) |
| Traction share / technology saving rate / coverage / annual cost | 52.22% / 10% / 50% / 1.5 mn CNY | Association statistics for 2025; industry survey; assumption |
| Carbon-cost-induced saving rate | 2% per year | Assumption (cost internalisation induces saving) |
Note: parameters marked 'assumption' are research settings; all others come from the public sources cited in the last column.
Table 5.
Summary of simulation results for the four scenarios (2026, 2028 and 2030).
| Scenario | Year | Emissions (t) | Abatement vs. BAU (t) | Cumulative abatement (t) | Intensity (tCO2 per 10,000 trips) | Carbon cost (104 CNY) | Profit impact (104 CNY) | Cumulative profit (104 CNY) |
|---|---|---|---|---|---|---|---|---|
| S1 BAU | 2026 | 27,785 | — | — | 4.84 | — | — | — |
| 2028 | 30,633 | — | — | 4.84 | — | — | — | |
| 2030 | 33,773 | — | — | 4.84 | — | — | — | |
| S2 Green electricity + technology | 2026 | 25,429 | 2,356 | 2,356 | 4.43 | — | -41.3 | -41.3 |
| 2028 | 22,917 | 7,717 | 14,997 | 3.62 | — | +181.1 | +208.8 | |
| 2030 | 19,735 | 14,038 | 39,785 | 2.83 | — | +411.0 | +914.7 | |
| S3 Carbon trading inclusion | 2026 | 27,230 | 556 | 556 | 4.74 | 12.7 | +28.8 | +28.8 |
| 2028 | 28,795 | 1,838 | 3,561 | 4.55 | 19.8 | +117.4 | +217.1 | |
| 2030 | 30,396 | 3,377 | 9,511 | 4.35 | 27.6 | +224.4 | +610.0 | |
| S4 Synergy (S2 + S3) | 2026 | 25,429 | 2,356 | 2,356 | 4.43 | 11.8 | -52.9 | -52.9 |
| 2028 | 22,917 | 7,717 | 14,997 | 3.62 | 15.7 | +166.0 | +168.5 | |
| 2030 | 19,735 | 14,038 | 39,785 | 2.83 | 17.9 | +394.1 | +841.3 |
Note: benchmarked on Shentong Metro's 2025 actuals; abatement and profit impacts are differences from S1 (BAU). Source: authors' simulation based on the parameters in Table 4.
Disclaimer/Publisher’s Note: The statements, opinions and data contained in all publications are solely those of the individual author(s) and contributor(s) and not of MDPI and/or the editor(s). MDPI and/or the editor(s) disclaim responsibility for any injury to people or property resulting from any ideas, methods, instructions or products referred to in the content. |
© 2026 by the authors. Licensee MDPI, Basel, Switzerland. This article is an open access article distributed under the terms and conditions of the Creative Commons Attribution (CC BY) license (http://creativecommons.org/licenses/by/4.0/).
Copyright: This open access article is published under a Creative Commons CC BY 4.0 license, which permit the free download, distribution, and reuse, provided that the author and preprint are cited in any reuse.