

Submitted:
30 October 2026
Posted:
02 November 2026
You are already at the latest version
Abstract
Earnings management (EM) remains a significant concern in corporate financial re-porting, particularly among carbon-intensive companies facing increasing pressure to demonstrate environmental responsibility (ER) while maintaining financial reporting credibility. This study investigates the moderating role of board gender diversity (BGD) and board remuneration (BR) on carbon emission reduction (CER)- earnings manage-ment (EM) relationship among Johannesburg Stock Exchange (JSE)-listed car-bon-intensive companies. This study adopts a quantitative panel data approach, exam-ining 106 companies over the period 2015–2025. Fixed-effects model is employed to es-timate the main relationships, while two-step system generalised method of moments estimation for additional robustness testing. The findings reveal a statistically significant negative relationship between CER and EM, suggesting that stronger carbon emission reduction is associated with reduced earnings management. Furthermore, the findings indicate that BGD and BR shape the CER–EM relationship, highlighting the importance of corporate governance mechanisms in financial reporting behaviour. The study con-tributes to the sustainability reporting literature by showing the relevance of board composition and remuneration arrangements in understanding the environmental re-sponsibility-financial reporting quality nexus.
Keywords:
carbon emission reduction
; earnings management
; board gender diversity
; board remuneration
; financial reporting quality
1. Introduction
Earnings management (EM) remains a significant concern in corporate financial reporting because of its consequences for financial reporting credibility, transparency and investor confidence [1,2,3]. Existing studies have extensively examined EM in relation to corporate financial performance, corporate governance (CG) mechanisms and managerial reporting incentives [4,5,6,7]. However, increasing environmental responsibility (ER) has redirected scholarly attention towards ER- financial reporting quality (FRQ) relationship. In particular, firm with higher carbon-intensive footprints face growing pressure to reduce greenhouse gas (GHG) emissions while sustaining credible financial reporting and meeting stakeholder expectations [8,9].
Carbon emission reduction (CER) provides an important signal of companies' efforts to mitigate their environmental impact. Rather than relying on overall environmental, social and governance (ESG) indicators, carbon emissions reduction measures changes in reported GHG emissions, thereby focusing on measurable CER information published [10,11,12]. However, attaining carbon reduction targets may involve significant environmental investments and regulatory compliance costs, creating pressure on managers to maintain favourable financial results [13,14]. Therefore, stronger CER may promote corporate environmentally responsible practices and FRQ or create incentives for opportunistic EM.
Prior research reveals mixed findings on ER- EM relationship. Some studies report that environmentally responsible companies show greater financial reporting transparency and reduced earnings manipulation [13,15,16,17]. Conversely, other studies indicate that environmental initiatives may provide reputational protection that enables opportunistic financial reporting [18]. Abbas et al. (2023) [19], investigating Chinese high-polluting firms, reported that CG mechanisms were associated with carbon emissions disclosure, and that EM moderated several governances–disclosure relationships. Their findings show the relevance of CG characteristics in understanding environmental reporting and managerial financial reporting behaviour. However, their study focused on carbon emissions disclosure rather than actual carbon emissions reduction. This distinction raises an important question about whether improvements in carbon emission reduction are associated with reduced EM and whether CG mechanisms influence this relationship.
Previous studies indicate that the environmental performance -EM nexus may depend on CG mechanisms. Primacintya and Kusuma (2025) [3] revealed that BGD strengthens the ESG-EM negative relationship among Indonesian listed companies. Similarly, [20] found that executive compensation significantly strengthens the negative relationship between ESG performance and both accrual-based and real earnings management in Korean companies. However, Laksmi and Priyanda (2026) [21] reported that although managerial ownership significantly moderated the ESG–earnings management relationship, BGD did not show a significant moderating influence. These findings indicate that the efficacy of CG attributes may vary across organisational environments and incentive arrangements. Furthermore, existing literature primarily applied composite ESG performance measures, providing limited insight into whether BGD and BR jointly moderate CER-EM relationship. Therefore, the present study addresses this issue by exploring these two CG mechanisms among JSE-listed carbon-intensive companies over the period 2015–2025.
Against this background, this study investigates whether BGD and BR jointly condition CER- EM association among 53 carbon-intensive companies listed on the JSE. The present study adopts a quantitative panel data approach and fixed effects (FE) serves as the main estimation approach.
The study advances the existing literature in three ways. First, it extends ER research by focusing on carbon emissions reduction rather than broader ESG measures. Second, it contributes to CG research by examining BGD and BR as moderating mechanisms influencing CER-EM nexus. Third, it offers evidence from South African carbon-intensive firms over an eleven-year period, providing insights into how environmental responsible practices and CG characteristics relate to financial reporting integrity within a developing country.
2. Theoretical Framework, Literature Review and Hypotheses Development
2.1. Theoretical Framework
Stakeholder theory (ST) and agency theory (AT) were employed theories to explain the CER-EM relationship, together with the moderating effects of BGD and BR. These theories provide complementary perspectives on how ER, CG mechanisms and managerial incentives shape financial reporting behaviour.
ST posits that firms operate within a network of relationships involving shareholders, employees, regulators, communities and environmental interest groups whose expectations influence corporate decisions and reporting practices [8,22]. In carbon-intensive industries, increasing stakeholder expectations regarding climate change mitigation encourage companies to lower GHG emissions, while maintaining FRQ. Therefore, companies exhibiting stronger CER may seek to preserve stakeholder confidence through credible financial reporting and reduced EM practices. However, investment in environmental and carbon reduction practices may impose financial costs, encouraging managers to present favourable earnings to maintain corporate legitimacy and stakeholder support [14,23,24].
AT complements this perspective by explaining how conflicts of interest between shareholders and managers may shape financial reporting behaviour. Managers possess greater access to internal information and may exercise discretion over accounting estimates to advance their interests, especially when performance expectations and remuneration arrangements create incentives for short-term financial results. Effective CG mechanisms may mitigate these agency problems through monitoring, accountability and incentive alignment [19]. BGD may strengthen board oversight by broadening perspectives and improving scrutiny of managerial decisions, while BR may influence the incentives governing financial reporting behaviour. However, remuneration arrangements linked to short-term accounting outcomes may encourage opportunistic reporting, whereas incentives aligned with long-term organisational objectives may discourage such behaviour.
Integrating ST and AT theories provides a basis for understanding why CER may be associated with lower earnings management and why this relationship may vary according to board composition and remuneration arrangements. Accordingly, the study conceptualises BGD and BR as moderating mechanisms that may strengthen or weaken the r CER-EM relationship rather than treating them solely as independent determinants of financial reporting behaviour.
2.2. Carbon Emission Reduction and Earnings Management
The environmental performance-EM association has attracted scholarly attention as firms face growing pressure to demonstrate ER alongside credible financial reporting. Prior research has primarily investigated composite ESG performance, producing mixed findings concerning their association with EM [3,13,15]. Although these measures provide useful insights into firm ER, CER offers a more specific indication of changes in firms reported GHG emissions.
Existing of literature suggests that environmentally responsible companies are less likely to engage in EM because environmental commitments encourage transparency, ethical business practices and long-term stakeholder relationships [25,26,27]. Ibrahim and Ndu (2025) [27] report that environmentally responsible practices reduce EM, indicating that superior ER may discourage unethical financial reporting. In the same vein, [26] found that companies exhibiting greater environmental performance show reduced levels of EM. Alodat et al. (2024) [25] also report that firms’ compliance with environmental sustainability disclosure requirements promote ethical firm behaviour, which constrains EM practices. These findings align with [13,15] and [16] who found with a negative association between ER and EM. Similarly, [3] revealed that superior ESG performance was associated with reduced EM. From ST perspective, firms achieving meaningful CER may seek to maintain their credibility by ensuring that financial reporting practices remain consistent with their environmental commitments.
On the contrary, ER may create opportunities for opportunistic financial reporting. Carbon reduction initiatives often involve high upfront costs in cleaner technologies, operational adjustments and environmental compliance, which may affect short-term profitability [28,29]. These pressures may encourage managers to exercise discretion over reported earnings to maintain favourable financial performance and meet stakeholder expectations [14,24]. Li (2026) [18] provides evidence suggesting that ER may coexist with greater earnings manipulation. Furthermore, Abbas et al. (2023) [19] established that earnings management and carbon emissions disclosure are interconnected, although their study focused on disclosure rather than actual emissions reduction.
These contrasting arguments suggest that the CER-EM relationship is not uniform. However, the evidence supporting ER perspective suggests that firms showing greater reductions in reported carbon emissions may also demonstrate ethical financial reporting. Accordingly, the following hypothesis is formulated:
H1.
Carbon emissions reduction is negatively associated with earnings management among JSE-listed carbon-intensive companies.
2.3. The Moderating Role of Board Gender Diversity
Board gender diversity has emerged an important CG characteristic that may shape the effectiveness of board monitoring and financial reporting oversight. AT indicates that boards comprising directors with diverse professional experiences and perspectives may strengthen scrutiny of managerial decisions, thereby limiting unethical financial reporting practices. Gender-diverse boards may also promote greater consideration of stakeholder interests and ER, especially in sectors exposed to extensive environmental risks [30,31].
Empirical evidence suggests that BGD may influence the ER -EM association. Primacintya and Kusuma (2025) [3] found that BGD strengthened the negative association between ESG performance and EM among Indonesian listed companies. Their findings suggest that female board representation may reinforce the financial reporting benefits associated with stronger sustainability performance. Similarly, [19] showed the importance of CG structures in the relationship between carbon emissions disclosure and EM, although their analysis did not specifically examine BGD as a moderator of actual CER.
However, the effectiveness of BGD remains context dependent. Laksmi and Priyanda (2026) [21] reported an insignificant moderating effect of BGD on the ESG performance–EM relationship, indicating that greater female representation does not necessarily translate into stronger monitoring effectiveness. Similarly, [30] found no statistically significant evidence that BGD moderated the relationship between sustainability reporting disclosure and EM among Jordanian companies. These contrasting findings suggest that board representation alone may be insufficient to influence managerial reporting behaviour without meaningful participation in corporate oversight.
Within the context of CER, greater female representation may strengthen the board's ability to evaluate whether environmental improvements are accompanied by ethical financial reporting. Therefore, gender-diverse boards may strengthen the negative association between carbon reduction and EM through improved oversight and accountability. Based on these theoretical arguments, the study proposes:
H2.
Board gender diversity moderates the relationship between carbon emissions reduction and earnings management among JSE-listed carbon-intensive companies.
2.4. The Moderating Role of Board Remuneration
Board remuneration has emerged as a governance mechanism that may shape the CER-EM [32]. From AT perspective, remuneration arrangements may affect the alignment of directors' and executives' interests with firm objectives. While appropriate remuneration may encourage effective monitoring, accountability and long-term organisational performance [33], compensation arrangements linked excessively to short-term financial performance may create incentives for opportunistic EM practice [34].
Recent empirical research provides evidence of the relevance of remuneration incentives to the ESG performance–earnings management relationship. Lee (2025) [32], examining Korean listed companies, reported that executive compensation strengthened the negative association between ESG performance and both accrual-based and real earnings management. Although these results offer a useful empirical basis, the current study extend the discussion by exploring total remuneration rather than executive remuneration alone. Specifically, BR is proxied as the natural logarithm of total remuneration, representing the overall remuneration paid to board of directors. This distinction is essential because BR encompasses compensation linked with managerial roles and corporate board oversight, depending on the composition of the reported compensation.
In carbon-intensive companies, CER initiatives may require investment significant investment in cleaner technologies, operational adjustments, creating competing financial and environmental performance expectations. Where BR supports long-term accountability and effective board oversight, stronger CER may be associated with reduced EM. However, remuneration arrangements that compensates short-term reported financial performance may weaken this association. Therefore, the impact of BR may depend on whether remuneration arrangements support effective monitoring or encourage unethical financial reporting, such as engaging in EM practices.
These competing considerations indicate that the moderating influence of BR may depend on the structure of remuneration arrangements and the incentives they create. Consequently, the study proposes the following hypothesis:
H3.
Board remuneration moderates the relationship between carbon emissions reduction and earnings management among JSE-listed carbon-intensive companies 2022).
2.5. Conceptual Framework
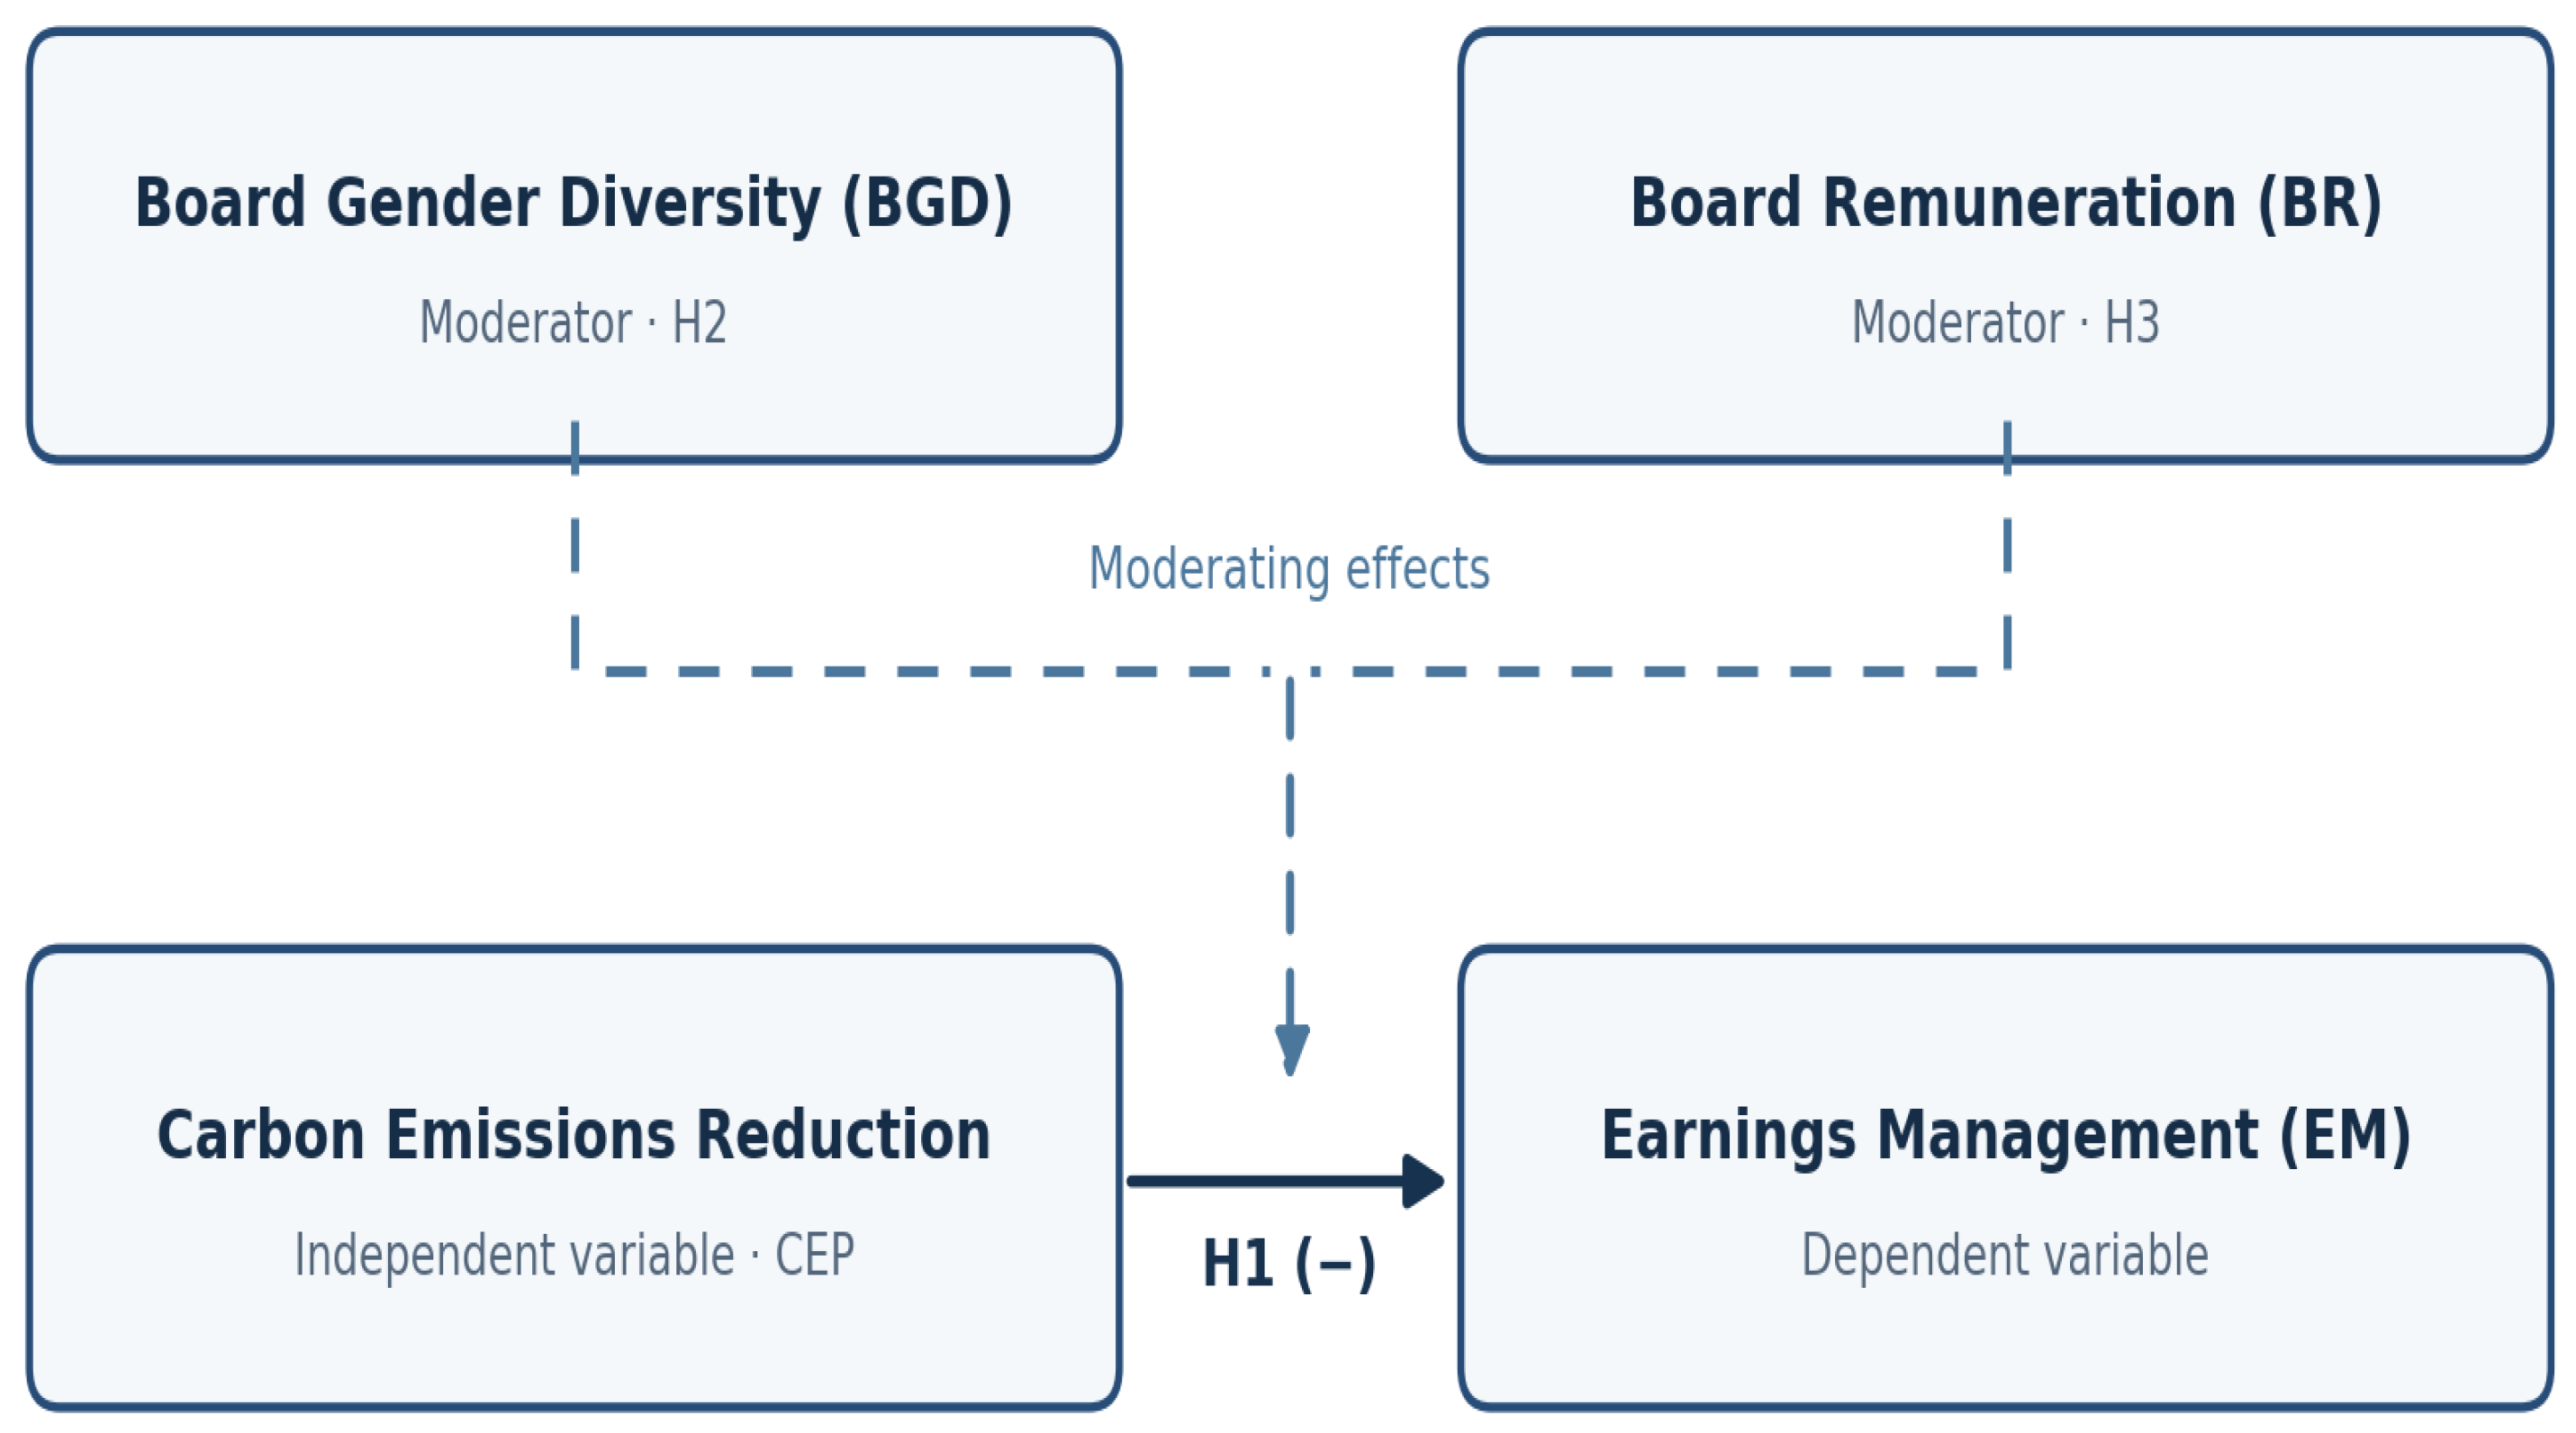
The conceptual framework incorporates the three hypotheses by showing the direct relationship between CER and EM, together with the moderating roles of BGD and BR.
The framework proposes that CER is directly associated with EM (H1). BGD (H2) and BR (H3) are expected to influence the strength or direction of this association.
Figure 1.
Proposed conceptual framework of the study. Source: Authors own compilation Note: The solid arrow denotes the hypothesised negative association (H1) between carbon emissions reduction (CER) and earnings management (EM). Dashed arrows represent the separate moderating roles of BGD (H2) and BR (H3).
Figure 1.
Proposed conceptual framework of the study. Source: Authors own compilation Note: The solid arrow denotes the hypothesised negative association (H1) between carbon emissions reduction (CER) and earnings management (EM). Dashed arrows represent the separate moderating roles of BGD (H2) and BR (H3).
3. Materials and Methods
3.1. Research Design, Sample Selection and Data Sources
This study adopted a quantitative longitudinal research design to investigate the relationship between CER and EM, considering the moderating roles of BGD and BR. The study focused on carbon-intensive companies listed on the JSE over the period 2015–2025. The GHG emission data for 2014 were collected to provide the preceding-year emissions figures needed to calculate CER for 2015. A panel data approach is appropriate due to its ability captures variations across companies and over time, allowing the analysis to account for unobserved firm-specific characteristics that may influence financial reporting behaviour.
The study employed purposive sampling to identify companies operating in carbon-intensive industries. The initial population comprises 256 JSE-listed companies, of which 106 operate in the identified carbon-intensive sectors, including basic materials, oil and gas, industrials and consumer goods. The study selected all 106 firms due to their exposure to GHG emissions, regulatory requirements and stakeholder scrutiny. Therefore, the final sample includes 106 JSE-listed carbon-intensive firms over the period 2015-2025, reflecting 1 166 firm-year observations.
Secondary data are obtained from companies' annual financial statements, integrated reports, sustainability reports or ESG reports. Financial information is collected to estimate discretionary accruals and the relevant control variables, while reported Scope 1 and Scope 2 GHG emissions are used to calculate CER. Information regarding board composition and remuneration is extracted from integrated reports.
3.2. Measurement of Variables
CER is the independent variable and reflects the year-on-year reduction in reported GHG emissions. The study applied Scope 1 emissions, comprising direct emissions from company-controlled operations, and Scope 2 emissions, reflecting indirect emissions associated with purchased electricity and other acquired energy. These measures were adopted to capture changes in companies' operational carbon emissions rather than reliance on composite ESG ratings or carbon disclosure scores.
Following [35,36], CER is calculated as the difference between the previous year's and current year's total reported emissions, divided by the previous year's emissions:
Where: CERit denotes carbon emissions reduction for company i in year t, and GHGit represents the combined Scope 1 and Scope 2 emissions reported for that company and year. A positive CER value indicates a reduction in emissions, whereas a negative value indicates an increase. The proxy captures changes in reported emissions.
EM is the dependent variable and is proxied by discretionary accruals (DA) estimated using the Modified Jones Model (Dechow et al., 1995).
Where the NDA component is specified as follows:
Where:
TAt is total accrual calculated as net operating income (NOPI) minus cashflows from operations for each year 𝔱 (TAt = NOPIt - CFOt); NDA is the non-discretionary accruals for each year 𝔱; CFOt ( 𝔱 − 1) is the cash flow from operation for each year 𝔱; ∆REVt is the change in the revenue (from credit sales) for each year 𝔱; PPEt is the Property, Plant and Equipment for each year 𝔱; At−1 is the total assets at the end of period; εt is the random error, which is used as the estimate for EM (DA). The coefficients: α1, α2, α3 are estimates of firm specific parameters.
This approach separates DA from the portion of total accruals (TA) explained by ordinary business activities. TA were determined as operating income less net cash flows from operating activities and are scaled by lagged total assets.
The Modified Jones approach estimates expected accruals using changes in revenue, changes in receivables and property, plant and equipment. DA were calculated by subtracting estimated non-discretionary accruals (NDA) from TA. The primary EM measure is the absolute value of DA, which measures the magnitude of accrual-based reporting discretion without distinguishing between income-increasing and income-decreasing practices. Higher absolute DA indicate a greater estimated magnitude of EM.
Two CG mechanisms were examined as moderating variables. BGD was measured as the proportion of female directors to the total number of board members. This measure represents the extent of female representation in firm board structures and is consistent with prior CG and EM research [3,28,29].
BR was measured as the natural logarithm of total board remuneration reported by each company. Total board remuneration represents the aggregate remuneration paid to directors, including executive and non-executive remuneration components. Although [31] examined executive compensation as a moderator of the ESG performance–EM relationship, the present study focused on total board remuneration, capturing the remuneration level associated with the broader board structure.
The study included relevant company and board characteristics to reduce potential omitted-variable bias. Board independence (BI) was measured as the proportion of independent directors on the board, while board tenure (BT) denotes the average number of years directors have served. In addition, firm size, financial leverage and profitability are considered as financial controls due to their characteristics that may shape the extent of managerial reporting discretion.
3.3. Model Specification
The study estimated three models to establish the direct relationship between CER and EM, and the separate moderating influences of BGD and BR. The first model assesses the direct relationship, while the second and third models introduce interaction terms to determine whether the relationship changes according to board gender diversity and remuneration.
EMit = β0 + β1 CERit + β2 BIit + β3 BTit + β3 FSIZEit + μi + λt + εit
EMit = β0 + β1 CERit + β2 BGDit + β3 ( CERit xBGDit ) + β4 BIit + β5 BTit + β6 FSIZEit + μi + λt + εit
EMit = β0 + β1 CERit + β2 BGDit + β3( CERit xBRit ) + β4 BIit + β5 BTit + β6 FSIZEit + μi + λt + εit
Where: EMit denotes earnings management for firm I in year t, CERit represents carbon emissions reduction, BGDit denotes board gender diversity andBRit represents board remuneration for firm i in year t. β0 represents regression intercept, β1 -β5 denote regression coefficients, μi represents firm-specific fixed effects, λt denotes year-specific fixed effects, εit represents idiosyncratic error term.
3.4. Panel Data Estimation and Diagnostic Tests
The study began with descriptive statistics and a correlation matrix to examine the distributions and preliminary associations among the study variables. Variance inflation factors (VIF) were assessed to identify potential multicollinearity, especially in specifications including interaction terms. Fixed-effects (FE) and random-effects (RE) regressions were then estimated, with the Hausman specification test used to assess the appropriateness of the two estimators. Where the Hausman test rejects the null hypothesis of no systematic differences between estimators, FE is preferred because it controls for unobserved, time-invariant firm characteristics potentially correlated with the explanatory variables.
The main regression specifications include firm and year effects to account for persistent company differences and common time-related influences. Diagnostic procedures are used to evaluate heteroskedasticity and serial correlation, and firm-clustered robust standard errors are considered to support reliable statistical inference. Where relevant, cross-sectional dependence is also assessed. The results from these tests inform the final specification and interpretation of the panel estimates.
3.5. Sensitivity Analysis and Endogeneity Assessment
To assess the sensitivity of the findings to the measurement of EM, the study adopted real earnings management (REM) as an alternative dependent variable [37]. Following [38], REM is estimated using abnormal cash flows from operations, abnormal production costs and abnormal discretionary expenses. This analysis examined whether the estimated CER–EM relationship remains consistent when EM is measured by real operating decisions rather than accrual-based reporting discretion.
Potential endogeneity may arise from reverse causality, unobserved time-varying factors and persistence in financial reporting behaviour [39]. To examine the robustness of the findings, the study additionally employed two-step system generalised method of moments (system GMM) estimation, drawing on [40,41,42]. The dynamic specification incorporates lagged EM alongside the explanatory variables and relevant controls.
The reliability of the system GMM estimates was assessed using the Arellano–Bond tests for first- and second-order serial correlation and the Hansen test of overidentifying restrictions. Instrument selection is restricted to limit instrument proliferation, particularly given the relatively small number of companies in the sample. These procedures provide additional evidence concerning the robustness of the observed relationships but do not, by themselves, establish causality.
4. Results and Discussion
4.1. Descriptive Statistics
Table 1 presents the descriptive statistics for the variables included in the study, covering 106 JSE-listed carbon-intensive companies over the period 2015–2025. The reported summary contains 1,166 firm-year observations, corresponding to a balanced panel over the eleven-year study period. The mean value of carbon emissions reduction (CER) is 0.192, indicating an average annual reduction of 19.2% in reported Scope 1 and Scope 2 greenhouse gas emissions. The reported maximum reduction is 52.7%, while the minimum is zero. These values indicate variation in carbon reduction performance, although the absence of negative CER observations requires verification against the underlying data.
Earnings management (EM), measured using discretionary accruals, has a mean of 0.069 and a standard deviation of 0.073, with values ranging from −0.231 to 0.368. This distribution indicates variation in signed discretionary accruals across company-year observations. Regarding the moderating variables, board gender diversity (BGD) has a mean of 0.352, suggesting that female directors account for approximately 35.2% of board membership on average. Board remuneration (BR), measured as the natural logarithm of total board remuneration, has a mean of 16.215, indicating variation in remuneration levels across the sampled companies.
Among the control variables, board independence (BI) averages 0.601, indicating that independent directors represent approximately 60.1% of board membership. Board tenure (BT) has a mean of 7.326 years, suggesting that directors serve for approximately seven years and four months on average. Firm size (FSIZE), measured as the natural logarithm of total assets, has a mean value of 22.648. Collectively, these descriptive statistics provide an initial overview of differences in carbon emissions reduction, financial reporting behaviour and board characteristics among the sampled firms.

Table 1.
Descriptive statistics.
| VARIABLE | Obs. | Mean | Std. dev. | Min | Max |
|---|---|---|---|---|---|
| EM | 1 166 | 0.069 | 0.073 | −0.231 | 0.368 |
| CER | 1 166 | 0.192 | 0.091 | 0.000 | 0.527 |
| BGD | 1 166 | 0.352 | 0.151 | 0.003 | 0.667 |
| BR | 1 166 | 16.215 | 1.124 | 13.482 | 19.367 |
| BI | 1 166 | 0.601 | 0.176 | 0.200 | 0.950 |
| BT | 1 166 | 7.326 | 3.741 | 1.000 | 19.200 |
| FSIZE | 1 166 | 22.648 | 1.873 | 18.214 | 27.196 |
| Notes: EM = earnings management; CER = carbon emissions reduction; BGD = board remuneration; BR = remuneration; BI = board independence; BT = average board tenure in years; FSIZE = firm size. | |||||
Source: Authors own compilation.
4.2. Correlation Analysis
Table 2 presents the Pearson correlation coefficients among carbon emissions reduction (CER), earnings management (EM), board gender diversity (BGD), board remuneration (BR), and the control variables. The results indicate a negative correlation between CER and EM (r = −0.194), suggesting that companies achieving greater carbon emissions reduction tend to report lower signed discretionary accruals. This preliminary association is consistent with the negative relationship proposed under H1, although correlation analysis alone does not establish causality.
Regarding the moderating variables, BGD exhibits a negative correlation with EM (r = −0.168), while BR also shows a negative correlation (r = −0.110). These associations suggest that greater female board representation and higher total board remuneration coincide with lower signed discretionary accruals. However, the individual correlations do not establish whether BGD and BR moderate the CER–EM relationship. The moderating effects are therefore assessed separately through the interaction terms in the regression models.
Among the control variables, board independence (BI) is negatively correlated with EM (r = −0.134), whereas board tenure (BT) and firm size (FSIZE) display relatively weak positive associations with EM (r = 0.082 and r = 0.067, respectively). The strongest correlation among the explanatory variables is between BR and FSIZE (r = 0.466), suggesting that larger companies tend to report higher levels of total board remuneration. Overall, the pairwise correlations do not indicate exceptionally strong linear relationships among the explanatory variables. Nevertheless, variance inflation factor tests are used to assess multicollinearity in the regression specifications, particularly those incorporating interaction terms.
Variance inflation factors (VIFs) were calculated to assess potential multicollinearity among the explanatory variables. Table 4 presents the VIF statistics and corresponding tolerance values (1/VIF) for the variables considered in the regression analysis. The results indicate that all VIF values are substantially below the commonly applied threshold of 10. The interaction between carbon emissions reduction and board remuneration (CER × BR) exhibits the highest VIF of 1.866, followed by board gender diversity (BGD) at 1.839 and board remuneration (BR) at 1.780. The mean VIF is 1.580, which is below the more conservative threshold of 5. Furthermore, all tolerance values exceed 0.5, ranging from 0.5359 to 0.8681. These findings suggest that severe multicollinearity is unlikely among the explanatory variables included in the reported specification. Accordingly, the results provide preliminary support for retaining the variables in the subsequent regression analyses.
Table 2.
Pearson correlation matrix and multicollinearity test.
| VARIABLE | EM | CER | BGD | BR | BI | BT | FSIZE |
| EM | 1.000 | ||||||
| CER | -0.194*** | 1.000 | |||||
| BGD | -0.168*** | 0.156*** | 1.000 | ||||
| BR | -0.110*** | 0.163*** | 0.119*** | 1.000 | |||
| BI | -0.134*** | 0.087*** | 0.028 | 0.065** | 1.000 | ||
| BT | 0.082** | -0.041 | 0.025 | 0.124*** | 0.057 | 1.000 | |
| FSIZE | 0.067** | 0.129*** | 0.095*** | 0.466*** | 0.051* | 0.144*** | 1.000 |
| VIF | |||||||
| Variable | VIF | 1/VIF | |||||
| CER | 1.690 | 0.5917 | |||||
| BGD | 1.839 | 0.5438 | |||||
| BR | 1.780 | 0.5618 | |||||
| CER x BGD | 1.671 | 0.5984 | |||||
| CER x BR | 1.866 | 0.5359 | |||||
| BI | 1.469 | 0.6911 | |||||
| BT | 1.152 | 0.6579 | |||||
| FSIZE | 1.172 | 0.8532 | |||||
| Mean VIF | 1.580 | ||||||
| Notes: EM = earnings management; CER = carbon emissions reduction; BGD = board remuneration; BR = remuneration; BI = board independence; BT = average board tenure in years; FSIZE = firm size; VIF= Variance inflation factors | |||||||
Source: Authors own compilation.
4.3. Model Selection and Diagnostic Tests
The study performed Hausman specification test to establish whether the FE or random-effects (RE) estimator was more appropriate for examining the relationship between CER and EM. The Hausman test produced a chi-square statistic of 15.78 and a p-value of 0.0037, which is below the 5% significance threshold. Therefore, the null hypothesis that the random-effects estimator is consistent is rejected, supporting the selection of the FE
Therefore, the FE estimator serves as the primary analytical approach for testing H1, H2 and H3, while two-step system GMM is employed as an additional robustness assessment to address potential endogeneity and dynamic relationships.
4.4. Fixed Effects Results and Moderation Analysis
Table 3 presents the fixed-effects regression specifications examining the relationship between carbon emissions reduction (CER) and earnings management (EM), together with the moderating roles of board gender diversity (BGD) and board remuneration (BR). Three models are considered in accordance with the proposed hypotheses. Model 1 examines the direct CER–EM relationship (H1), Model 2 introduces the interaction between CER and BGD (H2), while Model 3 incorporates the interaction between CER and BR (H3). All models control for board independence (BI), board tenure (BT), and firm size (FSIZE), with firm and year fixed effects intended to account for unobserved firm-specific characteristics and common temporal influences.
The reported results in Model 1 indicate a negative and statistically significant association between carbon emissions reduction and earnings management (β = −0.138, p < 0.01). The negative association remains evident in Model 2 (β = −0.115, p < 0.01) and Model 3 (β = −0.121, p < 0.01). These estimates suggest that higher carbon emissions reduction is associated with lower signed DA, holding the specified control variables constant. The direction of the coefficients is consistent with H1, although the statistical conclusions require confirmation using the original regression output.
The negative CER–EM relationship is consistent with the broader environmental accountability literature. For instance, [3] documented a negative association between ESG performance and earnings management among Indonesian listed companies. Similarly, [19] established an important connection between corporate governance, carbon emissions disclosure, and earnings management in Chinese high-polluting companies. Although [19] examined carbon disclosure rather than actual emissions reduction, their findings highlight the interconnectedness of environmental accountability, governance structures, and financial reporting practices. The present analysis contributes to this literature by shifting attention from environmental disclosure and composite ESG scores towards year-on-year changes in Scope 1 and Scope 2 greenhouse gas emissions.
From the perspective of stakeholder theory, the negative association is consistent with the argument that companies responding to environmental expectations may also face incentives to demonstrate accountability in their financial reporting. Emissions reduction can reflect responsiveness to regulatory, investor, and societal pressures, while credible financial reporting helps maintain relationships with stakeholders. Nevertheless, carbon reduction alone does not demonstrate ethical financial reporting, and the estimated relationship does not establish causality. Furthermore, because EM is measured using signed discretionary accruals, a negative coefficient indicates a movement towards lower signed accruals rather than necessarily a reduction in the absolute magnitude of earnings manipulation. This distinction is important when interpreting H1.
4.4.1. Moderating Role of Board Gender Diversity
Model 2 examines whether board gender diversity moderates the relationship between carbon emissions reduction and earnings management. The reported coefficient for BGD is negative (β = −0.032), with the supplied standard error of 0.004 indicating statistical significance at the 1% level under conventional inference. More importantly, the interaction between CER and BGD is negative (β = −0.082), with its reported standard error of 0.041 consistent with significance at approximately the 5% level. The interaction suggests that the negative association between CER and signed discretionary accruals becomes stronger as female board representation increases. This pattern is consistent with the moderation proposed under H2, subject to confirmation of the exact clustered p-value.
The result is consistent with the monitoring perspective of agency theory, which emphasises the role of corporate governance in addressing information asymmetry and managerial opportunism. A more gender-diverse board may introduce broader professional experiences, additional perspectives, and stronger scrutiny of corporate decisions. These attributes could be particularly relevant when directors oversee both environmental performance and financial reporting processes. However, the regression coefficients cannot establish that female directors themselves caused changes in reporting behaviour.
The proposed moderating relationship is supported by [3] who found that board gender diversity strengthened the negative relationship between ESG performance and earnings management among Indonesian companies. Their findings suggest that board composition may influence how environmental commitments relate to financial reporting outcomes. The present study extends this argument to South African carbon-intensive firms by considering actual emissions reduction rather than aggregate ESG performance.
Conversely, [30] reported an insignificant moderating effect of board gender diversity on the relationship between sustainability reporting disclosure and earnings management among Jordanian companies. The difference between their findings and the coefficients reported in the present table may be attributable to differences in institutional context, environmental measurement, sample characteristics, or governance arrangements. It also highlights the possibility that the role of gender diversity differs between sustainability disclosure practices and measurable environmental outcomes.
Taken together, the reported interaction provides a potential contribution to agency theory by suggesting that the relationship between environmental performance and accounting outcomes may depend on board composition. The coefficient is consistent with H2, although formal acceptance of the hypothesis should be based on the verified regression estimates and their marginal effects.
4.4.2. Moderating Role of Board Remuneration
Model 3 investigates the moderating role of board remuneration in the relationship between carbon emissions reduction and earnings management. The reported coefficient for BR is negative (β = −0.012), with a standard error of 0.003, indicating statistical significance at the 1% level under conventional inference. The interaction between CER and BR is also negative (β = −0.007), with a reported standard error of 0.003, consistent with statistical significance at approximately the 5% level. The interaction suggests that the CER–EM association becomes more negative as total board remuneration increases. This pattern is consistent with H3, subject to confirmation of the original estimates.
Agency theory provides a possible explanation for this relationship. Director remuneration can influence the incentives associated with governance responsibilities, including board oversight, monitoring, and accountability. Where remuneration is accompanied by effective governance arrangements, directors may have stronger incentives to protect corporate reputation and monitor reporting decisions. However, the remuneration level alone does not establish whether compensation is performance-based or appropriately aligned with stakeholder interests.
The reported moderating relationship is broadly consistent with [31], who investigated the moderating role of CEO compensation in the relationship between ESG performance and earnings management among Korean listed companies. Lee's [31] study provides relevant evidence that compensation arrangements may condition the relationship between sustainability performance and accounting behaviour. Nevertheless, an important distinction exists between the two studies. Whereas [31]) examined executive compensation, the present study uses the natural logarithm of total board remuneration, potentially including executive and non-executive directors. Consequently, the reported interaction should be interpreted as a relationship involving the overall level of board remuneration rather than direct evidence of performance-linked executive incentives.
The negative interaction coefficient therefore raises the possibility that board remuneration is associated with how environmental performance relates to financial reporting behaviour. This adds a remuneration-related governance dimension to the environmental accountability literature and is consistent with agency theory's emphasis on monitoring and incentive structures. Nevertheless, because remuneration is measured in logarithmic form, the CER coefficient in Model 3 represents the estimated CER association when log remuneration equals zero. The interaction must therefore be evaluated at observed remuneration levels to establish the economic magnitude of the relationship. Subject to these qualifications, the reported interaction is consistent with H3.
The control variables provide additional insights into the association between governance characteristics and signed discretionary accruals. Board independence exhibits consistently negative coefficients across Model 1 (β = −0.142), Model 2 (β = −0.132), and Model 3 (β = −0.143), with the reported estimates indicating statistical significance at the 1% level. This pattern is consistent with agency theory, which identifies independent directors as an important monitoring mechanism. Related research by Abbas et al. (2023) [19] also emphasises the relevance of board independence to corporate environmental disclosure, although their analysis concerns a different dependent variable and therefore provides only indirect comparative evidence.
Board tenure displays positive coefficients across the three models. The coefficient is provisionally significant in Model 1 (β = 0.019, p < 0.05) but statistically insignificant in Models 2 and 3. This suggests that the association between directors' tenure and signed discretionary accruals is not stable across the specifications. Longer board tenure may enhance firm-specific knowledge and monitoring experience, although prolonged relationships between directors and management could also weaken oversight independence. The present coefficients do not establish which of these mechanisms is operating.
Firm size exhibits positive coefficients across the models, with provisional statistical significance in Models 1 and 3. This indicates that larger firms may exhibit higher signed discretionary accruals after controlling for the other variables, although the association is relatively sensitive to model specification. Differences in operational complexity, accounting estimates, and corporate reporting requirements may contribute to this pattern.
The reported within R² values are 0.271 for Model 1, 0.294 for Model 2, and 0.287 for Model 3. These values suggest that the specifications account for approximately 27.1%, 29.4%, and 28.7%, respectively, of the within-firm variation in the dependent variable under the fixed-effects framework. The higher within R² values in the moderation models suggest improved explanatory fit, although they do not independently establish the statistical importance of the interaction terms.
The direction of the coefficients is consistent with the three proposed hypotheses. CER displays a negative association with signed discretionary accruals, while the interactions involving BGD and BR suggest that board characteristics may condition this association. The theoretical interpretation combines ST, which emphasises corporate responsiveness to environmental expectations, and AT, which highlights board monitoring and incentive mechanisms.
The potential contribution of the study lies in examining measurable CER rather than relying exclusively on sustainability disclosures or aggregate ESG scores, while simultaneously investigating two distinct CG moderators within South African carbon-intensive firms.
Table 4.
Fixed effects results.
| Variable | Model 1 (H1) | Model 2 (H2) | Model 3 (H3) |
|---|---|---|---|
| CER | -0.138*** | -0.115*** | -0.121*** |
| (0.038) | (0.032) | (0.035) | |
| BGD | |||
| - | -0.032** | - | |
| BR | - | (0.004) | -0.012** |
| (0.003) | |||
| CER x BGD | - | -0.082** | - |
| (0.041) | |||
| CER x BR | - | - | -0.007** |
| (0.003) | |||
| BI | -0.142*** | -0.132*** | -0.143*** |
| (0.048) | (0.045) | (0.046) | |
| BT | 0.019** | 0.010 | 0.012 |
| (0.009) | (0.007) | (0.008) | |
| FSIZE | 0.011** | 0.008 | 0.010** |
| (0.005) | (0.005) | (0,005) | |
| Firm fixed effects | Yes | Yes | |
| Year fixed effects | Yes | Yes | Yes |
| Observations | 1 166 | 1 166 | 1 166 |
| Within R2 | 0.271 | 0.294 | 0.287 |
| Notes: firm-clustered standard errors in parentheses, and significance: *** p < 0.01; ** p < 0.05; * p < 0.10. | |||
Source: Authors own compilation.
4.5. Sensitivity Analysis: Real Earnings Management
To assess the robustness of the main findings, real earnings management (REM) was employed as an alternative measure of earnings management, following [38]. Unlike discretionary accruals, REM captures potential manipulation through operating activities. Table 5 presents the sensitivity analysis using the three fixed-effects regression specifications.
The results indicate a negative relationship between carbon emissions reduction (CER) and REM across all three models, with coefficients of −0.030 (Model 1), −0.033 (Model 2), and −0.039 (Model 3), each reported as significant at the 5% level. These findings are directionally consistent with the primary fixed-effects results and H1. They also align with ST suggesting that environmental accountability may be associated with more ethical corporate reporting practices.
Regarding the moderating variables, the interaction between CER and board gender diversity (BGD) is negative (β = −0.038, p < 0.05), suggesting that greater female board representation strengthens the negative CER–REM relationship, consistent with H2. This finding supports the monitoring perspective of agency theory and agrees with [3], although it differs from the insignificant moderation effect reported by [30]. Similarly, the interaction between CER and board remuneration (BR) is negative (β = −0.003, p < 0.05), suggesting that higher board remuneration strengthens the negative association between CER and REM, consistent with H3. This result broadly aligns with Lee (2025), although that study examined CEO compensation rather than total board remuneration.
Table 5.
Sensitivity analysis: REM.
| Variable | Model 1 (H1) | Model 2 (H2) | Model 3 (H3) |
|---|---|---|---|
| CER | -0.030** | -0.033*** | -0.039*** |
| BGD | - | -0.021* | - |
| BR | - | - | -0.011* |
| CER x BGD | - | -0.038** | - |
| CER x BR | - | - | -0.003** |
| BI | -0.041*** | -0.054** | -0.062** |
| BT | 0.010 | 0.007 | 0.005 |
| FSIZE | 0.011* | 0.009* | 0.006* |
| Firm fixed effects | Yes | Yes | Yes |
| Year fixed effects | Yes | Yes | Yes |
| Observations | 1 166 | 1 166 | 1 166 |
| Notes: significance: *** p < 0.01; ** p < 0.05; * p < 0.10. | |||
Source: Authors own compilation.
4.6. Endogeneity Analysis: Two-Step System GMM
To address potential endogeneity and the persistence of earnings management, the study employed the two-step system generalised method of moments (GMM) estimator, following [37,41,42,43]. Table 8 presents the reported estimates for the three models. The lagged earnings management coefficients are positive (β = 0.121 to 0.228), with significance reported at the 1% level, suggesting persistence in signed discretionary accruals.
Regarding H1, CER exhibits negative coefficients across Models 1, 2 and 3 (β = −0.115, −0.083 and −0.111, respectively), with significance reported at the 5% level. These findings are consistent with the fixed-effects results and stakeholder theory, which emphasises environmental accountability and responsible corporate reporting. The results also broadly align with [3] and [19].
Concerning H2, the interaction between CER and board gender diversity is negative (β = −0.087, p < 0.05), suggesting that female board representation strengthens the negative CER–EM relationship. This finding supports the monitoring perspective of agency theory and is consistent with [3], although it contrasts with [30]. Similarly, the interaction between CER and board remuneration is negative (β = −0.009, p < 0.05), suggesting that higher remuneration strengthens the negative CER–EM association, consistent with H3. This result broadly aligns with Lee (2025), who examined CEO compensation as a moderator of the ESG–earnings management relationship.
The diagnostic results indicate significant AR(1) tests (p = 0.017–0.023) and insignificant AR(2) tests (p = 0.375–0.422). Hansen test p-values range from 0.282 to 0.316, while instrument counts (39–42) remain below the reported number of companies (106). If confirmed, these diagnostics would provide preliminary support for the GMM specifications. Overall, the coefficients are consistent with H1, H2 and H3 and directionally reinforce the fixed-effects findings.
Table 6.
Two-step system GMM.
| Variable | Model 1 (H1) | Model 2 (H2) | Model 3 (H3) |
|---|---|---|---|
| Lagged EM | 0.228*** | 0.121*** | 0.218*** |
| CER | -0.115** | -0.083** | -0.111* |
| BGD | - | -0.023* | - |
| BR | - | - | -0.012* |
| CER x BGD | - | -0.087** | - |
| CER x BR | - | - | -0.016** |
| BI | -0.051** | -0.074** | -0.034** |
| BT | 0.007 | 0.006 | 0.008 |
| FSIZE | 0.009* | 0.008* | 0.009* |
| Observations | 1 166 | 1 116 | 1166 |
| Firms | 106 | 106 | 106 |
| Instruments | 39 | 42 | 42 |
| AR(1) p-value | 0.022 | 0.017 | 0.023 |
| AR(2) p-value | 0.375 | 0.422 | 0.393 |
| Notes: significance: *** p < 0.01; ** p < 0.05; * p < 0.10. | |||
Source: Authors own compilation.
5. Conclusions, Theoretical and Practice Implication, Limitations and Future Research
This study examined the relationship between carbon emissions reduction (CER) and earnings management (EM), focusing on the moderating roles of board gender diversity (BGD) and board remuneration (BR) among 106 South African carbon-intensive firms listed on the Johannesburg Stock Exchange (JSE) over the period 2015–2025. Drawing on stakeholder and agency theories, the study employed fixed-effects regression models, supplemented by real earnings management (REM) sensitivity analysis and two-step system generalised method of moments (GMM) estimation to assess the robustness of the proposed relationships.
The fixed-effects results indicate a negative association between CER and signed DA, consistent with H1. Furthermore, the negative interaction coefficients suggest that BGD and BR strengthen this relationship, providing support for H2 and H3. The REM and system GMM estimates demonstrate similar directional patterns, indicating that the relationships may extend beyond accrual-based reporting decisions. These findings should nevertheless be interpreted cautiously because lower signed DA do not necessarily indicate a reduction in the overall magnitude of earnings manipulation, and the reported statistical estimates require verification against the underlying data.
Theoretical implications. The study contributes to stakeholder theory by extending the environmental responsibility–financial reporting relationship beyond sustainability disclosures and composite ESG indicators to measurable reductions in carbon emissions. It also advances agency theory by highlighting the potential conditional roles of board gender diversity and remuneration in the relationship between environmental performance and accounting behaviour. By integrating these theoretical perspectives, the study proposes that environmental accountability and corporate governance mechanisms may jointly shape financial reporting outcomes. The separate examination of BGD and BR further contributes to understanding the distinct roles of board composition and remuneration in sustainability-related governance.
Practical implications. The findings offer relevant insights for corporate boards, investors, regulators and policymakers. Boards of carbon-intensive companies should consider integrating measurable emissions reduction targets into their governance and financial reporting oversight processes. Greater female board representation may contribute to broader monitoring perspectives, while transparent and appropriately structured remuneration arrangements could strengthen accountability. Investors and regulators should evaluate actual emissions performance alongside financial reporting indicators rather than relying exclusively on sustainability disclosures. However, the observed associations should not be interpreted as evidence that increasing board diversity or remuneration will automatically improve reporting quality.
Limitations and future research. The study is limited to JSE-listed companies operating in four carbon-intensive sectors, which may restrict the generalisability of its findings. The reliance on publicly reported Scope 1 and Scope 2 emissions may introduce measurement inconsistencies, while the use of signed discretionary accruals does not capture the overall magnitude of earnings manipulation. Although fixed effects and system GMM are employed, potential endogeneity and unobserved time-varying influences cannot be eliminated. Furthermore, total board remuneration does not distinguish between fixed and performance-linked compensation. Future research could investigate absolute discretionary accruals, individual REM components, Scope 3 emissions, remuneration structures and alternative governance mechanisms. Comparative studies across emerging economies and industries could also establish whether the proposed relationships vary across institutional and regulatory environments.
Overall, the study provides a framework for understanding how measurable carbon emissions reduction and board governance characteristics relate to financial reporting behaviour in carbon-intensive firms, while emphasising the importance of credible environmental performance measures and effective corporate oversight.
Author Contributions
For research articles with several authors, a short paragraph specifying their individual contributions must be provided. The following statements should be used “Conceptualization, M.C.M, L.L. B and A.Z.J; methodology, M.C.M.; software, M.C.M.; validation, M.C.M.., L.L.B and A.Z.J; formal analysis, M.C.M.., L.L.B and A.Z.J.; investigation, M.C.M.., L.L.B and A.Z.J resources, M.C.M.., L.L.B and A.Z.J data curation, M.C.M.., L.L.B and A.Z.J.; writing—original draft preparation, M.C.M.; writing—review and editing, M.C.M.., L.L.B and A.Z.J visualization, M.C.M.., L.L.B and A.Z.J.; project administration, M.C.M.., L.L.B and A.Z.J.; funding acquisition, M.C.M.., L.L.B and A.Z.J. All authors have read and agreed to the published version of the manuscript.” Please turn to the CRediT taxonomy for the term explanation. Authorship must be limited to those who have contributed substantially to the work reported.
Funding
This research received no external funding.
Institutional Review Board Statement
Not applicable.
Informed Consent Statement
Not applicable.
Data Availability Statement
Data is available from authors upon request.
Conflicts of Interest
The authors declare no conflicts of interest.
References
- Ghaleb, B. A. A., Qaderi, S. A., Almashaqbeh, A., & Qasem, A. (2021). CSR, board diversity and earnings management. Cogent Business & Management, 8(1). [CrossRef]
- Gao, X., & Zhang, B. (2021). Option informativeness and earnings announcements. Pacific Accounting Review, 33(3), 361–375. [CrossRef]
- Primacintya, V. A., & Kusuma, I. W. (2025). ESG performance and earnings management. Asian Journal of Accounting Research, 10(3), 294–314. [CrossRef]
- Al-Hawtmeh, O. M., Alleimoun, A. A., & Obeidat, G. (2024). The impact of earnings management practices on performance of the banking sector in Jordan. Cogent Business & Management, 11(1). [CrossRef]
- Banerjee, A. K., Akhtaruzzaman, M., & Chatterjee, S. (2026). Earnings management: The influence of peer group and corporate governance intervention. Journal of Accounting Literature, 48(1).
- Hoai, T. T. T., Thu, H. H. T., Tan, H. C., & Anh, T. D. (2026). Board characteristics and earnings management. Investment Management and Financial Innovations, 23(1). [CrossRef]
- Madwe, M. C., Khanyile, N., & Ngcubhe, S. (2024). Earnings manipulation in JSE firms. International Journal of Applied Research in Business and Management, 5(2). [CrossRef]
- Awa, H. O., Etim, W., & Ogbonda, E. (2024). Stakeholder theory and corporate social responsibility. International Journal of Corporate Social Responsibility, 9, Article 11. [CrossRef]
- Siddique, M. A., Karim, S., Haque, M. R., & Mia, P. (2026). ESG disclosures and greenwashing. International Review of Financial Analysis, 109. [CrossRef]
- Ganda, F., & Milondzo, K. (2018). The Impact of Carbon Emissions on Corporate Financial Performance: Evidence from the South African Firms. Sustainability, 10(7). [CrossRef]
- Palas, R., Gafni, D., Solomon, D., & Baum, I. (2025). ESG ratings and reporting quality. Finance Research Letters, 86. [CrossRef]
- Sun, W., Chen, S., Jiao, Y., & Fung, X. (2024). ESG constraints on earnings management. Finance Research Letters, 61. [CrossRef]
- Gerged, A. M., Albitar, K., & Al-Haddad, L. (2023). Environmental disclosure and earnings management. International Journal of Finance & Economics, 28(3), 2789–2810. [CrossRef]
- Naseer, M. M., Guo, Y., & Zhu, X. (2025). ESG initiatives and firm performance. Development and Sustainability Economics and Finance, 7. [CrossRef]
- Nguyen, L. T. (2022). Sustainability performance and earnings management. Journal of Financial Reporting and Accounting.
- Xi, J., & Xiao, H. (2022). Environmental disclosure and earnings management. Managerial Auditing Journal, 37(5), 565–593. [CrossRef]
- Elrazaz, T., & Aljifri, K. (2026). ESG and earnings management nexus in GCC. International Review of Economics & Finance, 105. [CrossRef]
- Li, A. (2026). Environmental disclosures and earnings management. Finance Research Letters, 91. [CrossRef]
- Abbas, A., Zhang, G., Bilal, Y., & Chengang, Y. (2023). Firm governance structures, earnings management, and carbon emission disclosures in Chinese high-polluting firms. Business Ethics, the Environment & Responsibility, 32(4), 1470–1489. [CrossRef]
- Lee, E.J. (2025). ESG performance and earnings management: The moderating role of CEO compensation. Korean Journal of Computerized Accounting Research, 23(2). [CrossRef]
- Laksmi, A.C., & Priyanda, D.S. (2026). The effect of environmental, social, and governance (ESG) performance on earnings management: The moderating role of corporate governance. International Journal of Economics, Business and Accounting Research, 10(3). [CrossRef]
- Mahajan, R., Lim, W.M., Sareen, M., & Kumar, S. (2023). Stakeholder theory. Journal of Business Research, 166. [CrossRef]
- Silvia, M. (2026). Sustainability disclosure, greenwashing, and earnings management: evidence from weak institutional environments. Frontiers in Climate, 8. [CrossRef]
- Sun, D., & Li, J. (2025). Carbon pressure and earnings management. International Review of Economics and Finance, 103. [CrossRef]
- Alodat, A.Y., AI Amosh, H., Alorayni, O., & Khatib, S.F.A. (2023). Does corporate sustainability disclosure mitigate earnings management: empirical evidence from Jordan. International Journal of Disclosure and Governance, 21. [CrossRef]
- Soeprajitno, R.R.W.N., Na’im, A., Kusuma, I.W., & Rakhman, F. (2024). Sustainability performance and earnings management: institutional and regulatory perspectives. Cogent Business & Management, 11 (1). [CrossRef]
- Ibrahim, K.F.A., & Ndu, M. (2025). Corporate sustainability disclosure and earnings management practices of premium board companies listed on the Nigerian Exchange Group (GNX). MSI Journal of Economics and Business Management (MSIJEBM). https://zenodo.org/records/17084888.
- Ibishova, B., Misund, B., & Tveteras, R. (2024). Driving green: Financial benefits of carbon emission reduction in companies. International Review of Financial Analysis, 96.
- Taboada, M., Wanke, P., & Tan, Y. (2026). Navigating Multidimensional Sustainability: How Firms Can Balance Economic, Social, and Environmental Goals in the Transition to a Low-Carbon Economy. Journal of the Knowledge Economy, 17. [CrossRef]
- Ghaleb, B. A. A., Qaderi, S. A., Almashaqbeh, A., & Qasem, A. (2021). CSR, board diversity and earnings management. Cogent Business & Management, 8(1). [CrossRef]
- Marquez-Cardenas, V., Gonzalez-Ruiz, J.D., & Duque-Crisales, E. (2022). Board gender diversity and firm performance. Journal of Sustainable Finance & Investment, 12(3). [CrossRef]
- Alnohoud, I., Alshdaifat, S. M., Ahmad, S. M., Alhasnawi, M. Y., & Atieh, A. A. (2026). Sustainability reporting disclosure and earnings management: The role of board gender diversity and risk committee effectiveness. Journal of Risk and Financial Management, 19. [CrossRef]
- Lee, E.J. (2025). ESG performance and earnings management: The moderating role of CEO compensation. Korean Journal of Computerized Accounting Research, 23(2). [CrossRef]
- Wang, H., Tsui, K.W.H., Wang, Q.J., Fu, X., & Hu, F. (2025). How do board governance and operational management affect carbon emissions among full-service and low-cost carriers? Journal of Cleaner Production, 529.
- Saeed, U.F., & Abdul-Karim, M. (2025). The evolving role of executive compensation, sustainability performance, and corporate dynamics in the era of corporate sustainability: insights from quantile regression in emerging markets. Cogent Business & Management, 12(1). [CrossRef]
- Xie, J., Abbass, K., & Li (2024). Green innovation and stakeholder pressure. Journal of Environmental Management, 352. [CrossRef]
- Madwe, M.C. (2026). Carbon-Based environment performance and earnings management in South African Carbon Emitting Companies. Acta Universitatis Oeconomica, 22(3).
- Al-Begali, S.A.A., & Phua, L.K. (2023). Accruals, real earnings management, and CEO demographic attributes in emerging markets: Does concentration of family ownership count? Cogent Business & Management, 10(2). [CrossRef]
- Imeni, M., & Edalatpanah, S.A. (2026). CSR Disclosure Breadth and Earnings Management: Evidence Consistent with Opportunistic Reporting in an Emerging Market. Journal of Risk and Financial Management, 19(10). [CrossRef]
- Gafsi, N., & Belgacem, I. (2026). Green Finance Energy Transition and Critical Raw Materials: An Integrated Framework for Resource Sustainability. Resources, 15(6). [CrossRef]
- Arellano, M., & Bover, O. (1995). Another look at the instrumental variable estimation of error-components models. Journal of Econometrics, 68(1). [CrossRef]
- Blundell, R., Bond, S. (1998). Initial conditions and moment restrictions in dynamic panel data models. Journal of Econometrics, 87.
- Ho, L.T., & Gan, C. (2021). Foreign Direct Investment and World Pandemic Uncertainty Index: Do Health Pandemics Matter? Journal of Risk and Financial Management, 14(3). [CrossRef]
Disclaimer/Publisher’s Note: The statements, opinions and data contained in all publications are solely those of the individual author(s) and contributor(s) and not of MDPI and/or the editor(s). MDPI and/or the editor(s) disclaim responsibility for any injury to people or property resulting from any ideas, methods, instructions or products referred to in the content. |
© 2026 by the authors. Licensee MDPI, Basel, Switzerland. This article is an open access article distributed under the terms and conditions of the Creative Commons Attribution (CC BY) license (http://creativecommons.org/licenses/by/4.0/).
Copyright: This open access article is published under a Creative Commons CC BY 4.0 license, which permit the free download, distribution, and reuse, provided that the author and preprint are cited in any reuse.