
Submitted:
31 October 2026
Posted:
02 November 2026
You are already at the latest version
Abstract
Background/Objectives: Lung cancer is the leading cause of cancer death worldwide, and growing slide volumes add to pathologists’ cognitive load. Deep learning can assist histopathological diagnosis, but two obstacles limit its clinical use: privacy regulations keep patient images in institutional “data silos”, and the “black-box” behavior of neural networks undermines clinical trust. Inspired by Topol’s Deep Medicine, we aimed to build a diagnostic platform that preserves privacy and explains its decisions. Methods: We developed the Lung Cancer Analysis System (LCAS), which combines federated learning (FL), explainable artificial intelligence (XAI), and a locally deployed medical large language model (LLM). Three public H&E datasets (LC25000, HistoSet-5×14, and CLID; 18,000 images; adenocarcinoma, squamous cell carcinoma, benign tissue) acted as three hospital nodes with source-induced non-independent and identically distributed (non-IID) data. DenseNet121, EfficientNet-B3, and MobileNetV3-Small were trained centrally and with FedAvg/FedProx for 20 rounds. Grad-CAM produced visual evidence, and MedGemma 1.5, served offline through LM Studio, converted predictions and heatmap descriptors into structured reports. Results: Centralized training reached 99.50% ± 0.21% accuracy with DenseNet121. Under non-IID federated training with FedProx, DenseNet121 and EfficientNet-B3 achieved 96.97% and 97.49% accuracy on an independent external blind test set of 958 images, whereas MobileNetV3-Small reached 91.23%. Accuracy remained 99.78% under Gaussian blur. t-SNE showed that global features clustered by tissue class rather than by hospital, and Grad-CAM highlighted glandular and tumor-nest regions consistent with histopathological criteria. Conclusions: FL, XAI, and on-premise LLM reporting can be integrated into a single workflow that keeps raw images within each institution while giving pathologists numerical, visual, and textual explanations, providing a practical path toward trustworthy cross-institutional computational pathology.
Keywords:
federated learning
; explainable artificial intelligence
; Grad-CAM
; lung cancer histopathology
; FedProx
; non-IID data
; privacy preservation
; large language model
; MedGemma
; digital pathology
1. Introduction
Lung cancer is the leading cause of cancer-related death worldwide, accounting for approximately 1.8 million deaths each year [1,2]. Histopathological examination of hematoxylin and eosin (H&E)-stained tissue is the reference standard for confirming malignancy and for distinguishing lung adenocarcinoma (ACA) from lung squamous cell carcinoma (SCC), a distinction that determines molecular testing and therapy. Yet this workflow suffers from inter-observer variability, cognitive fatigue under growing caseloads, and an uneven distribution of expert pathologists. Whole-slide imaging (WSI) and convolutional neural networks (CNNs) have created computational pathology, in which deep learning classifies tumor subtypes and even predicts mutations from morphology [3,4]. In Deep Medicine, Topol argues that the promise of artificial intelligence (AI) is not to replace clinicians but to absorb repetitive cognitive work so that physicians can return to “deep looking”—careful observation, empathy, and communication [5].
Two barriers stand between this vision and practice. The first is the data silo problem. Robust models need diverse data from many institutions, scanners, and staining protocols, but medical images are protected by the European General Data Protection Regulation (GDPR) [6], the U.S. Health Insurance Portability and Accountability Act (HIPAA), and Taiwan’s Personal Data Protection Act (PDPA) [7], and models trained at a single center often degrade elsewhere because of domain shift. Federated learning (FL) moves the model rather than the data: each institution trains locally, and only model parameters are aggregated [8,9,10]. Real hospitals, however, hold non-independent and identically distributed (non-IID) data, which causes “client drift” and can destabilize the standard Federated Averaging (FedAvg) algorithm [11,12]. The second barrier is the trust gap: a model that outputs “adenocarcinoma, 98%” without showing what it looked at offers an unverifiable answer [13]. Gradient-weighted Class Activation Mapping (Grad-CAM) highlights the image regions that drive a prediction [14,15], and medical large language models (LLMs) such as MedGemma 1.5 [16] can turn model outputs into clinical language—but sending patient data to cloud-hosted LLMs would reintroduce the privacy problem that FL solves.
We therefore propose the Lung Cancer Analysis System (LCAS), which integrates FL, explainable AI (XAI), and an on-premises medical LLM. A DenseNet121 backbone [17] is trained collaboratively by three simulated hospitals with FedAvg and FedProx, and its decisions are explained by Grad-CAM heatmaps and by reports generated locally by MedGemma 1.5. Our contributions are as follows:
- A three-layer system architecture (federated training, validation, and clinical deployment) in which raw images never leave the institution, evaluated on 18,000 H&E images from three heterogeneous sources acting as hospitals with source-induced non-IID data.
- A comparison of high-capacity (DenseNet121), compound-scaled (EfficientNet-B3), and lightweight (MobileNetV3-Small) backbones under local-only, centralized, and federated training, including their communication cost.
- An analysis of FedProx under non-IID data, with an ablation of the proximal coefficient μ, external blind testing, blur robustness, and a cross-modal stress test.
- A “three-dimensional explanation” that couples numerical (probability), visual (Grad-CAM), and textual (LLM report) evidence in a bilingual web platform that runs fully offline.
Related Work
CNNs have been applied extensively to lung histopathology, most often on the LC25000 dataset [18]. Garg and Garg compared eight ImageNet-pretrained CNNs, including DenseNet169 and MobileNet, and visualized them with Grad-CAM and SmoothGrad (96–100% accuracy) [19]; Moin et al. compared DenseNet121/169/201 and other backbones with seven class-activation XAI methods (97–99%) [20]; Tummala et al. combined compound-scaled EfficientNetV2 with Grad-CAM (99.97%, five classes) [21], and Anjum et al. reported about 97% with multiresolution EfficientNets [22]. Hasan et al. benchmarked DenseNet, MobileNetV3, a vision transformer, and YOLO11 on LC25000 combined with LungHist700 (best 98.38%) [23]. Other single-dataset studies report 99–100% [24,25]. All of these train and test on pooled data. In FL, Adnan et al. trained DenseNet-feature multiple-instance models on TCGA LUAD/LUSC slides from several hospitals with FedAvg and differential privacy, reaching 82.4% versus 84.8% for centralized training [26]; FedAvg has also been applied to gigapixel WSIs [27] and to LC25000 [28,29,30], and Ajowho combined FL with explainable heatmaps [31]. A systematic review by Touhami et al. found FedAvg to be the dominant strategy, reported accuracies of 69.37–99.72%, and highlighted non-IID data as a key challenge [32]. FedProx [12] and SCAFFOLD [33] were designed to counter client drift. Most prior FL studies split one dataset artificially, and few combine FL with both visual and on-premise textual explanation. Table 1 compares the closest studies; this work is the only one that combines federated training on heterogeneous sources, visual and textual explanation, and an independent external test.
2. Materials and Methods
2.1. System Architecture
Figure 1 shows LCAS’s system architecture as a layered pipeline. H&E patches from three hospitals pass through data partitioning (one source per node, 80:10:10 split, non-IID by source) and pre-processing (resizing, Macenko stain normalization, conservative augmentation, and blur simulation) into an ImageNet-pretrained backbone. The model is trained along two paths—centralized training on pooled data as the performance ceiling and federated training in which images stay in each hospital and only weights are exchanged (FedProx local updates and FedAvg aggregation)—and then classifies each patch with a softmax over three classes. Each prediction is explained along a visual path (Grad-CAM) and a textual path (a structured report generated locally by MedGemma 1.5). The model is evaluated on internal, external, blur, and cross-modal test data and deployed on-premises in the LCAS web platform, where the pathologist reviews the output—class, heatmap, and report.
2.2. Datasets and Simulated Hospital Nodes
Three public H&E datasets from different sources were assigned to three hospital nodes (Table 2), each providing lung adenocarcinoma (ACA), squamous cell carcinoma (SCC), and benign tissue (N): Hospital 1, LC25000 (768 × 768 JPEG images derived from HIPAA-compliant validated samples and expanded with the Augmentor library) [18]; Hospital 2, HistoSet-5×14, a balanced 14-class multi-organ collection augmented with geometric transformations [34]; and Hospital 3, the Comprehensive Lung Cancer Imaging Dataset (CLID), de-identified patches extracted by pathologists from clinical WSIs [35]. Each class at each node was randomly down-sampled to 2000 images (6000 per hospital; 18,000 in total) and split 80:10:10 into training, validation, and test subsets. Although class counts are balanced, the nodes differ in staining, preparation, and acquisition, so the partition is non-IID by source (feature-distribution skew). An IID reference setting was created by pooling and shuffling all images before dividing them evenly among the nodes.
External blind test set. The test split of the Roboflow “Lung Cancer” dataset (version 1; 9537 images at 640 × 640) [36], containing 958 images (325 ACA, 304 SCC, 329 benign), was never used for training or model selection. Hospital 4 stress test. De-identified retrospective imaging data from Chung Shan Medical University (CSMU)—49,824 DICOM files from 174 patients, organized by patient, study (PET/CT, thoracic CT, chest X-ray), series, and instance—served as a fourth hospital. Because these grayscale radiological images differ fundamentally from H&E histology, we used them only as an exploratory robustness test under severe domain shift, not as a diagnostic benchmark.
2.3. Pre-Processing and Data Augmentation
Images were resized to 224 × 224 pixels with bilinear interpolation (300 × 300 for EfficientNet-B3) and normalized with ImageNet channel statistics. In federated training, each node applied Macenko stain normalization [37] locally, estimating H&E stain vectors via singular value decomposition of optical density and mapping stain concentrations to a common reference, reducing color differences across sources without sharing images. Augmentation was conservative because H&E color carries biological meaning: random horizontal/vertical flips, rotations (±15–30°), resized cropping (80–100% of the field), mild zoom (0.9–1.1×), and slight brightness changes, without strong color jitter. To simulate scanner defocus, Gaussian blur (5 × 5 kernel, σ ∈ [0.1, 2.0]) was applied during training and, for the robustness test, at inference.
2.4. Backbone Architectures
DenseNet121 [17] was the core backbone. In a dense block, each layer receives the feature maps of all preceding layers,
where [·] denotes channel concatenation and H_ℓ comprises batch normalization, ReLU, and 1 × 1 and 3 × 3 convolutions. Dense connectivity promotes feature reuse and keeps the model small, which suits fine nuclear texture and FL bandwidth limits. The ImageNet classifier was replaced by dropout (0.5), a 1024→512 fully connected layer with ReLU, dropout (0.3), and a 3-unit output layer (Figure 2). As capacity ablations, MobileNetV3-Small [38] (depthwise separable convolutions for constrained bandwidth) and EfficientNet-B3 [39] (compound scaling of depth, width, and resolution) received analogous heads. All backbones were initialized with ImageNet weights [40] and fine-tuned end-to-end; Table 3 lists their size and communication cost.
x𝓁 = H𝓁([x0,x1,…,x𝓁−1])
2.5. Federated Learning Protocol
In each communication round t, the server broadcasts the global weights wt to the K = 3 hospitals; each hospital k trains a local copy on its private data for E = 1 epoch and uploads wkt+1; and the server aggregates the uploads. FedAvg [10] uses a sample-size-weighted average:
where nk is the number of training samples at hospital k and n = Σk nk (equal weights in our balanced setting). To counter client drift, FedProx [12] adds a proximal term to the local objective:
where Fk(w) is the local cross-entropy loss and μ ≥ 0 controls how far local models may drift; μ = 0 recovers FedAvg. We evaluated μ ∈ {0, 0.01, 0.1, 1.0} and used μ = 0.01 in the main experiments. The traffic of one round and of the whole training is
where |w| is the serialized model size. Algorithm 1 summarizes the procedure; local optimization used Adam [41] with a learning rate of 1 × 10⁻⁴ and a batch size of 32, and one round took approximately 6–11 min depending on the hardware.
Cround = 2K |w|, Ctotal = T ⋅ Cround
| Algorithm 1. Federated training with FedProx (FedAvg when μ = 0) |
| Input: K = 3 hospitals with private data Dk; T = 20 rounds; E = 1 local epoch; Adam, η = 10−4; batch size 32; μ = 0.01 |
| 1: Initialize w0 from the ImageNet-pretrained backbone with a new 3-class head |
| 2: for t = 0, …, T − 1 do: server broadcasts wt to all hospitals |
| 3: for each hospital k in parallel: apply Macenko normalization and augmentation locally; set wk ← wt |
| 4: for E epochs over mini-batches b ⊂ Dk: wk ← wk − η∇[ℓCE(b; wk) + (μ/2)‖wk − wt‖²] |
| 5: upload wkt+1 ← wk (no images or labels leave hospital k) |
| 6: server aggregates wt+1 ← Σk (nk/n) wkt+1 |
| Output: global model wT, deployed to LCAS after external validation |
Baselines. Centralized training pooled all 18,000 images on one server as the performance ceiling (Adam, learning rate 1 × 10⁻⁴, batch size 64 for DenseNet121 and 32 for the other backbones, up to 50 epochs with early stopping on validation loss); a baseline configuration without augmentation and an enhanced configuration with dynamic augmentation were run. Local-only training used data from a single hospital, representing an institution that does not collaborate. Results of repeated runs are reported as mean ± SD.
2.6. Explainability and Report Generation
Figure 2 shows the LCAS AI diagram. For Grad-CAM [14], let Ak denote the k-th 7 × 7 feature map of the last dense block and yc the pre-softmax score of class c. Channel weights are the spatially pooled gradients, and the localization map is their rectified weighted sum:
where Z = 49 is the number of spatial positions. The map is upsampled to 224 × 224, rendered with a jet color scale, and overlaid on the input. To test whether federated training removes institutional bias, the 1024-dimensional pooled features of the global model were projected with t-SNE [42] and colored by class and by hospital.
Reports are produced by MedGemma 1.5 [16] served through the local OpenAI-compatible API of LM Studio [43], so no data leave the hospital network. A prompt builder maps the softmax probability to a wording strength (e.g., ≈1.00 → “highly consistent with”; ≈0.90 → “suspicious for”) and converts the location of high Grad-CAM activation into a morphological descriptor (e.g., activation on tumor cell nests for SCC). A fixed system prompt then instructs the model: “You are a clinical pathologist specializing in digital pathology. Based on the AI analysis data below (predicted class, confidence score, and visual-feature description), write a structured report—FINDINGS: describe the morphology highlighted by Grad-CAM; IMPRESSION: state the model’s diagnosis and its confidence; RECOMMENDATION: suggest follow-up examinations. Use only the data provided and do not invent patient information.” Together, the probability, heatmap, and report form a three-dimensional explanation.
2.7. Platform, Metrics, and Implementation
LCAS is a bilingual (Traditional Chinese/English) web application that accepts JPEG, PNG, or TIFF images, shows a three-stage progress indicator (classification, heatmap, report), and exports reports as PDF or text with a disclaimer that they must be reviewed by a physician. Performance was measured with accuracy, precision, recall, F1-score (per class and macro/weighted averages), and confusion matrices:
All models were implemented in PyTorch with Python 3.12 and trained on Kaggle (dual NVIDIA T4 GPUs, CUDA 12.8), a workstation with an NVIDIA RTX 4050 Laptop GPU (Intel Core i5-12500H, 32 GB RAM, CUDA 12.9), and an Apple M5 system (32 GB) with the Metal Performance Shaders backend; LM Studio with MedGemma 1.5 ran on the workstation.
3. Results
3.1. Centralized Baseline
DenseNet121 reached a validation accuracy of 0.9933 after one epoch and 1.0000 by epoch 3; early stopping ended training at epoch 13 (validation loss 0.0001), with brief fluctuations at epochs 7 and 9 (loss ≤ 0.0050) and no divergence between training and validation curves. On the held-out test data, DenseNet121 achieved a precision, recall, and F1-score of 1.00 for all classes, while MobileNetV3-Small and EfficientNet-B3 achieved macro averages of 0.99, their only errors being a few adenocarcinomas (recall 0.97). Over repeated runs, centralized accuracy was 99.50% ± 0.21% (DenseNet121), 99.64% ± 0.18% (EfficientNet-B3), and 97.20% ± 0.55% (MobileNetV3-Small) (Table 4). On the external Roboflow set, centralized DenseNet121 classified all 958 images correctly, and MobileNetV3-Small misclassified one adenocarcinoma as benign (Figure 3a,b).
3.2. Federated Performance Across Scenarios
Table 4 compares the training scenarios. Local-only models scored highly on their own test data (95.12–99.45%) but are trained on a single source. In the IID federated setting, FedAvg exceeded 98% global accuracy within five rounds and approached 100% for DenseNet121 and EfficientNet-B3, matching the centralized ceiling without exchanging images. In the realistic non-IID setting, the FedProx global models reached, on the external blind test set, 96.97% ± 0.62% accuracy (F1 96.96%) for DenseNet121, 97.49% ± 0.52% (F1 97.49%) for EfficientNet-B3, and 91.23% ± 0.95% (F1 91.21%) for MobileNetV3-Small—that is, about 2.5, 2.2, and 6.0 percentage points below centralized training, with low run-to-run variation (SD ≤ 0.95%).
3.3. Convergence and the Proximal Coefficient
Figure 4 shows the training dynamics over 20 FedProx rounds. For DenseNet121, mean local accuracy rose from 0.880 (round 1) to 0.972 (round 2) and 0.991 (round 4), while the loss fell from 0.350 to 0.046. Small setbacks followed at rounds 5, 9, 12, and 15 (e.g., loss 0.031 → 0.037 between rounds 11 and 12), reflecting conflicting updates from heterogeneous hospitals; weighted aggregation and the proximal constraint absorbed them, and the curves stabilized after about round 15. Final training losses were 0.028 (DenseNet121), 0.014 (EfficientNet-B3), and 0.008 (MobileNetV3-Small). MobileNetV3-Small had the lowest training loss but the lowest external accuracy, suggesting that its 2.04 M parameters fit each source without reconciling them into transferable features.
Table 5 reports the μ ablation for DenseNet121. FedAvg (μ = 0) converged fastest (14 rounds) but had the lowest accuracy (98.42%). A small proximal term (μ = 0.01) raised accuracy to 99.00%, μ = 0.1 performed best (99.11%; F1 99.13%), and a strong constraint (μ = 1.0) reduced accuracy to 98.75% by limiting local learning. A small-to-moderate μ thus balances local fitting and global stability; μ = 0.01 was adopted because it converged faster than μ = 0.1 with nearly identical accuracy.
3.4. External Validation, Robustness, and Cross-Modal Stress Test
Table 6 and Figure 5 give the per-class results of the federated models on the 958 external images. Benign tissue was recognized almost perfectly (F1 0.980–0.997). For DenseNet121, the main error was predicting ACA as SCC (20 of 325), yielding high ACA precision (0.993) but lower recall (0.926); EfficientNet-B3 showed the same pattern, with perfect SCC recall. MobileNetV3-Small confused the carcinoma subtypes in both directions (23 ACA→SCC; 48 SCC→ACA). Malignant tissue was rarely called benign by the stronger models (7 of 629 carcinomas for DenseNet121, none for EfficientNet-B3), so the dominant errors were subtype confusions between malignancies rather than missed cancers.
Under Gaussian blur (σ = 0.1–2.0) on the internal test images (n = 1800), accuracy remained 0.9978, with only four errors (one ACA as benign, one ACA as SCC, two SCC as ACA) and no errors on benign tissue (Figure 3c). On the Hospital 4 DICOM data (Table 4), MobileNetV3-Small (97.76% ± 1.84%) and EfficientNet-B3 (92.00% ± 6.91%) were relatively stable, whereas DenseNet121 varied widely (77.22% ± 22.82%). Because these are radiological images rather than H&E patches, the numbers are not diagnostic accuracy; they show that a model specialized for histological texture can become unreliable outside its modality, so out-of-distribution detection should precede use on unfamiliar data.
3.5. Feature Space and Grad-CAM Explanations
In the t-SNE embedding of the global model (Figure 6), samples formed three compact, well-separated clusters by tissue class, whereas samples from Hospitals 1–3 were thoroughly interleaved inside each cluster, with no hospital-specific sub-cluster. The federated model thus organizes its features by biology rather than by institution.
Figure 7 shows Grad-CAM results for the centralized DenseNet121 (all predictions were correct with 1.000 confidence). For ACA, activation concentrated on densely packed atypical nuclei around a gland-forming structure; for SCC, on a cohesive cluster of large hyperchromatic tumor cells, consistent with nested growth; and for benign tissue, on a broad region spanning thin alveolar septa rather than a sharply delimited cell cluster. The federated model produced similar patterns (Figure 8): SCC and benign examples were predicted with a confidence of 1.000 and highlighted tumor nests and alveolar or bronchial epithelium, whereas one ACA example with loosely arranged cells received a confidence of 0.918 and a more diffuse heatmap—exactly the kind of case in which visual evidence helps the pathologist judge how much to trust the model. Both training regimes therefore base their decisions on diagnostically meaningful structures, and federated training preserves explanation quality.
3.6. LCAS Platform and Generated Report
Figure 9a shows LCAS analyzing an SCC image (probability 100.0%). The MedGemma report described polygonal tumor cells with distinct borders, keratin pearls, and coarse chromatin with Grad-CAM activation in the keratinizing region (FINDINGS); stated that the DenseNet121 prediction was lung SCC with 100.0% confidence and that the morphology met diagnostic criteria (IMPRESSION); and suggested immunohistochemistry (p40, p63, CK5/6), PD-L1 testing, and staging with multidisciplinary discussion (RECOMMENDATION), followed by a disclaimer. All computations ran locally; Figure 9b shows the federated analytics dashboard.
4. Discussion
This study shows that federated training can classify lung histopathology across heterogeneous institutions with accuracy close to centralized training while keeping images on site. Under IID conditions, FedAvg matched the centralized ceiling, and under realistic source-induced non-IID conditions, the FedProx models still reached 96.97% (DenseNet121) and 97.49% (EfficientNet-B3) on an independent external test set—about 2–2.5 points below pooling all data. For institutions that cannot share slides, this small cost buys access to colleagues’ data, and t-SNE shows that the model generalizes beyond any single hospital.
Against heterogeneity [11,32], local Macenko normalization reduced color discrepancies, and the FedProx proximal term kept local updates near the global model [12]. Model capacity mattered as much as aggregation: MobileNetV3-Small needs one-sixth of DenseNet121’s traffic (Table 3) but lost 6 points under FL, whereas DenseNet121 balanced accuracy, stability, and traffic (183 MB per round).
Accuracy alone does not earn trust [13]. Grad-CAM maps from both centralized and federated models focused on glandular structures, atypical nuclei, and tumor nests, and the low-confidence ACA case’s diffuse map visibly signaled uncertainty. The LLM layer adds a textual dimension grounded in the model’s actual outputs, and running MedGemma 1.5 locally extends the privacy guarantee of FL from training to reporting. Unlike most prior work (Table 1), our federated results were measured on a separate external dataset after training on three independently collected sources.
This study has limitations. First, near-perfect internal accuracy suggests that augmented near-duplicates may appear in both training and test splits under patch-level splitting, so internal results are upper bounds. Second, the federation was simulated. Third, FL does not eliminate privacy risk, because shared weights can leak information through gradient inversion or membership inference [44,45], and no differential privacy or secure aggregation was used. Fourth, Hospital 4 images were radiological, not histological. Fifth, we assessed Grad-CAM maps and LLM reports qualitatively, rather than having pathologists rate them. Finally, the task is patch-level three-class classification rather than slide-level diagnosis. Future work will add differential privacy [46] and secure aggregation, real multi-hospital deployment with patient-level splits, a pathologist reader study, and out-of-distribution detection.
5. Conclusions
We presented LCAS, a privacy-preserving and explainable framework for lung cancer histopathology that integrates federated learning, Grad-CAM, and a locally deployed medical LLM. Trained across three heterogeneous sources without exchanging images, the FedProx DenseNet121 model reached 96.97% accuracy on an independent external test set, close to the centralized benchmark, and remained robust to blur. The platform presents each decision through numerical, visual, and textual evidence entirely on-premises. In the spirit of Deep Medicine, the aim is to relieve pathologists of repetitive work, not to replace them.
Author Contributions
Conceptualization, J.-Y.H., Y.-Y.C. and H.-C.L.; methodology, S.-H.H.; software, Y.-Y.C and H.-C.L.; validation, H.-C.L. and C.-C.C.; formal analysis, Y.-Y.C.; investigation, Y.Y-.C.; resources, H.-C.L. and C.-C.C.; data curation, Y.-M.L.; writing—original draft preparation, Y.-Y.C., H.-C.L. and C.-C.C.; writing—review and editing, H.-C.L. and C.-C.C.; visualization, Y.-M.L.; supervision, H.-C.L. and C.-C.C.; project administration, H.-C.L. and C.-C.C. All authors have read and agreed to the published version of the manuscript.
Funding
This work was supported partially by the Chung Shan Medical University Hospital CSH-2023-C-026 and the National Science and Technology Council 114-2221-E-040 -009 -MY2.
Institutional Review Board Statement
The study was conducted in accordance with the Declaration of Helsinki and approved by the Institutional Review Board of Chung Shan Medical University Hospital (CSMUH No: CS1-25087) for the retrospective analysis of de-identified imaging data from Chung Shan Medical University. The remaining histopathological datasets utilized in this study (LC25000, HistoSet-5×14, CLID, and Roboflow) are publicly available, fully de-identified benchmarks exempt from further ethical review.
Informed Consent Statement
Patient consent was waived by the Institutional Review Board of Chung Shan Medical University Hospital due to the retrospective nature of the study and the use of anonymized, de-identified data. For the public datasets, informed consent was obtained in the primary studies or deemed not applicable by their respective providers.
Data Availability Statement
The datasets utilized in this study are publicly available. The DDSM is accessible at http://www.eng.usf.edu/cvprg/Mammography/Database.html. The Mendeley breast cancer dataset is available through the Mendeley Data repository.
Conflicts of Interest
The authors declare no conflicts of interest.
References
- World Health Organization. Lung Cancer. Available online: https://www.who.int/news-room/fact-sheets/detail/lung-cancer (accessed on 14 June 2026).
- Bray, F.; Laversanne, M.; Sung, H.; Ferlay, J.; Siegel, R.L.; Soerjomataram, I.; Jemal, A. Global Cancer Statistics 2022: GLOBOCAN Estimates of Incidence and Mortality Worldwide for 36 Cancers in 185 Countries. CA Cancer J. Clin. 2024, 74, 229–263. [Google Scholar] [CrossRef]
- Coudray, N.; Ocampo, P.S.; Sakellaropoulos, T.; Narula, N.; Snuderl, M.; Fenyö, D.; Moreira, A.L.; Razavian, N.; Tsirigos, A. Classification and Mutation Prediction from Non–Small Cell Lung Cancer Histopathology Images Using Deep Learning. Nat. Med. 2018, 24, 1559–1567. [Google Scholar] [CrossRef]
- Echle, A.; Rindtorff, N.T.; Brinker, T.J.; Luedde, T.; Pearson, A.T.; Kather, J.N. Deep Learning in Cancer Pathology: A New Generation of Clinical Biomarkers. Br. J. Cancer 2021, 124, 686–696. [Google Scholar] [CrossRef]
- Topol, E.J. Deep Medicine: How Artificial Intelligence Can Make Healthcare Human Again; Basic Books: New York, NY, USA, 2019. [Google Scholar]
- European Parliament and Council of the European Union. General Data Protection Regulation (GDPR), Regulation (EU) 2016/679. Available online: https://gdpr-info.eu/ (accessed on 5 May 2026).
- Ministry of Justice; Taiwan. Personal Data Protection Act. Laws & Regulations Database of the Republic of China (Taiwan). Available online: https://law.moj.gov.tw/LawClass/LawAll.aspx?PCode=I0050021 (accessed on 5 May 2026).
- Rieke, N.; Hancox, J.; Li, W.; Milletarì, F.; Roth, H.R.; Albarqouni, S.; Bakas, S.; Galtier, M.N.; Landman, B.A.; Maier-Hein, K.; et al. The Future of Digital Health with Federated Learning. npj Digit. Med. 2020, 3, 119. [Google Scholar] [CrossRef]
- Kaissis, G.A.; Makowski, M.R.; Rückert, D.; Braren, R.F. Secure, Privacy-Preserving and Federated Machine Learning in Medical Imaging. Nat. Mach. Intell. 2020, 2, 305–311. [Google Scholar] [CrossRef]
- McMahan, B.; Moore, E.; Ramage, D.; Hampson, S.; y Arcas, B.A. Communication-Efficient Learning of Deep Networks from Decentralized Data. In Proceedings of the 20th International Conference on Artificial Intelligence and Statistics (AISTATS), Fort Lauderdale, FL, USA, 20–22 April 2017; pp. 1273–1282. [Google Scholar]
- Zhao, Y.; Li, M.; Lai, L.; Suda, N.; Civin, D.; Chandra, V. Federated Learning with Non-IID Data. arXiv 2018, arXiv:1806.00582. [Google Scholar]
- Li, T.; Sahu, A.K.; Zaheer, M.; Sanjabi, M.; Talwalkar, A.; Smith, V. Federated Optimization in Heterogeneous Networks. Proc. Mach. Learn. Syst. 2020, 2, 429–450. [Google Scholar]
- Rudin, C. Stop Explaining Black Box Machine Learning Models for High Stakes Decisions and Use Interpretable Models Instead. Nat. Mach. Intell. 2019, 1, 206–215. [Google Scholar] [CrossRef]
- Selvaraju, R.R.; Cogswell, M.; Das, A.; Vedantam, R.; Parikh, D.; Batra, D. Grad-CAM: Visual Explanations from Deep Networks via Gradient-Based Localization. Int. J. Comput. Vis. 2020, 128, 336–359. [Google Scholar] [CrossRef]
- An, J.; Joe, I. Attention Map-Guided Visual Explanations for Deep Neural Networks. Appl. Sci. 2022, 12, 3846. [Google Scholar] [CrossRef]
- Sellergren, A.; Gao, C.; Mahvar, F.; Kohlberger, T.; Jamil, F.; Traverse, M.; Tono, A.; Sadjad, B.; Yang, L.; Lau, C.; et al. MedGemma 1.5 Technical Report. arXiv 2026, arXiv:2604.05081. [Google Scholar]
- Huang, G.; Liu, Z.; van der Maaten, L.; Weinberger, K.Q. Densely Connected Convolutional Networks. In Proceedings of the IEEE Conference on Computer Vision and Pattern Recognition (CVPR), Honolulu, HI, USA, 21–26 July 2017; pp. 4700–4708. [Google Scholar]
- Borkowski, A.A.; Bui, M.M.; Thomas, L.B.; Wilson, C.P.; DeLand, L.A.; Mastorides, S.M. Lung and Colon Cancer Histopathological Image Dataset (LC25000). arXiv 2019, arXiv:1912.12142. [Google Scholar]
- Garg, S.; Garg, S. Prediction of Lung and Colon Cancer through Analysis of Histopathological Images by Utilizing Pre-Trained CNN Models with Visualization of Class Activation and Saliency Maps. In Proceedings of the 2020 3rd International Conference on Algorithms, Computing and Artificial Intelligence (ACAI 2020), Sanya, China, 24–26 December 2020. [Google Scholar] [CrossRef]
- Moin, M.B.; Faria, F.T.J.; Saha, S.; Rafa, B.K.; Alam, M.S. Exploring Explainable AI Techniques for Improved Interpretability in Lung and Colon Cancer Classification. arXiv 2024, arXiv:2405.04610. [Google Scholar]
- Tummala, S.; Kadry, S.; Nadeem, A.; Rauf, H.T.; Gul, N. An Explainable Classification Method Based on Complex Scaling in Histopathology Images for Lung and Colon Cancer. Diagnostics 2023, 13, 1594. [Google Scholar] [CrossRef]
- Anjum, S.; Ahmed, I.; Asif, M.; Aljuaid, H.; Alturise, F.; Ghadi, Y.Y.; Elhabob, R. Lung Cancer Classification in Histopathology Images Using Multiresolution Efficient Nets. Comput. Intell. Neurosci. 2023, 2023, 7282944. [Google Scholar] [CrossRef]
- Hasan, H.; Salman, S.; Sleem, L.; Mouawad, R.; Chehab, A. Comprehensive Benchmarking of Deep Learning Architectures for Lung Cancer Histopathology. arXiv 2026, arXiv:2608.15915. [Google Scholar]
- Singh, O.; Kashyap, K.L.; Singh, K. Lung and Colon Cancer Classification of Histopathology Images Using Convolutional Neural Network. SN Comput. Sci. 2024, 5. [Google Scholar] [CrossRef]
- Shahadat, N.; Lama, R.; Nguyen, A. Lung and Colon Cancer Detection Using a Deep AI Model. Cancers 2024, 16, 3879. [Google Scholar] [CrossRef]
- Adnan, M.; Kalra, S.; Cresswell, J.C.; Taylor, G.W.; Tizhoosh, H.R. Federated Learning and Differential Privacy for Medical Image Analysis. Sci. Rep. 2022, 12, 1953. [Google Scholar] [CrossRef]
- Lu, M.Y.; Chen, R.J.; Kong, D.; Lipkova, J.; Singh, R.; Williamson, D.F.K.; Chen, T.Y.; Mahmood, F. Federated Learning for Computational Pathology on Gigapixel Whole Slide Images. Med. Image Anal. 2022, 76, 102298. [Google Scholar] [CrossRef]
- Hossain, M.M.; Islam, M.R.; Ahamed, M.F.; Ahsan, M.; Haider, J. A Collaborative Federated Learning Framework for Lung and Colon Cancer Classifications. Technologies 2024, 12, 151. [Google Scholar] [CrossRef]
- Behuria, S.; Swain, S.; Bandyopadhyay, A.; Turjya, S.M.; Gourisaria, M.K. Federated Learning Approach in Healthcare Ecosystems for Efficient Lung Cancer Classification: Insights from Model Generic Training to Fine-Tuning and Transfer Learning. Procedia Comput. Sci. 2025, 259, 279–290. [Google Scholar] [CrossRef]
- Daggula, S.; Kondi, S.; Advaith, S.; Kilaru, A. Lung Cancer Prediction Using Federated Learning. Int. J. Sci. Dev. Res. 2025, 10, 755–762. [Google Scholar]
- Ajowho, A.C. Data Driven AI: Federated Explainable AI for Privacy-Preserving Lung and Colon Cancer Medical Image Diagnosis. In Proceedings of the Women in Machine Learning Workshop @ NeurIPS; Available online: https://openreview.net/forum?id=QFt5RgAb58 (accessed on 15 June 2026).
- Touhami, M.; Fauzi, M.F.A.; Rehman, Z.U.; Mansor, S. Federated Learning for Histopathology Image Classification: A Systematic Review. Diagnostics 2026, 16, 137. [Google Scholar] [CrossRef]
- Karimireddy, S.P.; Kale, S.; Mohri, M.; Reddi, S.; Stich, S.; Suresh, A.T. SCAFFOLD: Stochastic Controlled Averaging for Federated Learning. In Proceedings of the 37th International Conference on Machine Learning (ICML), Virtual Event, 13–18 July 2020; pp. 5132–5143. [Google Scholar]
- Rafi, A.H.; Bhowmik, P. HistoSet-5×14: A Collection of Balanced Multi-Organ Histopathology Datasets. Mendeley Data 2025, V1. [Google Scholar] [CrossRef]
- Comprehensive Lung Cancer Imaging Dataset (CLID). Kaggle. Available online: https://www.kaggle.com/datasets/ice778/comprehensive-lung-cancer-imaging-dataset-clid (accessed on 8 May 2026).
- Lung Cancer Dataset, Version 1 (Exported 16 November 2025). Roboflow Universe. Available online: https://universe.roboflow.com (accessed on 3 May 2026).
- Macenko, M.; Niethammer, M.; Marron, J.S.; Borland, D.; Woosley, J.T.; Guan, X.; Schmitt, C.; Thomas, N.E. A Method for Normalizing Histology Slides for Quantitative Analysis. In Proceedings of the 2009 IEEE International Symposium on Biomedical Imaging: From Nano to Macro; Boston, MA, USA, 28 June–1 July 2009; pp. 1107–1110. [Google Scholar]
- Howard, A.; Sandler, M.; Chu, G.; Chen, L.-C.; Chen, B.; Tan, M.; Wang, W.; Zhu, Y.; Pang, R.; Vasudevan, V.; et al. Searching for MobileNetV3. In Proceedings of the IEEE/CVF International Conference on Computer Vision (ICCV), Seoul, Republic of Korea, 27 October–2 November 2019; pp. 1314–1324. [Google Scholar]
- Tan, M.; Le, Q. EfficientNet: Rethinking Model Scaling for Convolutional Neural Networks. In Proceedings of the 36th International Conference on Machine Learning (ICML), Long Beach, CA, USA, 9–15 June 2019; pp. 6105–6114. [Google Scholar]
- Deng, J.; Dong, W.; Socher, R.; Li, L.-J.; Li, K.; Fei-Fei, L. ImageNet: A Large-Scale Hierarchical Image Database. In Proceedings of the IEEE Conference on Computer Vision and Pattern Recognition (CVPR), Miami, FL, USA, 20–25 June 2009; pp. 248–255. [Google Scholar]
- Kingma, D.P.; Ba, J. Adam: A Method for Stochastic Optimization. arXiv 2014, arXiv:1412.6980. [Google Scholar]
- van der Maaten, L.; Hinton, G. Visualizing Data Using t-SNE. J. Mach. Learn. Res. 2008, 9, 2579–2605. [Google Scholar]
- Murtuza, S. Forensic Implications of Localized AI: Artifact Analysis of Ollama, LM Studio, and llama. arXiv 2026, arXiv:2603.23996. [Google Scholar]
- Zhu, L.; Liu, Z.; Han, S. Deep Leakage from Gradients. Advances in Neural Information Processing Systems 32 (NeurIPS 2019), Vancouver, BC, Canada, 8–14 December 2019. [Google Scholar]
- Shokri, R.; Stronati, M.; Song, C.; Shmatikov, V. Membership Inference Attacks against Machine Learning Models. In Proceedings of the 2017 IEEE Symposium on Security and Privacy (SP), San Jose, CA, USA, 22–26 May 2017; pp. 3–18. [Google Scholar]
- Abadi, M.; Chu, A.; Goodfellow, I.; McMahan, H.B.; Mironov, I.; Talwar, K.; Zhang, L. Deep Learning with Differential Privacy. In Proceedings of the 2016 ACM SIGSAC Conference on Computer and Communications Security (CCS), Vienna, Austria, 24–28 October 2016; pp. 308–318. [Google Scholar]
Figure 1.
System architecture diagram of the Lung Cancer Analysis System (LCAS). Each layer (left) is detailed by its processing steps (right); branching rows show the two training paths (centralized and federated) and the two explanation paths (visual Grad-CAM and textual MedGemma 1.5 report).
Figure 1.
System architecture diagram of the Lung Cancer Analysis System (LCAS). Each layer (left) is detailed by its processing steps (right); branching rows show the two training paths (centralized and federated) and the two explanation paths (visual Grad-CAM and textual MedGemma 1.5 report).

Figure 2.
AI architecture diagram of LCAS. Each stage (left) is detailed by its operations (right): DenseNet121 feature extraction (dense connectivity, Equation (1)) with a new classifier head, federated training with the FedProx objective (Equation (3)), Grad-CAM explanation (Equations (5) and (6)), and local report generation with MedGemma 1.5; the outputs are reviewed by the pathologist.
Figure 2.
AI architecture diagram of LCAS. Each stage (left) is detailed by its operations (right): DenseNet121 feature extraction (dense connectivity, Equation (1)) with a new classifier head, federated training with the FedProx objective (Equation (3)), Grad-CAM explanation (Equations (5) and (6)), and local report generation with MedGemma 1.5; the outputs are reviewed by the pathologist.

Figure 3.
Centralized models: (a) DenseNet121 on the external blind test set (958/958 correct); (b) MobileNetV3-Small on the external blind test set (957/958); (c) confusion matrix under Gaussian blur (σ = 0.1–2.0) on the internal test set (accuracy 0.9978).
Figure 3.
Centralized models: (a) DenseNet121 on the external blind test set (958/958 correct); (b) MobileNetV3-Small on the external blind test set (957/958); (c) confusion matrix under Gaussian blur (σ = 0.1–2.0) on the internal test set (accuracy 0.9978).

Figure 4.
Non-IID FedProx training of the three backbones: (a) average training accuracy per round; (b) average training loss per round.
Figure 4.
Non-IID FedProx training of the three backbones: (a) average training accuracy per round; (b) average training loss per round.

Figure 5.
Confusion matrices of the federated (FedProx, non-IID) models on the external blind test set: (a) DenseNet121; (b) EfficientNet-B3; (c) MobileNetV3-Small.
Figure 5.
Confusion matrices of the federated (FedProx, non-IID) models on the external blind test set: (a) DenseNet121; (b) EfficientNet-B3; (c) MobileNetV3-Small.

Figure 6.
t-SNE of the global model’s deep features: (a) colored by tissue class; (b) colored by hospital of origin.
Figure 6.
t-SNE of the global model’s deep features: (a) colored by tissue class; (b) colored by hospital of origin.
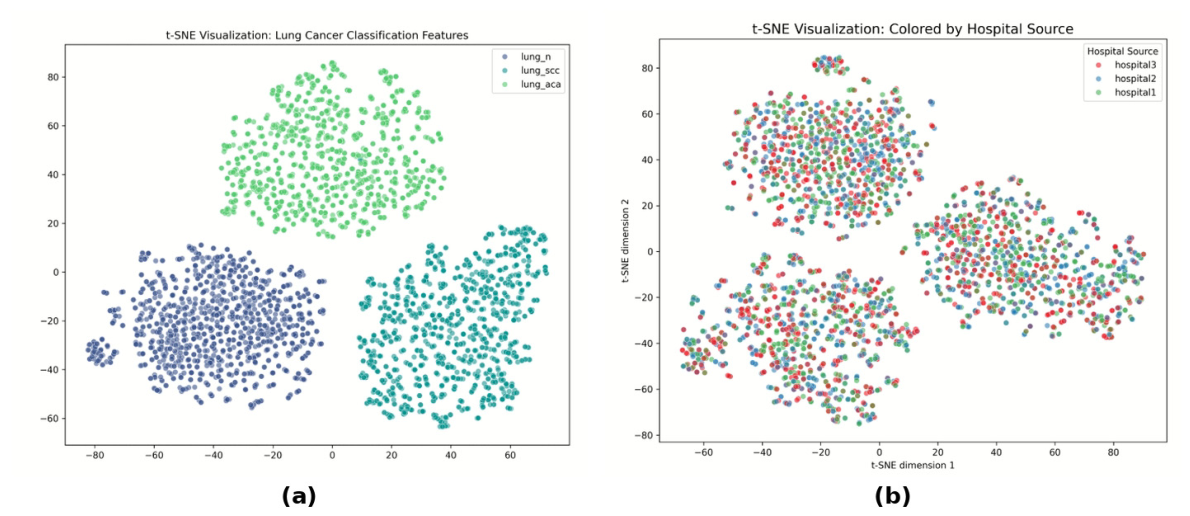
Figure 7.
Grad-CAM explanations of the centralized DenseNet121 (original image, Grad-CAM map, heatmap, and overlay): (a) adenocarcinoma; (b) squamous cell carcinoma; (c) benign lung tissue.
Figure 7.
Grad-CAM explanations of the centralized DenseNet121 (original image, Grad-CAM map, heatmap, and overlay): (a) adenocarcinoma; (b) squamous cell carcinoma; (c) benign lung tissue.

Figure 8.
Grad-CAM overview of the federated global model; each panel shows the true class and prediction confidence (rows: ACA, benign, SCC). The ACA example with a confidence of 0.918 shows a more diffuse activation boundary.
Figure 8.
Grad-CAM overview of the federated global model; each panel shows the true class and prediction confidence (rows: ACA, benign, SCC). The ACA example with a confidence of 0.918 shows a more diffuse activation boundary.

Figure 9.
LCAS web platform (Traditional Chinese interface): (a) clinical-assistance view with the original image, federated and local-baseline Grad-CAM heatmaps, class probabilities, and the MedGemma 1.5 report (FINDINGS, IMPRESSION, RECOMMENDATION); (b) federated-learning dashboard with training-loss curves and the μ ablation.
Figure 9.
LCAS web platform (Traditional Chinese interface): (a) clinical-assistance view with the original image, federated and local-baseline Grad-CAM heatmaps, class probabilities, and the MedGemma 1.5 report (FINDINGS, IMPRESSION, RECOMMENDATION); (b) federated-learning dashboard with training-loss curves and the μ ablation.
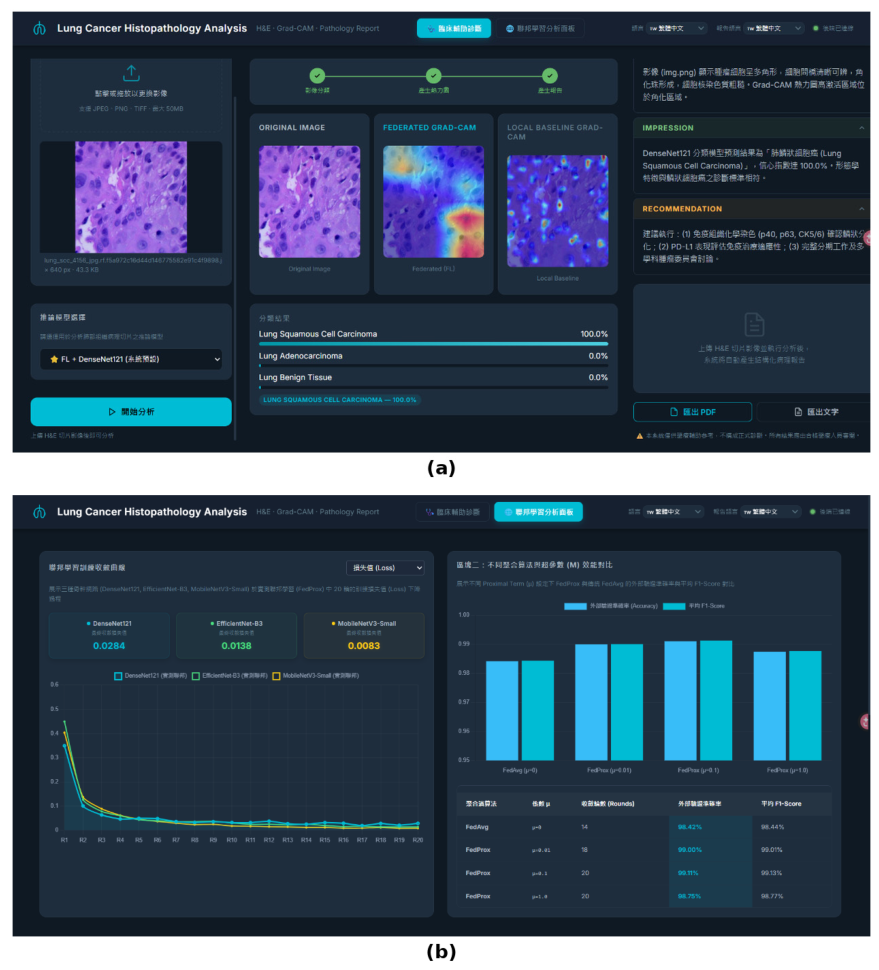

Table 1.
Comparison with the studies closest to this work in dataset and core method.
| Study | Dataset | Core method | FL | XAI | LLM report | Ext. test | Accuracy |
|---|---|---|---|---|---|---|---|
| Garg and Garg [19] | LC25000 | 8 CNNs (DenseNet169, MobileNet, …) | — | Grad-CAM, SmoothGrad | — | — | 96–100% (int.) |
| Moin et al. [20] | Lung/colon histology | DenseNet121/169/201 and others | — | 7 CAM methods | — | — | 97–99% (int.) |
| Tummala et al. [21] | LC25000 (5 classes) | EfficientNetV2 | — | Grad-CAM | — | — | 99.97% (int.) |
| Anjum et al. [22] | LC25000 (lung) | Multiresolution EfficientNets | — | — | — | — | 97% (int.) |
| Hasan et al. [23] | LC25000 + LungHist700 | DenseNet, MobileNetV3, ViT, YOLO11 | — | — | — | — | 98.38% (CV) |
| Adnan et al. [26] | TCGA LUAD/LUSC | DenseNet features + MIL | FedAvg + DP | — | — | ✓ | 82.4% (int.) |
| Hossain et al. [28] | LC25000 | Collaborative FL | FedAvg | — | — | — | 99.87% (int.) |
| Ajowho [31] | LC25000 | FL + XAI | ✓ | Heatmaps | — | — | n.r. |
| This study | 3 sources (LC25000, HistoSet, CLID) | DenseNet121, EfficientNet-B3, MobileNetV3-S | FedProx, non-IID | Grad-CAM | ✓ (local) | ✓ | 99.50% (int.); 96.97% (ext.) |
int., internal test split drawn from the training data; CV, cross-validation; ext., independent external dataset; DP, differential privacy; n.r., not reported. Internal accuracies on LC25000-derived splits are optimistic because augmented near-duplicates can fall into both splits, so they are not directly comparable with external-test accuracy.
Table 2.
Datasets assigned to the simulated hospital nodes.
| Node | Dataset | Original resolution | Input resolution | Images per class | Images per node |
|---|---|---|---|---|---|
| Hospital 1 | LC25000 | 768 × 768 | 224 × 224 | 2000 ¹ | 6000 |
| Hospital 2 | HistoSet-5×14 | 768 × 768 | 224 × 224 | 2000 ¹ | 6000 |
| Hospital 3 | CLID | 768 × 768 | 224 × 224 | 2000 ¹ | 6000 |
| External test | Roboflow Lung Cancer v1 | 640 × 640 | 224 × 224 | 325 / 304 / 329 | 958 |
| Hospital 4 (stress test) | CSMU DICOM (PET/CT, CT, X-ray) | various | 224 × 224 | — | 49,824 files, 174 patients |
¹ Randomly down-sampled from 5000–6000 images per class. Classes: ACA, SCC, and benign lung tissue (N).
Table 3.
Model size and communication cost (K = 3 clients, T = 20 rounds).
| Backbone | Parameters | Checkpoint | Traffic per round ¹ | Total traffic |
|---|---|---|---|---|
| DenseNet121 | 7.48 M | 30.5 MB | 183 MB | 3.66 GB |
| EfficientNet-B3 | 11.48 M | 46.5 MB | 279 MB | 5.58 GB |
| MobileNetV3-Small | 2.04 M | 8.3 MB | 50 MB | 1.00 GB |
¹ Broadcast plus upload, 2K × checkpoint size (Equation (4)); sizes of the saved FedProx models including batch-normalization buffers.
Table 4.
Performance under different training scenarios (mean ± SD, %).
| Scenario | DenseNet121 Acc | DenseNet121 F1 | MobileNetV3-S Acc | MobileNetV3-S F1 | EfficientNet-B3 Acc | EfficientNet-B3 F1 |
|---|---|---|---|---|---|---|
| Local only—Hospital 1 | 98.50 ± 0.55 | 98.50 ± 0.55 | 95.12 ± 2.76 | 95.00 ± 2.88 | 99.38 ± 0.38 | 99.38 ± 0.38 |
| Local only—Hospital 2 | 98.95 ± 0.54 | 98.94 ± 0.56 | 96.22 ± 1.72 | 96.16 ± 1.77 | 99.45 ± 0.34 | 99.45 ± 0.34 |
| Local only—Hospital 3 | 99.20 ± 0.56 | 99.20 ± 0.56 | 96.22 ± 1.61 | 96.18 ± 1.67 | 99.33 ± 0.42 | 99.33 ± 0.42 |
| Hospital 4 (cross-modal) ¹ | 77.22 ± 22.82 | 66.92 ± 28.73 | 97.76 ± 1.84 | 97.75 ± 1.87 | 92.00 ± 6.91 | 91.85 ± 7.31 |
| Centralized | 99.50 ± 0.21 | 99.50 ± 0.21 | 97.20 ± 0.55 | 97.15 ± 0.58 | 99.64 ± 0.18 | 99.64 ± 0.18 |
| FedProx, non-IID (external test) | 96.97 ± 0.62 | 96.96 ± 0.60 | 91.23 ± 0.95 | 91.21 ± 0.93 | 97.49 ± 0.52 | 97.49 ± 0.50 |
¹ Exploratory cross-modal stress test (Section 3.4). Acc, accuracy. Federated precision/recall: DenseNet121 97.07/96.97, MobileNetV3-Small 91.31/91.23, EfficientNet-B3 97.64/97.49.
Table 5.
Ablation of the FedProx proximal coefficient μ (DenseNet121).
| Aggregation | μ | Rounds to convergence | Accuracy | Mean F1-score |
|---|---|---|---|---|
| FedAvg | 0 | 14 | 0.9842 | 0.9844 |
| FedProx | 0.01 | 18 | 0.9900 | 0.9901 |
| FedProx | 0.1 | 20 | 0.9911 | 0.9913 |
| FedProx | 1.0 | 20 | 0.9875 | 0.9877 |
Table 6.
Per-class external-test performance of the federated (FedProx, non-IID) models (n = 958).
| Class | n | DenseNet121 P / R / F1 | EfficientNet-B3 P / R / F1 | MobileNetV3-Small P / R / F1 |
|---|---|---|---|---|
| ACA | 325 | 0.993 / 0.926 / 0.959 | 0.993 / 0.932 / 0.962 | 0.858 / 0.908 / 0.882 |
| SCC | 304 | 0.937 / 0.984 / 0.960 | 0.933 / 1.000 / 0.965 | 0.901 / 0.842 / 0.871 |
| Benign (N) | 329 | 0.979 / 1.000 / 0.990 | 1.000 / 0.994 / 0.997 | 0.979 / 0.982 / 0.980 |
| Macro average | 958 | 0.970 / 0.970 / 0.969 | 0.975 / 0.975 / 0.975 | 0.913 / 0.911 / 0.911 |
| Accuracy | 958 | 0.970 | 0.975 | 0.912 |
P, precision; R, recall.
Disclaimer/Publisher’s Note: The statements, opinions and data contained in all publications are solely those of the individual author(s) and contributor(s) and not of MDPI and/or the editor(s). MDPI and/or the editor(s) disclaim responsibility for any injury to people or property resulting from any ideas, methods, instructions or products referred to in the content. |
© 2026 by the authors. Licensee MDPI, Basel, Switzerland. This article is an open access article distributed under the terms and conditions of the Creative Commons Attribution (CC BY) license.
Copyright: This open access article is published under a Creative Commons CC BY 4.0 license, which permit the free download, distribution, and reuse, provided that the author and preprint are cited in any reuse.