

Submitted:
30 October 2026
Posted:
02 November 2026
You are already at the latest version
Abstract
Reliable classification of AI-generated images requires more than high accuracy on unmodified test examples: media files may be compressed or downsampled before forensic analysis. This paper presents a controlled, paired robustness evaluation of a previously developed EfficientNet-B2 detector using RGB, fast Fourier transform (FFT), and artifact-oriented image features. The existing checkpoint, validation-selected classification threshold, and fixed set of 6,000 held-out images were reused without training or test-time threshold adjustment. Six transformed conditions were evaluated against original inputs: JPEG qualities 90, 70, and 50, and bicubic downsampling to maximum dimensions of 256, 128, and 64 pixels followed by reconstruction to the original dimensions. The baseline achieved 94.53% accuracy and 0.9857 area under the receiver operating characteristic curve (AUROC). JPEG variants produced accuracies between 94.38% and 94.63%, with paired 95% bootstrap intervals of accuracy change spanning zero. By contrast, downsampling to 256, 128, and 64 pixels yielded accuracies of 93.15%, 91.73%, and 74.40%, respectively. At 64 pixels, the accuracy difference was −20.13 percentage points (95% paired bootstrap interval approximately −21.12 to −19.12), and AUROC fell to 0.8967. The evidence indicates substantially greater sensitivity to severe spatial resolution loss than to the tested JPEG compression settings. Because the existing training procedure incorporates JPEG augmentation, these findings characterize this detector and evaluation protocol rather than establish universal robustness across detectors or unseen transformations.
Keywords:
AI‐generated image detection
; efficientnet‐B2
; image forensics
; JPEG compression
; resolution robustness
; paired bootstrap
; FFT
1. Introduction
Generative image systems can produce highly realistic synthetic photographs, motivating automated approaches that assist content authentication. Classification accuracy measured on a fixed test distribution is useful but incomplete: images circulated through messaging applications, websites, and archives are routinely resampled, encoded, and otherwise transformed. Such processing can alter frequency characteristics and local artifacts that a forensic classifier may exploit. A detector that performs well on original images may therefore fail when the same images are presented in a different technical form.
Benchmark development has increasingly reflected the challenge. GenImage introduced both cross-generator and degraded-image classification, explicitly including low-resolution and compressed conditions [2]. Community Forensics emphasized the variability introduced by diverse generators and image-processing pipelines [3]. AI-GenBench subsequently highlighted the importance of standardized and transparent evaluation protocols for contemporary detectors [4]. These works suggest that robustness should be treated as an experimental measurement rather than inferred from baseline test performance.
Our preceding study, “AI-Generated Image Detection Using EfficientNet-B2 with RGB, FFT and Artifact Features,” developed and assessed a five-channel image-forensics pipeline combining RGB appearance with frequency and artifact representations [1]. The present work does not claim a new network architecture or another independently trained model. It asks a distinct operational question: does this already trained detector retain its discrimination when input encoding quality and spatial resolution change? The precise paired evaluation is intended to separate compression-related effects from information loss due to downsampling.
The contributions of this follow-up are threefold: (i) a six-condition transformation benchmark using a single held-out image set and unchanged model; (ii) an analysis of accuracy, fake-class F1, macro-F1, and AUROC under those transformations; and (iii) paired, class-stratified bootstrap confidence intervals quantifying accuracy differences against the original-image condition. The study is intentionally scoped to post-training robustness, with no weight updates or optimization based on the test conditions.
2. Related Work
2.1. Detection of Synthetic Imagery
AI-generated image detection often leverages semantic and low-level image cues. CNN detectors can learn visual patterns that are predictive within a particular training distribution but less reliable across generator families or content conditions. GenImage [2] supplied a large-scale benchmark covering synthetic and real images and demonstrated the importance of testing generalization beyond a single generator. Community Forensics [3] expanded generator diversity to examine cross-model robustness, finding benefits from diverse training sources. These findings motivate carefully bounded claims when reporting detector performance.
2.2. Compression and Spatial Resolution as Forensic Shifts
JPEG encoding changes quantization of frequency-domain coefficients while downsampling discards spatial detail; their effects on a classifier need not be equivalent. Loss of high-frequency content may particularly influence a model that processes FFT-derived features alongside RGB inputs. However, end-to-end learned features and preprocessing can partly compensate for these changes, and the effect depends on the training augmentation, resampling implementation, source image size, and decision threshold. We therefore study both types of perturbation as controlled conditions without presupposing which must cause larger degradation.
2.3. Prior Evidence on Compression and Frequency Artifacts
Grommelt et al. [5] demonstrated that JPEG processing and image dimensions can introduce spurious cues into generated-image detection benchmarks. Their analysis motivates controlling both transformations within the same held-out image population rather than interpreting a high unmodified-image score as evidence of operational reliability. Corvi et al. [6] specifically examined diffusion-image detection in social-network-like conditions involving compression and resizing. The present study differs by conducting paired perturbation tests of a frozen RGB–FFT–artifact EfficientNet-B2 detector, rather than proposing another detector or reporting cross-generator generalization.
Work on frequency artifacts also informs the current design. Corvi et al. [7] analyzed Fourier-domain and spectral properties of GAN- and diffusion-generated imagery, providing a rationale for including frequency-sensitive forensic channels while also raising the possibility that downsampling removes discriminative detail. Ojha et al. [8] and Wang et al. [9] illustrate alternative approaches to cross-generator detection; DIRE [10] and AEROBLADE [11] explore reconstruction-based evidence. These studies address complementary aspects of generalization and detector construction, rather than providing a direct numerical benchmark for this paper’s specific checkpoint.
2.4. Relationship to the Companion Paper
The companion preprint [1] is the source of the detector architecture, training procedure, and held-out baseline. This manuscript reuses that detector and 6,000-image test set for an additional robustness evaluation. There is deliberate methodological overlap required to make the extension reproducible. The new contribution is not a repeated test of baseline accuracy but the paired transformation experiments and their uncertainty analysis. Readers should consult [1] for the primary model-development claims.
3. Materials and Methods
3.1. Model and Frozen Evaluation Assets
The model is an EfficientNet-B2-based five-channel forensic classifier with three RGB channels and two derived channels representing spectral and artifact information, following the notebook implementation associated with the earlier work [1]. The previously selected checkpoint is loaded and checked against the recorded split hash and model version. The model is set to evaluation mode, and its fake-class probability is compared with the decision threshold saved during validation. The validation-selected threshold is fixed across all experimental conditions. No gradient updates or robustness-specific retraining are performed.
The held-out evaluation set contains 6,000 images. A saved split manifest determines the image paths, binary reference labels, and ordering; the code asserts that the label sequence remains identical for every transformation. Class labels are real (0) and AI-generated/fake (1). The exact original generator composition, train–test provenance, and exclusion of near-duplicates should be described fully in [1]; those details are not re-estimated in the present experiment.
3.2. Image Transformations
Each source image is first oriented according to EXIF metadata and converted to RGB. The unmodified condition passes this converted image directly to the unchanged five-channel preprocessing. For JPEG conditions, the RGB image is re-encoded in memory at quality q ∈ {90, 70, 50} with chroma subsampling disabled (subsampling=0), then decoded to RGB. These settings make the experiment repeatable but are not representative of every default encoder used by social-media services.
For resizing, the longer image dimension is downsampled to a maximum of s ∈ {256, 128, 64} pixels, preserving aspect ratio using bicubic interpolation. The smaller image is then upsampled with bicubic interpolation to its original dimensions before standard forensic preprocessing. If a source image is already smaller than the requested maximum, no preliminary upscaling is performed. Thus “resize_64” denotes a downsample–upsample degradation, not direct 64×64 model input or a permanent image-size change. This detail matters when interpreting information loss.
3.3. Metrics and Paired Uncertainty
For each condition, accuracy is the fraction of correct binary predictions at the fixed threshold. Fake-class F1 summarizes precision–recall trade-offs for the positive (AI-generated) class; macro-F1 averages class F1 scores. AUROC measures discrimination across thresholds and is not dependent on the one saved operating threshold. Accuracy change is reported in percentage points (pp) relative to the original condition; changes in F1 and AUROC are expressed as absolute score differences.
To quantify uncertainty in paired accuracy differences, we construct 1,000 stratified bootstrap replicates. Within each class, test indices are sampled with replacement; the same replicate indices are used for the original and transformed predictions. For each replicate we subtract original-image accuracy from transformed-image accuracy and multiply by 100. The 2.5th and 97.5th percentiles provide the reported 95% bootstrap interval. The fixed random seed is 13. These intervals are descriptive repeated-sampling estimates, and no formal correction is applied for multiple comparisons.
3.4. Reproducibility and Analytical Constraints
The robustness notebook records the model-version string, checkpoint name, SHA-256 hash of the split manifest, saved validation threshold, transformation settings, bootstrap count, and seed in a protocol file. The evaluation also exports per-image paired predictions. This enables later examination of which examples change their classification under degradation. Since the model was trained with JPEG-related augmentation in the original pipeline, its stability under JPEG encoding is not evidence of zero-shot robustness to an entirely unseen perturbation.
4. Experimental Results
4.1. Main Performance Comparison
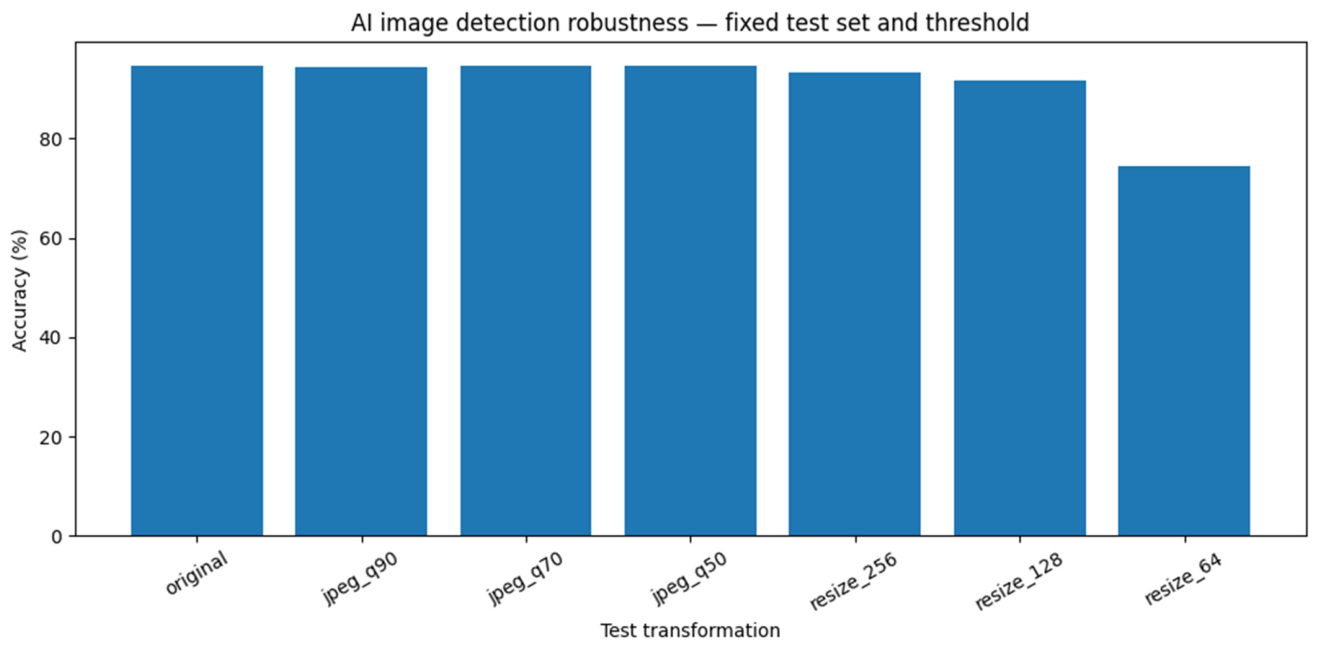
Table 1 reports the observed results over the same 6,000 images under each condition. The original-image accuracy was 94.53% and the AUROC was 0.9857. JPEG quality 90 reduced accuracy slightly to 94.38%; quality 70 and quality 50 produced numerically higher accuracies of 94.57% and 94.63%, respectively. These small fluctuations are not evidence that compression improves classification. The three resizing experiments showed progressively larger accuracy declines, reaching 74.40% at 64 pixels.
Figure 1.
Detection accuracy under original, JPEG-compressed, and downsample–upsample conditions (provided experimental figure).
Figure 1.
Detection accuracy under original, JPEG-compressed, and downsample–upsample conditions (provided experimental figure).
4.2. Confidence Intervals of Accuracy Change
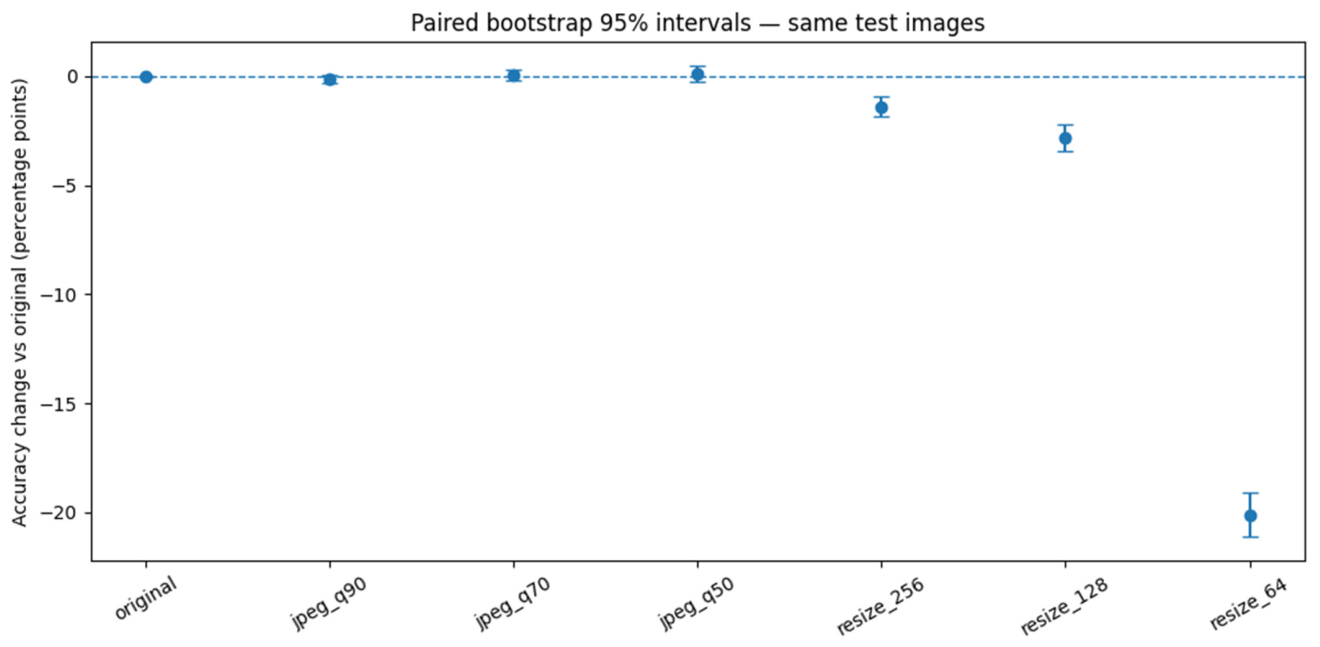
Paired confidence intervals give a clearer picture than the raw accuracy changes alone. For JPEG Q90, the interval spans −0.3167 to +0.0333 pp; the corresponding intervals for Q70 and Q50 also include zero. All resizing intervals lie below zero. The sharpest effect occurs for the 64-pixel condition, with a point estimate of −20.1333 pp and an interval from −21.1167 to −19.1167 pp. Hence the evidence of accuracy loss under extreme downsampling is strong within this paired test set.

Table 2.
Paired class-stratified bootstrap intervals computed using 1,000 resamples and the same sampled indices for original and transformed predictions.
Table 2.
Paired class-stratified bootstrap intervals computed using 1,000 resamples and the same sampled indices for original and transformed predictions.
| Condition | Accuracy Δ (pp) | 95% paired bootstrap interval (pp) |
| JPEG Q90 | −0.1500 | [−0.3167, +0.0333] |
| JPEG Q70 | +0.0333 | [−0.2167, +0.3000] |
| JPEG Q50 | +0.1000 | [−0.2500, +0.4837] |
| Resize 256 | −1.3833 | [−1.8671, −0.9000] |
| Resize 128 | −2.8000 | [−3.4167, −2.2163] |
| Resize 64 | −20.1333 | [−21.1167, −19.1167] |
Figure 2.
Accuracy change relative to original images, with 95% paired bootstrap intervals (provided experimental figure).
Figure 2.
Accuracy change relative to original images, with 95% paired bootstrap intervals (provided experimental figure).
4.3. Threshold-Dependent and Threshold-Independent Behavior
At 64 pixels, both threshold-dependent and threshold-independent performance decline. Accuracy decreases by 20.13 pp, the fake-class F1 falls from 0.9450 to 0.7880, and AUROC decreases by 0.0889. Notably, AUROC remains 0.8967 despite the substantial accuracy loss. This suggests that the ranking of fake versus real scores retains meaningful signal even when the original operating threshold becomes less effective. The existing outputs do not establish whether threshold recalibration would be sufficient to recover accuracy; that question requires separate validation data and should not be investigated by tuning on the held-out test set.
5. Discussion
5.1. Why JPEG and Resizing Behave Differently
Within the tested settings, JPEG re-encoding creates only minor score changes, whereas bicubic downsampling and reconstruction can remove considerable spatial information. A plausible explanation is that repeated resizing suppresses fine textures and frequency patterns that contribute to the five-channel forensic representation, while the tested JPEG settings leave enough discriminative information for the learned features to operate. This mechanism is a hypothesis rather than a directly proven causal attribution: the present experiment does not isolate the FFT channel, artifact channel, and RGB branch independently. A feature ablation would be needed to identify which channels drive the sensitivity.
The small apparent accuracy gains at JPEG Q70 and Q50 should not be interpreted as improvements. Their bootstrap intervals overlap zero, and the design evaluates only one checkpoint and one test split. Further, JPEG quantization and bicubic resizing are only two of the many transformations applied in real workflows; screenshots, re-cropping, blur, watermark overlays, generative editing, and repeated resaving might produce different behavior.
5.2. Consequences for Deployment
The results indicate a practical risk when detectors process low-resolution thumbnails. Under the 64-pixel degradation, roughly one quarter of labels are incorrect at the existing threshold despite strong baseline performance. This supports evaluating the input media’s history and spatial resolution as part of operational quality assurance. A deployed service might display a warning when a submitted image has been heavily reduced, but the current evidence does not justify a universal pixel cutoff. Any screening policy should be calibrated on a deployment-specific sample and consider false-positive and false-negative costs separately.
5.3. Scope, Threats to Validity, and Follow-Up Work
Internal validity is strengthened by paired inputs, a frozen checkpoint, an unchanged test split, a fixed threshold, deterministic transform definitions, and confidence intervals calculated from paired resampling. External validity is limited: one trained detector, one held-out sample, three JPEG quality factors with no chroma subsampling, and three bicubic resizing settings cannot represent all platforms or image generators. The transformations are imposed on RGB data before derived forensic channels are recomputed; results may differ if images are transformed at a different stage or encoded with other settings.
Additional analysis could report per-class confusion matrices, real-image specificity, fake-image sensitivity, calibration error, and examples of prediction flips, particularly at 64 pixels. It would also be useful to evaluate an unseen generator holdout, repeated JPEG recompression, interpolation variants, and combinations of compression with resizing. These experiments have not been performed in the reported table and should not be presented as completed findings. Near-duplicate checks across every dataset source and an independent external test set are also important for increasing confidence in generalization.
6. Conclusion
This follow-up paired study evaluated the post-processing robustness of an existing EfficientNet-B2 detector using RGB, FFT, and artifact features. With a fixed checkpoint, test set, and decision threshold, accuracy stayed close to the 94.53% baseline for JPEG quality 90, 70, and 50, whereas bicubic downsampling to 256, 128, and especially 64 pixels produced progressively greater degradation. The largest accuracy reduction was 20.13 percentage points at 64 pixels, and its paired bootstrap interval excluded zero by a wide margin. The main result is therefore a practical asymmetry: the tested JPEG encoding conditions preserved performance better than severe spatial downsampling. The contribution is a new robustness characterization of the previously developed detector, not an independently trained or more accurate model. Further class-specific and cross-generator evaluation is needed before claiming general real-world robustness.
Data and code availability
The study was generated from the author’s existing experiment notebook and its saved checkpoint/split; insert a stable repository link and ensure dataset licensing permits redistribution. Competing interests: [Author to confirm]. Funding: [Author to confirm]. Ethics: This evaluation used image datasets; the author should confirm applicable dataset and institutional requirements.
References
- Y. Abdelrahman, “AI-Generated Image Detection Using EfficientNet-B2 with RGB, FFT and Artifact Features,” Preprints.org, 2026. [CrossRef]
- M. Zhu et al., “GenImage: A Million-Scale Benchmark for Detecting AI-Generated Image,” Advances in Neural Information Processing Systems (NeurIPS), Datasets and Benchmarks Track, 2023. https://arxiv.org/abs/2306.08571.
- J. Park and A. Owens, “Community Forensics: Using Thousands of Generators to Train Fake Image Detectors,” Proceedings of the IEEE/CVF Conference on Computer Vision and Pattern Recognition (CVPR), 2025. https://openaccess.thecvf.com/content/CVPR2025/papers/Park_Community_Forensics_Using_Thousands_of_Generators_to_Train_Fake_Image_CVPR_2025_paper.pdf.
- L. Pellegrini et al., “AI-GenBench: A New Ongoing Benchmark for AI-Generated Image Detection,” arXiv:2504.20865, 2025. https://arxiv.org/abs/2504.20865.
- P. Grommelt, L. Weiss, F.-J. Pfreundt, and J. Keuper, “Fake or JPEG? Revealing Common Biases in Generated Image Detection Datasets,” ECCV Workshops, 2024, pp. 80–95. [CrossRef]
- R. Corvi, D. Cozzolino, G. Zingarini, G. Poggi, K. Nagano, and L. Verdoliva, “On the Detection of Synthetic Images Generated by Diffusion Models,” IEEE ICASSP, 2023. [CrossRef]
- R. Corvi, D. Cozzolino, G. Poggi, K. Nagano, and L. Verdoliva, “Intriguing Properties of Synthetic Images: From Generative Adversarial Networks to Diffusion Models,” CVPR Workshops, 2023, pp. 973–982. https://openaccess.thecvf.com/content/CVPR2023W/WMF/html/Corvi_Intriguing_Properties_of_Synthetic_Images_From_Generative_Adversarial_Networks_to_CVPRW_2023_paper.html.
- U. Ojha, Y. Li, and Y. J. Lee, “Towards Universal Fake Image Detectors That Generalize Across Generative Models,” CVPR, 2023, pp. 24480–24489. [CrossRef]
- S.-Y. Wang, O. Wang, R. Zhang, A. Owens, and A. A. Efros, “CNN-Generated Images Are Surprisingly Easy to Spot... for Now,” CVPR, 2020. https://openaccess.thecvf.com/content_CVPR_2020/html/Wang_CNN-Generated_Images_Are_Surprisingly_Easy_to_Spot..._for_Now_CVPR_2020_paper.html.
- Z. Wang et al., “DIRE for Diffusion-Generated Image Detection,” ICCV, 2023, pp. 22445–22455. https://openaccess.thecvf.com/content/ICCV2023/html/Wang_DIRE_for_Diffusion-Generated_Image_Detection_ICCV_2023_paper.html.
- J. Ricker, D. Lukovnikov, and A. Fischer, “AEROBLADE: Training-Free Detection of Latent Diffusion Images Using Autoencoder Reconstruction Error,” CVPR, 2024, pp. 9130–9140. [CrossRef]
Table 1.
Paired robustness evaluation. All seven conditions use the same 6,000 held-out examples and fixed validation-selected threshold.
Table 1.
Paired robustness evaluation. All seven conditions use the same 6,000 held-out examples and fixed validation-selected threshold.
| Condition | Accuracy (%) | F1 fake | Macro-F1 | AUROC | Δ accuracy (pp) |
| Original | 94.53 | 0.9450 | 0.9453 | 0.9857 | 0.00 |
| JPEG Q90 | 94.38 | 0.9433 | 0.9438 | 0.9850 | −0.15 |
| JPEG Q70 | 94.57 | 0.9449 | 0.9457 | 0.9862 | +0.03 |
| JPEG Q50 | 94.63 | 0.9451 | 0.9463 | 0.9873 | +0.10 |
| Resize 256 | 93.15 | 0.9330 | 0.9315 | 0.9823 | −1.38 |
| Resize 128 | 91.73 | 0.9140 | 0.9172 | 0.9758 | −2.80 |
| Resize 64 | 74.40 | 0.7880 | 0.7325 | 0.8967 | −20.13 |
Disclaimer/Publisher’s Note: The statements, opinions and data contained in all publications are solely those of the individual author(s) and contributor(s) and not of MDPI and/or the editor(s). MDPI and/or the editor(s) disclaim responsibility for any injury to people or property resulting from any ideas, methods, instructions or products referred to in the content. |
© 2026 by the authors. Licensee MDPI, Basel, Switzerland. This article is an open access article distributed under the terms and conditions of the Creative Commons Attribution (CC BY) license (http://creativecommons.org/licenses/by/4.0/).
Copyright: This open access article is published under a Creative Commons CC BY 4.0 license, which permit the free download, distribution, and reuse, provided that the author and preprint are cited in any reuse.