

Submitted:
30 October 2026
Posted:
02 November 2026
You are already at the latest version
Abstract
Stress granules (SGs) are cytosolic ribonucleoprotein condensates that control translation of stress-responsive mRNAs and are increasingly linked to cardiovascular inflammation. How their spatiotemporal behaviour relates to efferocytosis during myocardial infarction (MI) remains poorly defined. We analysed 42 core SG genes and 144 efferocytosis-related genes across public multi-omics datasets: a mouse MI single-nucleus RNA sequencing and Visium spatial transcriptomic time series (GSE214611), an independent spatial cohort (GSE265828), the FinnGen R11 MI genome-wide association study, GTEx v10 tissue eQTLs, the LINCS L1000 perturbation compendium, and SG-fraction and G3bp1-knockout RNA-seq data (GSE263848 and GSE264134). Zone-stratified analysis showed coordinated upregulation of SG and efferocytosis programs in the infarct zone at day 3 (72 h; 10 SG and 32 efferocytosis genes) and day 7 (168 h; 11 SG and 34 efferocytosis genes), with a significant zone-by-time interaction for 312 genes, including G3bp1 and 36 efferocytosis genes. Macrophages carried most of the efferocytosis program, which was acutely suppressed at 1 h and recovered between 4 h and day 3. Macrophages with a high SG program showed consistent SG-gene upregulation at both cell and animal levels. In an independent SG-fraction RNA-seq dataset, 61 of 144 efferocytosis mRNAs, including Lrp1, Mertk and Mfge8, were enriched in SG fractions, supporting SG-mediated sequestration of efferocytosis transcripts. SG (ATXN2) and efferocytosis (APOE, LIPA) loci carried genome-wide significant MI signals, and all 42 SG genes were eQTL genes in the coronary artery. HSP90 inhibitors were associated with elevated SG-related expression scores in L1000 screening. These findings define a cross-cohort transcriptomic map of SG-efferocytosis programs in MI and support the hypothesis that ischaemic stress, SG assembly and efferocytosis regulation are temporally coordinated.
Keywords:
stress granules
; efferocytosis
; myocardial infarction
; spatial transcriptomics
; single-nucleus RNA sequencing
; GWAS
Introduction
Efferocytosis, the engulfment of apoptotic cells by macrophages, is a gatekeeper of inflammation resolution. When it fails after myocardial infarction (MI), dead cardiomyocytes persist, infarct expansion proceeds, and the left ventricle remodels unfavourably [9,10,11]. Resident and monocyte-derived cardiac macrophages execute this process in a zone- and time-dependent manner after ischaemic injury [11,12]. The mechanisms that govern efferocytosis capacity during the acute and reparative phases of MI therefore carry direct translational relevance.
Stress granules (SGs) are dynamic ribonucleoprotein condensates that form by liquid-liquid phase separation when translation is stalled under stress; sequestered mRNAs are stored together with RNA-binding proteins [19]. The SG proteome is enriched in intrinsically disordered proteins and RNA-binding proteins containing prion-like and low-complexity domains [19]. SGs do more than buffer translation. They modulate inflammation, vascular injury and tissue remodelling [4,5]. Several lines of evidence now connect SGs to cardiovascular pathology. G3BP1, the central SG scaffold, mediates macrophage inflammation in myocardial ischaemia-reperfusion injury [8]. A macrophage-specific circular RNA, circHIPK2, interacts with G3BP1, promotes SG formation, and aggravates post-MI inflammation and fibrosis [7]. In a type 2 inflammation model, SG assembly impairs macrophage efferocytosis through QKI7-dependent sequestration of Lrp1 mRNA [6]. These studies place SG-dependent mRNA sequestration at the intersection of efferocytosis and cardiac remodelling. Yet the spatial and temporal behaviour of SG and efferocytosis programs across cardiac zones during MI has not been mapped.
Technological advances make such a map attainable. Transcriptomics-based interrogation of SG-related genes has proved informative in inflammatory disease [1]. Spatial transcriptomics and single-nucleus RNA sequencing (snRNA-seq) have resolved the cellular and zone-specific architecture of the infarcted heart, including the border zone and its mechanical stress response [2,3]. MI genome-wide association studies (GWAS), tissue eQTL resources and perturbation compendia add genetic and pharmacological dimensions to expression-based findings [16,17,18].
We asked whether SG and efferocytosis programs are spatiotemporally coordinated in MI and whether transcript-level evidence connects SG assembly to efferocytosis regulation. Using 42 core SG genes and 144 efferocytosis-related genes, we integrated a mouse MI snRNA-seq and Visium time series, an independent mouse spatial cohort, human genetic and eQTL data, L1000 perturbation profiles, and SG-fraction and G3bp1-knockout RNA-seq datasets. The analysis revealed zone-stratified upregulation of both programs in the infarct zone, a macrophage-centred efferocytosis dynamic, a consistently detectable SG-high macrophage state, and SG-fraction enrichment of efferocytosis mRNAs.
Results
Zone-Stratified Spatial transcriptomics Identifies Coordinated SG and Efferocytosis Programs in the Infarct Zone
Visium sections from the mouse MI time series (GSE214611; sham n = 2, 1 h n = 1, 4 h n = 1, day 3 (72 h) n = 3, day 7 (168 h) n = 3) were scored for SG and efferocytosis (ER) modules per spot and stratified by infarct zone (IZ), border zone (BZ) and remote zone (RZ). SG module scores rose in the IZ by day 3 and stayed elevated at day 7; ER module scores climbed progressively towards day 7 (Figure 1, Figure 2). Sample-level comparisons (sham n = 2 vs MI n = 3) showed directionally consistent increases of both modules in the IZ (SG day 3 Δ +0.14, day 7 Δ +0.13; ER day 3 Δ +0.19, day 7 Δ +0.23). No such elevation appeared in the BZ or RZ.
Zone-stratified DESeq2 (within-zone ~ group, sham as reference) served as the primary analysis. In the IZ it identified 10 SG genes (7 up, 3 down) and 32 ER genes (23 up, 9 down) as differentially expressed at day 3, and 11 SG genes (1 up, 10 down) and 34 ER genes (24 up, 10 down) at day 7 (Figure 3; Table 2). Core SG factors were directionally reprogrammed. Atxn2 (padj = 9.4e-11), Ybx1 (5.5e-5), Fxr1 (1.7e-6) and Eif4e declined, whereas Caprin1 and G3bp2 rose. A zone-by-time likelihood-ratio test (sham/day 3/day 7) returned 312 genes with significant interaction (padj < 0.05), among them 3 SG genes (G3bp1, padj = 5.7e-4) and 36 efferocytosis genes (C1qa, Tyrobp, C1qc, Irf8, Gas6, Mfge8, Trem2). The efferocytosis module thus carried most of the infarct-zone-specific temporal signal.
The SG module reached a plateau at day 3 and remained stable at day 7, while the ER module continued to rise. At the available temporal resolution (72 h/168 h), the SG peak did not occur later than the ER peak, though their precise order could not be resolved. A single human STEMI Visium section showed relative elevation of SG (+0.023) and ER (+0.046) module scores in the infarct area together with a decline in the cardiomyocyte module (-0.82), a pattern consistent with the mouse data (descriptive, no paired control).
Single-Nucleus Transcriptomics Reveals Macrophage-Dominated Efferocytosis Dynamics and an SG-High Macrophage State
Clustering of 18 mouse MI snRNA-seq samples (approximately 144,000 nuclei) with Seurat annotated nine cell types (Figure 4), including cardiomyocytes, fibroblasts, endothelial cells, macrophages and smooth muscle cells. Cell-type-by-time module scoring (Figure 5, Figure 6) placed the ER program mainly in macrophages. The macrophage ER score fell from 0.335 at day 0 to 0.029 at 1 h, recovered to 0.208 (4 h) and 0.207 (day 3), and declined to 0.007 at day 7. The pattern fits an acute suppression followed by recovery upregulation. The SG module rose broadly across cardiomyocytes, macrophages and fibroblasts between 4 h and day 3, then declined.
To assess SG heterogeneity within macrophages, we sub-clustered macrophages and stratified them by the median SG module score into SG-high and SG-low states. At the cell level, 32 of 41 tested SG genes were upregulated in SG-high macrophages (padj < 1e-86), including Eif4a1, Caprin1, G3bp1, Tial1, Ybx1, Fmr1, G3bp2, Eif2s1 and Dcp2 (Figure 7). Cell-level tests ignore animal-level heterogeneity, so we added a pseudobulk edgeR analysis with time point as covariate and animal as replicate (design ~ group + SG_group). There, 38 of 41 SG genes remained significant (FDR < 0.05; Lsm14b logFC = 3.83, Dcp2 = 1.64, Fmr1 = 1.32, G3bp1 = 0.94, Ybx1 = 0.81). SG program upregulation therefore was not an artefact of cell-proportion or time confounding. Independent stress markers (Atf4, Ddit3, Xbp1 and others) rose at the cell level, but their signals attenuated after animal-level adjustment for time point; this accompanying stress-responsive program is reported at the single-cell level only.
SG and Efferocytosis Loci Carry Genetic Burden for MI
Mapping genome-wide significant MI variants (p < 5e-8; FinnGen R11 MI_STRICT) to module genes placed the SG gene ATXN2 under six significant variants (lowest p = 1.63e-11, rs653178), all within the classic 12q24 SH2B3-ATXN2 linkage region (Figure 8). The efferocytosis genes APOE (rs7412, p = 2.7e-26), LIPA (15 variants), MFGE8, PLG and TGFB1 also reached genome-wide significance; each has been reported in coronary artery disease or MI before. In GTEx v10, all 42 SG genes were eQTL genes in the coronary artery and 40 in the left ventricle/atrium (Figure 9). G3BP2, EIF2AK4 and DCP2 were among the most significant (p < 1e-20), pointing to broad cis-regulatory control of SG core factors in cardiac tissue. These genetic results are supportive, not mechanistic. An eGene demonstrates genetic regulation of expression but does not by itself establish a role in MI or efferocytosis.
Drug Perturbation Screening Links SG-Related Expression Scores to Small-Molecule Compounds
L1000 perturbation profiles (GSE92742) were restricted to small-molecule compounds (pert_type = trt_cp). For each signature we computed an SG-related expression score as the module mean of SG-gene MODZ values. HSP90 inhibitors scored highest. Geldanamycin (n = 4 independent signatures; mean 0.787) and NVP-AUY922 (n = 2; 0.835) associated with elevated SG-related expression scores (Figure 10). DNA-damaging chemotherapeutics such as camptothecin (n = 4; -0.937) and gemcitabine (n = 3; -0.909) associated with reduced scores. L1000 profiles derive from cancer cell lines, not cardiac or macrophage environments, so these results are hypothesis-generating and are reported strictly as associations with SG-related expression scores.
An Independent Spatial Cohort Replicates MI-Associated SG/ER Module Elevation
To test reproducibility of the infarct-zone pattern, we analysed the independent mouse MI Visium cohort GSE265828 (control n = 1, day 3 n = 1, day 5 n = 2). Zone annotations were absent, so whole-section comparisons were used. MI samples showed higher SG module scores (control -0.19 vs MI -0.01 to +0.13) and higher ER module scores (control -0.24 vs MI -0.03 to +0.19). The proportion of spots with a high SG program rose from 0.1% in controls to 7.1%-16.2% in MI samples. The directional changes match the main cohort. Sample sizes (n = 1-2 per time point) confine this replication to a descriptive level.
SG components Sequester Efferocytosis mRNAs: Transcript-Level Evidence
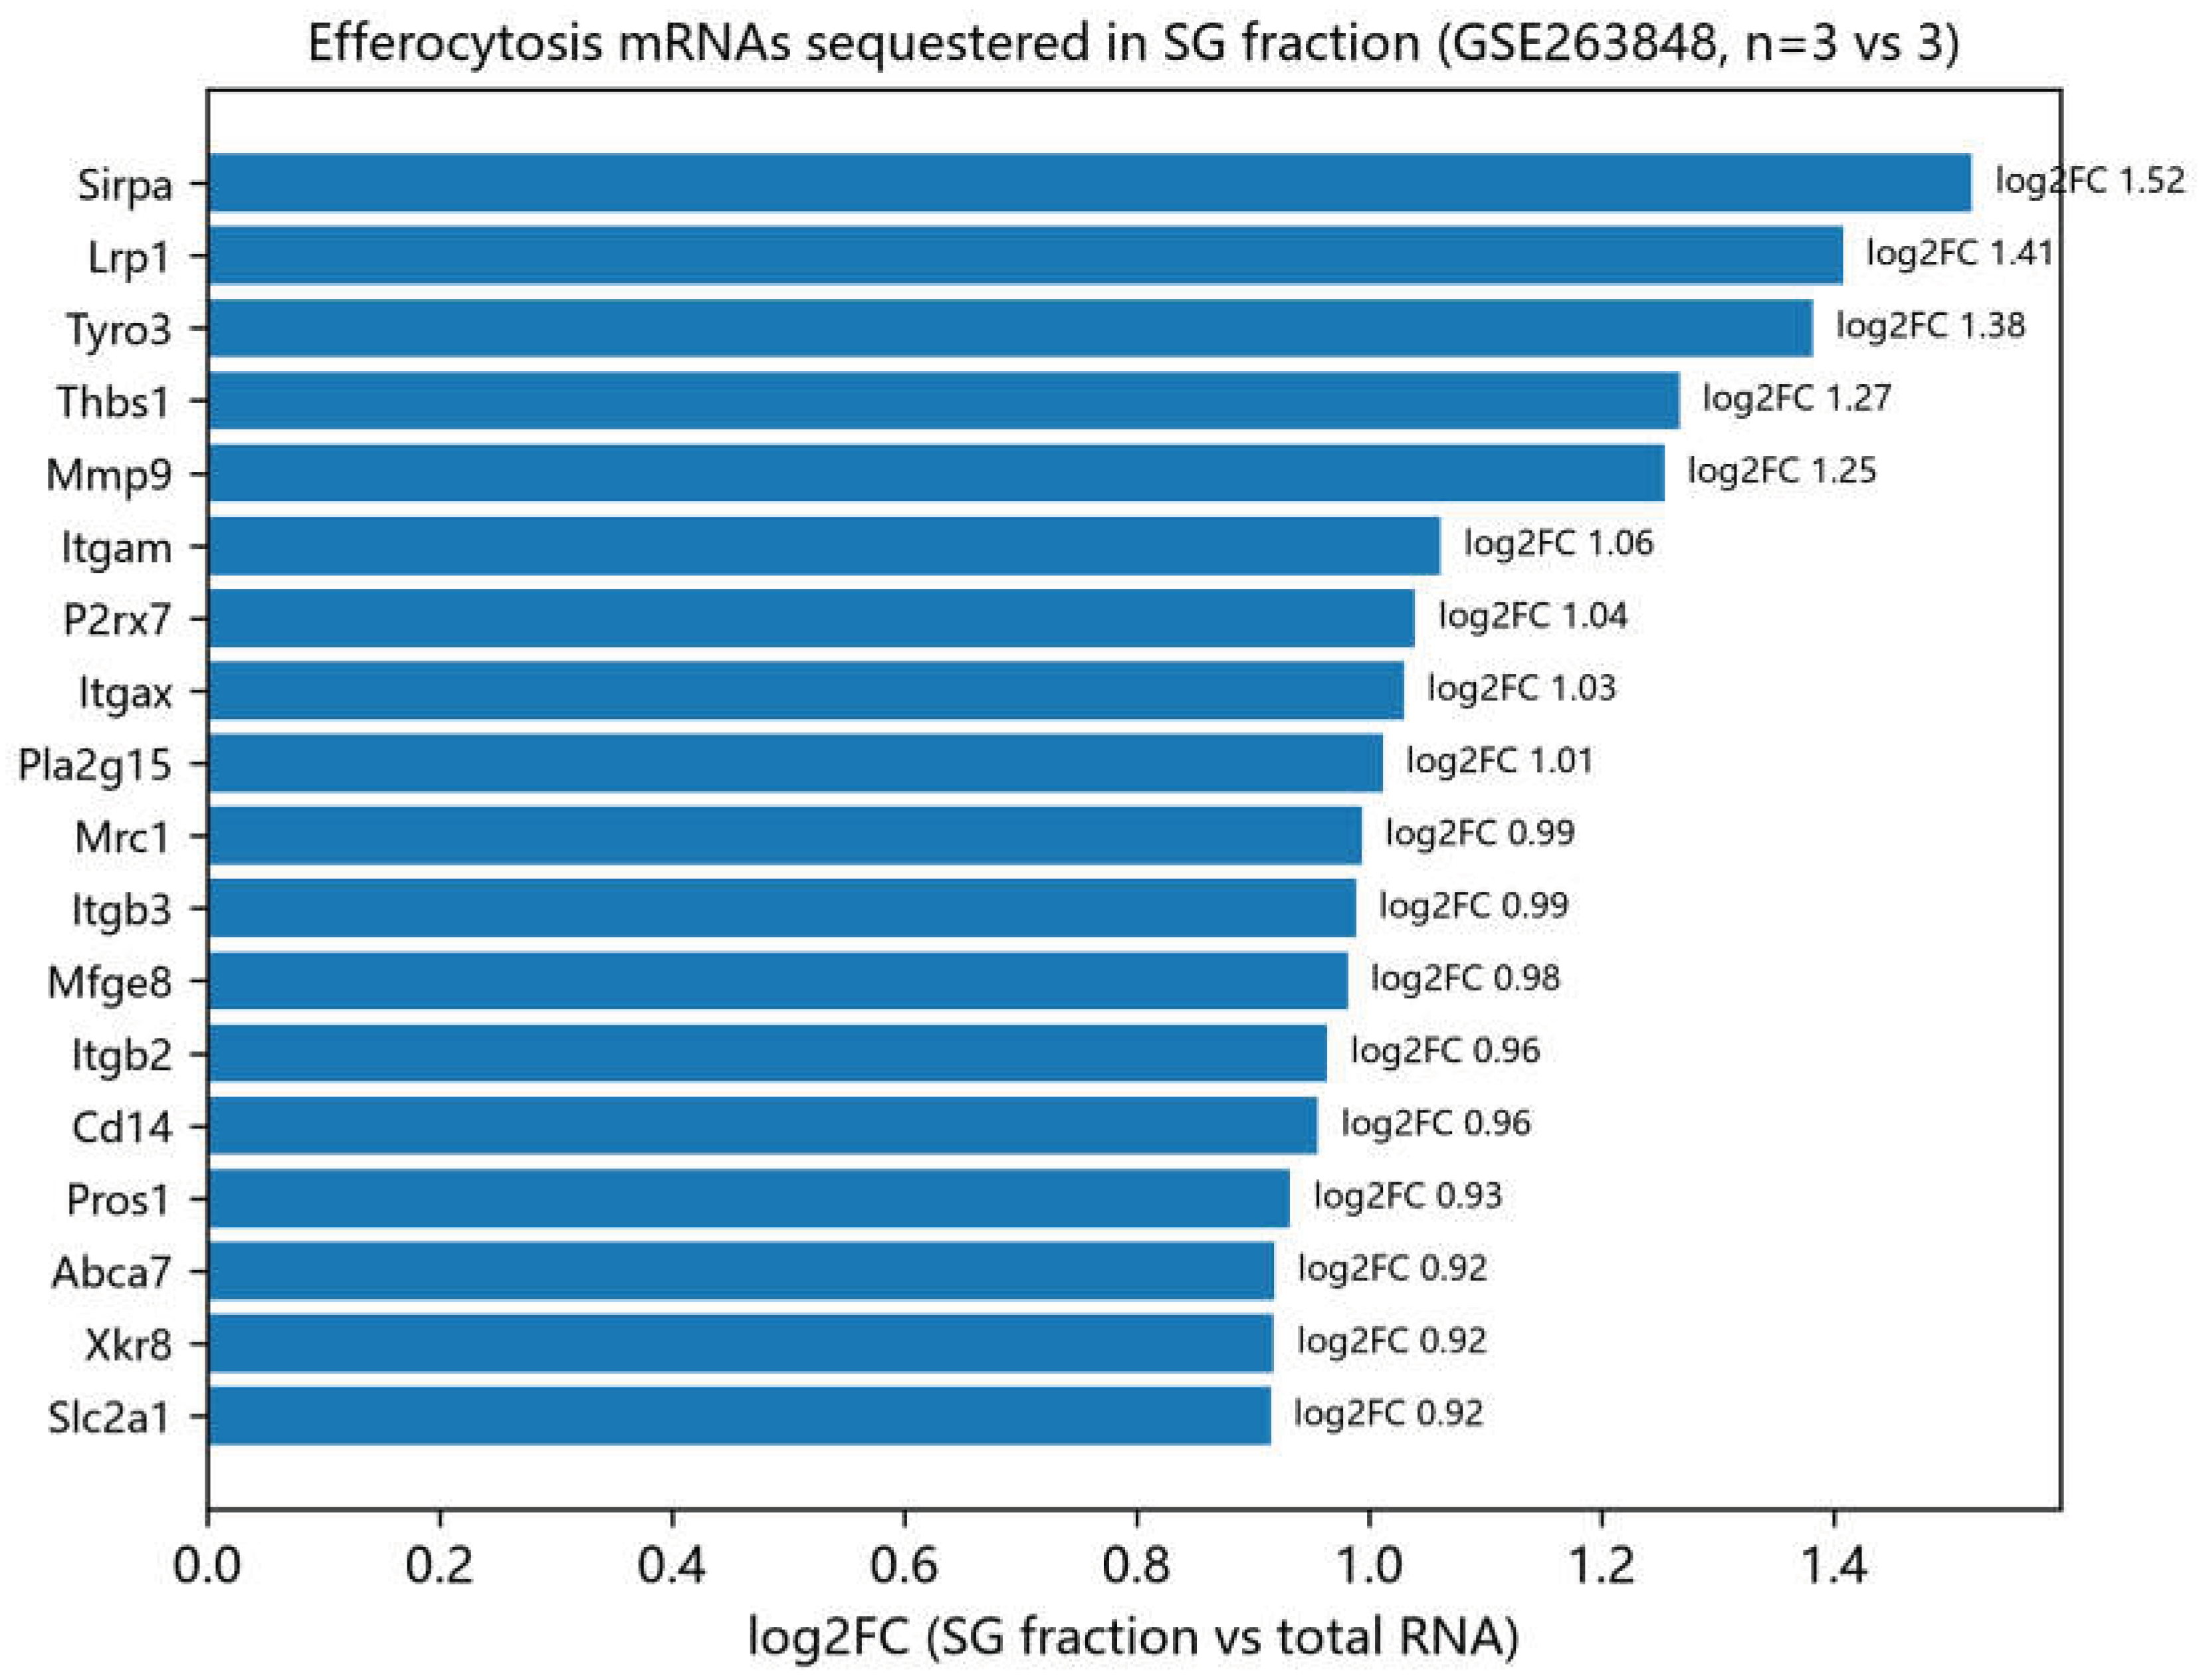
Two public SG-mechanism datasets supplied transcript-level evidence. In GSE263848, an SG-fraction RNA-seq experiment in macrophages (SG fraction vs total RNA; n = 3 vs 3; the source data of a published SG-efferocytosis study [6]), SG-fraction separation was effective. Seventeen of 41 SG core genes, including Ybx1, Pabpc1, Caprin1, Eif4g1, Eif2s1, Dcp2 and Lsm14a, were enriched in SG fractions (4,593 total DEGs). More importantly, 61 of 144 efferocytosis genes were enriched in SG fractions (Figure 11; Table 3). The top hits included Lrp1 (log2FC = 1.41, FDR = 1.3e-26), Sirpa (1.52), Tyro3 (1.38), Thbs1 (1.27), Mmp9 (1.25), Itgax (1.03), Mfge8 (0.98), Itgb2 (0.96), Pros1 (0.93), Xkr8 (0.92) and Mertk (0.89). Efferocytosis mRNAs, including key receptors and ligands, are thus sequestered into SG fractions under stress. In GSE264134 (G3bp1-knockout vs wild-type macrophages; n = 2 vs 2), the transcriptional effects of G3bp1 loss were modest: 180 total DEGs, no SG core gene, and only Gulp1 among efferocytosis genes reached significance (FDR = 0.039). The pattern agrees with a post-transcriptional mode of action for SG-mediated regulation, in which mRNA abundance changes little while translation declines [6].
Tables

Table 1.
| Datasets used in this study.
| Data type | Source | Samples / groups | Purpose |
|---|---|---|---|
| Mouse MI snRNA-seq | GSE214611 | 18 samples: day 0 (3), 1 h (2), 4 h (1), day 1 (6), day 3 (3), day 7 (3) | Cell-type annotation, module dynamics, macrophage state |
| Mouse MI Visium | GSE214611 | Sham (2), 1 h, 4 h, day 3 (72 h, 3), day 7 (168 h, 3); 10 sections x 3 zones | Zone-stratified spatial analysis |
| Human STEMI Visium | GSE214611 | 1 section (no paired control) | Descriptive infarct-zone trend validation |
| Independent mouse Visium | GSE265828 | Control (1), day 3 (1), day 5 (2); whole section | Independent spatial replication |
| SG-fraction RNA-seq | GSE263848 | SG fraction vs total RNA (3 vs 3) | SG sequestration of efferocytosis mRNAs |
| G3bp1 KO RNA-seq | GSE264134 | KO vs wild-type macrophages (2 vs 2) | Transcriptional effect of SG core factor loss |
| MI GWAS | FinnGen R11 I9_MI_STRICT | Genome-wide significant variants | Genetic burden of SG/ER loci |
| Tissue eQTL | GTEx v10 | Heart, coronary artery, aorta, whole blood | Tissue regulation of SG genes |
| Perturbation compendium | GSE92742 (LINCS L1000) | Level 5; small-molecule compounds (trt_cp) | Drug-perturbation screening |
Table 2.
| Zone-stratified differential expression and interaction summary (infarct zone, DESeq2, padj < 0.05).
Table 2.
| Zone-stratified differential expression and interaction summary (infarct zone, DESeq2, padj < 0.05).
| Analysis | SG genes | ER genes | Notes |
|---|---|---|---|
| Day 3 IZ stratified DESeq2 | 10 (7 up / 3 down) | 32 (23 up / 9 down) | Primary result (within-zone ~ group) |
| Day 7 IZ stratified DESeq2 | 11 (1 up / 10 down) | 34 (24 up / 10 down) | Primary result (within-zone ~ group) |
| Zone x time interaction (LRT) | 3 (G3bp1 padj = 5.7e-4) | 36 (C1qa, Tyrobp, C1qc, Gas6, Mfge8, Trem2, etc.) | 312 genes with significant interaction overall |
| Whole-model sensitivity (~zone+group) | 22 (day 3) / 17 (day 7) | 64 (day 3) / 63 (day 7) | Directionally consistent; sensitivity only |
Table 3.
| Efferocytosis genes enriched in SG fractions (GSE263848; SG-fraction RNA vs total RNA; edgeR, FDR < 0.05).
Table 3.
| Efferocytosis genes enriched in SG fractions (GSE263848; SG-fraction RNA vs total RNA; edgeR, FDR < 0.05).
| Gene | log2FC (SG fraction vs total) | Representative role |
|---|---|---|
| Sirpa | 1.52 | Efferocytosis receptor |
| Lrp1 | 1.41 | Phagocytic receptor (FDR = 1.3e-26) |
| Tyro3 | 1.38 | TAM receptor |
| Thbs1 | 1.27 | Apoptotic-cell bridging ligand |
| Mmp9 | 1.25 | Matrix remodelling |
| Itgax | 1.03 | Integrin |
| Mfge8 | 0.98 | Milk fat globule-EGF factor 8; engulfment ligand |
| Itgb2 | 0.96 | Integrin beta 2 |
| Pros1 | 0.93 | TAM ligand (protein S) |
| Xkr8 | 0.92 | Phosphatidylserine exposure |
| Mertk | 0.89 | TAM receptor |
Discussion
The analysis places SG and efferocytosis programs in a spatial and temporal context across MI. Three points stand out. Both programs are upregulated in the infarct zone with a significant zone-by-time interaction, and the efferocytosis module carries the larger interaction signal. Macrophages are the principal carriers of the efferocytosis program and show an acute suppression-recovery dynamic; within macrophages, an SG-high state survives animal-level adjustment. SG-fraction RNA-seq data show that efferocytosis mRNAs, including Lrp1, Mertk and Mfge8, are sequestered into SG fractions, while G3bp1 loss produces only modest transcriptional changes, consistent with post-transcriptional regulation [6].
These findings sit naturally alongside two recent mechanistic studies. SG assembly impairs macrophage efferocytosis through QKI7-mediated Lrp1 mRNA sequestration in a type 2 inflammation model [6], and the macrophage-specific circular RNA circHIPK2 promotes SG formation and post-MI inflammation and fibrosis through G3BP1 [7]. Our analysis maps SG and efferocytosis programs in the infarcted mouse heart at spatial and single-nucleus resolution and confirms SG-fraction enrichment of efferocytosis mRNAs in an unrelated dataset. It provides an independent, descriptive corroboration that ischaemic stress, SG assembly and efferocytosis regulation are temporally coordinated in MI.
An apparent paradox deserves comment. Efferocytosis-program transcripts rise in the infarct zone, yet efferocytosis may be functionally impaired. Transcript abundance and protein translation can diverge under stress. Lrp1 mRNA can remain unchanged while Lrp1 translation declines during SG-dependent efferocytosis impairment [6]. The concurrent elevation of SG components in the same zone fits a model in which stress-induced SG assembly sequesters efferocytosis mRNAs and shifts the balance from translation towards storage, even as the mRNA levels of these genes rise globally. Our SG-fraction data support the sequestration step. The functional consequences need protein-level and in vivo validation.
Genetic and pharmacological evidence is supportive and hypothesis-generating. The ATXN2 signal sits in the classic 12q24 SH2B3-ATXN2 linkage region and cannot be attributed to ATXN2 without fine-mapping and colocalization. APOE, LIPA and MFGE8 are established atherosclerosis/MI loci. The L1000 screen, run in cancer cell lines, suggests that HSP90 inhibitors associate with elevated SG-related expression scores; whether this holds in cardiac or macrophage contexts is unknown. None of these results constitutes efficacy evidence.
Several limitations temper the conclusions. The Visium control group contained only two sections, which limits sample-level tests to directional descriptions; the 1 h and 4 h time points each had one section, and the 4 h snRNA-seq time point one biological sample. snRNA-seq reads nuclear RNA and cannot show cytoplasmic SG assembly or protein-level events directly, and module scores can be influenced by macrophage abundance and subtype composition. The SG-high/low stratification is a median-based descriptive dichotomy, not a discrete subpopulation definition; animal-level pseudobulk adjustment supports its robustness, but independent human replication remains outstanding. Human MI snRNA-seq validation and spatial replication with zone annotations would strengthen the findings.
In summary, SG and efferocytosis programs are coordinately and infarct-zone-specifically upregulated after MI. Macrophages show an acute suppression-recovery efferocytosis dynamic and a robust SG-high state, and efferocytosis mRNAs are enriched in SG fractions in independent data. The results offer a hypothesis-generating framework for targeting SG-mediated post-transcriptional control of efferocytosis to improve inflammation resolution after myocardial infarction.
Methods
Datasets
All datasets came from public repositories and were analysed locally (Table 1). The mouse MI time series (GSE214611) comprised 18 snRNA-seq samples and 10 Visium sections (sham n = 2, 1 h n = 1, 4 h n = 1, day 3 n = 3, day 7 n = 3), together with one human STEMI Visium section [2]. GSE265828 served as an independent mouse MI Visium cohort. SG-mechanism datasets were GSE263848 (macrophage SG-fraction RNA-seq, n = 3 vs 3) and GSE264134 (G3bp1-knockout vs wild-type macrophage RNA-seq, n = 2 vs 2). Genetic and eQTL resources were FinnGen R11 (I9_MI_STRICT GWAS) [18] and GTEx v10 [17]. Perturbation profiles were taken from the LINCS L1000 compendium (GSE92742, level 5) [16].
Gene Sets
The SG gene set comprised 42 core SG genes curated from published SG proteomic studies [19], and the efferocytosis gene set comprised 144 genes compiled from Gene Ontology annotations and published efferocytosis reviews [9,10]. Mouse and human orthologue symbols were mapped for each analysis (Supplementary Table).
Visium Spatial Transcriptomics Analysis
Visium data were processed with the Space Ranger/Seurat v5 pipeline [15]. Spots were assigned to infarct, border and remote zones on the basis of histology and marker expression, aggregated into pseudo-samples per zone, and analysed with DESeq2 [13]. The primary analysis used a zone-stratified model (within-zone ~ group). A whole-model sensitivity analysis (~ zone + group) and a zone-by-time interaction likelihood-ratio test (~ zone + group + zone:group, reduced ~ zone + group, excluding 1 h/4 h) were performed as supporting analyses. Sample-level comparisons (sham n = 2 vs MI n = 3) used Mann-Whitney tests and are reported descriptively given the limited sample size. Module scores were computed as the z-standardized mean of module gene expression per spot.
Single-Nucleus RNA-Seq Analysis
snRNA-seq data (18 samples, approximately 144,000 nuclei) were processed with the Seurat v5 standard workflow [15], and cell types were annotated using canonical markers. Pseudobulk edgeR [14] was used for time-course differential analysis. For the macrophage SG-state analysis, macrophages were sub-clustered and stratified by the median SG module score into SG-high and SG-low groups. Differences were evaluated at the cell level (Wilcoxon rank-sum test) and at the animal level (pseudobulk edgeR with design ~ group + SG_group, time point as covariate, animal as replicate). Independent stress markers (Atf4, Ddit3, Xbp1, Hspa5, Hsp90aa1, Ccl2, Spp1 and others) were tested with the same two-level scheme.
GWAS and eQTL Integration
Genome-wide significant variants (p < 5e-8) from the FinnGen R11 I9_MI_STRICT GWAS [18] were mapped to SG and efferocytosis module genes. Tissue eQTL status (eGene) of SG genes was assessed in GTEx v10 [17] across heart, coronary artery, aorta and whole blood. Genetic results are reported as supportive evidence.
L1000 Perturbation Screening
L1000 level-5 profiles (GSE92742) [16] were filtered to small-molecule compounds (pert_type = trt_cp). For each signature, an SG-related expression score was defined as the module mean of SG-gene MODZ values (a study-defined index based on the official per-gene expression z-score vector). This index is not an official L1000 connectivity metric and is interpreted only as an expression-score association. Compounds were ranked by the mean score across independent signatures.
SG-Mechanism Analysis
GSE263848 (SG fraction vs total RNA) and GSE264134 (G3bp1 KO vs wild-type) were analysed with edgeR exact tests [14]; genes with FDR < 0.05 were considered significant. Enrichment of SG and efferocytosis module genes in SG fractions and changes after G3bp1 loss were quantified.
Statistics and Reproducibility
All analyses were performed with R (Seurat v5, DESeq2, edgeR) [13,14,15]. Significance thresholds were padj/FDR < 0.05 unless stated otherwise. Sample-level spatial comparisons are explicitly labelled as descriptive because of the small control group. All source data, gene lists and full result tables are available in the Supplementary Information.
Author Contributions
Y.Z. conceived and designed the study, performed the analyses, interpreted the data, and wrote and revised the manuscript. J.C. performed the analyses, interpreted the data, and wrote and revised the manuscript. J.L. curated the data and revised the manuscript. J.W. curated the data and revised the manuscript. G.L. contributed to software and visualization and revised the manuscript. Y.M. contributed resources and revised the manuscript. All authors read and approved the final manuscript.
Funding
The authors declare that this study received no specific grant from any funding agency in the public, commercial, or not-for-profit sectors.
Data availability
The datasets analysed in this study are publicly available: GSE214611, GSE265828, GSE263848, GSE264134 and GSE92742 at the NCBI Gene Expression Omnibus; FinnGen release 11 (https://www.finngen.fi); and GTEx v10 (https://gtexportal.org). Analysis scripts and processed result tables are provided in the Supplementary Information.
Competing interests
The authors declare no competing interests.
References
- Zhu, L.; et al. Exploration of key stress granule-related genes in chronic sinusitis based on transcriptomics. Sci. Rep. 2026, 16, 27980. [Google Scholar] [CrossRef]
- Yamada, S.; et al. Spatiotemporal transcriptome analysis reveals critical roles for mechano-sensing genes at the border zone in remodeling after myocardial infarction. Nat. Cardiovasc. Res. 2022, 1, 1072–1083. [Google Scholar] [CrossRef]
- Kuppe, C.; et al. Spatial multi-omic map of human myocardial infarction. Nature 2022, 608, 766–777. [Google Scholar] [CrossRef] [PubMed]
- Yang, G. Connecting the dots: stress granule and cardiovascular diseases. J. Cardiovasc. Transl. Res. 2025, 18, 738–748. [Google Scholar] [CrossRef]
- Herman, A. B.; et al. Regulation of stress granule formation by inflammation, vascular injury, and atherosclerosis. Arterioscler. Thromb. Vasc. Biol. 2019, 39, 2014–2027. [Google Scholar] [CrossRef] [PubMed]
- Stress granule assembly impairs macrophage efferocytosis to aggravate allergic rhinitis in mice. Nat. Commun. 2025, 16. [CrossRef]
- Macrophage-specific circular RNA circHIPK2, inflammation, and fibrosis after myocardial infarction. Eur. Heart J. 2026, 47, 2831. [CrossRef]
- SHEP1 alleviates cardiac ischemia reperfusion injury via targeting G3BP1 to regulate macrophage infiltration and inflammation. Cell Death Dis. 2024, 15, 916. [CrossRef]
- Efferocytosis and its role in inflammatory disorders. Front. Cell Dev. Biol. 2022, 10, 839248. [CrossRef]
- Efferocytosis: the resolution of inflammation in cardiovascular and cerebrovascular disease. Front. Immunol. 2024, 15, 1485222. [CrossRef]
- Cardiac resident macrophages: key regulatory mediators in the aftermath of myocardial infarction. Front. Immunol. 2023, 14, 1207100. [CrossRef]
- Sanjaya, A. Transcriptomic dynamics of cardiac remodeling after myocardial infarction. Sci. Rep. 2025, 15, 36720. [Google Scholar] [CrossRef]
- Love, M. I.; Huber, W.; Anders, S. Moderated estimation of fold change and dispersion for RNA-seq data with DESeq2. Genome Biol. 2014, 15, 550. [Google Scholar] [CrossRef]
- Robinson, M. D.; McCarthy, D. J.; Smyth, G. K. edgeR: a Bioconductor package for differential expression analysis of digital gene expression data. Bioinformatics 2010, 26, 139–140. [Google Scholar] [CrossRef] [PubMed]
- Hao, Y.; et al. Dictionary learning for integrative, multimodal and scalable single-cell analysis. Nat. Biotechnol. 2024, 42, 293–304. [Google Scholar] [CrossRef] [PubMed]
- Subramanian, A.; et al. A next generation Connectivity Map: L1000 platform and the first 1,000,000 profiles. Cell 2017, 171, 1437–1452. [Google Scholar] [CrossRef] [PubMed]
- The GTEx Consortium. The GTEx Consortium atlas of genetic regulatory effects across human tissues. Science 2020, 369, 1318–1330. [Google Scholar] [CrossRef]
- Kurki, M. I.; et al. FinnGen provides genetic insights from a well-phenotyped isolated population. Nature 2023, 613, 508–518. [Google Scholar] [CrossRef] [PubMed]
- Youn, J.-Y.; et al. Properties of stress granule and P-body proteomes. Mol. Cell 2019, 76, 286–294. [Google Scholar] [CrossRef]
Figure 1.
| SG module scores across cardiac zones and time points in the mouse MI Visium dataset (GSE214611). Module scores are z-standardized means per spot. IZ, infarct zone; BZ, border zone; RZ, remote zone.
Figure 1.
| SG module scores across cardiac zones and time points in the mouse MI Visium dataset (GSE214611). Module scores are z-standardized means per spot. IZ, infarct zone; BZ, border zone; RZ, remote zone.
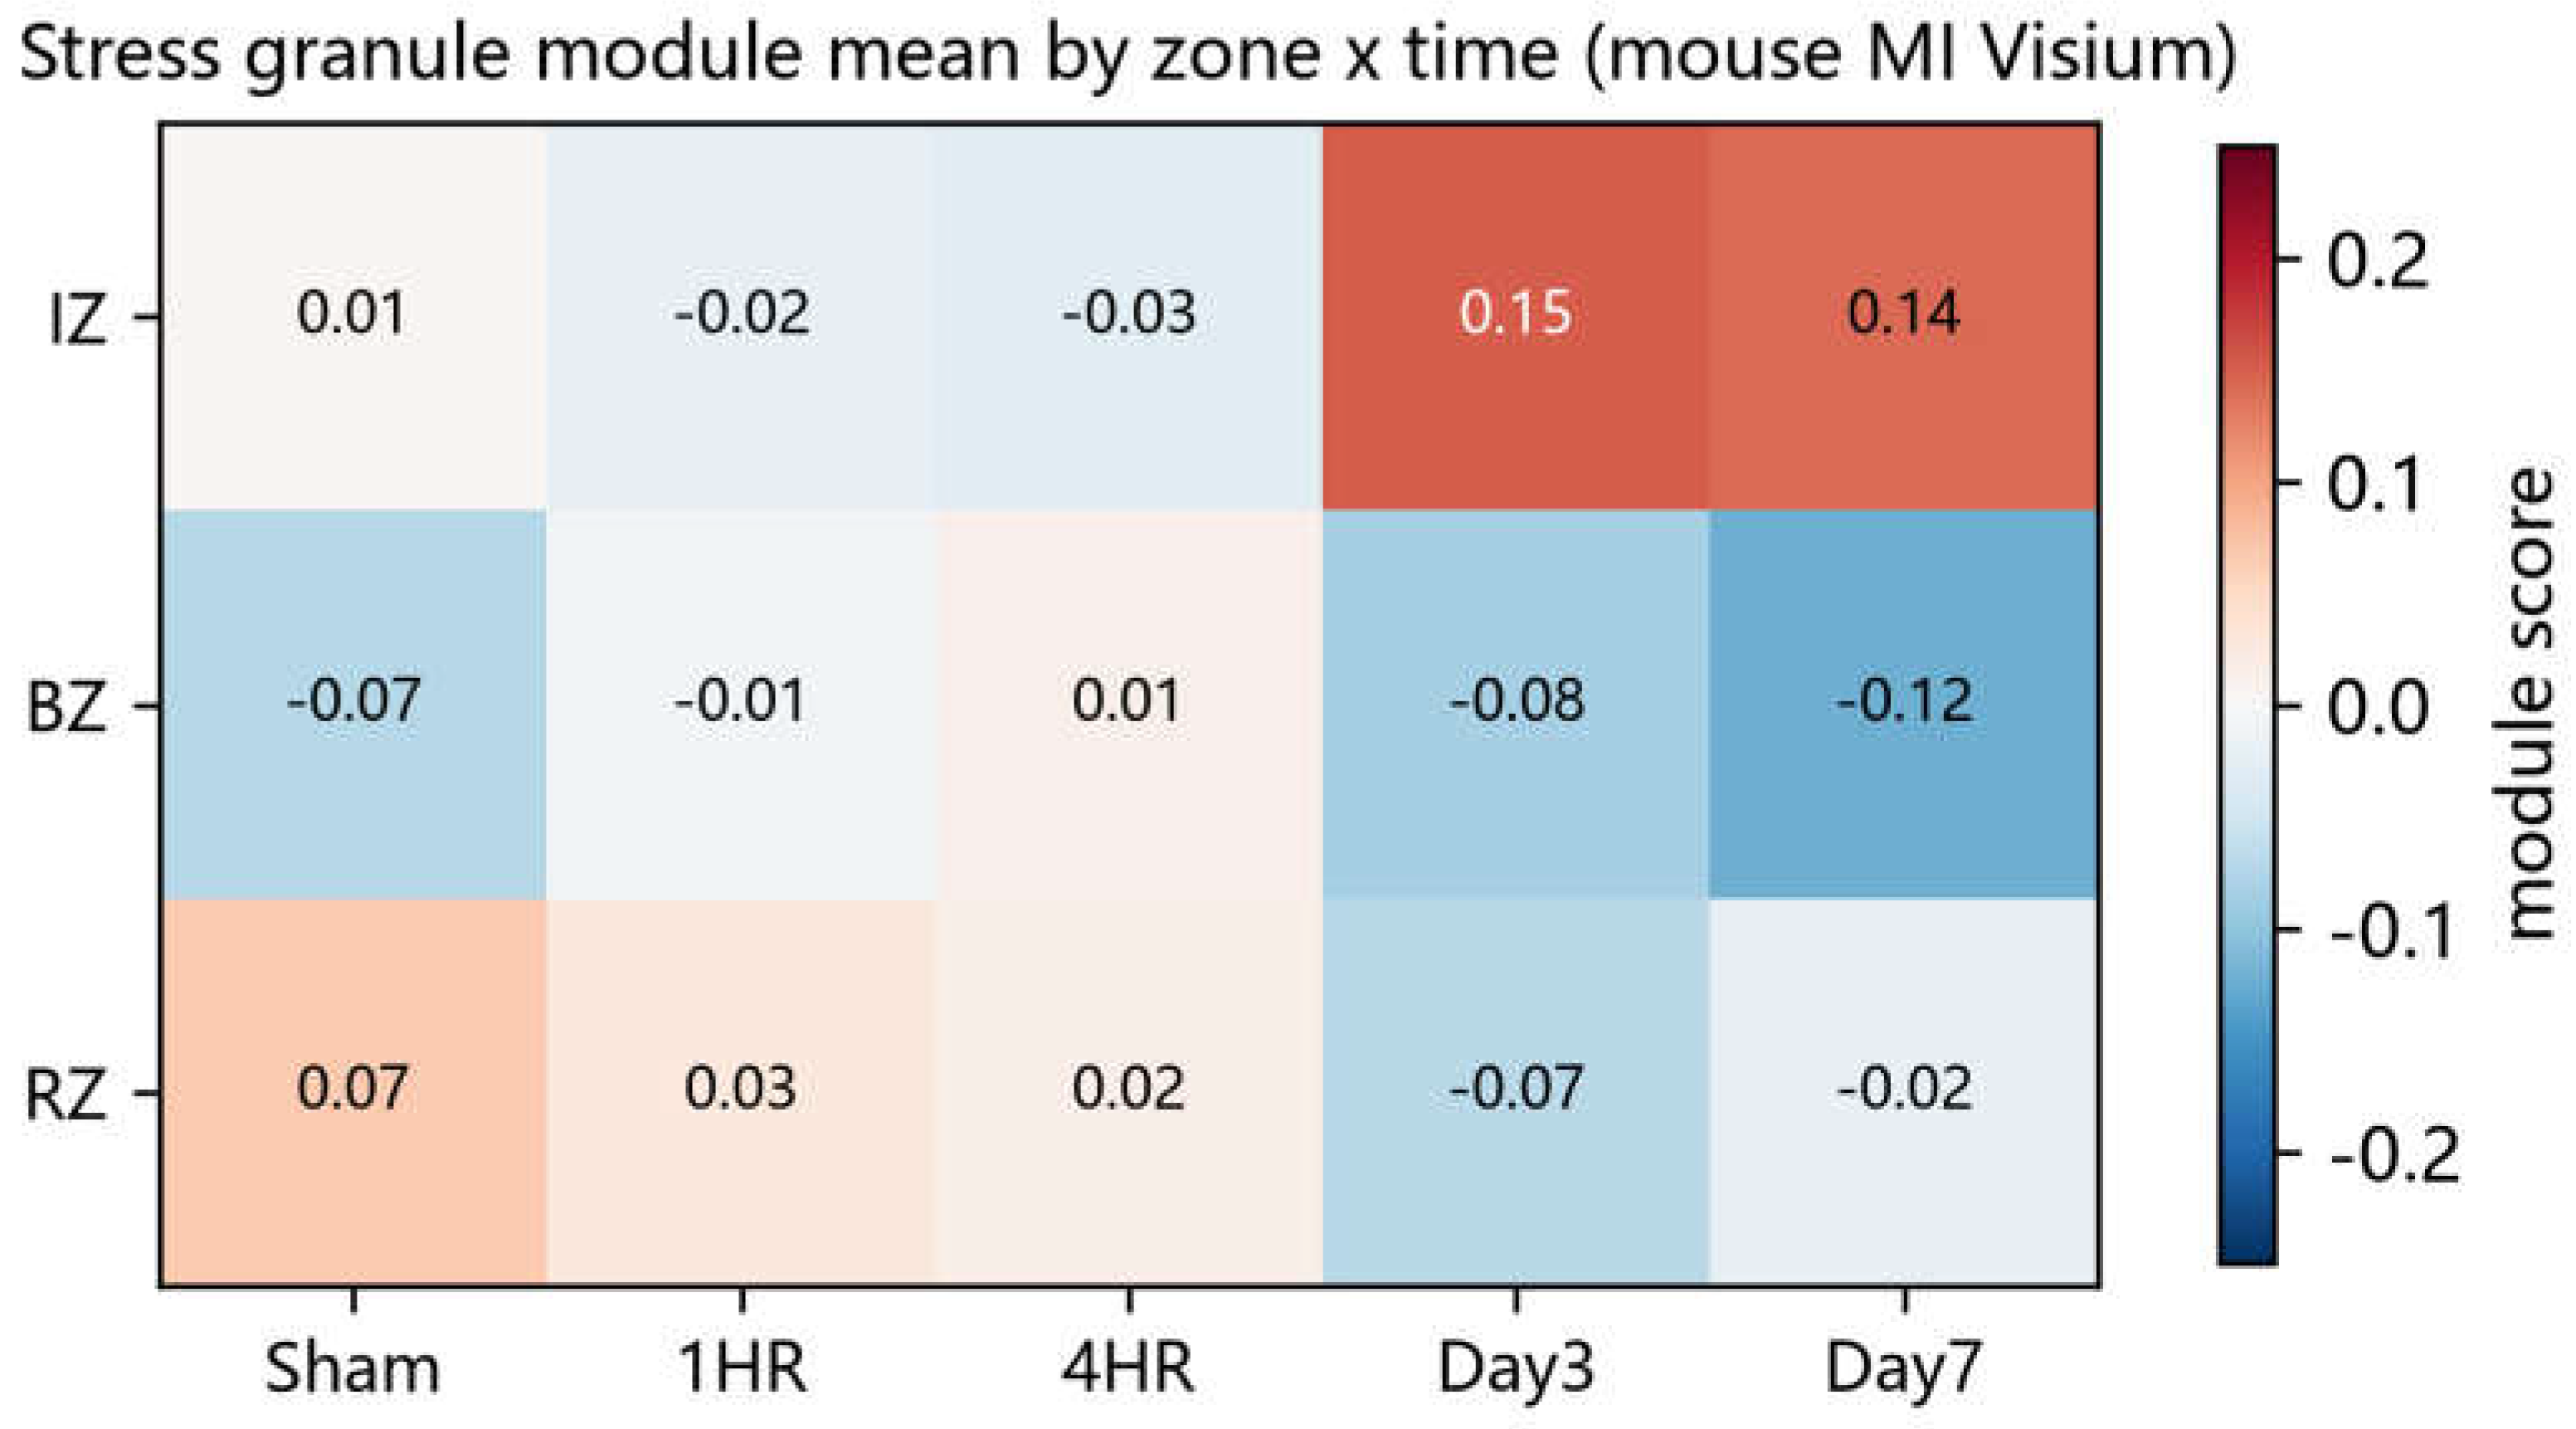
Figure 2.
| Efferocytosis (ER) module scores across cardiac zones and time points in the mouse MI Visium dataset (GSE214611).
Figure 2.
| Efferocytosis (ER) module scores across cardiac zones and time points in the mouse MI Visium dataset (GSE214611).
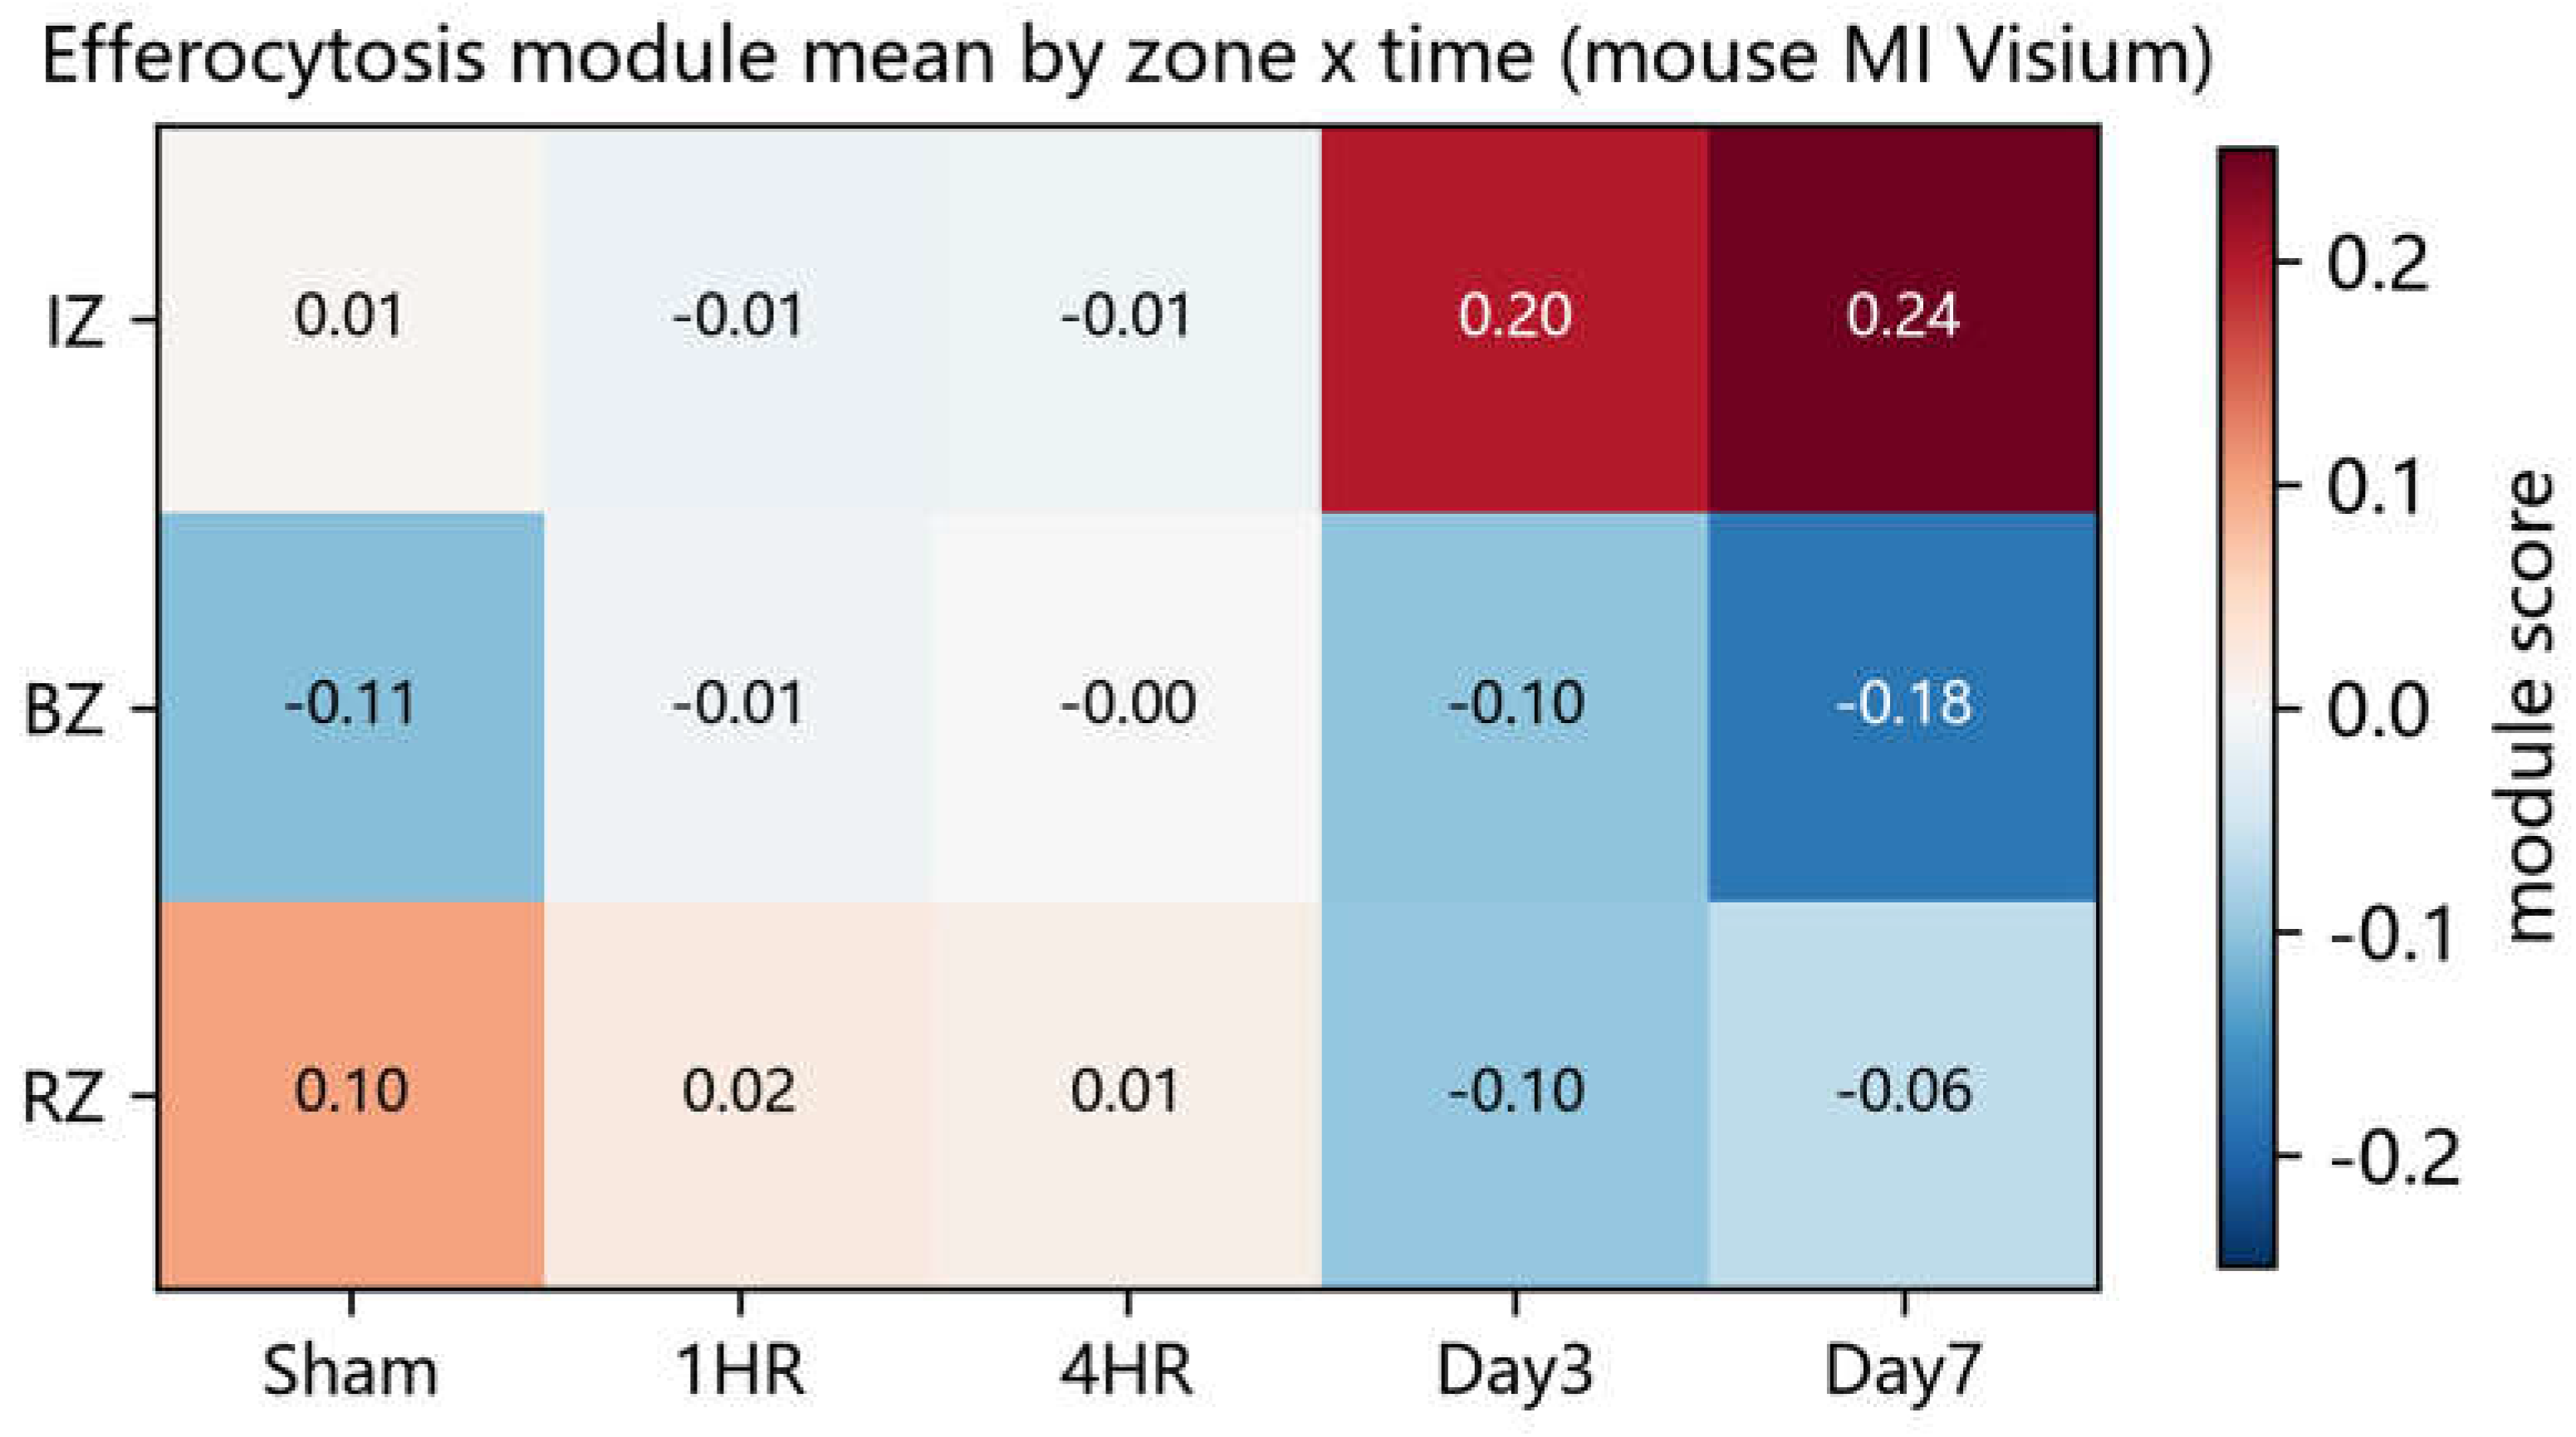
Figure 3.
| Zone-stratified differential expression in the infarct zone. Volcano plots show DESeq2 results at day 3 (left; 10 SG and 32 ER genes) and day 7 (right; 11 SG and 34 ER genes). Red, SG genes; blue, efferocytosis genes. Significance threshold: padj < 0.05 and |log2FC| > 0.25.
Figure 3.
| Zone-stratified differential expression in the infarct zone. Volcano plots show DESeq2 results at day 3 (left; 10 SG and 32 ER genes) and day 7 (right; 11 SG and 34 ER genes). Red, SG genes; blue, efferocytosis genes. Significance threshold: padj < 0.05 and |log2FC| > 0.25.
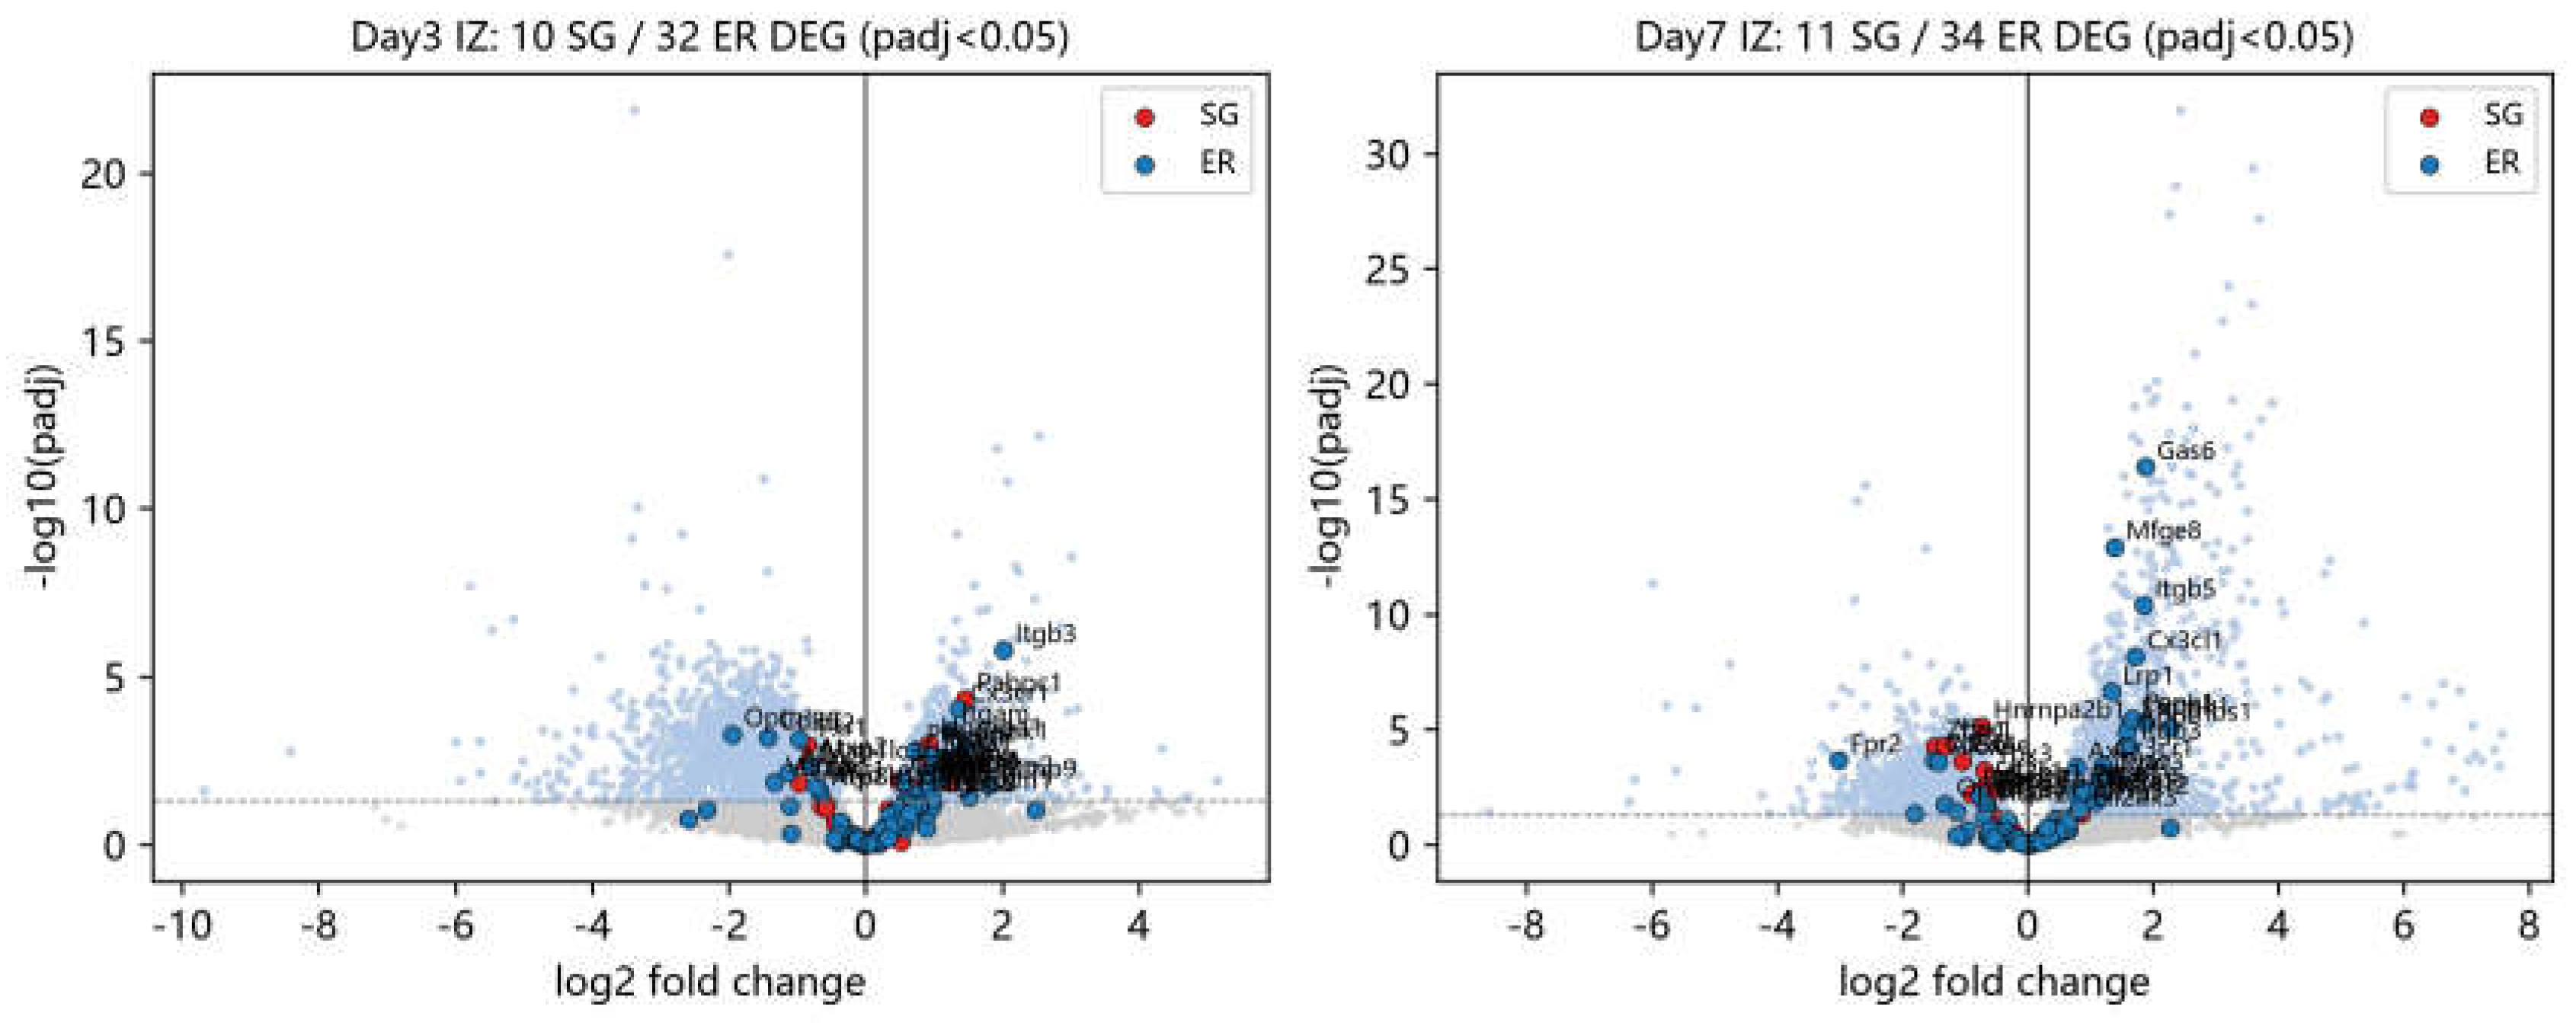
Figure 4.
| UMAP visualization of nine annotated cell types in the mouse MI single-nucleus RNA-seq dataset (GSE214611, 18 samples).
Figure 4.
| UMAP visualization of nine annotated cell types in the mouse MI single-nucleus RNA-seq dataset (GSE214611, 18 samples).
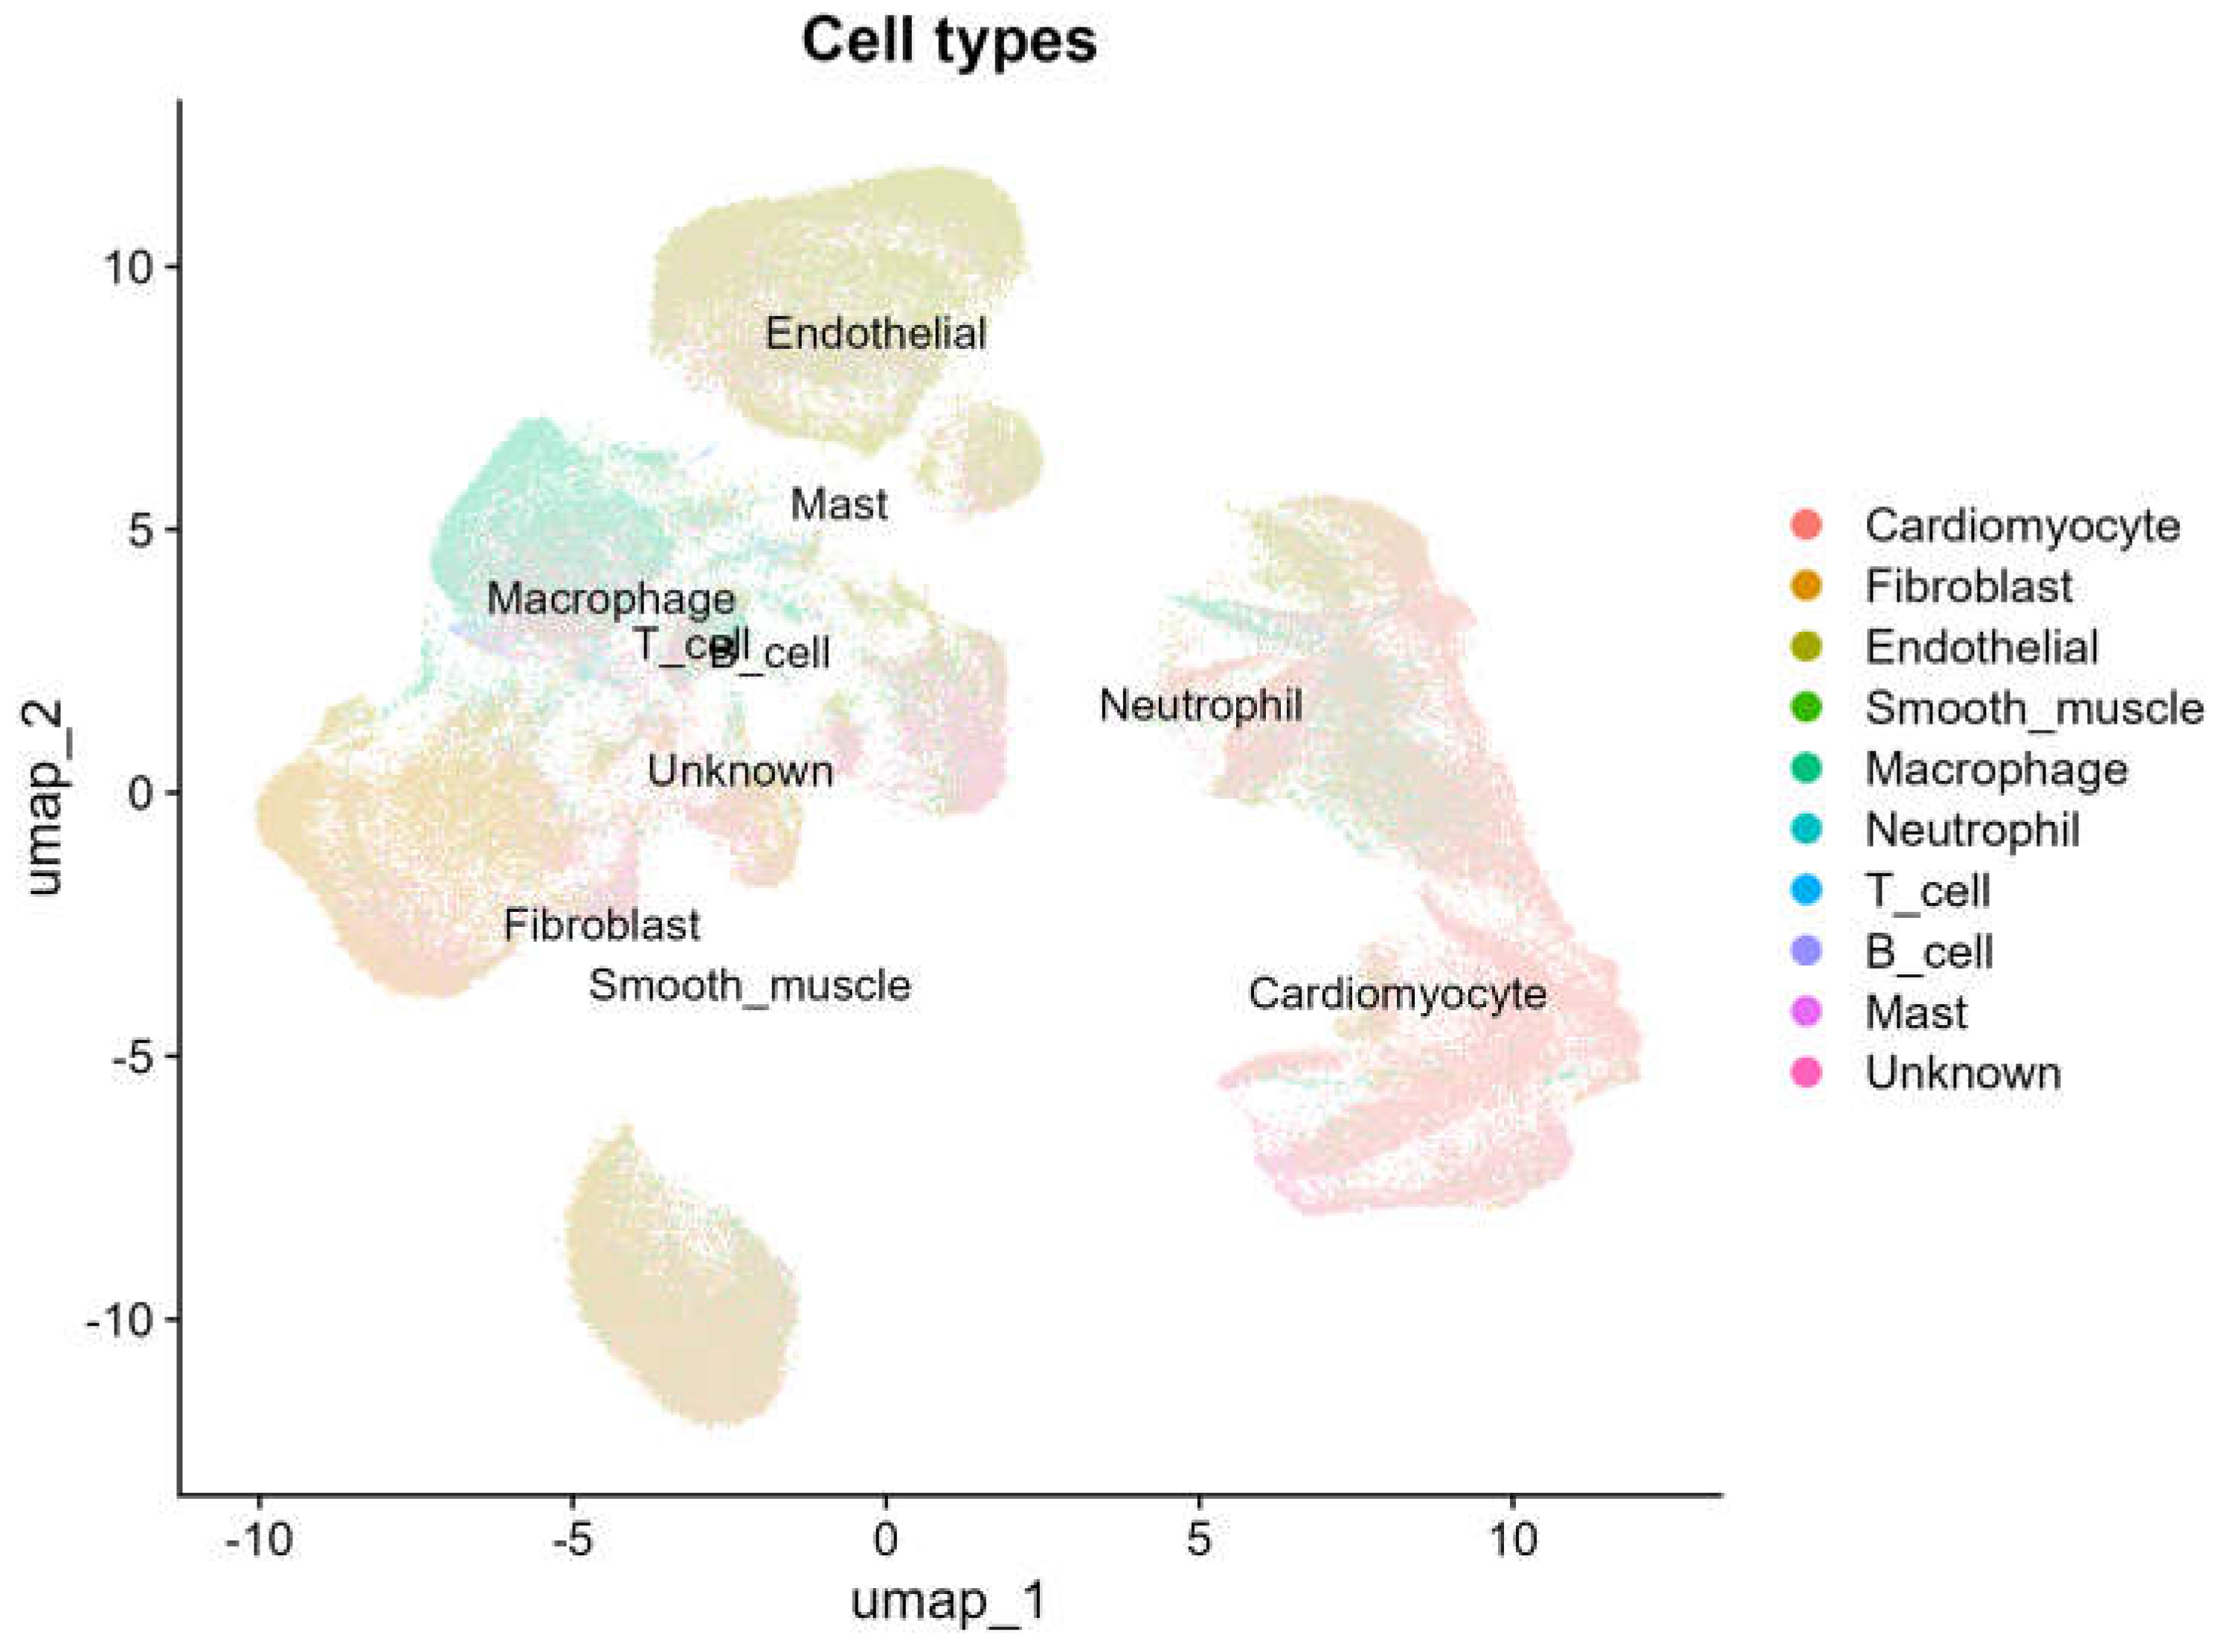
Figure 5.
| SG module scores across cell types and time points in the mouse MI snRNA-seq dataset.
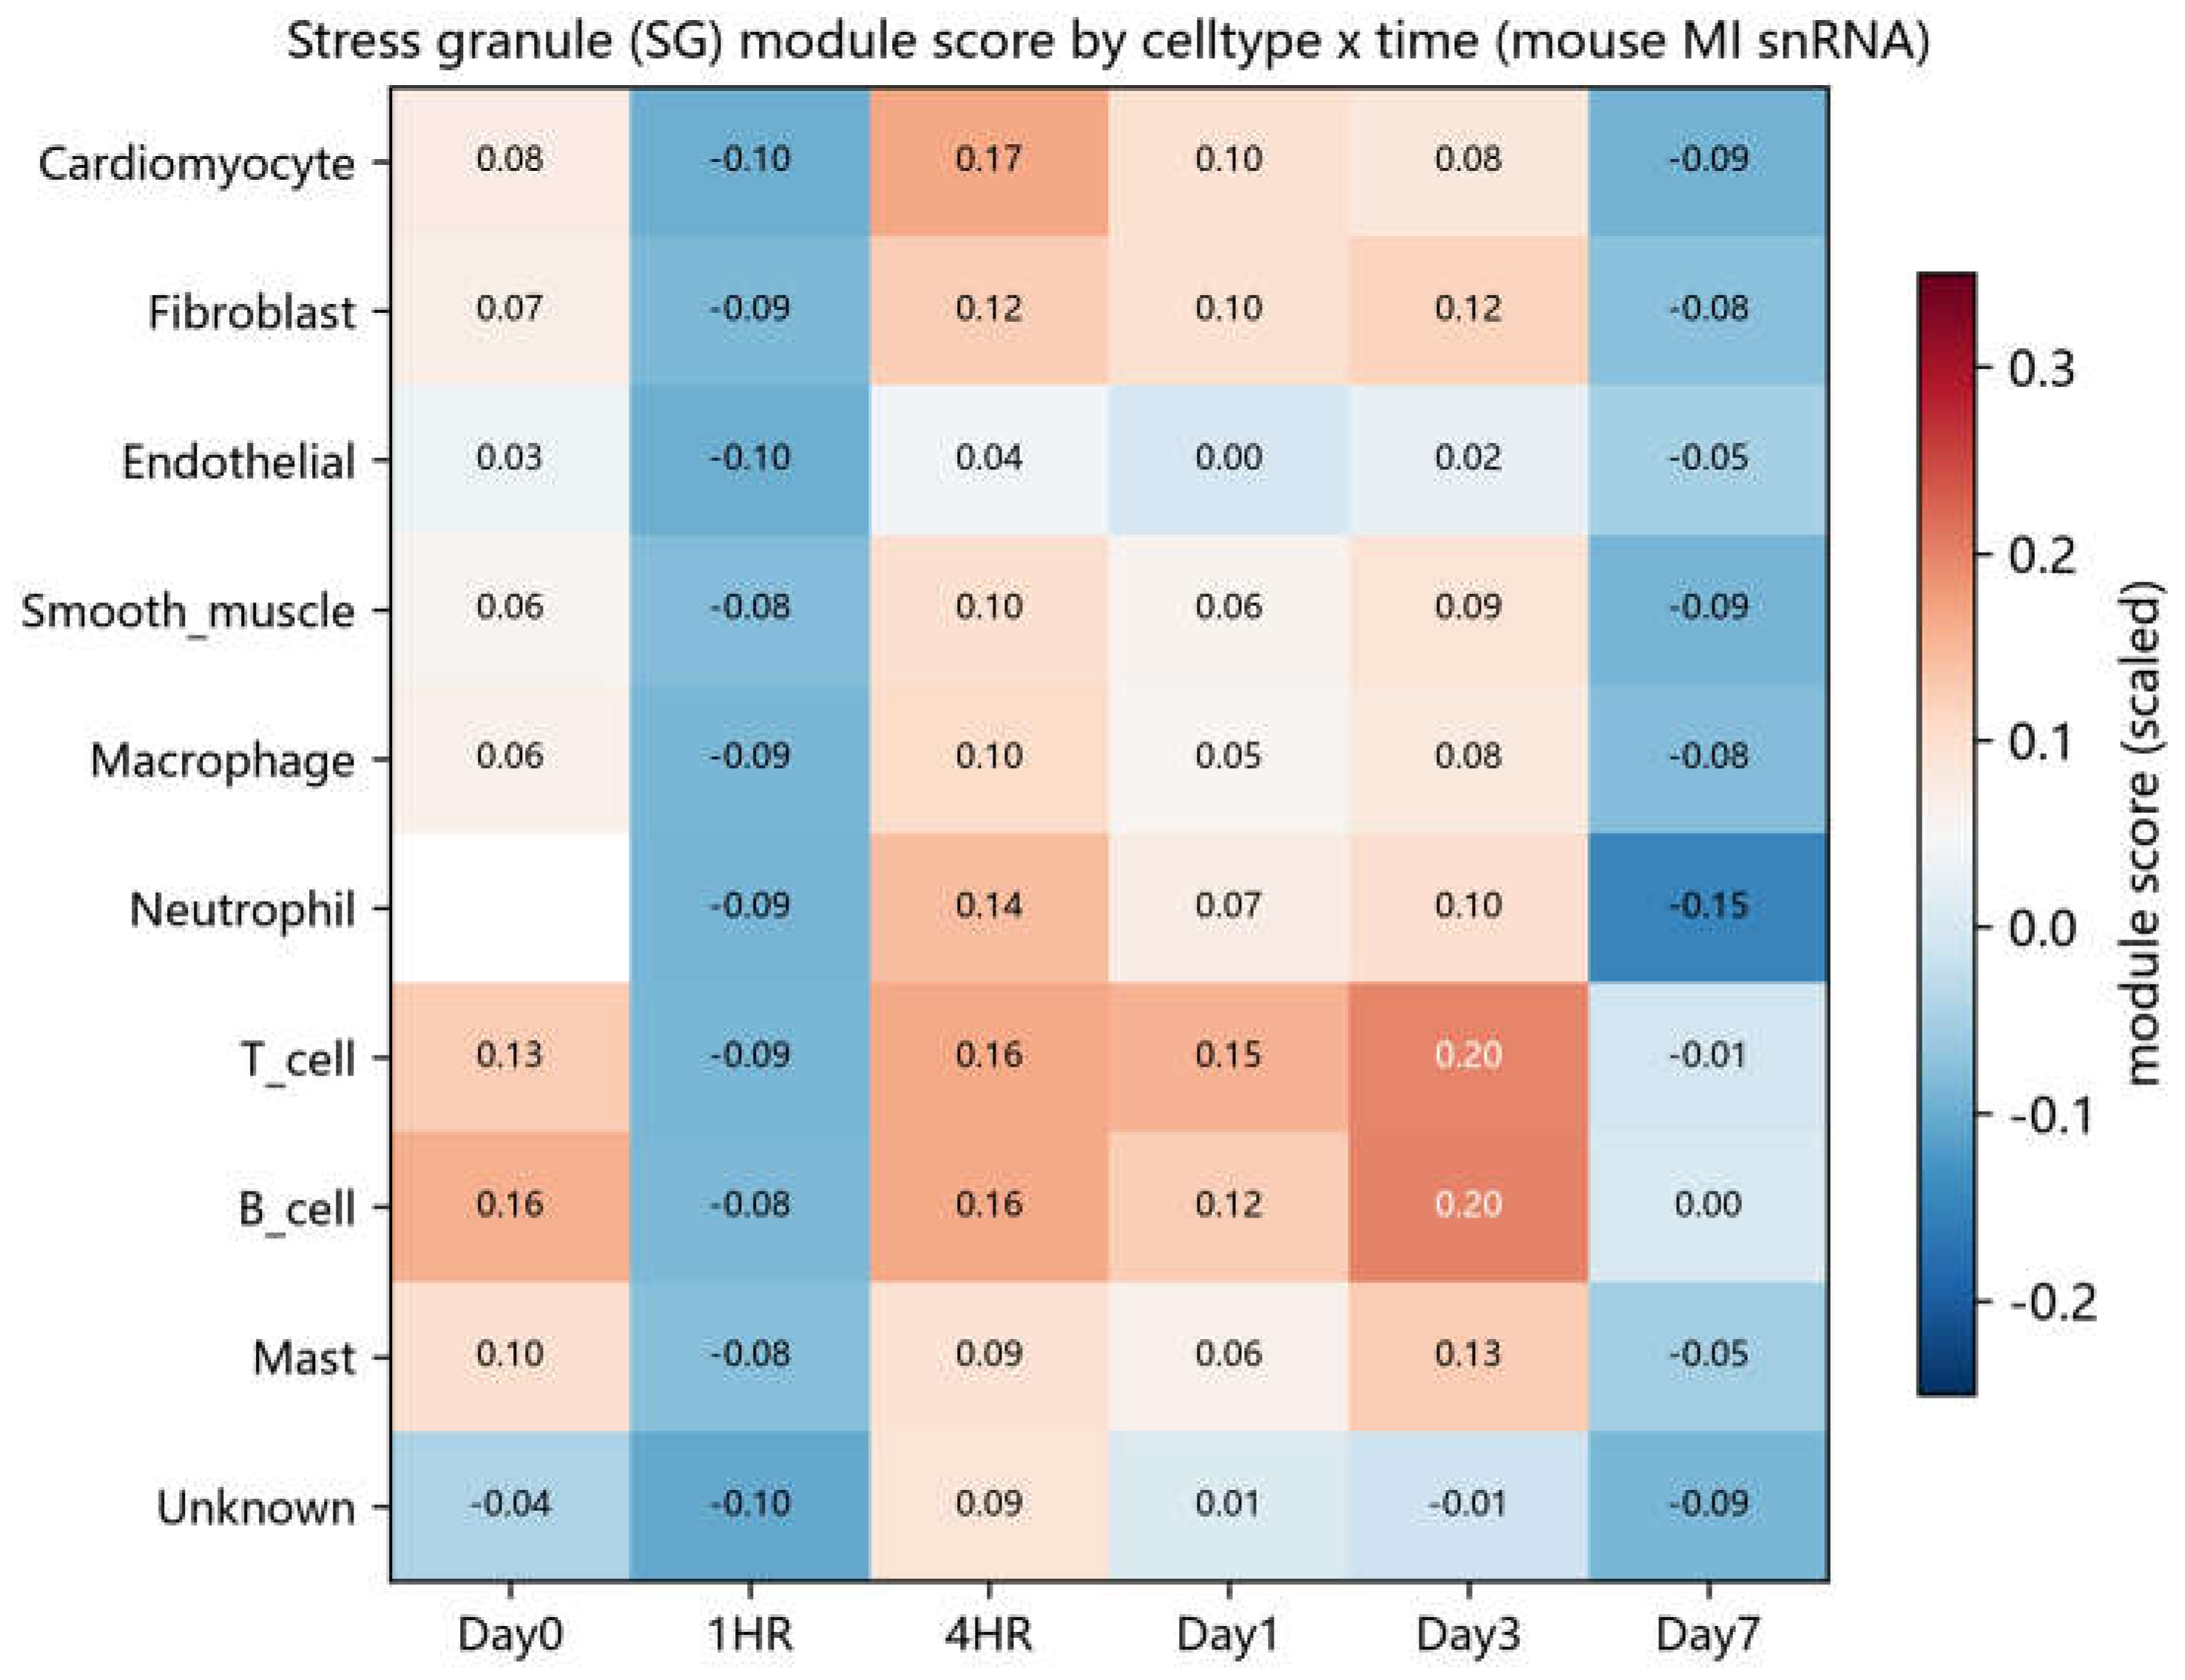
Figure 6.
| Efferocytosis module scores across cell types and time points in the mouse MI snRNA-seq dataset.
Figure 6.
| Efferocytosis module scores across cell types and time points in the mouse MI snRNA-seq dataset.
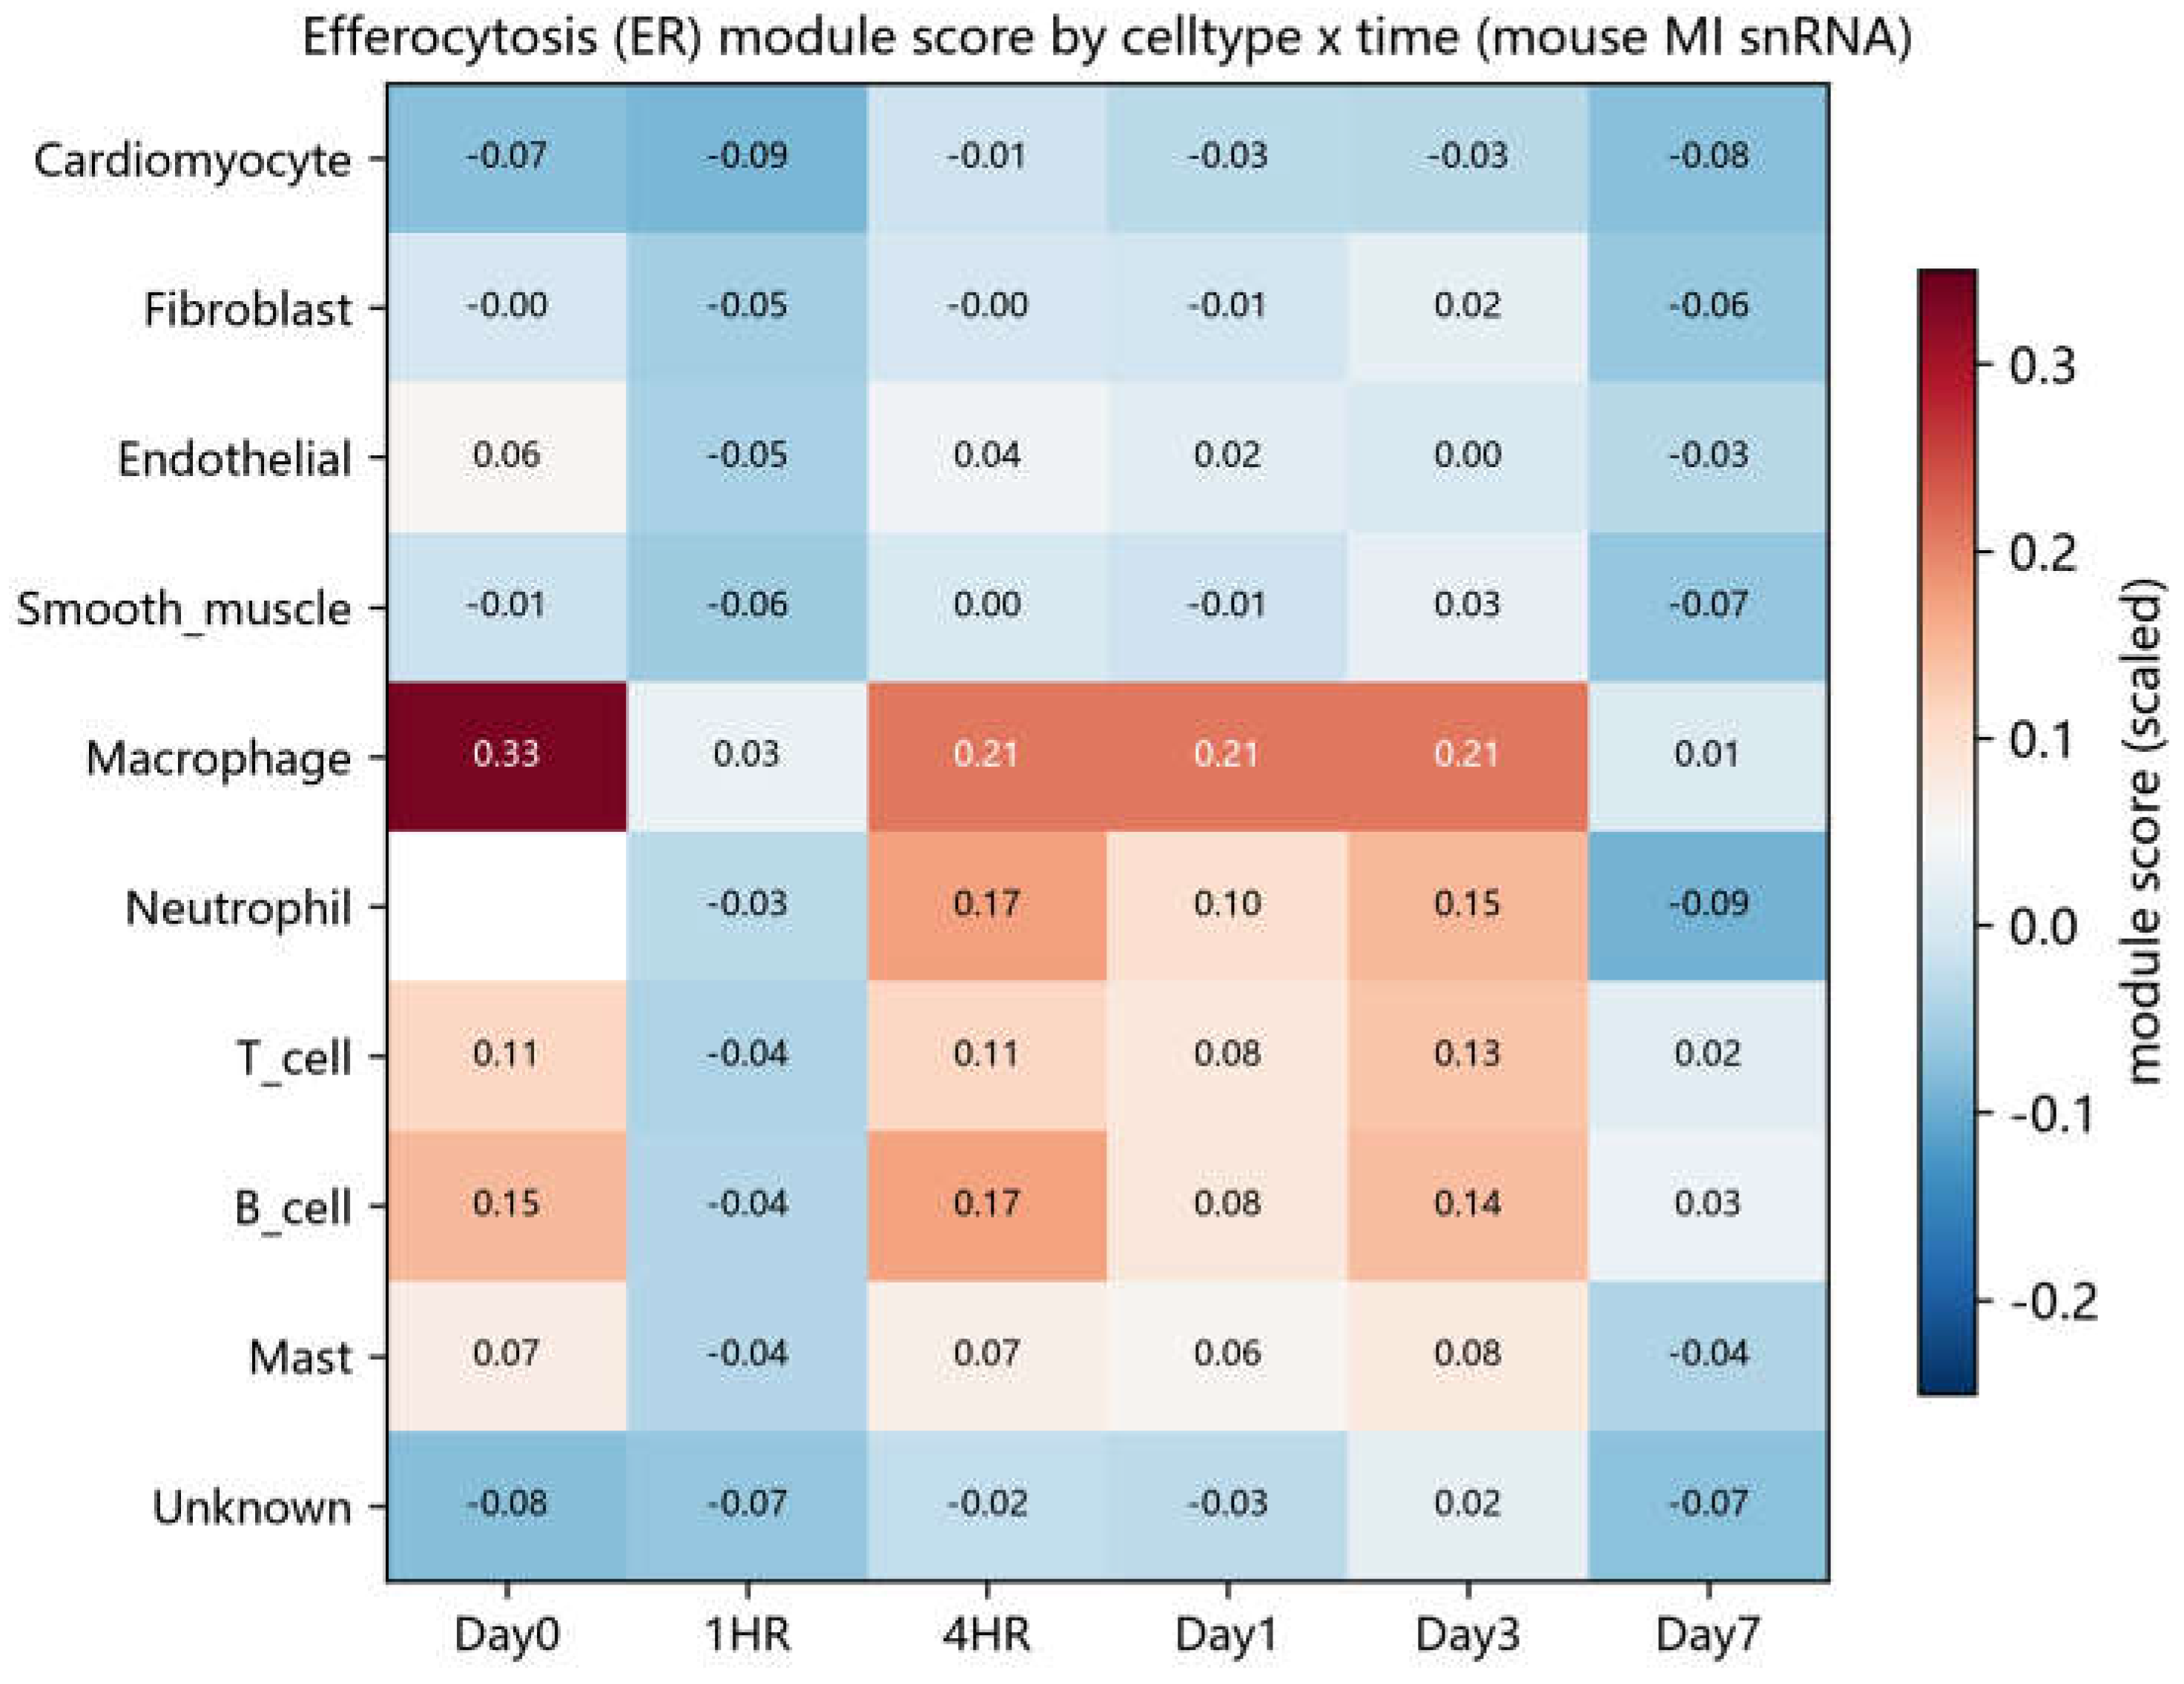
Figure 7.
| Core SG genes upregulated in SG-high versus SG-low macrophages (cell-level Wilcoxon test; mouse MI snRNA-seq).
Figure 7.
| Core SG genes upregulated in SG-high versus SG-low macrophages (cell-level Wilcoxon test; mouse MI snRNA-seq).
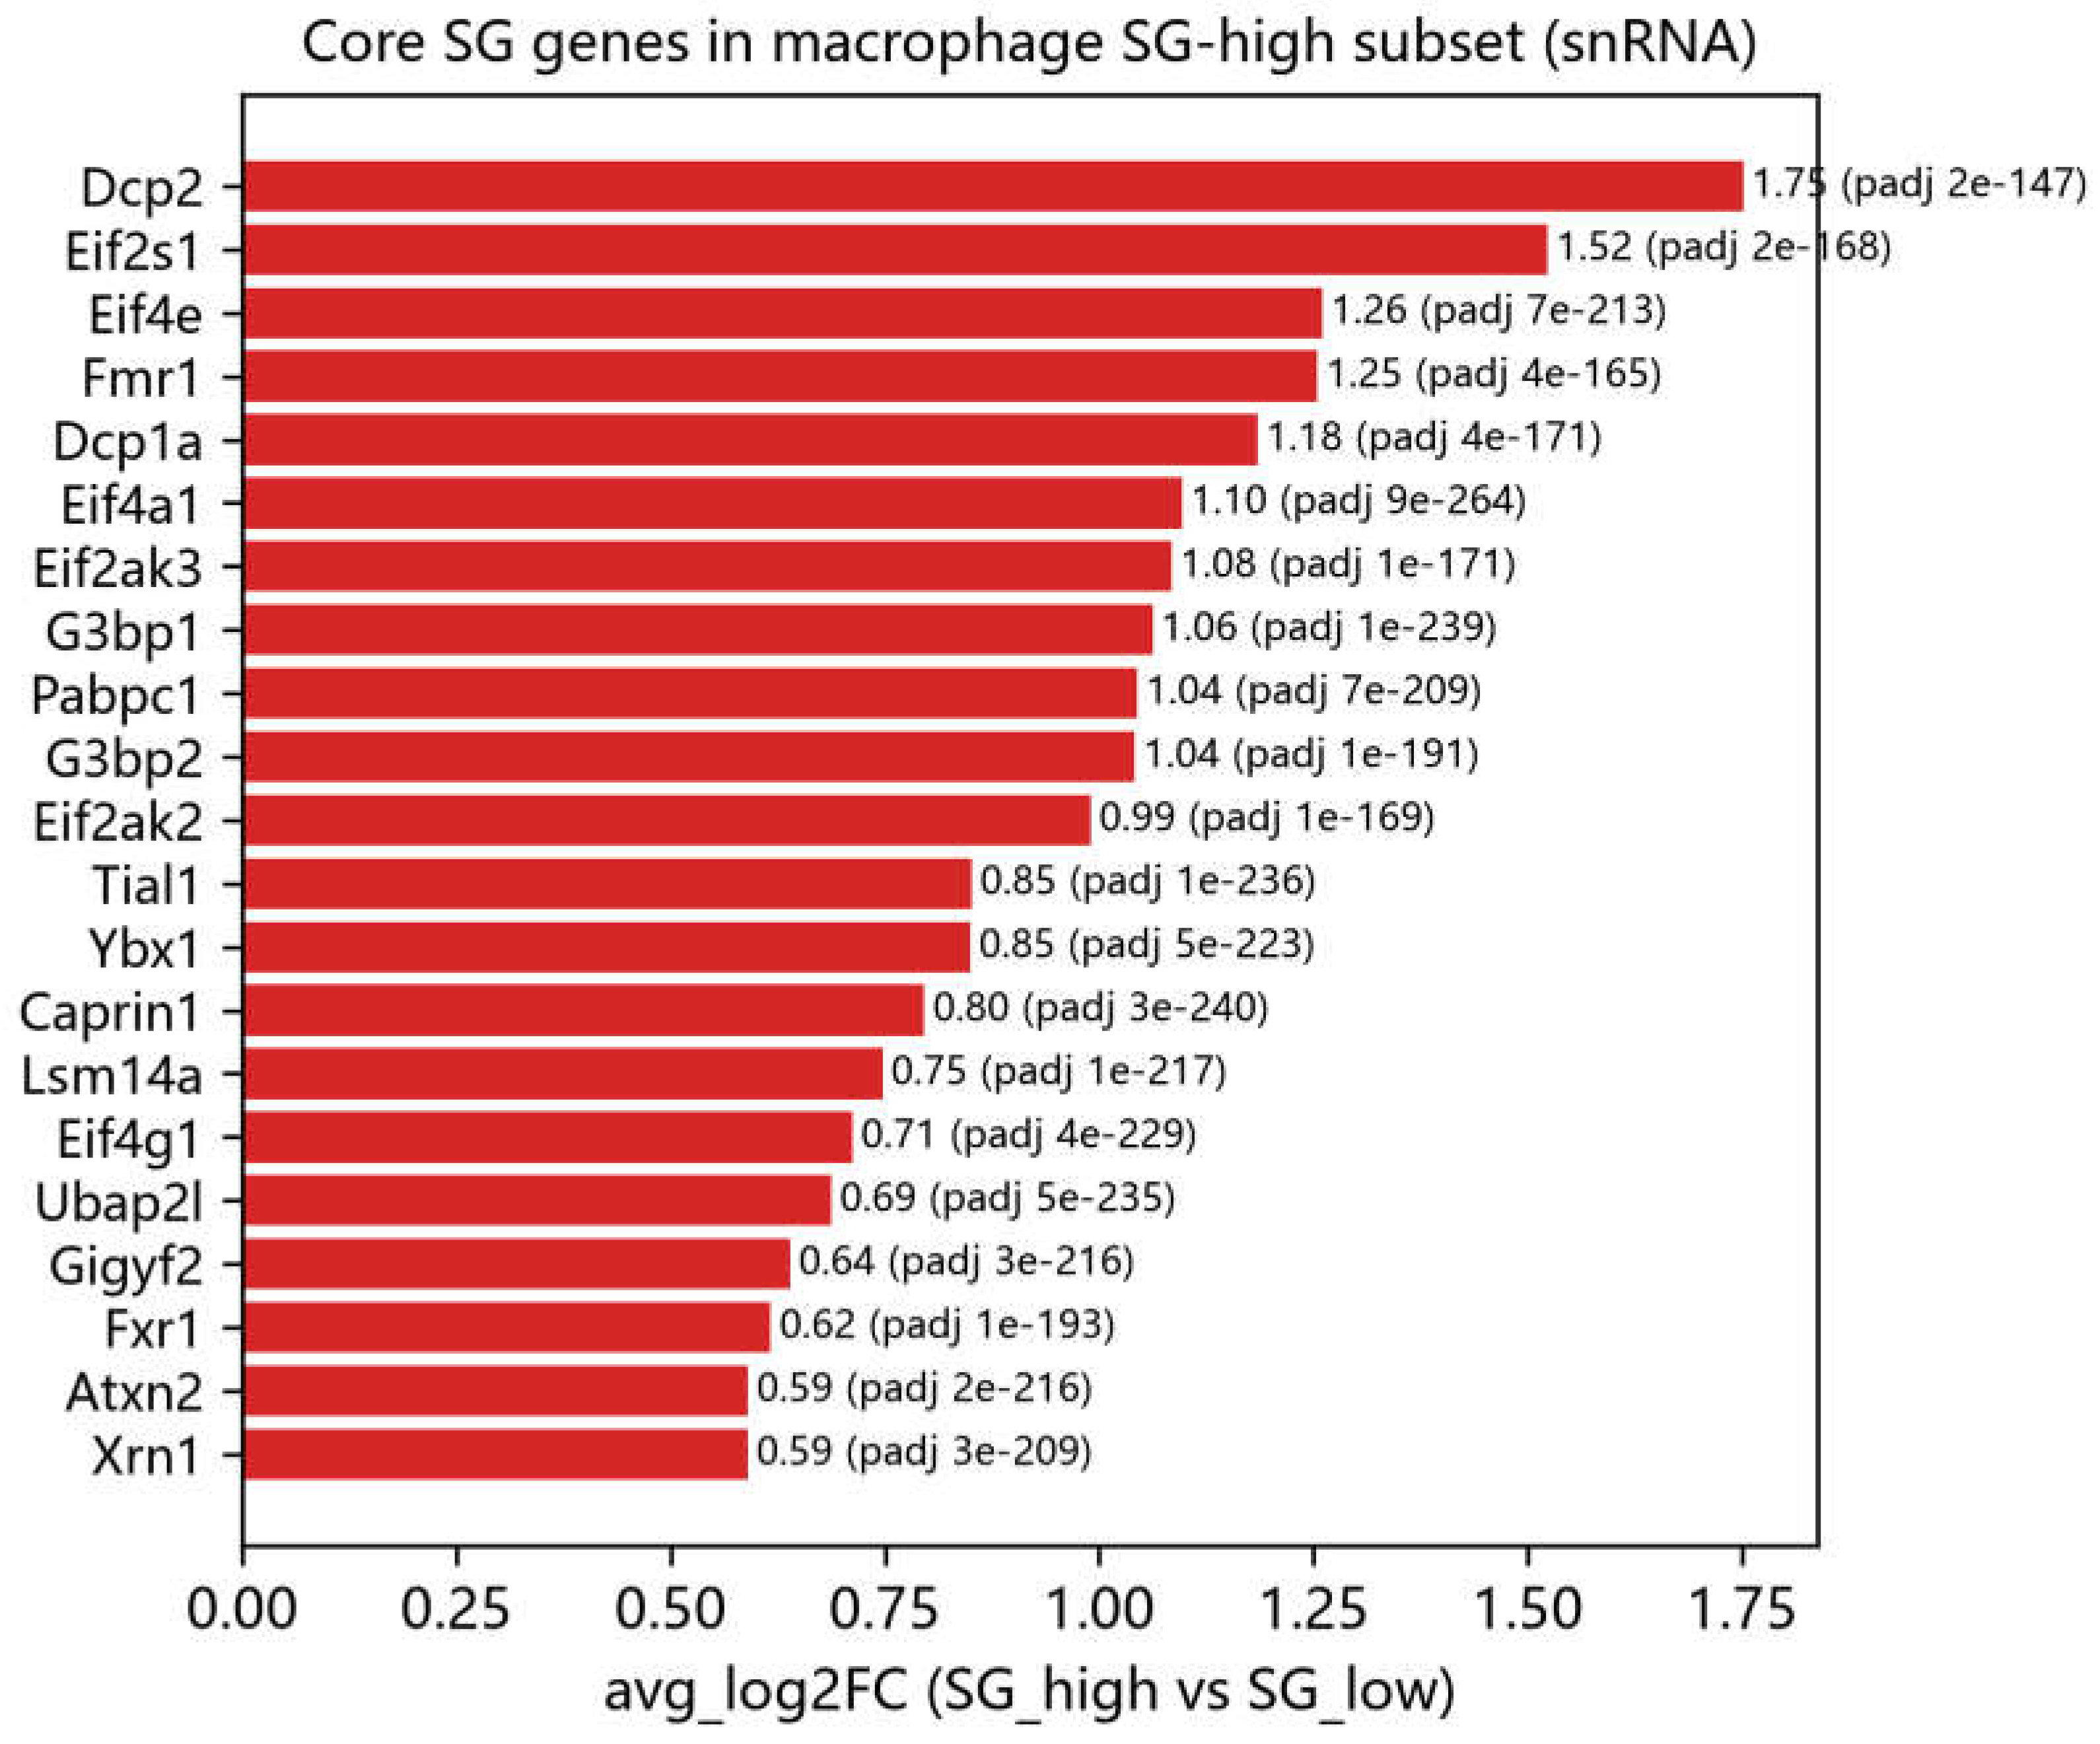
Figure 8.
| Genome-wide significant loci of SG/efferocytosis module genes in the FinnGen R11 MI_STRICT GWAS.
Figure 8.
| Genome-wide significant loci of SG/efferocytosis module genes in the FinnGen R11 MI_STRICT GWAS.
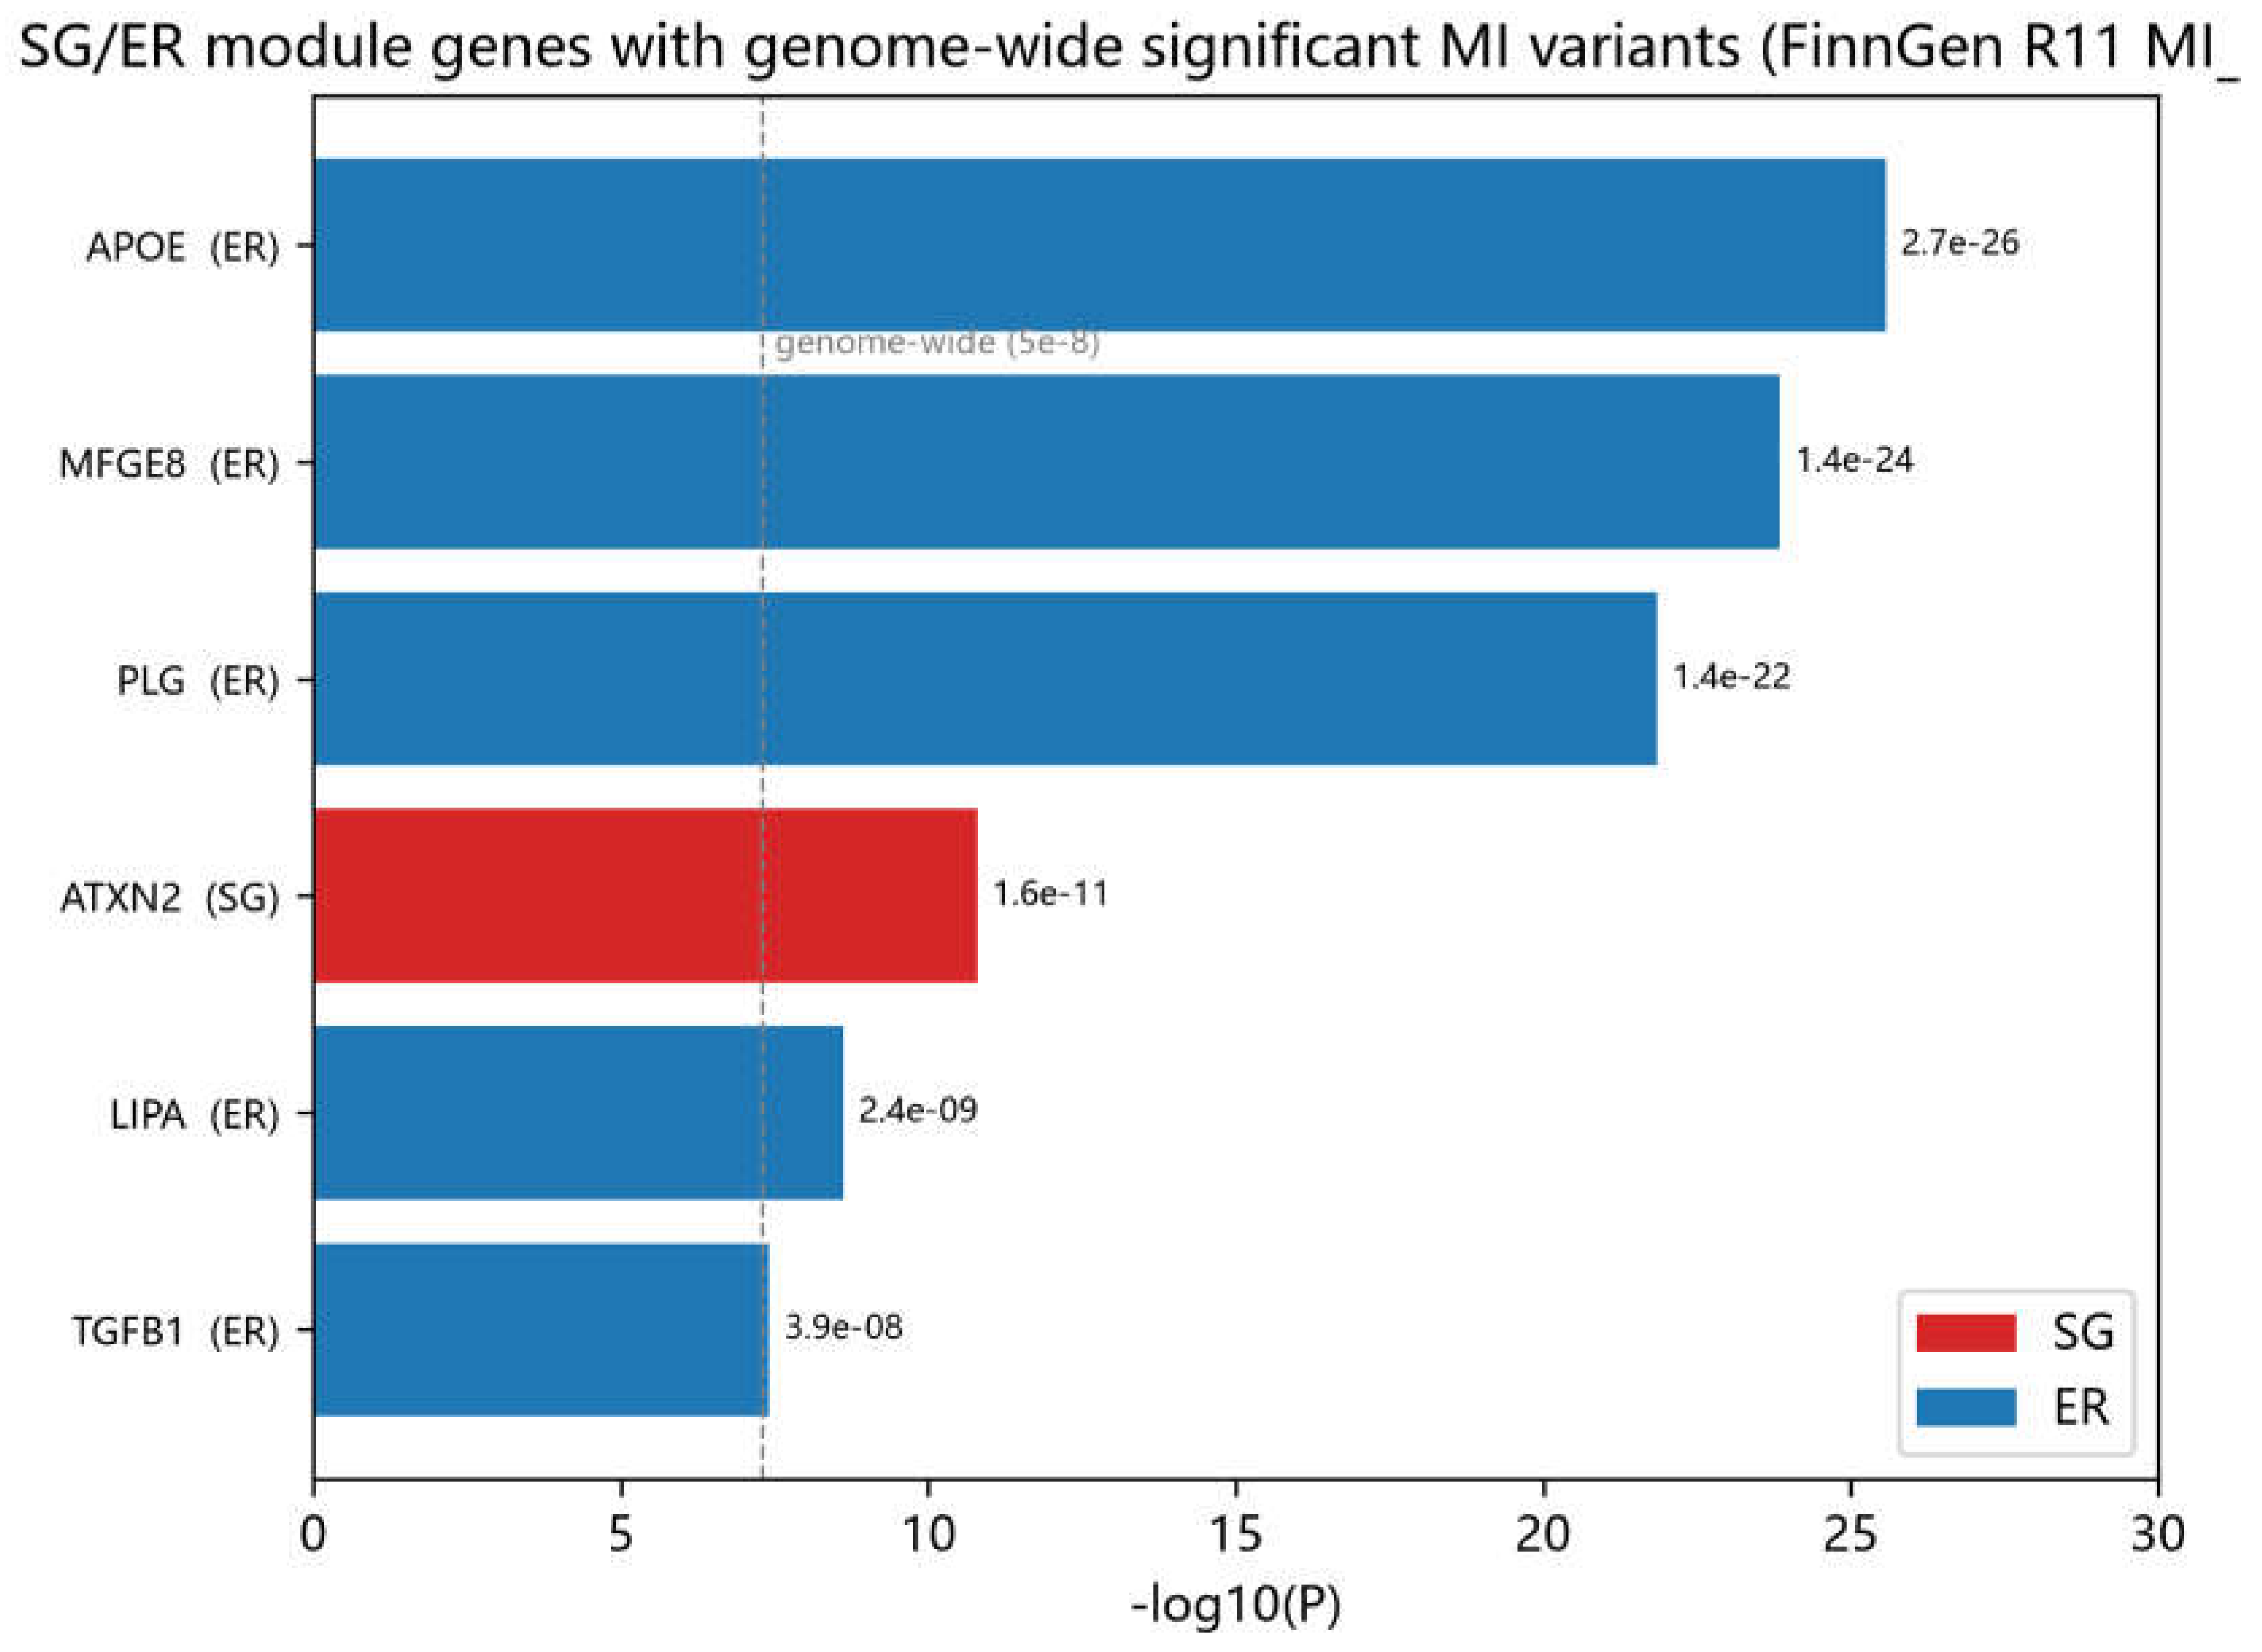
Figure 9.
| eQTL significance of the 42 SG genes across six tissues (GTEx v10).
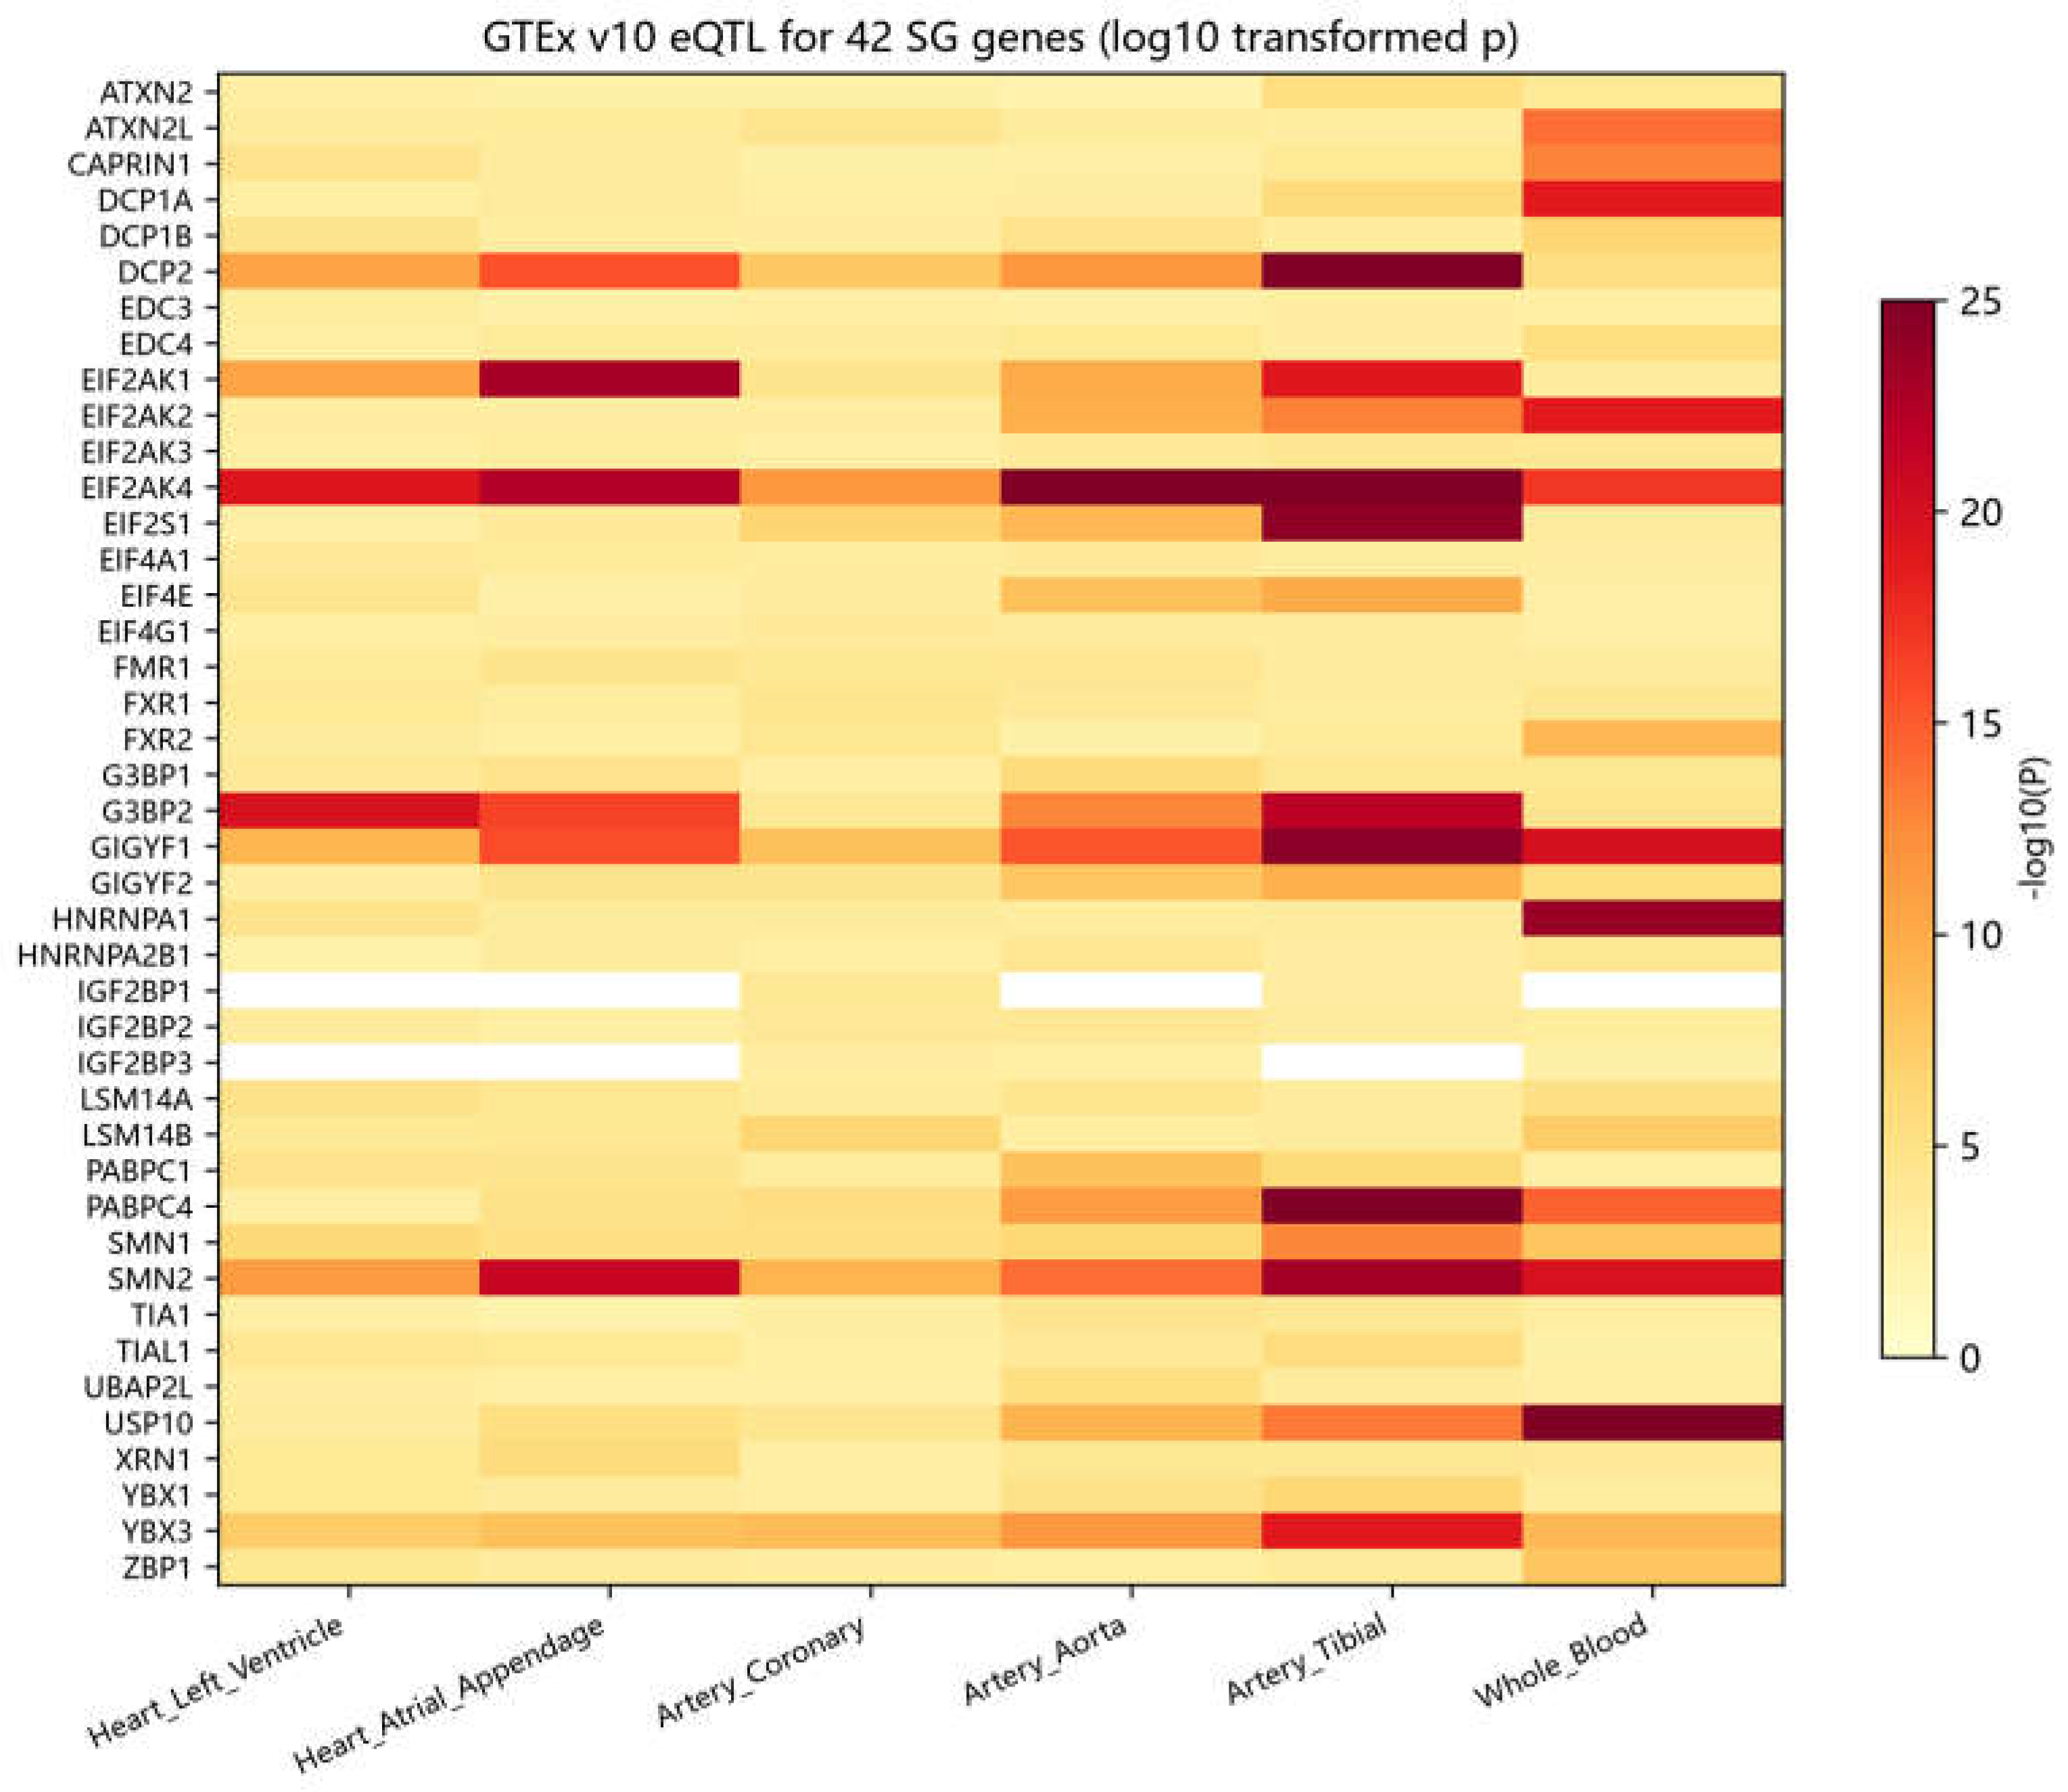
Figure 10.
| Compounds associated with elevated SG-related expression scores in L1000 screening (trt_cp signatures; module mean of SG-gene MODZ values; n = number of independent signatures).
Figure 10.
| Compounds associated with elevated SG-related expression scores in L1000 screening (trt_cp signatures; module mean of SG-gene MODZ values; n = number of independent signatures).
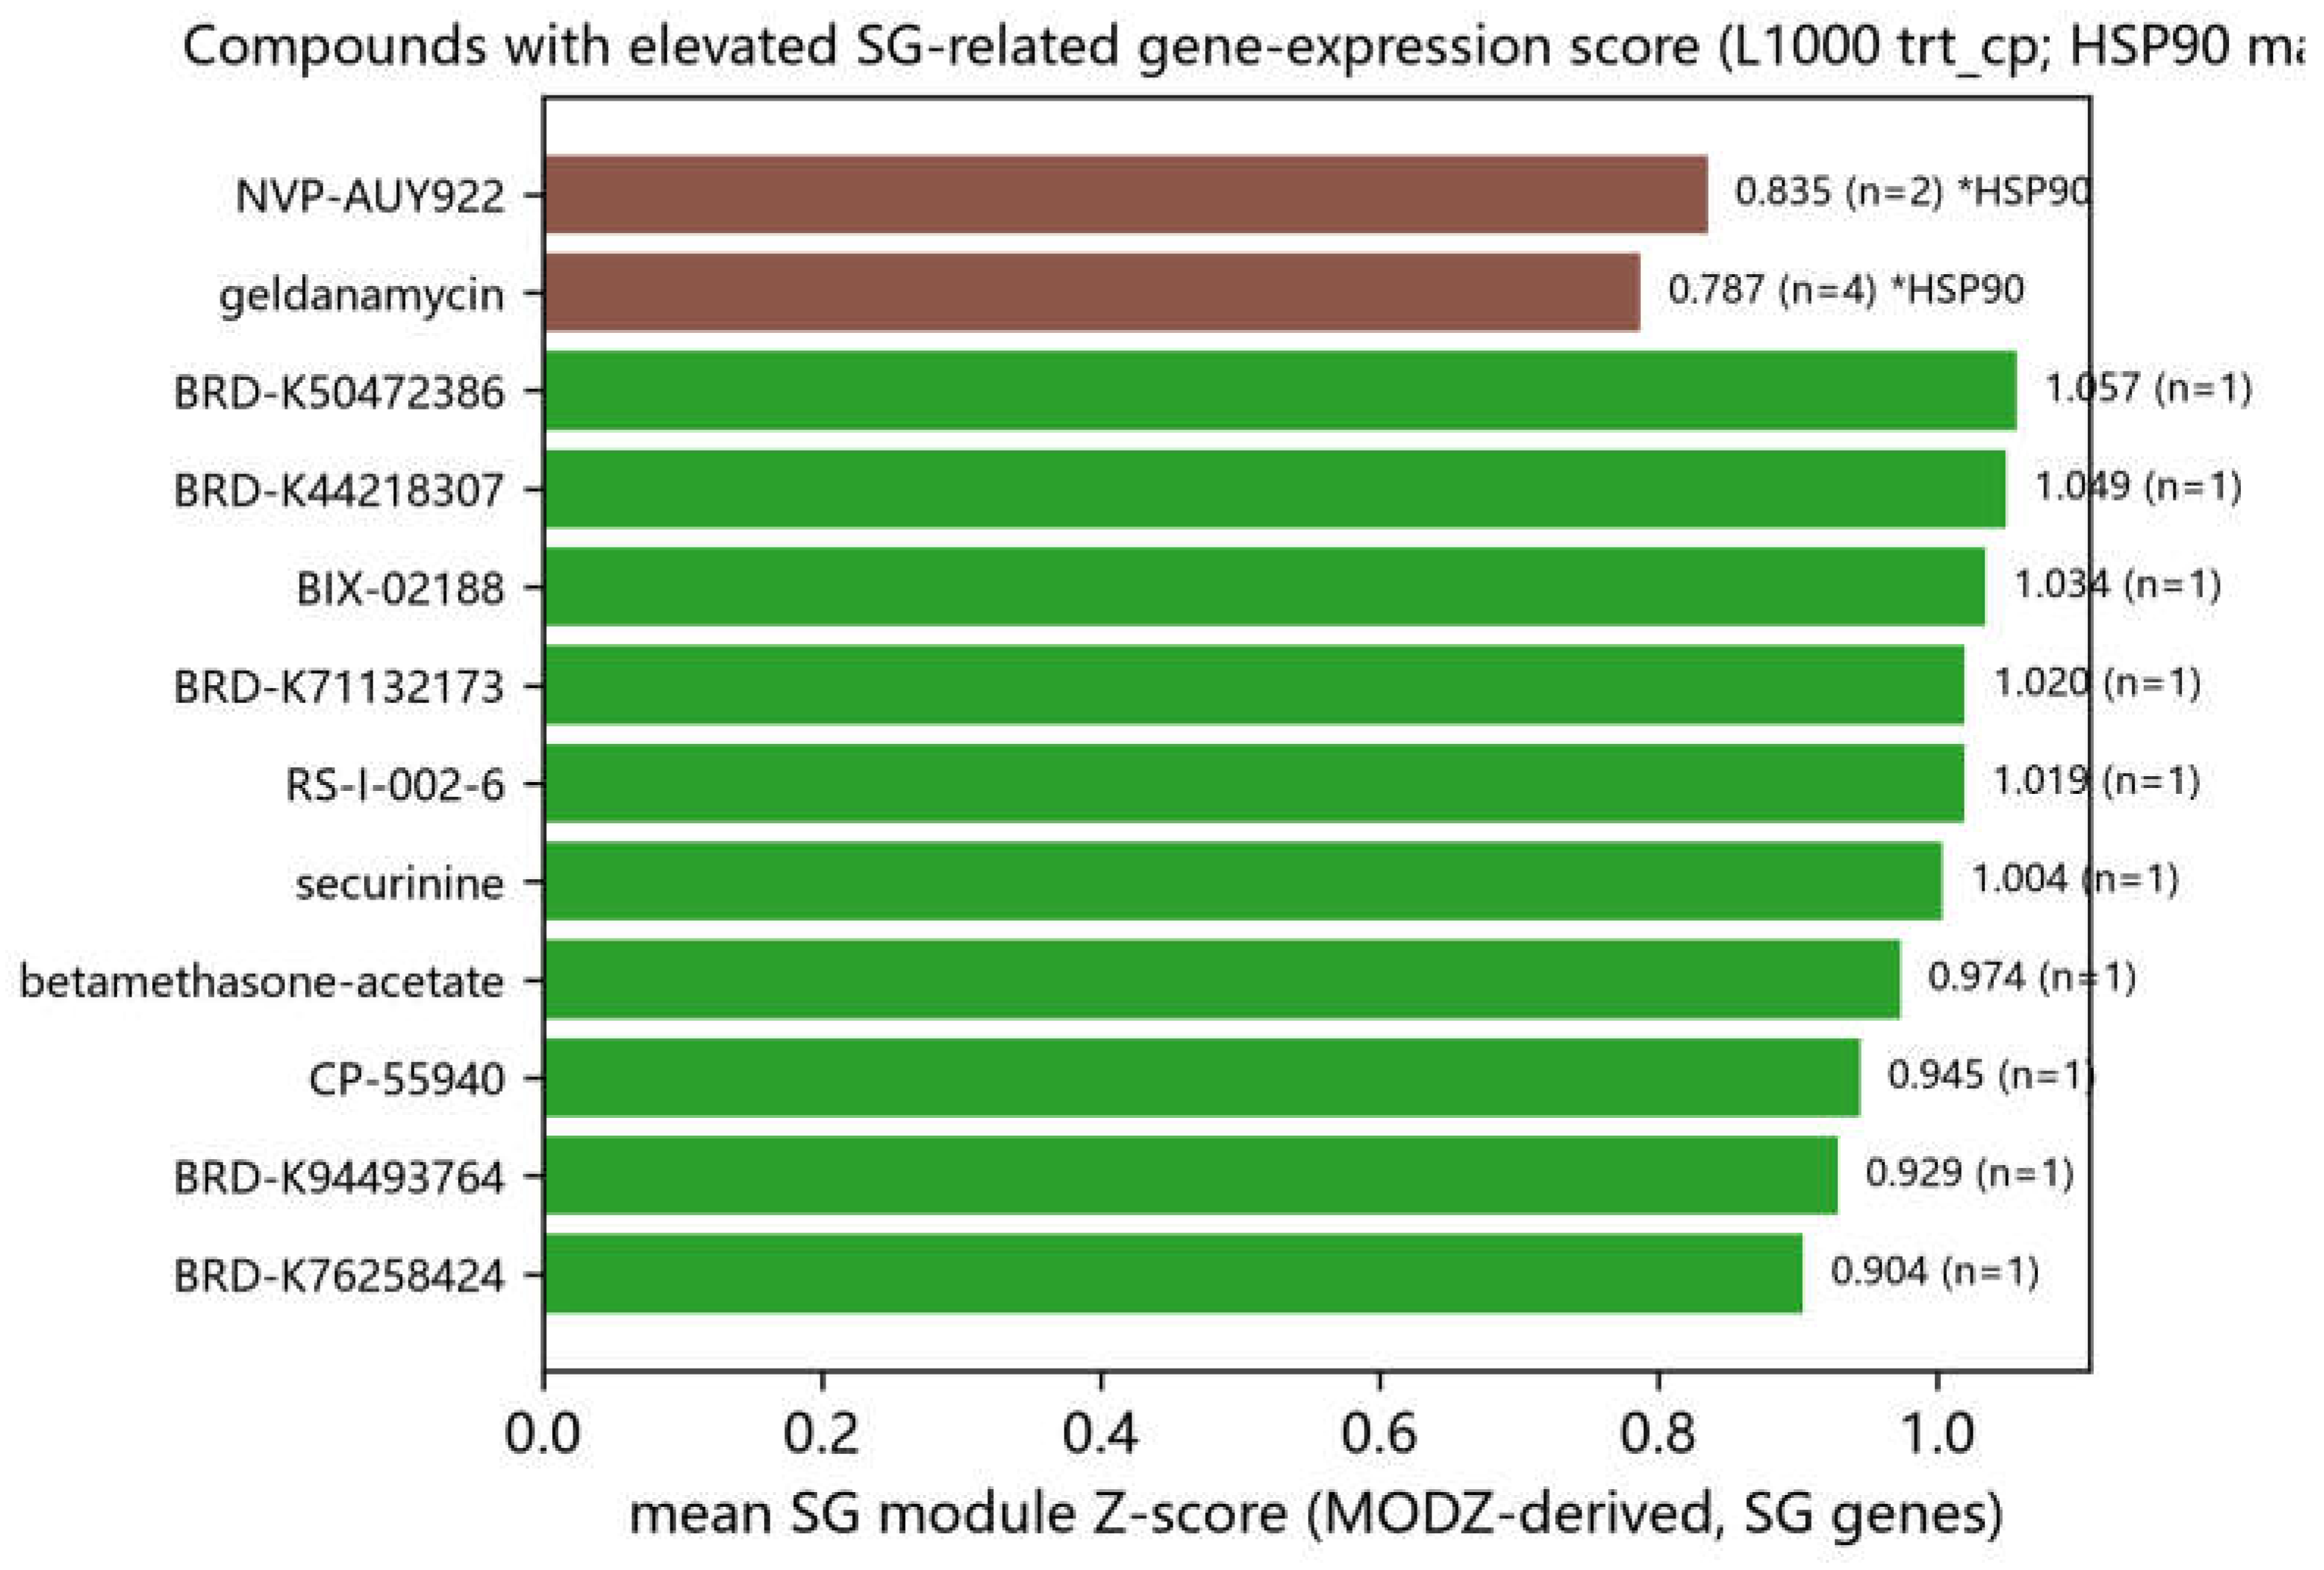
Figure 11.
| Efferocytosis mRNAs enriched in SG fractions (SG-fraction RNA versus total RNA, GSE263848; edgeR, FDR < 0.05; top 18 genes).
Figure 11.
| Efferocytosis mRNAs enriched in SG fractions (SG-fraction RNA versus total RNA, GSE263848; edgeR, FDR < 0.05; top 18 genes).
Disclaimer/Publisher’s Note: The statements, opinions and data contained in all publications are solely those of the individual author(s) and contributor(s) and not of MDPI and/or the editor(s). MDPI and/or the editor(s) disclaim responsibility for any injury to people or property resulting from any ideas, methods, instructions or products referred to in the content. |
© 2026 by the authors. Licensee MDPI, Basel, Switzerland. This article is an open access article distributed under the terms and conditions of the Creative Commons Attribution (CC BY) license (http://creativecommons.org/licenses/by/4.0/).
Copyright: This open access article is published under a Creative Commons CC BY 4.0 license, which permit the free download, distribution, and reuse, provided that the author and preprint are cited in any reuse.