

Submitted:
30 October 2026
Posted:
30 October 2026
You are already at the latest version
Abstract
Bitter melon (Momordica charantia L.) is widely used as an antidiabetic food and traditional remedy, but the causes of variation in its bioactive content remain unclear. This study aimed to investigate whether genotype or growing conditions are the primary determinants of this variation. ITS barcoding identified all ten accessions as M. charantia, but genetic relationships only partly corresponded to agricultural classification and did not predict chemotypes. The native Pathum Thani genotype was grown at four sites, and charantin content varied ninefold (2.56–23.73 mg/100 mg extract), exceeding the range observed among the ten accessions and showing a negative correlation with soil pH. In addition, fertilizer form affected the two markers in opposite ways: manure alone maximised charantin, whereas manure plus 15-15-15 fertilizer maximised momordicine, suggesting a potential trade-off between the sterol and cucurbitane biosynthetic pathways. Charantin was as potent as acarbose in inhibiting α-glucosidase and α-amylase, extract potency correlated with charantin content, and consensus docking predicted that the glucosyl moiety was positioned near the catalytic residues. In streptozotocin-injured β-cells, charantin conferred stronger cytoprotection, whereas momordicine induced the highest insulin release. The native Pathum Thani extract was consistently the most active, including in assays of myotube glucose uptake. Standardised bitter melon products therefore require both charantin and momordicine as quality-control markers, together with controlled cultivation practices, rather than selection based solely on agricultural classification.
Keywords:
Momordica charantia L
; fertilizer
; soil pH
; momordicine
; charantin
; α-glucosidase
; α-amylase
; molecular docking
1. Introduction
Bitter melon (Momordica charantia L., Cucurbitaceae), one of the most widely cultivated species among the approximately 60 species of Momordica, is consumed throughout South and Southeast Asia and is widely used in the management of diabetes [1,2,3]. Its fruit is rich in steroidal glycosides, triterpenoids, saponins, phenolics and polysaccharides [4], including approximately 200 cucurbitane-type triterpenoids, including momordicosides, karavilosides and momordicine [5]. The best-known constituent, charantin, is a mixture of β-sitosterol 3-O-β-D-glucoside and 5,25-stigmastadien-3β-ol 3-O-β-D-glucoside, and has been reported to exhibit hypoglycaemic, anticancer, anti-inflammatory and hepatoprotective effects [2,6].
For products and raw materials standardised for these compounds, Thai commercial, native and wild populations represent potential sources of high-yielding breeding material [7,8]. However, whether chemical differences among these populations are primarily determined by genetic or environmental factors remains unresolved [9]. Soil nutrients and fertilisation can influence secondary metabolism in other crops [10,11], yet their effects on charantin and momordicine accumulation in bitter melon have rarely been examined.
Here, we (i) investigated the relationships between internal transcribed spacer (ITS)-based genetic variation and charantin and momordicine contents among ten Thai accessions; (ii) disentangled genotypic and environmental effects by growing a single genotype at four sites and under five fertiliser regimes; and (iii) examined associations between marker-compound content and biological activity using digestive enzyme inhibition, molecular docking, and β-cell and myotube assays.
2. Results
2.1. ITS Identification and Genetic Relationships
Nucleotide BLAST (BLASTn) identified all ten accessions as M. charantia (86–99% identity; Table S4). The wild accessions from Nan (No. 9) and Mae Chaem, Chiang Mai (No. 10) showed the highest sequence similarity to M. charantia var. abbreviata (89% and 98%, respectively), whereas the native Surat Thani accession (No. 8) showed the highest similarity to M. charantia subsp. charantia (99%). Commercial accessions No. 1 and No. 2 shared six substitutions in the ITS2 region that were not detected in the other accessions and showed 98% sequence identity to each other, suggesting the presence of a distinct ribotype among these commercial seed sources.
Because the two primer pairs amplify non-overlapping spacer regions, the accessions were analysed as two groups (Figure 1). In Group A (ITS1 region, n = 5), pairwise sequence identity ranged from 72.9% to 86.0%, with the first and second principal coordinates (PCo1 and PCo2) explaining 46.6% and 33.4% of the variation, respectively. No clear grouping according to agricultural class was observed. The relatively low sequence of identities in this group may, at least in part, reflect differences in read quality and should therefore be interpreted cautiously. In Group B (ITS2 region, n = 5), pairwise sequence identity ranged from 92.9% to 100%, and PCo1 explained 94.3% of the variation, separating the commercial accessions No. 1 and No. 2 (98.0% sequence identity) from No. 4, No. 8 and No. 10 (98.0–100% sequence identity). The commercial accession No. 4 and the native accession No. 8 shared an identical sequence across the aligned region, indicating that ITS-based genetic relationships only partly corresponded to agricultural class.
2.2. Accessions Differ Widely in Charantin and Momordicine
Charantin content ranged from 2.12 to 18.02 mg/100 mg crude extract, whereas momordicine content ranged from not detected (ND) to 1.39 mg/100 mg (Table S5). In principal component analysis (PCA), principal component 1 (51.7%) showed similar positive loadings for charantin and momordicine (both 0.68) and therefore reflected variation in overall bioactive content, whereas PC2 (31.9%) was driven primarily by extraction yield (0.96) (Figure 2A). The two compounds were moderately correlated (r = 0.51), whereas neither compound showed a strong association with extraction yield (r ≈ 0.1).
Bioactive content was highest in Pathum Thani (No. 7, native; charantin, 18.02 mg/100 mg), Surat Thani (No. 8, native; charantin, 17.22 mg/100 mg; momordicine, 1.12 mg/100 mg) and Lam Takhong (No. 3, commercial). Lam Takhong (No. 3) had the highest momordicine content (1.39 mg/100 mg). Ratchaburi (No. 5) had the highest extraction yield (37.33%) but only moderate bioactive content, whereas Pak Chong (No. 4) and Chiang Mai (No. 10) had the lowest extraction yields (17.23% and 20.18%, respectively) (Figure 2B). Mantel tests detected no significant association between genetic and phytochemical distance matrices in either Group A (Spearman r = −0.22, P = 0.67) or Group B (r = 0.09, P = 0.37; 120 permutations each).
2.3. Soil Acidity Tracks a Nine-Fold Range in Charantin within One Genotype
Because chemotype did not correspond closely to ITS relationships, accession No. 7 was grown at four sites with contrasting soils (Figure 3). No. 7 was selected because it had the highest charantin content (Table S5) and its ITS sequence showed the highest similarity to M. charantia GQ845154.1 (Table S4). With genotype held constant, differences among sites primarily reflect environmental variation.
The Pathum Thani (PT) soil was strongly acidic (pH 4.7), with the highest electrical conductivity (EC; 0.27 dS m−1) and exchangeable potassium (Exch. K; 319.74 mg kg−1). The Lam Takhong (LT) soil was slightly alkaline (pH 7.5), with the lowest available phosphorus (Avail. P; 8.74 mg kg−1). The Surat Thani plots were near-neutral (pH 6.7–7.0) and had high available P concentrations (57.43–80.0 mg kg−1); Surat Thani plot 1 (ST1) had the lowest Exch. K (47.98 mg kg−1), whereas plot 2 (ST2) had the highest organic matter (OM; 3.71%).
Extraction yield ranged from 13.57 ± 1.02% (LT) to 19.40 ± 2.99% (ST1) and did not differ significantly among sites (analysis of variance (ANOVA), P > 0.05), but site differences were strongly associated with available P (r = 0.97, P = 0.032; Figure 3B, C).
Charantin content varied more than ninefold (Figure 3D), from 23.73 ± 0.25 mg/100 mg at PT to 8.17 ± 0.43 mg/100 mg at ST2, 3.37 ± 0.01 mg/100 mg at ST1 and 2.56 ± 0.50 mg/100 mg at LT. This ranking closely followed the soil pH gradient (r = −0.99, P = 0.010; Spearman ρ = −1.0). Charantin also showed positive correlations with EC (r = 0.89) and Exch. K (r = 0.66), although these correlations were not significant. Because PT gave only an intermediate extraction yield (15.90 ± 2.31%), the higher charantin concentration at PT reflected differences in extract composition rather than extraction yield.
Momordicine content was low and similar at PT, LT and ST2 (0.09–0.13 mg/100 mg) but was four- to sixfold higher at ST1 (0.54 ± 0.003 mg/100 mg) (Figure 3E), which had the highest available P concentration, lowest Exch. K and highest extraction yield. Momordicine correlated with Avail. P (r = 0.72), extraction yield (r = 0.60) and Exch. K (r = −0.69), but none of these correlations was statistically significant, and their interpretation is limited by the small number of sites and the influence of individual observations. Charantin and momordicine were not positively correlated across sites (r = −0.41).
PCA explained 82.8% of the variance (PC1, 59.2%; PC2, 23.6%; Figure 3A). PC1 separated the acidic, high-EC and high-K PT soil from the P-rich Surat Thani plots, whereas PC2 separated the alkaline LT soil. The charantin vector pointed towards PT, whereas the momordicine and extraction-yield vectors pointed towards ST1 and ST2. Because only four sites were compared and several soil variables were intercorrelated (EC–K, r = 0.91; P–K, r = −0.93), these associations should be regarded as hypothesis-generating rather than evidence of causal relationships.
2.4. Fertilizer Form Shifts the Balance Between Charantin and Momordicine
Treatment significantly affected the contents of both compounds (ANOVA, P < 0.001), with identical groupings in the Tukey and Duncan post hoc tests (Figure 4). Content did not increase proportionally with total nutrient input: estimated N, P and K inputs showed only weak correlations with either compound. Thus, the form and combination of fertilizer appeared to have a greater influence on compound content than the total nutrient input.
Momordicine content differed significantly among the five treatments (Tukey, P < 0.05). It was highest with manure plus 15-15-15 (T3; 7.28 ± 0.09 mg/100 mg), 2.7-fold higher than in the control (T5; 2.67 ± 0.03 mg/100 mg; Dunnett, P < 0.001), and intermediate with manure plus K-rich 13-13-21 (T4; 4.54 ± 0.04 mg/100 mg; P < 0.001). Manure alone at 1 t/rai resulted in approximately 20-fold lower momordicine content (T1; 0.13 ± 0.01 mg/100 mg; P < 0.001). At 2 t/rai (T2; 2.14 ± 0.20 mg/100 mg), momordicine content was lower than in the control according to Dunnett’s test (P < 0.001) but did not differ significantly from the control in the Games–Howell test (P = 0.13); therefore, T2 was considered comparable to the control for this comparison.
All fertilized treatments increased charantin content relative to the control (0.04 ± 0.003 mg/100 mg; Dunnett, P < 0.001). Charantin was highest with manure alone (T1; 0.44 ± 0.003 mg/100 mg), representing an approximately 11-fold increase over the control, intermediate in T2 and T3 (both 0.20 ± 0.003 mg/100 mg; Tukey, P = 1.0), and lowest in T4 (0.10 ± 0.003 mg/100 mg).
T1 thus produced the highest charantin content but the lowest momordicine content. The two compounds were inversely related across treatments (r = −0.48), consistent with the inverse relationship observed across sites (r = −0.41; Section 3.3). The treatment with the higher P supply (T3) resulted in higher momordicine content than the K-richer treatment T4, with T3 exceeding T4 by 1.6-fold (P < 0.001).
2.5. Charantin Drives Digestive Enzyme Inhibition: In Vitro and Docking Evidence
Authentic charantin inhibited α-glucosidase and α-amylase with potencies comparable to those of acarbose (half-maximal inhibitory concentration (IC50) 10.37 ± 0.34 vs. 11.05 ± 0.41 µg mL−1 and 22.49 ± 0.69 vs. 25.13 ± 1.21 µg mL−1, respectively; Dunnett, P > 0.05) and inhibited lipase more strongly than orlistat (26.03 vs. 37.93 µg mL−1; P < 0.001). Momordicine was significantly less potent than the reference inhibitors against all three enzymes (with IC50 values 1.7–2.5-fold higher; P < 0.05), with the largest difference observed for α-amylase (63.71 ± 0.56 µg mL−1) and the smallest for α-glucosidase (18.96 ± 1.24 µg mL−1). Both compounds showed greater inhibitory activity against α-glucosidase than α-amylase (Figure 5).
Among the extracts, inhibitory potency ranked No. 7 > No. 8 > No. 2 against all three enzymes (Tukey, P < 0.05 for all pairwise comparisons). The No. 7 extract was the most active against α-amylase (IC50 34.34 µg mL−1), although its activity remained significantly lower than that of acarbose (P < 0.001). This ranking was consistent with charantin content (18.02, 17.22 and 5.80 mg/100 mg, respectively; Table S5): charantin content was negatively correlated with IC50 values for all three enzymes, whereas no significant correlation was observed for momordicine (P > 0.5).
For α-glucosidase inhibition activity, the extracts were less active than predicted, suggesting that matrix components may attenuate inhibition. In contrast, for α-amylase inhibition, the No. 7 and No. 8 extracts were more active than predicted, suggesting that other constituents may contribute to the observed activity.
To explore the molecular basis of the observed enzyme-inhibitory activities, charantin A, charantin B and momordicine were docked into α-amylase (Protein Data Bank [PDB] ID 1XD0) and α-glucosidase (3TOP) using CHEMPLP, AutoDock Vina and Vinardo scoring functions, with each co-crystallised ligand used as the corresponding reference and ranked using the DockM8 consensus Z-score (Table 1). For α-amylase, all three compounds scored better than penta-acarbose with CHEMPLP (75.22–83.71 vs. 64.62) and Vinardo (−6.37 to −7.59 vs. −5.49 kcal mol−1), with both charantins scoring higher than momordicine. With Vina, charantin A (−9.88 kcal mol−1) scored slightly better than penta-acarbose (−9.65 kcal mol−1), charantin B showed a comparable score (−9.61 kcal mol−1), and momordicine gave the least favourable score (−9.35 kcal mol−1). Consensus Z-scores ranked charantin B (0.61) > charantin A (0.55) > momordicine (0.43), consistent with the stronger α-amylase inhibitory activity observed for charantin.
For α-glucosidase, all compounds scored better than acarbose with CHEMPLP (76.52–94.38 vs. 68.01) and Vinardo (−9.82 to −9.94 vs. −5.65 kcal mol−1). With Vina, only charantin B (−8.17 kcal mol−1) scored better than acarbose (−7.79 kcal mol−1). Z-scores showed a relatively narrow range (0.66–0.76), indicating similar predicted binding performance among the three compounds at the α-glucosidase site. This is consistent with the smaller difference in inhibitory potency between momordicine and charantin against α-glucosidase (1.8-fold) than against α-amylase (2.8-fold).
The charantins exhibited a conserved two-part binding mode (Figure 6 and Figure 7). In α-amylase, the glucose moiety of charantin A formed hydrogen bonds with catalytic Asp197 and Asp300, whereas its sterol nucleus formed alkyl and π-alkyl interactions with Ile51, Trp59, Ala106 and Val107. Charantin B showed a similar binding mode, with its glucose moiety forming a hydrogen bond with Arg195 and polar interactions with Asp197 and Asp300, while its sterol core formed hydrophobic contacts with Trp59. Momordicine, which lacks sugar moiety, formed hydrogen bonds with Tyr62 and catalytic Glu233 and a π-sigma interaction with Trp59 (Figure 6). In α-glucosidase, the glucose moiety of charantin A formed hydrogen bonds with Trp1355, Arg1510 and catalytic Asp1526, while its aglycone formed contacts with Trp1369 and Lys1460. Charantin B formed hydrogen bonds with Arg1455 and Asn1429, while its sterol moiety was surrounded by hydrophobic and aromatic residues, including Tyr1251, Ile1280, Ile1315, Trp1355, Trp1369, Met1421, Phe1427 and Phe1559. Momordicine formed a single hydrogen bond with Asp1157 and predominantly alkyl and π-alkyl interactions with Tyr1251, Ile1280, Trp1355, Phe1559 and His1584 (Figure 7).
Molecular docking using CHEMPLP, AutoDock Vina and Vinardo consistently predicted favourable interactions of charantin and momordicine with α-amylase and α-glucosidase relative to acarbose. In vitro, assays showed that extracts with higher charantin contents generally exhibited stronger enzyme-inhibitory activity. Furthermore, authentic charantin showed inhibitory potency comparable to that of acarbose, whereas authentic momordicine exhibited weaker inhibition. Together, these findings support a major contribution of charantin to the digestive enzyme-inhibitory activity of M. charantia and are consistent with the favourable binding predicted by molecular docking.
2.6. Charantin Is Linked to β-Cell Protection and Momordicine to Insulin Release
Streptozotocin (STZ; 5 mM) was used to model oxidative β-cell injury (Figure 8). Treatments differed significantly in cell survival, ROS inhibition and insulin release (P < 0.001), and all extracts showed concentration-dependent effects.
Cell protection. At 25 and 50 µg mL−1, all extracts provided greater protection than N-acetylcysteine (NAC) (18.48 ± 1.36%; Dunnett, P < 0.05). No. 7 showed the greatest protective effect (33.75 ± 2.34% at 50 µg mL−1; P < 0.001), comparable to that of authentic charantin at 25 µg mL−1 (32.43 ± 0.89%; P = 0.92). No. 7 also provided greater protection than NAC at 10 µg mL−1 (23.64 ± 0.34%; P = 0.001), whereas No. 2 and No. 8 did not. At 25 µg mL−1, the ranking was No. 7 = charantin > No. 8 ≥ No. 2 = momordicine ≥ NAC (Tukey, P < 0.05); both standards provided greater protection than NAC (charantin, P < 0.001; momordicine, 23.12 ± 1.49%, P = 0.004).
ROS inhibition. NAC reduced STZ-induced ROS levels by 32.72 ± 3.03%. Only No. 7 at 50 µg mL−1 showed significantly greater ROS inhibition than NAC (48.92 ± 3.25%; P < 0.001). No. 7 at 10–25 µg mL−1, No. 8 at 25–50 µg mL−1, No. 2 at 50 µg mL−1 and both standards (charantin, 31.95 ± 2.48%; momordicine, 35.64 ± 3.49%) did not differ significantly from NAC (P > 0.05). At 25 µg mL−1, only No. 2 showed lower ROS inhibition than NAC (21.37 ± 3.24%; P < 0.001).
Insulin release. Momordicine produced the highest insulin release (51.18 ± 1.24% of normal-cell levels), exceeding NAC (39.03 ± 2.16%), charantin (30.95 ± 1.36%) and pioglitazone (24.16 ± 1.41%) (P < 0.001); this was the only endpoint at which momordicine showed greater activity than charantin. Pioglitazone, an insulin sensitiser rather than a direct insulin secretagogue, gave the lowest release among the reference compounds. No. 7 at 50 µg mL−1 showed greater insulin release than NAC (44.31 ± 4.67%; P = 0.025), whereas No. 8 and No. 2 did not. All extracts at 50 µg mL−1, No. 8 at 25 µg mL−1 and No. 7 at 10–25 µg mL−1 showed greater insulin release than pioglitazone (P < 0.05). No. 7 maintained insulin release at lower concentrations (29.44 ± 2.16% at 10 µg mL−1; 22.09 ± 1.34% at 5 µg mL−1), whereas No. 8 (10.11%, 7.38%) and No. 2 (2.54%, 2.24%) showed marked declines and no detectable release at 2.5 µg mL−1. At 25 µg mL−1, the ranking was momordicine > NAC > No. 8 = No. 7 = charantin > pioglitazone > No. 2 (Tukey, P < 0.05).
2.7. Native Extracts Are Comparable to Pioglitazone in Myotube Glucose Uptake
All extracts increased glucose uptake in a concentration-dependent manner (Figure 9). Pioglitazone (33.83 ± 2.24%) produced greater glucose uptake than NAC (16.69 ± 1.57%; P < 0.001). At 50 µg mL−1, No. 7 (31.38 ± 3.19%) and No. 8 (28.96 ± 3.97%) did not differ significantly from pioglitazone (P = 0.91 and 0.20, respectively), whereas No. 2 showed lower glucose uptake (26.36 ± 2.34%; P = 0.011); all three showed greater glucose uptake than NAC (P < 0.001). At 25 µg mL−1, only No. 7 showed greater glucose uptake than NAC (26.25 ± 4.57%; P < 0.001; No. 2, 20.36%; No. 8, 16.68%). At 10 µg mL−1, none of the extracts differed significantly from NAC, whereas all extracts at 2.5 µg mL−1 and No. 2 and No. 8 at 5 µg mL−1 showed lower glucose uptake than NAC.
3. Discussion
3.1. Genetic Background Does Not Predict Chemotype
The antidiabetic properties of bitter melon are attributed mainly to steroidal glycosides such as charantin and cucurbitane triterpenoids such as momordicine [1,2,13,14]. Commercial, native and wild accessions are often assumed to differ in bioactive content, but ITS relationships only partially separated accessions according to agricultural class. Within Group B, the commercial accessions No. 1 and No. 2 shared a distinct ITS2 ribotype with six substitutions absent from the native and wild accessions, which may reflect a common breeding background among commercial seed sources, whereas commercial accession No. 4 was identical to native accession No. 8. Genetic similarity also failed to predict chemistry: No. 4 and No. 8 differed 3.6-fold in charantin content (4.78 vs. 17.22 mg/100 mg) and markedly in momordicine content (ND vs. 1.12 mg/100 mg), and Mantel tests detected no association between genetic and phytochemical distances in either group.
These results warrant cautious interpretation. ITS is a neutral, multicopy marker that is unlinked to secondary-metabolite biosynthesis and may be affected by intragenomic polymorphism and incomplete concerted evolution [15]. Identification also relied on single-direction reads of variable quality (Table S1). The ITS data therefore show that agricultural class is not a reliable proxy for chemotype, but do not establish whether variation at biosynthetic loci contributes to the observed chemical differences. Markers targeting biosynthetic genes, such as oxidosqualene cyclases, or genome-wide single-nucleotide polymorphisms (SNPs) would be needed [7].
3.2. Growing Environment Drives Charantin and Momordicine Accumulation
The single-genotype, multi-site comparison provided the clearest evidence for an environmental effect. Charantin in No. 7 varied more than nine-fold across sites (2.56–23.73 mg/100 mg), exceeding the range among the ten genetically distinct accessions (2.12–18.02 mg/100 mg). It was highest in the strongly acidic PT soil (pH 4.7) and correlated negatively with pH. Acidic soils impose stress through reduced nutrient availability and potential metal toxicity, and such stress is a recognised inducer of secondary metabolism [10,16]. The results also are consistent with the growth–differentiation balance hypothesis [77], which proposes that conditions limiting growth more than photosynthesis divert carbon to secondary metabolites. Extraction yield, a proxy for extractable biomass, increased with available P, whereas charantin peaked under the most growth-limiting, acidic conditions. Momordicine instead peaked at the high-P, low-K ST1 plot, indicating that the two compounds may respond differently to soil conditions.
The two Surat Thani plots differed two-fold in charantin, showing that plot-level soil properties, not only regional climate, may influence phytochemical accumulation. However, only four sites were compared, soil variables were intercorrelated (EC–K, r = 0.91; P–K, r = −0.93), and climate, altitude and harvest timing were confounded with site. These relationships should be tested in controlled experiments in which pH and nutrient supply are varied independently.
3.3. Fertiliser Form and Partitioning Between Sterol and Cucurbitane Pathways
The form of nutrient input, rather than its quantity, was associated with differences in phytochemical accumulation [11]: estimated N, P and K inputs were weakly correlated with either compound. Manure alone maximised charantin (11-fold above control) but nearly abolished momordicine, whereas manure plus 15-15-15 raised momordicine 2.7-fold. The compounds were inversely related across treatments and across sites, suggesting that their accumulation may be influenced by opposing regulatory responses.
Both compounds derive from 2,3-oxidosqualene. Cyclisation by cycloartenol synthase leads to phytosterols and hence to the sitosterol and stigmastadienol glucosides of charantin [1,18], whereas cucurbitadienol synthase initiates cucurbitane biosynthesis, as characterised in other Cucurbitaceae [19], leading to momordicine. Competition for this common precursor could contribute to the observed trade-off if nutrient supply differentially regulates the two cyclases. This hypothesis could be tested by quantifying cyclase expression and metabolite flux under contrasting fertiliser regimes.
Practically, moderate organic input favours charantin, whereas organic input plus balanced nitrogen–phosphorus–potassium (NPK) favours momordicine accumulation, and the T3–T4 contrast suggests that a higher P ratio favours momordicine, consistent with the site data. However, absolute contents in the fertiliser trial differed markedly from the other experiments: charantin was lower (0.04–0.44 vs. 2.12–23.73 mg/100 mg) and momordicine higher (0.13–7.28 vs. ND–1.39 mg/100 mg). Season, harvest stage or analytical basis may explain this, and these factors should be resolved before absolute values are compared across experiments.
3.4. Charantin as the Principal Determinant of Digestive Enzyme Inhibition
Authentic charantin inhibited α-glucosidase and α-amylase as effectively as acarbose, whereas momordicine was 1.8- to 2.8-fold less potent than charantin. Extract potency followed charantin content (No. 7 > No. 8 > No. 2) but not momordicine content: No. 8 contained six-fold more momordicine than No. 7 but was consistently less active. Charantin is thus a major contributor to carbohydrate-digestive enzyme inhibition by bitter melon extracts, complementing the insulin-mimetic and insulin-sensitising effects reported for other constituents [13,14].
Docking provided computational support for this interpretation. The glucosyl moiety of both charantins was predicted to hydrogen-bond with catalytic residues, Asp197 and Asp300 of α-amylase and Asp1526 of α-glucosidase, which also bind glucose units of the co-crystallised acarbose ligands [20,21], while the sterol core occupied adjacent hydrophobic subsites. Momordicine, lacking a sugar, formed fewer hydrogen bonds, consistent with its weaker activity. Because individual scoring functions often rank ligands differently [80], the scores should be interpreted as relative docking rankings rather than direct measures of binding affinity.
Extract activity was not fully explained by charantin. Against α-amylase, No. 7 and No. 8 were more active than predicted, suggesting possible additive or synergistic contributions from other constituents, as often seen in multi-component herbal extracts [23]. Against α-glucosidase, they were less active than predicted, suggesting possible attenuation by matrix components. The strong α-amylase inhibition of No. 7 (IC50 34.34 µg mL−1) supports the potential of charantin-rich extracts to limit postprandial glucose excursions, although a wider panel of accessions is needed because the content–activity correlation rests on three extracts.
3.5. Complementary Cellular Activities of Charantin and Momordicine
All extracts protected STZ-injured RIN-m5F cells in a concentration-dependent manner, and No. 7 at 50 µg mL−1 was as protective as authentic charantin. STZ enters β-cells via glucose transporter 2 (GLUT2) and causes DNA alkylation and oxidative stress [24], to which β-cells are vulnerable because of their low antioxidant enzyme capacity [25]. The ROS inhibition by No. 7 and No. 8, which matched or exceeded that of NAC, is therefore consistent with an antioxidant contribution to cytoprotection, as reported for NAC and other antioxidants [26]. The extracts acted at 25–50 µg mL−1, whereas NAC was used at 10 mM (≈1632 µg mL−1), although direct potency comparisons across compounds on a mass basis should be interpreted cautiously because their molecular masses and mechanisms differ.
Insulin release followed a different pattern. Momordicine was the most potent insulin secretagogue tested, in agreement with reports that cucurbitane-type saponins from M. charantia stimulate insulin secretion in vitro [85]. The two compounds thus may act through complementary mechanisms, with charantin mainly associated with cytoprotection and antioxidant defence and momordicine with insulin secretion. No. 7 sustained insulin release at low concentrations despite its low momordicine content, implying contributions from other constituents, possibly including preservation of β-cell viability by charantin.
In C2C12 myotubes, No. 7 and No. 8 at 50 µg mL−1 increased glucose uptake to levels comparable to pioglitazone, a peroxisome proliferator-activated receptor γ (PPARγ)-mediated insulin sensitiser [28]. Bitter melon cucurbitane triterpenoids promote GLUT4 translocation and glucose uptake via AMPK [14], which may contribute here, although this was not examined. Overall, the native Pathum Thani extract was the most consistently active across enzyme inhibition, β-cell protection, ROS inhibition, insulin release and glucose uptake, consistent with its high charantin content and supporting its potential as a candidate raw material for further evaluation.
3.6. Implications for Cultivation, Quality Control and Product Development
First, agricultural class and ITS identity do not predict bioactive quality, so raw materials should be selected by direct marker quantification. Second, charantin content tracked biological activity across the tested extracts and varied widely with growing conditions, making it a suitable marker for standardising extracts; momordicine is a useful additional marker when insulin secretagogue activity is targeted. Third, because site and fertiliser strongly affect marker content, sourcing and cultivation protocols (site, soil pH, fertiliser regime) should be defined and controlled. Clinical trials of bitter melon, including one in Thailand, have shown modest and variable glycaemic effects [29,30], and variable raw-material composition may contribute to this inconsistency.
3.7. Limitations
ITS sequences came from single-direction reads of variable quality, No. 2 was represented by an independent sample of the same cultivar, and the two primer pairs amplified non-overlapping regions, preventing a single analysis of all accessions. Soil–phytochemical correlations rest on four sites and content–activity correlations on three extracts, so these relationships are exploratory. The fertiliser trial covered one site and one season, and its absolute values differed from the other experiments. Docking used rigid human enzyme structures, whereas assays used porcine α-amylase and yeast α-glucosidase; molecular dynamics with molecular mechanics/generalised Born surface area (MM/GBSA) or molecular mechanics/Poisson–Boltzmann surface area (MM/PBSA) [31] and assays with human enzymes would strengthen the mechanistic interpretation. Finally, all bioactivity data are in vitro and mechanisms were inferred rather than tested. Future work should include bidirectional sequencing or genome-wide markers, multi-season and multi-site trials, controlled pH and nutrient experiments, and in vivo toxicological and efficacy studies of the most active extract.
4. Materials and Methods
4.1. Plant Material
Ten M. charantia accessions were sampled from across Thailand: four commercial cultivars (No. 1, Suphan Buri; No. 2, Ang Thong; No. 3, Lam Takhong, Nakhon Ratchasima; No. 4, Pak Chong, Nakhon Ratchasima), four native accessions (No. 5, Ratchaburi; No. 6, Chai Nat; No. 7, Pathum Thani; No. 8, Surat Thani) and two wild accessions (No. 9, Nan; No. 10, Chiang Mai). Accessions were classified as commercial (cultivars grown from seed sold to farmers), native (local landraces maintained by farmers or occurring spontaneously near cultivated areas, with medium to large fruits) or wild (spontaneous populations occurring in natural habitats, with small, fusiform fruits 3.0–6.0 cm long and 2.5–4.0 cm in diameter, consistent with M. charantia var. abbreviata). Voucher specimens of samples No. 1, No. 7 and No. 8 were deposited at the Thailand Institute of Scientific and Technological Research (TISTR) Herbarium, Lamtakhong Research Station, Nakhon Ratchasima, Thailand, under accession numbers TISTR 1356, TISTR 1354 and TISTR 1355, respectively.
4.2. DNA Extraction, ITS Amplification and Sequencing
Genomic DNA was extracted from young leaves (100 mg) using a modified cetyltrimethylammonium bromide (CTAB) method [32,33]. Tissue was ground in liquid nitrogen and incubated at 65 °C for 30 min in 750 µL of CTAB buffer (2% CTAB, 1.4 M NaCl, 1% polyvinylpyrrolidone (PVP), 0.1% sodium metabisulfite, 100 mM Tris-HCl pH 8.0, 20 mM ethylenediaminetetraacetic acid (EDTA) and 0.4% 2-mercaptoethanol), followed by two extractions with chloroform alcohol (24:1, v/v). Before the second extraction, 10% CTAB/0.7 M NaCl was added. DNA was precipitated with ice-cold isopropanol (4 °C, 2 h), washed with 70% ethanol, dissolved in 20 µL of sterile water and stored at −20 °C. DNA integrity was assessed by electrophoresis on 1.0% agarose gels in 1× Tris–acetate–EDTA (TAE) buffer (100 V, 30 min; Novel Juice, GeneDireX; 1-kb ladder).
The nuclear ribosomal ITS region, a widely used plant DNA barcode [34], was amplified with two primer pairs [35]: ITS1/ITS2, spanning the ITS1 spacer, and ITS3/ITS4, spanning the ITS2 spacer. Each 12-µL reaction contained 1× Taq buffer, 0.2 mM of each deoxynucleoside triphosphate (dNTP), approximately 1 mM additional MgCl2, 2.5 pmol of each primer, Taq DNA polymerase (all Vivantis) and 10 ng of template DNA. Cycling conditions were 94 °C for 3 min, followed by 30 cycles of 94 °C for 30 s, 55 °C for 30 s and 72 °C for 1 min, with a final extension at 72 °C for 5 min. Single-band amplicons (visualised against a 100-bp DNA ladder; Fermentas) were Sanger-sequenced in both directions.
Five accessions (No. 3, No. 5, No. 6, No. 7 and No. 9) were amplified with ITS1/ITS2 (Group A, covering the ITS1 region), whereas the remaining five (No. 1, No. 2, No. 4, No. 8 and No. 10) were amplified with ITS3/ITS4 (Group B, covering the ITS2 region). Because the two amplicons did not overlap after primer trimming, the groups were analysed separately. Reads were quality-trimmed using BioEdit v7.2.5 [36]. Forward and reverse reads were not assembled into contigs because homopolymer runs made assembly unreliable. Instead, the higher-quality read from each accession was used for identification, and the complementary read, where usable, was used to verify base calls. Sequences were identified by BLASTn [37] searches against the GenBank nucleotide database (Table S1).
4.3. Sequence Alignment and Genetic Distance Analysis
For genetic-distance analysis, the reverse-primer reads (ITS2 for Group A and ITS4 for Group B), which were usable for all accessions, were trimmed to the high-quality region aligned in BLASTn (Group A) or to the region between conserved motifs flanking ITS2 (Group B). Within each group, sequences were aligned using MAFFT v7.505 (L-INS-i) [38,39], and alignments were trimmed to the region shared by all sequences (258 bp for Group A and 253 bp for Group B). Pairwise distance matrices (identity model) were computed with Biopython [40] and used to construct neighbour-joining trees [41] and UPGMA clusters [42] using SciPy [43], and for principal coordinate analysis (PCoA; classical scaling) [44,45].
4.4. Multi-Site Soil Comparison
The native accession No. 7 (whose ITS sequence showed the best match to GenBank accession GQ845154.1) was grown at four farmer-managed sites with contrasting soils: Pathum Thani (PT), Lam Takhong, Nakhon Ratchasima (LT), and two plots in Surat Thani (ST1 and ST2). Fruits from each site were analysed for charantin and momordicine (as described in Section 4.6). Three composite soil samples per site were collected at a depth of 0–20 cm, air-dried and sieved (2 mm). Soil pH [46], electrical conductivity (EC) [47], organic matter (OM) [48], available phosphorus (Avail. P) [49] and exchangeable potassium (Exch. K) [50] were determined using standard methods.
4.5. Controlled Fertiliser Trial
Accession No. 7 was grown at a single site (Lam Takhong, Nakhon Ratchasima, Thailand) from February to May 2026 under five fertiliser treatments: T1, dairy manure at 1 t rai−1 (6.25 t ha−1); T2, dairy manure at 2 t rai−1 (12.5 t ha−1); T3, dairy manure at 1 t rai−1 plus 15-15-15 compound fertiliser at 30 kg rai−1 (187.5 kg ha−1); T4, dairy manure at 1 t rai−1 plus 13-13-21 compound fertiliser at 30 kg rai−1 (187.5 kg ha−1); and T5, an unfertilised control (1 rai = 0.16 ha). The manure contained 1.72% N, 0.85% P, 2.13% K and 27.75% organic C (C/N ratio 16.1) [12]. Each plot measured 1 × 10 m and contained 20 plants. Treatments were arranged in a randomised complete block design (RCBD) with three replicates. Charantin and momordicine contents in fruits were determined by high-performance liquid chromatography (HPLC) (Section 4.6).
4.6. Chemical Analysis
HPLC analysis was performed on a Waters Alliance 2695 system with a 2998 photodiode array (PDA) detector and Empower software (Waters, Milford, MA, USA), using a Luna C8 column (250 × 4.6 mm, 5 µm; Phenomenex, Torrance, CA, USA) at 30 °C. The mobile phase consisted of 0.1% (v/v) formic acid in water (A) and acetonitrile (B) at 1.0 mL min−1, with A decreased from 10% to 5% (0–5 min) and to 2% (5–25 min), then returned to 10% (25–27 min) and held at 10% until 30 min. The injection volume was 10 µL and detection was at 224 nm. Charantin (ChromaDex, Los Angeles, CA, USA; Cat. No. 00003386; charantin A 79.57%, charantin B 11.16%) and momordicine (≥98%; ChemFaces, Wuhan, China; Cat. No. CFN92076) were quantified by external calibration. Charantin was quantified as the sum of the charantin A and B peak areas. Momordicine showed linearity over 50–200 µg mL−1 (R2 = 0.9994). Charantin was calibrated over two ranges, 50–150 µg mL−1 (R2 = 0.9973) and 150–500 µg mL−1 (R2 = 0.9974); samples with peak areas below that of the 150 µg mL−1 standard were quantified using the low-range equation (Figure S1). Contents are expressed as mg/100 mg crude extract.
4.7. Biological Assays
Crude extracts of three accessions (No. 2, commercial; No. 7 and No. 8, native), spanning a three-fold range of charantin content (5.80–18.02 mg/100 mg; Table S2), and authentic charantin and momordicine standards were tested in parallel.
4.7.1. Enzyme Inhibition
α-Amylase. Following Spínola and Castilho [51], with modifications, samples (50 µL) in 0.02 M phosphate-buffered saline (PBS) were mixed with 50 µL of 0.5% starch in PBS and pre-incubated at 37 °C for 5 min. Porcine pancreatic α-amylase (EC 3.2.1.1; 0.1 U mL−1, 50 µL) was added and incubated at 37 °C for 10 min. Lugol’s solution (100 µL) was then added, and absorbance was measured at 585 nm.
α-Glucosidase. Following [51], samples (10 µL), Saccharomyces cerevisiae α-glucosidase (EC 3.2.1.20; 0.1 U mL−1, 40 µL) in 0.1 M sodium phosphate buffer (pH 6.9) and 0.1 M potassium phosphate buffer (50 µL) were incubated at 37 °C for 10 min. p-Nitrophenyl-α-D-glucopyranoside (1 mM, 50 µL) was added, and the mixture was incubated at 37 °C for 20 min. The reaction was stopped with 1 M Na2CO3 (100 µL), and absorbance was measured at 405 nm.
Acarbose was used as the positive control for α-amylase and α-glucosidase. Inhibition (%) was calculated as [1 − (A_S − A_SB)/(A_C − A_CB)] × 100, where A_C, A_CB, A_S and A_SB are the absorbances of the enzyme control, control blank, sample and sample blank, respectively. IC50 values were obtained by linear regression of inhibition against the logarithm of concentration. All assays were performed in triplicate.
4.7.2. Cell-Based Assays
Cell culture. RIN-m5F rat pancreatic β-cells (CRL-11605) and C2C12 mouse myoblasts (CRL-1772) were obtained from the American Type Culture Collection (ATCC; Manassas, VA, USA) and cultured in Dulbecco’s modified Eagle’s medium (DMEM) supplemented with 10% foetal bovine serum (FBS) and 1% penicillin–streptomycin (all Gibco) at 37 °C in 5% CO2. Cells at passages 1–5 were used. For glucose-uptake assays, confluent C2C12 cells were differentiated into myotubes in DMEM supplemented with 2% horse serum for 4 days.
Cytotoxicity. Viability was assessed using the (MTT) assay. 3-(4,5-dimethylthiazol-2-yl)-2,5-diphenyltetrazolium bromide (MTT) assay, modified from ISO 10993-5 [52]. Cells (1 × 10⁴ cells well−1, 96-well plates) were grown to approximately 90% confluence for 48 h and treated for 48 h with samples (2.5–50 µg mL−1); untreated and vehicle (dimethyl sulfoxide [DMSO] ≤ 1.0%) controls were included. MTT (0.5 mg mL−1) was added for 2 h, formazan was dissolved in DMSO (100 µL) and absorbance was measured at 570 nm (Multiskan GO, Thermo Fisher Scientific, Vantaa, Finland). Viability ≥70% of the medium control was considered non-cytotoxic [52], and only concentrations meeting this criterion were used in subsequent assays.
STZ-induced injury. Adapted from Al Nahdi et al. [53], RIN-m5F cells (2 × 10⁵ cells mL−1, 96-well plates) in RPMI-1640 were incubated for 24 h and then treated for 24 h with samples in the presence or absence of streptozotocin (STZ; 5 mM; 100 µL well−1). N-acetylcysteine (NAC; 10 mM) was used as the positive control. Viability was measured using the MTT assay, and cell survival (%) was calculated as:
Insulin secretion. Modified from Ahmed et al. [54], RIN-m5F cells (2 × 10⁵ cells well−1, 24-well plates) were exposed to STZ (5 mM) in the presence of test samples for 24 h and then incubated for a further 24 h in high-glucose (25 mM) medium containing extracts (2.5–50 µg mL−1), charantin or momordicine (25 µg mL−1), NAC (10 mM) or pioglitazone (25 µg mL−1). Cells not exposed to STZ served as the normal control. Insulin in the supernatant was measured using an enzyme-linked immunosorbent assay (ELISA; ab277390, Abcam, Cambridge, UK) and expressed as a percentage of the normal control.
Intracellular ROS. RIN-m5F cells (approximately 1 × 10⁵ cells mL−1, black clear-bottom 96-well plates) were treated with STZ (5 mM) plus extracts (2.5–50 µg mL−1), standards (25 µg mL−1) or NAC (10 mM) for 24 h. Cells were then loaded with 5 µM 2′,7′-dichlorodihydrofluorescein diacetate (DCFH-DA; Abcam) for 30 min at 37 °C in the dark and washed twice with PBS. Fluorescence was measured at an excitation/emission wavelength of 485/535 nm, and fluorescence was visualised by fluorescence microscopy (Olympus, Tokyo, Japan).
ROS inhibition (%) was calculated as
Glucose uptake. Glucose uptake was measured using a 2-(N-(7-nitrobenz-2-oxa-1,3-diazol-4-yl)amino)-2-deoxyglucose (2-NBDG) kit (ab235976, Abcam), with modifications based on Jiang et al. [55]. C2C12 cells (1 × 10⁴ cells well−1, 96-well plates) were differentiated as described above and treated for 24 h with extracts (2.5–50 µg mL−1), pioglitazone (25 µg mL−1) or NAC (10 mM); untreated cells served as the negative control. Cells were incubated with 2-NBDG (100 µg mL−1) in serum-free medium for 2 h at 37 °C, washed, lysed in assay buffer (100 µL) and centrifuged at 400 × g for 5 min. Supernatant fluorescence was measured at 485/535 nm.
Uptake (%) was calculated as:
4.8. Statistical Analysis
Data are expressed as mean ± standard deviation (SD) from at least three independent replicates. Treatments were compared using one-way ANOVA [56], followed by Tukey’s honestly significant difference (HSD) test [57] for pairwise comparisons and Dunnett’s test [58] for comparisons with a control. Duncan’s test [59] was used as a confirmatory analysis in the fertiliser trial, chemical analysis and biological activity assays. Because variances were unequal in some groups, Games–Howell tests [60] were used as a sensitivity analysis. Two groups were compared using Student’s t-test [61]. Statistical significance was set at P < 0.05.
Multivariate analyses were performed using Python 3 [62] with Biopython [40], SciPy [43] and scikit-learn [63]. PCA [64,65,66] was applied to z-standardised data for (i) extraction yield, charantin and momordicine across the ten accessions (n = 10; non-detected values were assigned a value of zero) and (ii) soil properties and phytochemical content across the four sites (n = 4). Pearson correlations [67] across sites (df = 2) were reported as exploratory analyses. Associations between genetic and phytochemical distances were tested within each group (n = 5) using a Mantel test [68].
4.9. Molecular Docking
Protein preparation. Structures of human pancreatic α-amylase complexed with an acarbose-derived pentasaccharide (PDB ID: 1XD0) [20] and the C-terminal subunit of human maltase-glucoamylase complexed with acarbose (PDB ID: 3TOP) [21] were retrieved from the Protein Data Bank [69]. For SMINA and DockM8, water molecules, ions and co-crystallised ligands were removed, hydrogens were added and Gasteiger charges were assigned using AutoDockTools [70,71]. For GOLD, proteins were prepared using the built-in preparation protocol.
Ligand preparation. Charantin A (β-sitosterol 3-O-β-D-glucoside), charantin B (5,25-stigmastadien-3β-ol 3-O-β-D-glucoside) and momordicine I were pre-optimised using GFN2-xTB [72] (100 cycles) and subsequently fully optimised at the BP86/def-SV(P) level [73,74,75] in TmoleX [76].
Docking. Binding sites were centred at (9.369, 15.436, 39.935) for α-amylase and (−31.528, 35.645, 26.388) for α-glucosidase. In GOLD 5.3.0 [77], the binding site comprised all atoms within 10 Å of the centre, and poses were scored using CHEMPLP [78]; all other parameters were left at their default settings. In SMINA [79], a 40 × 40 × 40 Å box was used with the AutoDock Vina [80] and Vinardo [81] scoring functions. The co-crystallised ligand for each enzyme was docked under the same conditions as a reference.
Consensus scoring. The best GOLD and SMINA poses were submitted to DockM8 [82], using Gypsum-DL for ligand preparation and GNINA [83] for docking. Poses were selected based on root-mean-square deviation (RMSD) and KORP-PL and rescored using KORP-PL, Convex-PLR, CNN-Score and RF-Score-VS as implemented in DockM8 [82]. Compounds were ranked according to the consensus Z-score (Zscore best). Interactions of the top-ranked poses, including hydrogen bonds, π-interactions and hydrophobic contacts, were analysed using BIOVIA Discovery Studio 2020 Client (version 20.1) [84].
5. Conclusions
Growing conditions strongly influenced the bioactive composition of Thai bitter melon, whereas ITS-based genetic relationships did not predict phytochemical profiles. Within a single genotype, charantin content varied more than nine-fold across sites and was associated with soil acidity, while fertiliser form altered the relative accumulation of charantin and momordicine, consistent with differential regulation of the sterol and cucurbitane biosynthetic pathways. Charantin was a major contributor to digestive enzyme inhibition and was associated with β-cell cytoprotection, whereas momordicine showed the strongest insulin-secretagogue activity. The native Pathum Thani accession (No. 7) combined the highest charantin content with the most consistent antidiabetic activities across the assays tested and therefore represents a promising candidate raw material. Standardisation of bitter melon products should therefore consider both charantin and momordicine as complementary quality markers, together with defined cultivation practices to minimise variation in bioactive composition.
Supplementary Materials
The following supporting information can be downloaded at the website of this paper posted on Preprints.org. Table S1: BLASTn identification of ITS sequences; Table S2: Extraction yield, charantin and momordicine contents of the ten accessions; Table S3: Soil properties and phytochemical contents at the four sites.
Author Contributions
Conceptualization, U.R.; methodology, U.R.; investigation, Sa.L. (cell-based assays), P.K., W.P and Si.L. (extraction), B.K. (HPLC analysis), T.I., C.K., T.T. and R.C. (DNA extraction and field cultivation), and A.S. and S.P. (enzyme inhibition assays); resources, T.I. and R.C.; formal analysis, Y.T. and W.I. (molecular docking) and U.R. (statistical and multivariate analyses); writing—original draft preparation, U.R. and T.I.; writing—review and editing, U.R., T.I. and all authors. All authors have read and agreed to the published version of the manuscript.
Funding
This research was funded by the Agricultural Research Development Agency (Public Organization; ARDA), Thailand, under grant number PRP6807031370, and the Thailand Institute of Scientific and Technological Research (TISTR).
Acknowledgments
The authors gratefully acknowledge the Agricultural Research Development Agency (Public Organization; ARDA) and the Thailand Institute of Scientific and Technological Research (TISTR) for their institutional and research support. The authors also sincerely thank OD Innovacosmex Ltd. and Chememan Ltd. for providing land and supporting the field cultivation activities undertaken as part of this research.
Conflicts of Interest
The authors declare no conflicts of interest.
Abbreviations
The following abbreviations are used in this manuscript:
| 2-NBDG | 2-(NN-(7-nitrobenz-2-oxa-1,3-diazol-4-yl)amino)-2-deoxyglucose |
| AMPK | AMP-activated protein kinase |
| ANOVA | Analysis of variance |
| ARDA | Agricultural Research Development Agency |
| ATCC | American Type Culture Collection |
| Avail. P | Available phosphorus |
| BLASTn | Nucleotide Basic Local Alignment Search Tool |
| CTAB | Cetyltrimethylammonium bromide |
| DCFH-DA | 2′,7′-Dichlorodihydrofluorescein diacetate |
| DMEM | Dulbecco’s modified Eagle’s medium |
| DMSO | Dimethyl sulfoxide |
| dNTP | Deoxynucleoside triphosphate |
| DW | Dry weight |
| EC | Electrical conductivity |
| EDTA | Ethylenediaminetetraacetic acid |
| ELISA | Enzyme-linked immunosorbent assay |
| Exch. K | Exchangeable potassium |
| FBS | Fetal bovine serum |
| GLUT2/GLUT4 | Glucose transporter 2/4 |
| HPLC | High-performance liquid chromatography |
| HSD | Honestly significant difference |
| IC50 | Half-maximal inhibitory concentration |
| ITS | Internal transcribed spacer |
| LT | Lam Takhong |
| MM/GBSA | Molecular mechanics/generalized Born surface area |
| MM/PBSA | Molecular mechanics/Poisson–Boltzmann surface area |
| MTT | 3-(4,5-Dimethylthiazol-2-yl)-2,5-diphenyltetrazolium bromide |
| NAC | N-Acetylcysteine |
| ND | Not detected |
| NPK | Nitrogen, phosphorus and potassium |
| OM | Organic matter |
| PBS | Phosphate-buffered saline |
| PC1/PC2 | Principal component 1/2 |
| PCA | Principal component analysis |
| PCo1/PCo2 | Principal coordinate 1/2 |
| PCoA | Principal coordinate analysis |
| PDA | Photodiode array |
| PDB | Protein Data Bank |
| PPARγ | Peroxisome proliferator-activated receptor gamma |
| PT | Pathum Thani |
| PVP | Polyvinylpyrrolidone |
| RCBD | Randomized complete block design |
| RMSD | Root-mean-square deviation |
| ROS | Reactive oxygen species |
| SD | Standard deviation |
| SNP | Single-nucleotide polymorphism |
| ST1/ST2 | Surat Thani plots 1 and 2 |
| STZ | Streptozotocin |
| T1–T5 | Fertilizer treatments 1–5 |
| TAE | Tris–acetate–EDTA |
| TISTR | Thailand Institute of Scientific and Technological Research |
| UPGMA | Unweighted pair group method with arithmetic mean |
References
- Gayathry, K.S.; John, J.A. A Comprehensive Review on Bitter Gourd (Momordica charantia L.) as a Gold Mine of Functional Bioactive Components for Therapeutic Foods. Food Prod. Process. Nutr. 2022, 4, 1. [Google Scholar] [CrossRef]
- Abbas, A.; Tabassum, I.; Vohra, S.; Weiskirchen, R.; Shoukat, A.; Afzal, M.K.; Ijaz, A.; Anees, N.; Chaudhary, A.A.; Alhudhaibi, A.M. Momordica charantia L.: Nutritional Composition, Advanced Extraction Methods, Phy-tochemistry, Molecular Mechanisms and Industrial Applications. Antioxidants 2026, 15, 839. [Google Scholar] [CrossRef] [PubMed]
- Sharma, S.K.; Baliyan, P.; Alam, A. Momordica charantia L.: Unlocking Its Potential as a Nutritional Food Through Ethnomedicinal and Pharmacological Properties. Res. J. Bot. 2024, 19, 3140. [Google Scholar] [CrossRef]
- Tanwar, S.; Dhakad, P.; Dhingra, G.; Tanwar, K. A Review on Salient Pharmacological Features and Chemical Constituents of Bitter Melon. Biol. Sci. 2022, 2, 229–239. [Google Scholar] [CrossRef]
- Sun, L.; Zhang, X.; Dong, L.; Zhang, C.; Guo, P.; Wu, C. The Triterpenoids of the Bitter Gourd (Momordica charantia) and Their Pharmacological Activities: A Review. J. Food Compos. Anal. 2021, 96, 103726. [Google Scholar] [CrossRef]
- Deligiannidou, G.-E.; Pritsa, A.; Nikolaou, A.; Poulios, E.; Kontogiorgis, C.; Papadopoulou, S.K.; Giaginis, C. Nutraceutical Potential of Bitter Melon (Momordica charantia) on Cancer Treatment: An Overview of In Vitro and Animal Studies. Curr. Issues Mol. Biol. 2025, 47, 425. [Google Scholar] [CrossRef] [PubMed]
- Mallikarjuna, K.N.; Tomar, B.S.; Mangal, M.; Singh, N.; Singh, D.; Kumar, S.; et al. Genetic Diversity and Popula-tion Structure Analyses in Bitter Gourd (Momordica charantia L.) Based on Agro-Morphological and Microsatel-lite Markers. Plants 2023, 12, 3512. [Google Scholar] [CrossRef] [PubMed]
- Karaman, K.; Dalda-Şekerci, A.; Yetişir, H.; Gülşen, O.; Coşkun, Ö.F. Molecular, Morphological and Biochemical Characterization of Some Turkish Bitter Melon (Momordica charantia L.) Genotypes. Ind. Crops Prod. 2018, 123, 93–99. [Google Scholar] [CrossRef]
- Chiangchin, S.; Thongyim, S.; Pandith, H.; Kaewkod, T.; Tragoolpua, Y.; Inta, A.; et al. Clinacanthus nutans Ge-netic Diversity and Its Association with Anti-Apoptotic, Antioxidant, and Anti-Bacterial Activities. Sci. Rep. 2023, 13, 19457. [Google Scholar] [CrossRef] [PubMed]
- Yang, L.; Wen, K.S.; Ruan, X.; Zhao, Y.X.; Wei, F.; Wang, Q. Response of Plant Secondary Metabolites to Envi-ronmental Factors. Molecules 2018, 23, 762. [Google Scholar] [CrossRef] [PubMed]
- Bustamante, M.A.; Michelozzi, M.; Barra Caracciolo, A.; Grenni, P.; Verbokkem, J.; Geerdink, P.; Safi, C.; Nogues, I. Effects of Soil Fertilization on Terpenoids and Other Carbon-Based Secondary Metabolites in Rosmarinus offic-inalis Plants: A Comparative Study. Plants 2020, 9, 830. [Google Scholar] [CrossRef] [PubMed]
- Chumphong, S. Technical Document No. 19/2548; Organic Materials and Animal Manures in Agricultural Areas. (In Thai). Chumphon Horticultural Research Centre, Department of Agriculture: Bangkok, Thailand, 2005.
- Oyelere, S.F.; Ajayi, O.H.; Ayoade, T.E.; Pereira, G.B.; Owoyemi, B.C.D.; Ilesanmi, A.O.; et al. A Detailed Review on the Phytochemical Profiles and Anti-Diabetes Mechanisms of Momordica charantia. Heliyon 2022, 8, e09253. [Google Scholar] [CrossRef] [PubMed]
- Tan, M.J.; Ye, J.M.; Turner, N.; Hohnen-Behrens, C.; Ke, C.Q.; Tang, C.P.; Chen, T.; Weiss, H.C.; Gesing, E.R.; Rowland, A.; et al. Antidiabetic Activities of Triterpenoids Isolated from Bitter Melon Associated with Activa-tion of the AMPK Pathway. Chem. Biol. 2008, 15, 263–273. [Google Scholar] [CrossRef] [PubMed]
- Álvarez, I.; Wendel, J.F. Ribosomal ITS Sequences and Plant Phylogenetic Inference. Mol. Phylogenet. Evol. 2003, 29, 417–434. [Google Scholar] [CrossRef] [PubMed]
- Ramakrishna, A.; Ravishankar, G.A. Influence of Abiotic Stress Signals on Secondary Metabolites in Plants. Plant Signal. Behav. 2011, 6, 1720–1731. [Google Scholar] [CrossRef] [PubMed]
- Herms, D.A.; Mattson, W.J. The Dilemma of Plants: To Grow or Defend. Q. Rev. Biol. 1992, 67, 283–335. [Google Scholar] [CrossRef]
- Desai, S.; Tatke, P. Charantin: An Important Lead Compound from Momordica charantia for the Treatment of Di-abetes. J. Pharmacogn. Phytochem. 2015, 3, 163–166. [Google Scholar]
- Shang, Y.; Ma, Y.; Zhou, Y.; Zhang, H.; Duan, L.; Chen, H.; et al. Biosynthesis, Regulation, and Domestication of Bitterness in Cucumber. Science 2014, 346, 1084–1088. [Google Scholar] [CrossRef] [PubMed]
- Li, C.; Begum, A.; Numao, S.; Park, K.H.; Withers, S.G.; Brayer, G.D. Acarbose Rearrangement Mechanism Im-plied by the Kinetic and Structural Analysis of Human Pancreatic α-Amylase in Complex with Analogues and Their Elongated Counterparts. Biochemistry 2005, 44, 3347–3357. [Google Scholar] [CrossRef] [PubMed]
- Ren, L.; Qin, X.; Cao, X.; Wang, L.; Bai, F.; Bai, G.; Shen, Y. Structural Insight into Substrate Specificity of Human Intestinal Maltase-Glucoamylase. Protein Cell 2011, 2, 827–836. [Google Scholar] [CrossRef] [PubMed]
- Houston, D.R.; Walkinshaw, M.D. Consensus Docking: Improving the Reliability of Docking in a Virtual Screening Context. J. Chem. Inf. Model. 2013, 53, 384–390. [Google Scholar] [CrossRef] [PubMed]
- Wagner, H.; Ulrich-Merzenich, G. Synergy Research: Approaching a New Generation of Phytopharmaceuticals. Phytomedicine 2009, 16, 97–110. [Google Scholar] [CrossRef] [PubMed]
- Lenzen, S. The Mechanisms of Alloxan- and Streptozotocin-Induced Diabetes. Diabetologia 2008, 51, 216–226. [Google Scholar] [CrossRef] [PubMed]
- Lenzen, S.; Drinkgern, J.; Tiedge, M. Low Antioxidant Enzyme Gene Expression in Pancreatic Islets Compared with Various Other Mouse Tissues. Free Radic. Biol. Med. 1996, 20, 463–466. [Google Scholar] [CrossRef] [PubMed]
- Kaneto, H.; Kajimoto, Y.; Miyagawa, J.; Matsuoka, T.; Fujitani, Y.; Umayahara, Y.; et al. Beneficial Effects of An-tioxidants in Diabetes: Possible Protection of Pancreatic β-Cells Against Glucose Toxicity. Diabetes 1999, 48, 2398–2406. [Google Scholar] [CrossRef] [PubMed]
- Keller, A.C.; Ma, J.; Kavalier, A.; He, K.; Brillantes, A.M.; Kennelly, E.J. Saponins from the Traditional Medicinal Plant Momordica charantia Stimulate Insulin Secretion In Vitro. Phytomedicine 2011, 19, 32–37. [Google Scholar] [CrossRef] [PubMed]
- Yki-Järvinen, H. Thiazolidinediones. N. Engl. J. Med. 2004, 351, 1106–1118. [Google Scholar] [CrossRef] [PubMed]
- Fuangchan, A.; Sonthisombat, P.; Seubnukarn, T.; Chanouan, R.; Chotchaisuwat, P.; Sirigulsatien, V.; et al. Hypoglycemic Effect of Bitter Melon Compared with Metformin in Newly Diagnosed Type 2 Diabetes Patients. J. Ethnopharmacol. 2011, 134, 422–428. [Google Scholar] [CrossRef] [PubMed]
- Peter, E.L.; Kasali, F.M.; Deyno, S.; Mtewa, A.; Nagendrappa, P.B.; Tolo, C.U.; et al. Momordica charantia L. Lowers Elevated Glycaemia in Type 2 Diabetes Mellitus Patients: Systematic Review and Meta-Analyses. J. Ethnopharmacol. 2019, 231, 311–324. [Google Scholar] [CrossRef] [PubMed]
- Genheden, S.; Ryde, U. The MM/PBSA and MM/GBSA Methods to Estimate Ligand-Binding Affinities. Expert Opin. Drug Discov. 2015, 10, 449–461. [Google Scholar] [CrossRef] [PubMed]
- Doyle, J.J.; Dickson, E.E. Preservation of Plant Samples for DNA Restriction Endonuclease Analysis. Taxon 1987, 36, 715–722. [Google Scholar] [CrossRef]
- Cullings, K.W. Design and Testing of a Plant-Specific PCR Primer for Ecological and Evolutionary Studies. Mol. Ecol. 1992, 1, 233–240. [Google Scholar] [CrossRef]
- China Plant BOL Group; Li, D.Z.; Gao, L.M.; Li, H.T.; Wang, H.; Ge, X.J.; et al. Comparative Analysis of a Large Dataset Indicates That Internal Transcribed Spacer (ITS) Should Be Incorporated into the Core Barcode for Seed Plants. Proc. Natl. Acad. Sci. USA 2011, 108, 19641–19646. [Google Scholar] [CrossRef] [PubMed]
- White, T.J.; Bruns, T.; Lee, S.; Taylor, J. Amplification and Direct Sequencing of Fungal Ribosomal RNA Genes for Phylogenetics. In PCR Protocols: A Guide to Methods and Applications; Innis, M.A., Gelfand, D.H., Sninsky, J.J., White, T.J., Eds.; Academic Press: San Diego, CA, USA, 1990; pp. 315–322. [Google Scholar]
- Hall, T.A. BioEdit: A User-Friendly Biological Sequence Alignment Editor and Analysis Program for Windows 95/98/NT. Nucleic Acids Symp. Ser. 1999, 41, 95–98. [Google Scholar]
- Altschul, S.F.; Gish, W.; Miller, W.; Myers, E.W.; Lipman, D.J. Basic Local Alignment Search Tool. J. Mol. Biol. 1990, 215, 403–410. [Google Scholar] [CrossRef] [PubMed]
- Katoh, K.; Standley, D.M. MAFFT Multiple Sequence Alignment Software Version 7: Improvements in Perfor-mance and Usability. Mol. Biol. Evol. 2013, 30, 772–780. [Google Scholar] [CrossRef] [PubMed]
- Katoh, K.; Kuma, K.; Toh, H.; Miyata, T. MAFFT Version 5: Improvement in Accuracy of Multiple Sequence Alignment. Nucleic Acids Res. 2005, 33, 511–518. [Google Scholar] [CrossRef] [PubMed]
- Cock, P.J.A.; Antao, T.; Chang, J.T.; Chapman, B.A.; Cox, C.J.; Dalke, A.; et al. Biopython: Freely Available Python Tools for Computational Molecular Biology and Bioinformatics. Bioinformatics 2009, 25, 1422–1423. [Google Scholar] [CrossRef] [PubMed]
- Saitou, N.; Nei, M. The Neighbor-Joining Method: A New Method for Reconstructing Phylogenetic Trees. Mol. Biol. Evol. 1987, 4, 406–425. [Google Scholar] [CrossRef] [PubMed]
- Sokal, R.R.; Michener, C.D. A Statistical Method for Evaluating Systematic Relationships. Univ. Kans. Sci. Bull. 1958, 38, 1409–1438. [Google Scholar]
- Virtanen, P.; Gommers, R.; Oliphant, T.E.; Haberland, M.; Reddy, T.; Cournapeau, D.; et al. SciPy 1.0: Funda-mental Algorithms for Scientific Computing in Python. Nat. Methods 2020, 17, 261–272. [Google Scholar] [CrossRef] [PubMed]
- Torgerson, W.S. Multidimensional Scaling: I. Theory and Method. Psychometrika 1952, 17, 401–419. [Google Scholar] [CrossRef]
- Gower, J.C. Some Distance Properties of Latent Root and Vector Methods Used in Multivariate Analysis. Bio-metrika 1966, 53, 325–338. [Google Scholar] [CrossRef]
- FAO. Standard Operating Procedure for Soil pH Determination; GLOSOLAN-SOP-02; Food and Agriculture Organization of the United Nations: Rome, Italy, 2019. [Google Scholar]
- Miller, J.J.; Curtin, D. Electrical Conductivity and Soluble Ions. In Soil Sampling and Methods of Analysis, 2nd ed.; Carter, M.R., Gregorich, E.G., Eds.; CRC Press: Boca Raton, FL, USA, 2008; pp. 161–171. [Google Scholar]
- Theerajindakajorn, P. Principles and Methods of Soil Chemical Analysis; (In Thai). Department of Land Resources and Environment, Faculty of Agriculture, Khon Kaen University: Khon Kaen, Thailand, 2006. [Google Scholar]
- Bray, R.H.; Kurtz, L.T. Determination of Total, Organic, and Available Forms of Phosphorus in Soils. Soil Sci. 1945, 59, 39–45. [Google Scholar] [CrossRef]
- Thailand Soil Laboratory Accreditation Network (TSLAN). Standard Operating Procedure for Soil Analysis (TSLAN-SOP-04); Bureau of Soil Science for Land Development, Land Development Department: Bangkok, Thailand, 2024. [Google Scholar]
- Spínola, V.; Castilho, P.C. Assessing the In Vitro Inhibitory Effects on Key Enzymes Linked to Type-2 Diabetes and Obesity and Protein Glycation by Phenolic Compounds of Lauraceae Plant Species Endemic to the Lau-risilva. For. Mol. 2021, 26, 2023. [Google Scholar] [CrossRef] [PubMed]
- ISO 10993-5:2009; Biological Evaluation of Medical Devices—Part 5: Tests for In Vitro Cytotoxicity. Internation-al Organization for Standardization: Geneva, Switzerland, 2009.
- Al Nahdi, A.M.T.; John, A.; Raza, H. Elucidation of Molecular Mechanisms of Streptozotocin-Induced Oxidative Stress, Apoptosis, and Mitochondrial Dysfunction in Rin-5F Pancreatic β-Cells. Oxid. Med. Cell. Longev. 2017, 7054272. [Google Scholar] [CrossRef] [PubMed]
- Ahmed, Q.U.; Sarian, M.N.; Mat So’ad, S.Z.; Latip, J.; Arief Ichwan, S.J.; Hussein, N.N.; Taher, M.; Alhassan, A.M.; Hamidon, H.; Fakurazi, S. Methylation and Acetylation Enhanced the Antidiabetic Activity of Some Selected Flavonoids: In Vitro, Molecular Modelling and Structure Activity Relationship-Based Study. Biomolecules 2018, 8, 149. [Google Scholar] [CrossRef] [PubMed]
- Jiang, Y.; Feng, C.; Shi, Y.; Kou, X.; Le, G. Eugenol Improves High-Fat Diet/Streptomycin-Induced Type 2 Diabetes Mellitus (T2DM) Mice Muscle Dysfunction by Alleviating Inflammation and Increasing Muscle Glucose Uptake. Front. Nutr. 2022, 9, 1039753. [Google Scholar] [CrossRef] [PubMed]
- Fisher, R.A. Statistical Methods for Research Workers; Oliver and Boyd: Edinburgh, UK, 1925. [Google Scholar]
- Tukey, J.W. Comparing Individual Means in the Analysis of Variance. Biometrics 1949, 5, 99–114. [Google Scholar] [CrossRef]
- Dunnett, C.W. A Multiple Comparison Procedure for Comparing Several Treatments with a Control. J. Am. Stat. Assoc. 1955, 50, 1096–1121. [Google Scholar] [CrossRef]
- Duncan, D.B. Multiple Range and Multiple F Tests. Biometrics 1955, 11, 1–42. [Google Scholar] [CrossRef]
- Games, P.A.; Howell, J.F. Pairwise Multiple Comparison Procedures with Unequal N’s and/or Variances: A Monte Carlo Study. J. Educ. Stat. 1976, 1, 113–125. [Google Scholar] [CrossRef]
- Student. The Probable Error of a Mean. Biometrika 1908, 6, 1–25. [Google Scholar] [CrossRef]
- Van Rossum, G.; Drake, F.L. Python 3 Reference Manual; CreateSpace: Scotts Valley, CA, USA, 2009. [Google Scholar]
- Pedregosa, F.; Varoquaux, G.; Gramfort, A.; Michel, V.; Thirion, B.; Grisel, O.; et al. Scikit-Learn: Machine Learn-ing in Python. J. Mach. Learn. Res. 2011, 12, 2825–2830. [Google Scholar]
- Pearson, K. On Lines and Planes of Closest Fit to Systems of Points in Space. Lond. Edinb. Dubl. Phil. Mag. J. Sci. 1901, 2, 559–572. [Google Scholar] [CrossRef]
- Hotelling, H. Analysis of a Complex of Statistical Variables into Principal Components. J. Educ. Psychol. 1933, 24, 417–441. [Google Scholar] [CrossRef]
- Jolliffe, I.T.; Cadima, J. Principal Component Analysis: A Review and Recent Developments. Philos. Trans. R. Soc. A 2016, 374, 20150202. [Google Scholar] [CrossRef] [PubMed]
- Pearson, K. Note on Regression and Inheritance in the Case of Two Parents. Proc. R. Soc. Lond. 1895, 58, 240–242. [Google Scholar] [CrossRef]
- Mantel, N. The Detection of Disease Clustering and a Generalized Regression Approach. Cancer Res. 1967, 27, 209–220. [Google Scholar] [PubMed]
- Berman, H.M.; Westbrook, J.; Feng, Z.; Gilliland, G.; Bhat, T.N.; Weissig, H.; Shindyalov, I.N.; Bourne, P.E. The Protein Data Bank. Nucleic Acids Res. 2000, 28, 235–242. [Google Scholar] [CrossRef] [PubMed]
- Morris, G.M.; Huey, R.; Lindstrom, W.; Sanner, M.F.; Belew, R.K.; Goodsell, D.S.; Olson, A.J. AutoDock4 and Au-toDockTools4: Automated Docking with Selective Receptor Flexibility. J. Comput. Chem. 2009, 30, 2785–2791. [Google Scholar] [CrossRef] [PubMed]
- Gasteiger, J.; Marsili, M. Iterative Partial Equalization of Orbital Electronegativity—A Rapid Access to Atomic Charges. Tetrahedron 1980, 36, 3219–3228. [Google Scholar] [CrossRef]
- Bannwarth, C.; Ehlert, S.; Grimme, S. GFN2-xTB—An Accurate and Broadly Parametrized Self-Consistent Tight-Binding Quantum Chemical Method with Multipole Electrostatics and Density-Dependent Dispersion Contributions. J. Chem. Theory Comput. 2019, 15, 1652–1671. [Google Scholar] [CrossRef] [PubMed]
- Becke, A.D. Density-Functional Exchange-Energy Approximation with Correct Asymptotic Behavior. Phys. Rev. A 1988, 38, 3098–3100. [Google Scholar] [CrossRef] [PubMed]
- Perdew, J.P. Density-Functional Approximation for the Correlation Energy of the Inhomogeneous Electron Gas. Phys. Rev. B 1986, 33, 8822–8824. [Google Scholar] [CrossRef] [PubMed]
- Schäfer, A.; Horn, H.; Ahlrichs, R. Fully Optimized Contracted Gaussian Basis Sets for Atoms Li to Kr. J. Chem. Phys. 1992, 97, 2571–2577. [Google Scholar] [CrossRef]
- Steffen, C.; Thomas, K.; Huniar, U.; Hellweg, A.; Rubner, O.; Schroer, A. TmoleX—A Graphical User Interface for TURBOMOLE. J. Comput. Chem. 2010, 31, 2967–2970. [Google Scholar] [CrossRef] [PubMed]
- Jones, G.; Willett, P.; Glen, R.C.; Leach, A.R.; Taylor, R. Development and Validation of a Genetic Algorithm for Flexible Docking. J. Mol. Biol. 1997, 267, 727–748. [Google Scholar] [CrossRef] [PubMed]
- Korb, O.; Stützle, T.; Exner, T.E. Empirical Scoring Functions for Advanced Protein–Ligand Docking with PLANTS. J. Chem. Inf. Model. 2009, 49, 84–96. [Google Scholar] [CrossRef] [PubMed]
- Koes, D.R.; Baumgartner, M.P.; Camacho, C.J. Lessons Learned in Empirical Scoring with smina from the CSAR 2011 Benchmarking Exercise. J. Chem. Inf. Model. 2013, 53, 1893–1904. [Google Scholar] [CrossRef] [PubMed]
- Trott, O.; Olson, A.J. AutoDock Vina: Improving the Speed and Accuracy of Docking with a New Scoring Func-tion, Efficient Optimization, and Multithreading. J. Comput. Chem. 2010, 31, 455–461. [Google Scholar] [CrossRef] [PubMed]
- Quiroga, R.; Villarreal, M.A. Vinardo: A Scoring Function Based on AutoDock Vina Improves Scoring, Docking, and Virtual Screening. PLoS ONE 2016, 11, e0155183. [Google Scholar] [CrossRef] [PubMed]
- Lacour, A.; et al. DockM8: An All-in-One Open-Source Platform for Consensus Virtual Screening in Drug De-sign. J. Cheminform. 2026, 18, 135. [Google Scholar] [CrossRef] [PubMed]
- McNutt, A.T.; Francoeur, P.; Aggarwal, R.; Masuda, T.; Meli, R.; Ragoza, M.; Sunseri, J.; Koes, D.R. GNINA 1.0: Molecular Docking with Deep Learning. J. Cheminform. 2021, 13, 43. [Google Scholar] [CrossRef] [PubMed]
- BIOVIA; Dassault Systèmes. Discovery Studio Visualizer, Version 20.1; Dassault Systèmes: San Diego, CA, USA, 2020. [Google Scholar]
Figure 1.
Genetic relationships among Thai M. charantia accessions based on ITS sequences, analysed separately for each primer pair because the primer pairs amplify non-overlapping regions. (A) Group A (ITS1 region; ITS1/ITS2 primers; No. 3, No. 5, No. 6, No. 7 and No. 9) and (B) Group B (ITS2 region; ITS3/ITS4 primers; No. 1, No. 2, No. 4, No. 8 and No. 10): PCoA (left) and pairwise identity heatmap (%, from low [red] to high [green]) (right). PCoA was based on identity-model distances calculated from trimmed MAFFT L-INS-i alignments (258 and 253 bp, respectively); the percentage of variance explained is shown on each axis. No. 2 represents an independent sample of the same cultivar (Table S1,3). No. 4 and No. 8 shared identical sequences and are indicated by a split symbol. The heatmap colour scales differ between panels (70–100% and 90–100%, respectively). Colours indicate agricultural class: blue, commercial; green, native; red, wild.
Figure 1.
Genetic relationships among Thai M. charantia accessions based on ITS sequences, analysed separately for each primer pair because the primer pairs amplify non-overlapping regions. (A) Group A (ITS1 region; ITS1/ITS2 primers; No. 3, No. 5, No. 6, No. 7 and No. 9) and (B) Group B (ITS2 region; ITS3/ITS4 primers; No. 1, No. 2, No. 4, No. 8 and No. 10): PCoA (left) and pairwise identity heatmap (%, from low [red] to high [green]) (right). PCoA was based on identity-model distances calculated from trimmed MAFFT L-INS-i alignments (258 and 253 bp, respectively); the percentage of variance explained is shown on each axis. No. 2 represents an independent sample of the same cultivar (Table S1,3). No. 4 and No. 8 shared identical sequences and are indicated by a split symbol. The heatmap colour scales differ between panels (70–100% and 90–100%, respectively). Colours indicate agricultural class: blue, commercial; green, native; red, wild.
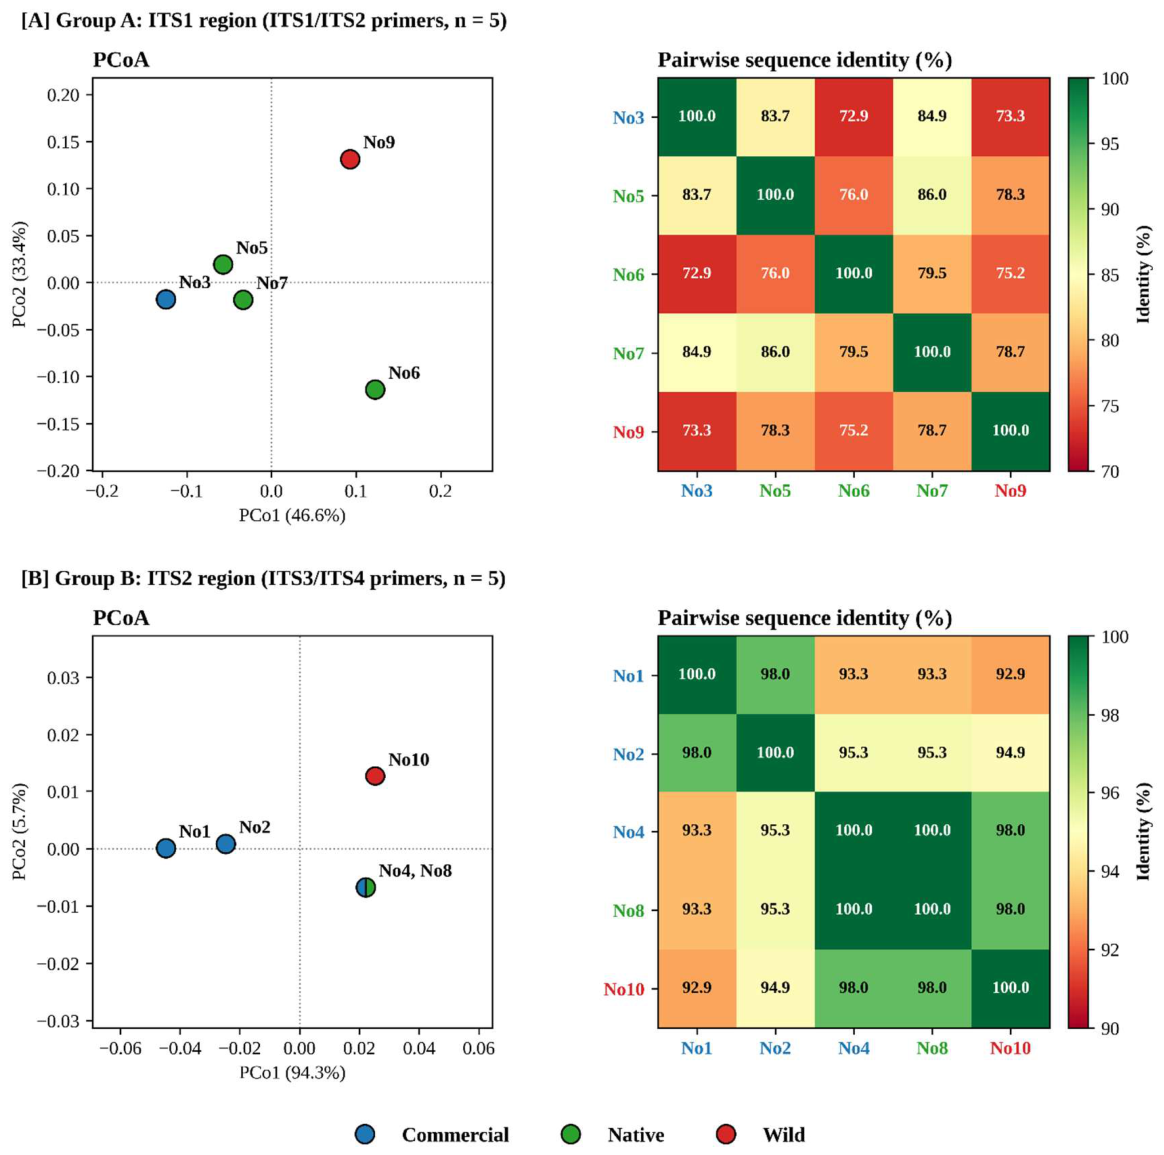
Figure 2.
(A) PCA biplot and (B) z-score heatmap showing extraction yield, charantin and momordicine contents across the ten accessions, grouped according to agricultural class. Colours indicate agricultural class: blue, commercial; green, native; red, wild.
Figure 2.
(A) PCA biplot and (B) z-score heatmap showing extraction yield, charantin and momordicine contents across the ten accessions, grouped according to agricultural class. Colours indicate agricultural class: blue, commercial; green, native; red, wild.
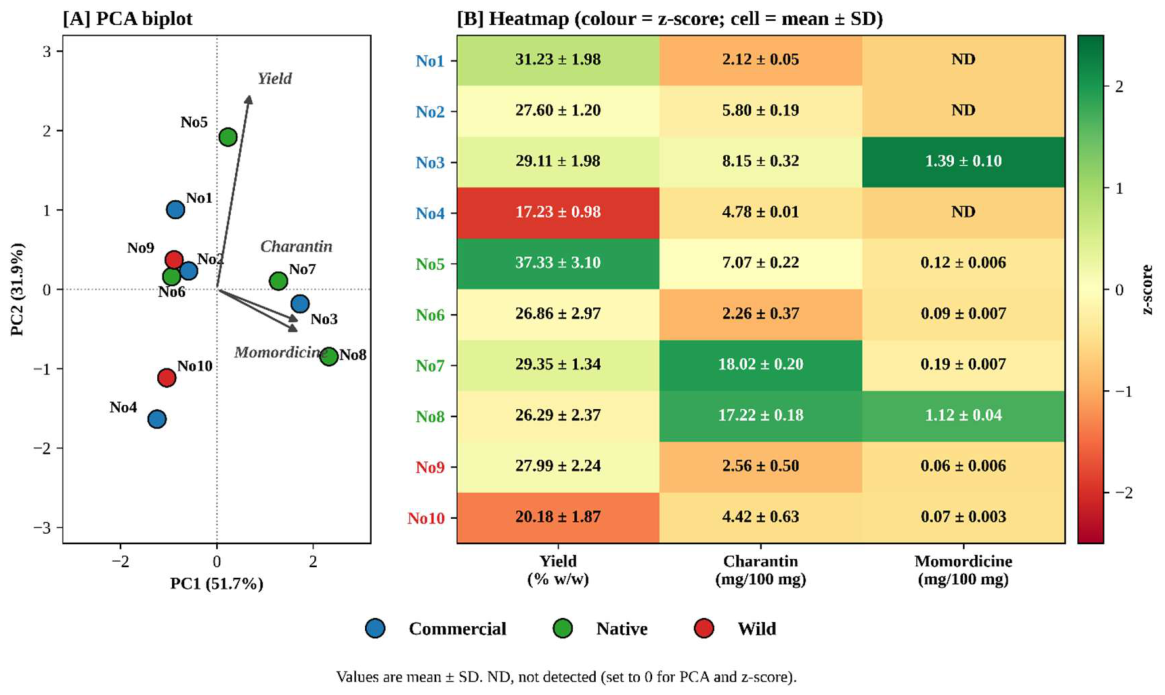
Figure 3.
Effects of site on accession No. 7 grown at four sites. (A) PCA biplot of z-standardised soil properties (pH, EC, OM, Avail. P and Exch. K), extraction yield, charantin and momordicine (PC1, 59.2%; PC2, 23.6%); brown arrows indicate extraction yield and phytochemical variables. (B) Pearson correlations between soil properties and phytochemical traits (n = 4; asterisk indicates P < 0.05). (C) Extraction yield (% dry weight [DW]). (D) Charantin and (E) momordicine contents (mg/100 mg crude extract), mean ± SD (n = 3). PT, Pathum Thani; LT, Lam Takhong; ST1 and ST2, Surat Thani plots 1 and 2, respectively; EC, electrical conductivity; OM, organic matter; Avail. P, available phosphorus; Exch. K, exchangeable potassium.
Figure 3.
Effects of site on accession No. 7 grown at four sites. (A) PCA biplot of z-standardised soil properties (pH, EC, OM, Avail. P and Exch. K), extraction yield, charantin and momordicine (PC1, 59.2%; PC2, 23.6%); brown arrows indicate extraction yield and phytochemical variables. (B) Pearson correlations between soil properties and phytochemical traits (n = 4; asterisk indicates P < 0.05). (C) Extraction yield (% dry weight [DW]). (D) Charantin and (E) momordicine contents (mg/100 mg crude extract), mean ± SD (n = 3). PT, Pathum Thani; LT, Lam Takhong; ST1 and ST2, Surat Thani plots 1 and 2, respectively; EC, electrical conductivity; OM, organic matter; Avail. P, available phosphorus; Exch. K, exchangeable potassium.
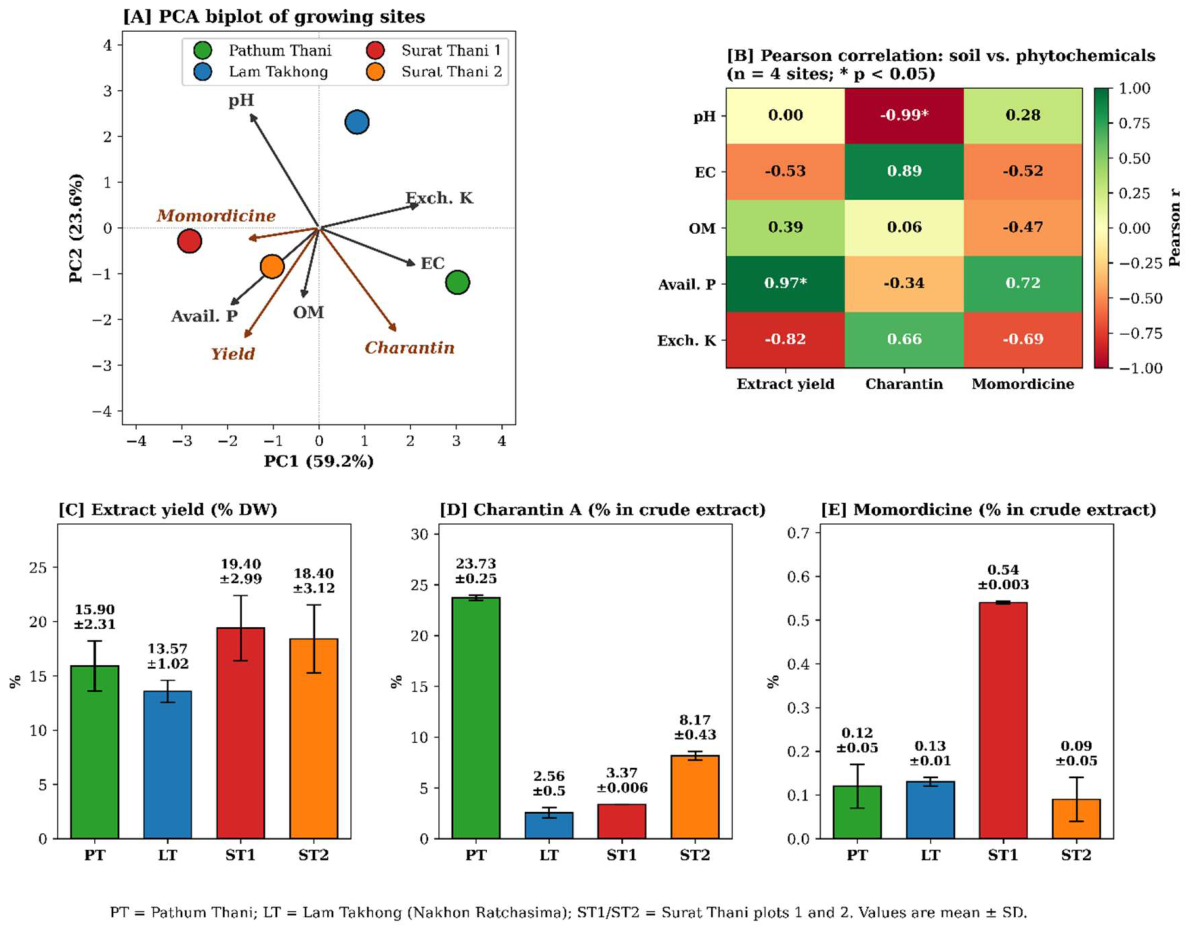
Figure 4.
Charantin (left axis) and momordicine (right axis) contents in fruit extracts from accession No. 7 grown under five fertilizer treatments at a single site (mg/100 mg crude extract). T1, dairy manure at 1 t/rai; T2, dairy manure at 2 t/rai; T3, dairy manure at 1 t/rai + 15-15-15 fertilizer at 30 kg/rai; T4, dairy manure at 1 t/rai + 13-13-21 fertilizer at 30 kg/rai; T5, unfertilized control (1 rai = 0.16 ha). At 1 t/rai, dairy manure supplied approximately 17.2 kg N, 8.5 kg P and 21.3 kg K per rai [12]. Bars, mean ± SD (n = 3); dashed lines, control values (green, charantin; red, momordicine). **P < 0.001 versus control (Dunnett’s test).
Figure 4.
Charantin (left axis) and momordicine (right axis) contents in fruit extracts from accession No. 7 grown under five fertilizer treatments at a single site (mg/100 mg crude extract). T1, dairy manure at 1 t/rai; T2, dairy manure at 2 t/rai; T3, dairy manure at 1 t/rai + 15-15-15 fertilizer at 30 kg/rai; T4, dairy manure at 1 t/rai + 13-13-21 fertilizer at 30 kg/rai; T5, unfertilized control (1 rai = 0.16 ha). At 1 t/rai, dairy manure supplied approximately 17.2 kg N, 8.5 kg P and 21.3 kg K per rai [12]. Bars, mean ± SD (n = 3); dashed lines, control values (green, charantin; red, momordicine). **P < 0.001 versus control (Dunnett’s test).
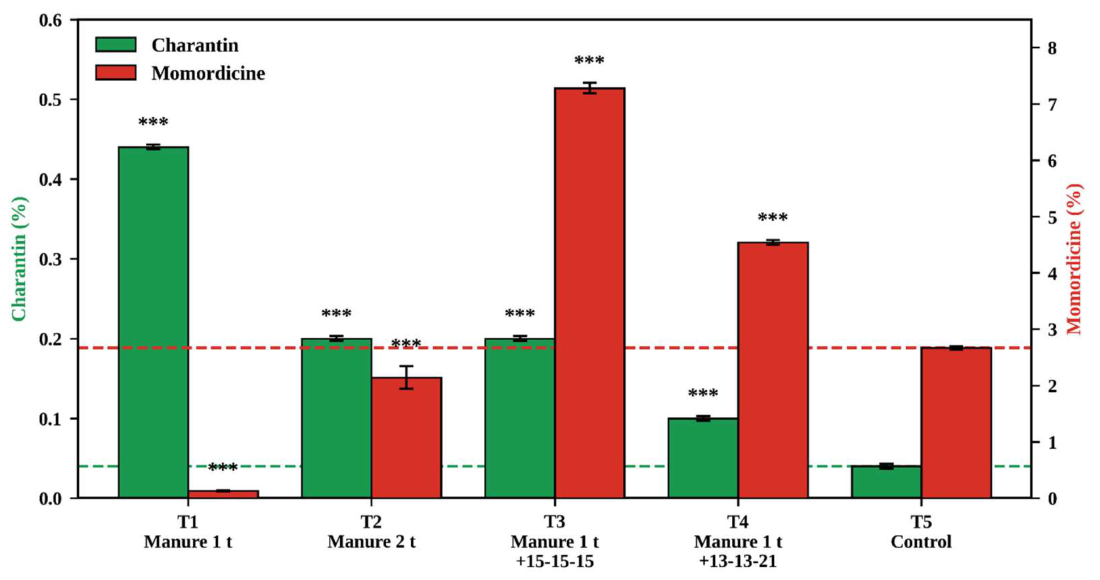
Figure 5.
IC50 (µg/mL) of acarbose, authentic charantin and momordicine and crude extracts of three accessions against α-glucosidase and α-amylase. Lower IC50 values indicate greater inhibitory potency. Bars, mean ± SD (n = 3); hatched bars, crude extracts (blue, commercial No. 2; dark green, native No. 7; light green, native No. 8). P < 0.05, **P < 0.001; ns, not significant relative to the positive control (Dunnett’s test).
Figure 5.
IC50 (µg/mL) of acarbose, authentic charantin and momordicine and crude extracts of three accessions against α-glucosidase and α-amylase. Lower IC50 values indicate greater inhibitory potency. Bars, mean ± SD (n = 3); hatched bars, crude extracts (blue, commercial No. 2; dark green, native No. 7; light green, native No. 8). P < 0.05, **P < 0.001; ns, not significant relative to the positive control (Dunnett’s test).
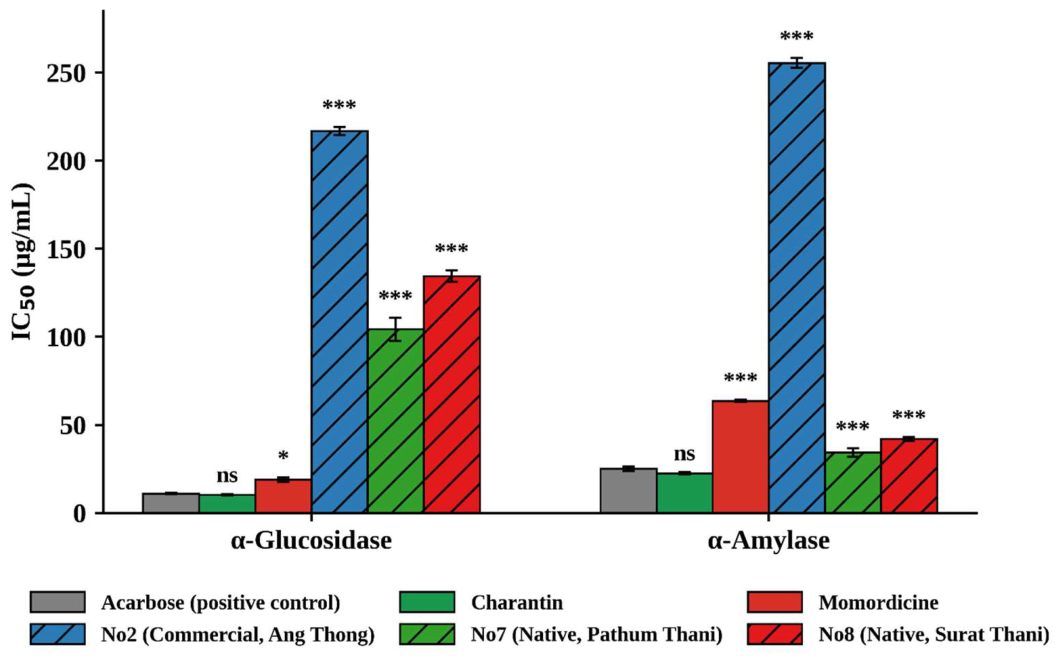
Figure 6.
Three-dimensional poses (left) and two-dimensional interaction diagrams (right) of momordicine, charantin A and charantin B in the α-amylase active site (PDB 1XD0).
Figure 6.
Three-dimensional poses (left) and two-dimensional interaction diagrams (right) of momordicine, charantin A and charantin B in the α-amylase active site (PDB 1XD0).
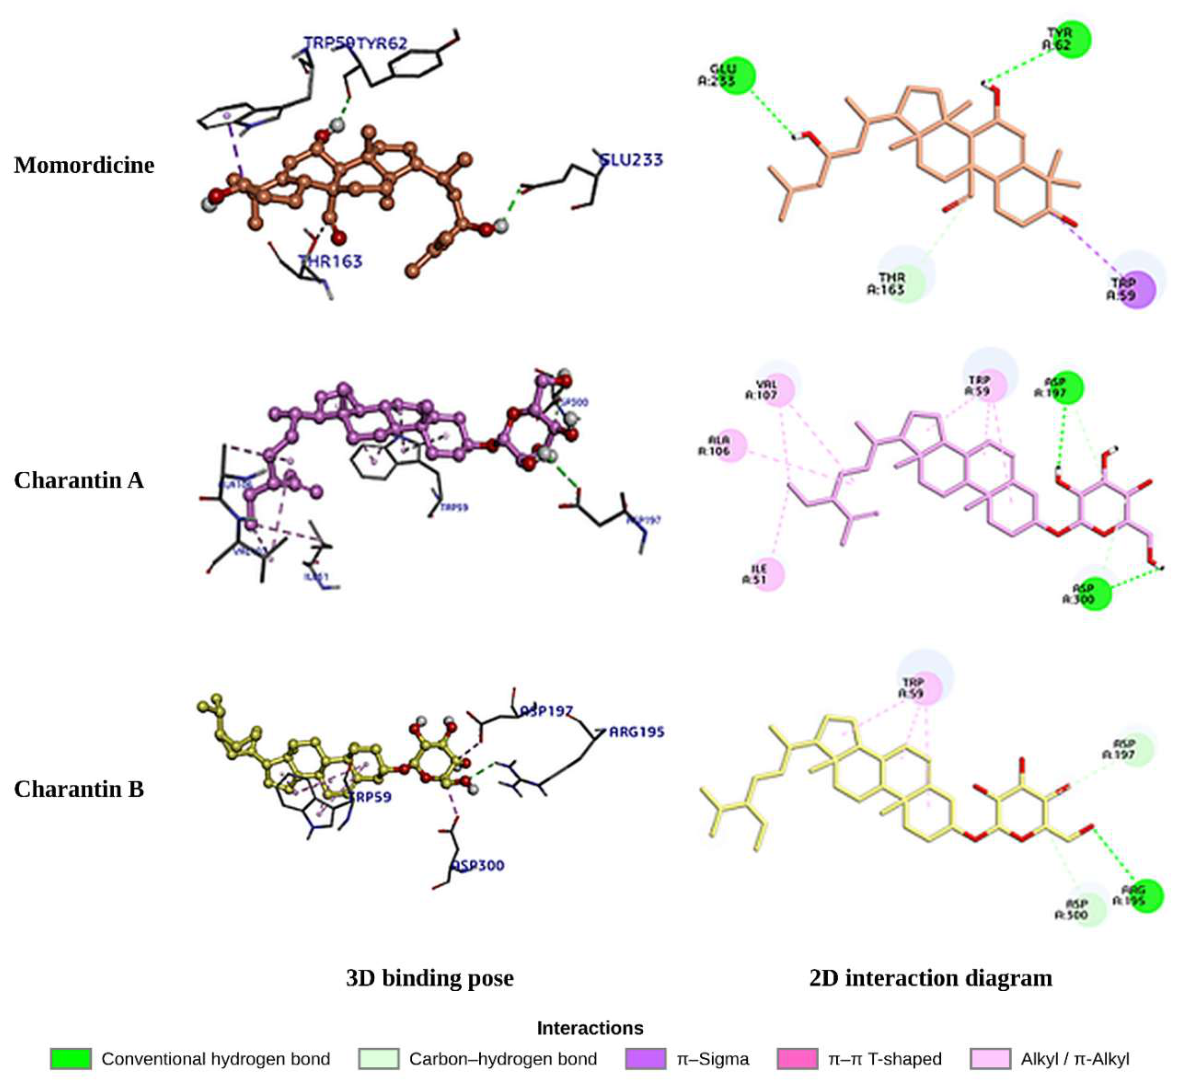
Figure 7.
Three-dimensional poses (left) and two-dimensional interaction diagrams (right) of momordicine, charantin A and charantin B in the α-glucosidase active site (PDB 3TOP).
Figure 7.
Three-dimensional poses (left) and two-dimensional interaction diagrams (right) of momordicine, charantin A and charantin B in the α-glucosidase active site (PDB 3TOP).
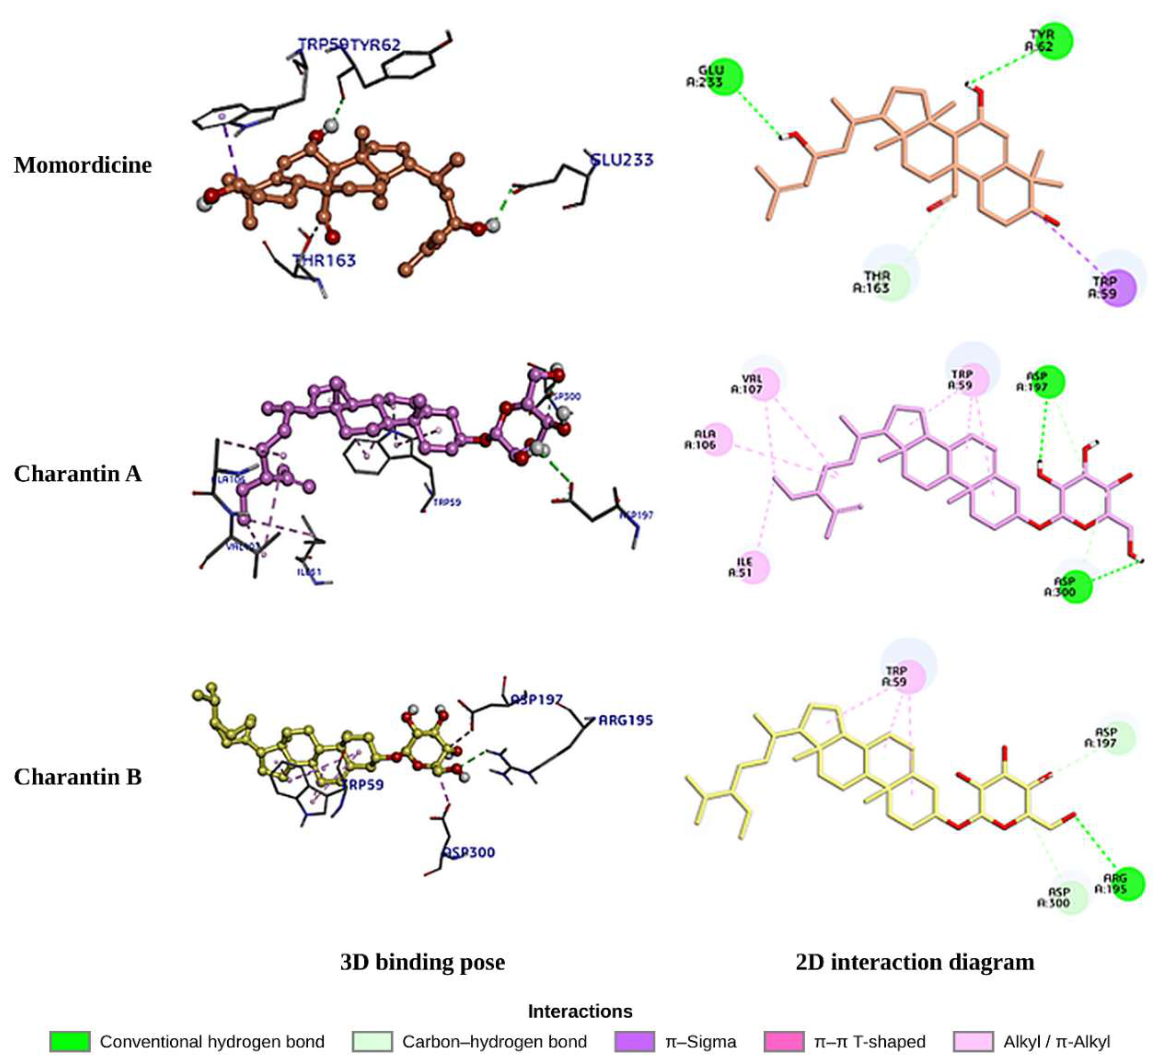
Figure 8.
Effects of M. charantia extracts (2.5–50 µg mL−1), charantin and momordicine (25 µg mL−1) on STZ (5 mM)-injured RIN-m5F cells: (A) cell survival, (B) intracellular ROS inhibition and (C) insulin release (% of normal cells). Hatched bars, extracts; solid bars, pure compounds and references. NAC (10 mM; dashed line) served as the positive control and pioglitazone (25 µg mL−1) as an additional reference in (C). Data means SD (n = 3); nd, not detected. Dunnett’s test vs. NAC: */**/***, higher; †/††/†††, lower; ns, not significant. vs. pioglitazone (C): #/##/###, higher; ‡/‡‡/‡‡‡, lower (P < 0.05, 0.01 and 0.001, respectively).
Figure 8.
Effects of M. charantia extracts (2.5–50 µg mL−1), charantin and momordicine (25 µg mL−1) on STZ (5 mM)-injured RIN-m5F cells: (A) cell survival, (B) intracellular ROS inhibition and (C) insulin release (% of normal cells). Hatched bars, extracts; solid bars, pure compounds and references. NAC (10 mM; dashed line) served as the positive control and pioglitazone (25 µg mL−1) as an additional reference in (C). Data means SD (n = 3); nd, not detected. Dunnett’s test vs. NAC: */**/***, higher; †/††/†††, lower; ns, not significant. vs. pioglitazone (C): #/##/###, higher; ‡/‡‡/‡‡‡, lower (P < 0.05, 0.01 and 0.001, respectively).
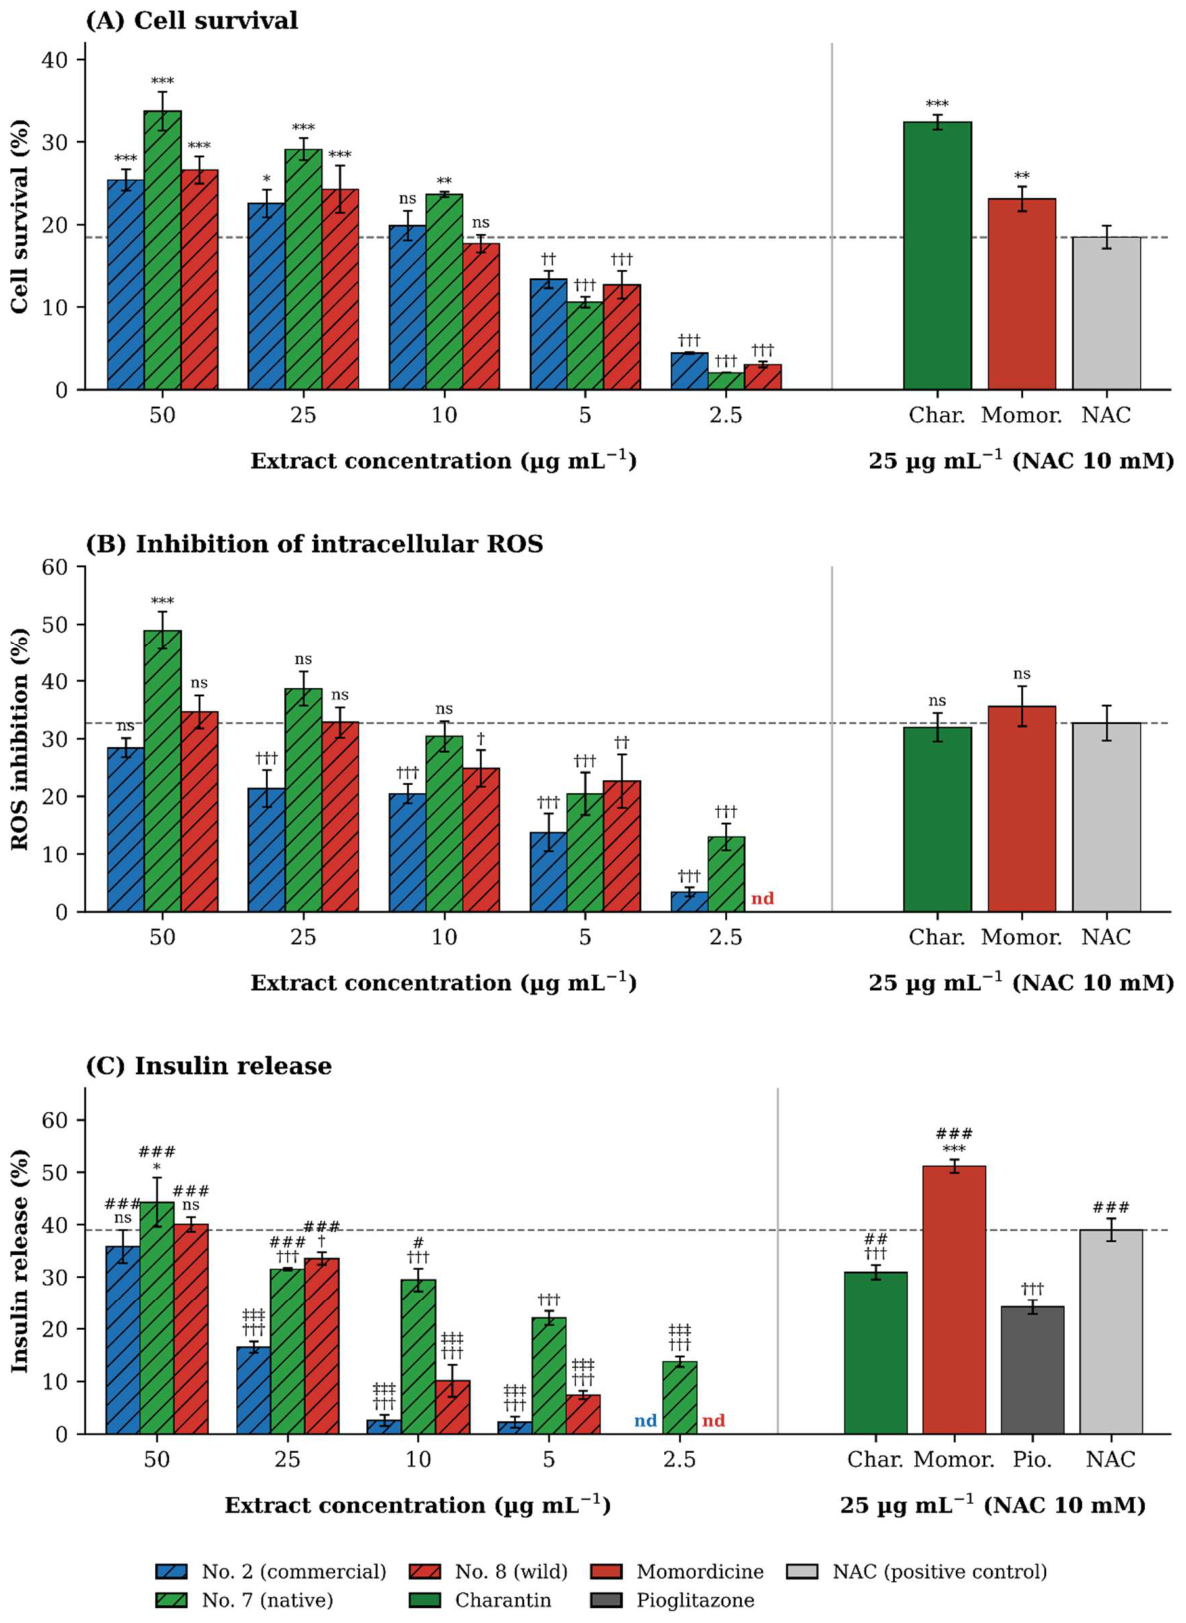
Figure 9.
Glucose uptake (%) in C2C12 myotubes treated with M. charantia extracts (2.5–50 µg mL−1; hatched bars), pioglitazone (25 µg mL−1) or NAC (10 mM). Dashed and dotted lines indicate pioglitazone and NAC levels, respectively. Data are mean ± SD (n = 3). Dunnett’s test vs. NAC (lower symbol): ***, higher; †/††/†††, lower; vs. pioglitazone (upper symbol): ‡/‡‡/‡‡‡, lower; ns, not significant (P < 0.05, 0.01 and 0.001, respectively).
Figure 9.
Glucose uptake (%) in C2C12 myotubes treated with M. charantia extracts (2.5–50 µg mL−1; hatched bars), pioglitazone (25 µg mL−1) or NAC (10 mM). Dashed and dotted lines indicate pioglitazone and NAC levels, respectively. Data are mean ± SD (n = 3). Dunnett’s test vs. NAC (lower symbol): ***, higher; †/††/†††, lower; vs. pioglitazone (upper symbol): ‡/‡‡/‡‡‡, lower; ns, not significant (P < 0.05, 0.01 and 0.001, respectively).
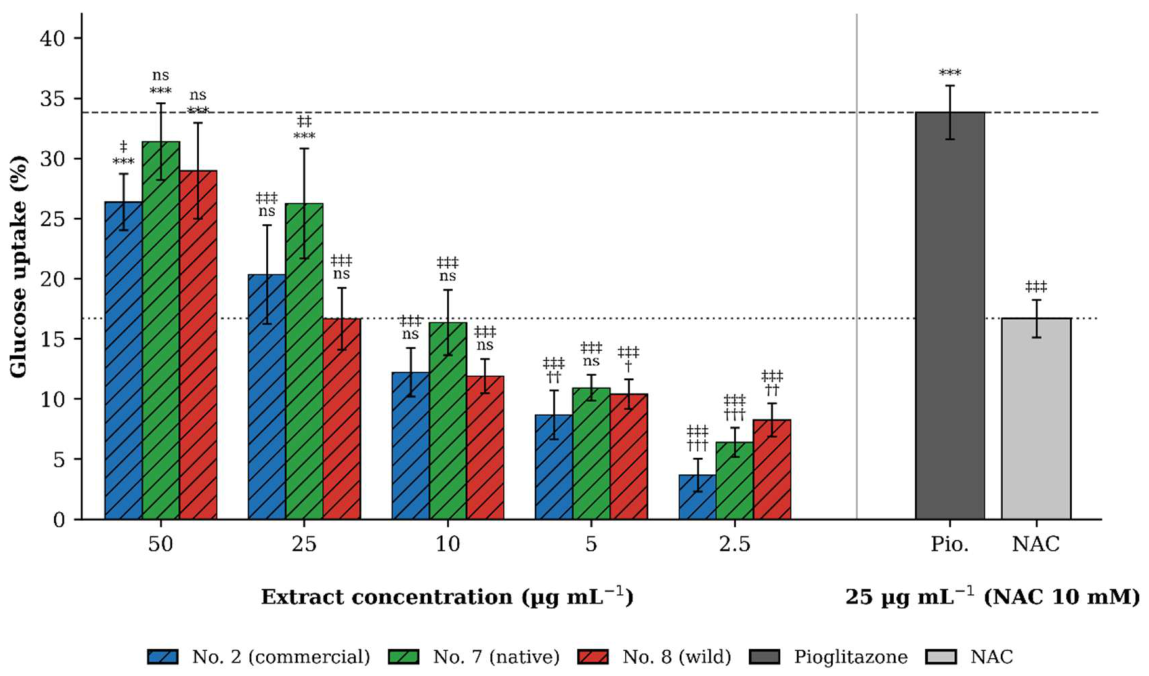

Table 1.
Docking scores and consensus Z-scores against α-amylase (PDB 1XD0) and α-glucosidase (PDB 3TOP).
Table 1.
Docking scores and consensus Z-scores against α-amylase (PDB 1XD0) and α-glucosidase (PDB 3TOP).
| Enzyme | Compound | Code | CHEMPLP | AutoDock Vina (kcal/mol) | Vinardo (kcal/mol) | Z-score |
|---|---|---|---|---|---|---|
| α-Amylase | Penta-acarbose | Co-crystallised | 64.62 | −9.65 | −5.49 | – |
| Charantin A | Charantin A | 81.93 | −9.88 | −7.59 | 0.55 | |
| Charantin B | Charantin B | 83.71 | −9.61 | −7.25 | 0.61 | |
| Momordicine | Momordicine | 75.22 | −9.35 | −6.37 | 0.43 | |
| α-Glucosidase | Acarbose | Co-crystallised | 68.01 | −7.79 | −5.65 | – |
| Charantin A | Charantin A | 94.38 | −7.19 | −9.82 | 0.66 | |
| Charantin B | Charantin B | 87.15 | −8.17 | −9.89 | 0.76 | |
| Momordicine | Momordicine | 76.52 | −7.13 | −9.94 | 0.70 |
CHEMPLP, GOLD fitness score (higher is better); Vina and Vinardo, kcal/mol (more negative is better); Z-score, DockM8 consensus score (higher is better); –, not applicable.
Disclaimer/Publisher’s Note: The statements, opinions and data contained in all publications are solely those of the individual author(s) and contributor(s) and not of MDPI and/or the editor(s). MDPI and/or the editor(s) disclaim responsibility for any injury to people or property resulting from any ideas, methods, instructions or products referred to in the content. |
© 2026 by the authors. Licensee MDPI, Basel, Switzerland. This article is an open access article distributed under the terms and conditions of the Creative Commons Attribution (CC BY) license (http://creativecommons.org/licenses/by/4.0/).
Copyright: This open access article is published under a Creative Commons CC BY 4.0 license, which permit the free download, distribution, and reuse, provided that the author and preprint are cited in any reuse.