
Submitted:
29 October 2026
Posted:
30 October 2026
You are already at the latest version
Abstract
Background: Axial spondyloarthritis (axSpA) is characterized by coexisting bone loss and pathological new bone formation. Although alterations in circulating markers and osteoclastogenesis from peripheral blood monocytes (PBM) are documented in radiographic axSpA (r-axSpA), their status in non-radiographic axSpA (nr-axSpA) and association with bone loss remain unresolved. In this study, we evaluated serum markers of bone metabolism and inflammation, PBM osteoclastogenic capacity, and their association with bone mineral density across both axSpA phenotypes.
Methods: In 81 axSpA patients, clinical characteristics and DEXA-based BMD were recorded. Serum TSH, PTH, 25(OH)D3, bCTX, PINP, osteocalcin, bALP, RANKL, OPG, CTSK, CRP, IL-6 and IL-17 were measured. PBM from a patient subset (N=26) were used for in vitro osteoclastogenesis assays.
Results: In a multivariable model, femoral neck Z-scores were strongly negatively associated with serum OPG/RANKL ratio in males (48% OPG/RANKL increase per one-unit Z-score decrease, p< 0.01). Additionally, each one-unit decrease in femoral neck Z-score was associated with increased odds of r-axSpA (OR 1.96, p< 0.05), independently of OPG/RANKL. Though patients with r-axSpA had lower femoral neck Z-scores than nr-axSpA (mean −0.50 vs. 0.03, p< 0.05), their in vitro osteoclastogenesis did not differ significantly (median 21 vs. 40, p=NS). Instead, osteoclastogenesis associated with BMD, being lower in patients with reduced femoral neck BMD compared to normal BMD (mean 22 vs. 51, p< 0.05).
Conclusions: This study highlights the femoral neck as a region of interest for studying bone loss in nr-axSpA and r-axSpA and supports a link between systemic bone loss, circulating OPG/RANKL levels, and precursor osteoclastogenic potential in axSpA.
Keywords:
axial spondyloarthritis
; bone mineral density
; osteoclast
; osteoprotegerin
; RANKL
1. Introduction
Axial spondyloarthritis (axSpA) is a progressive spondyloarthropathy [1] that typically develops in early adulthood [2]. The non-radiographic (nr-axSpA) and radiographic form (r-axSpA) of the disease can be distinguished based on imaging techniques, with the latter one accompanied by syndesmophyte formation that ultimately leads to ankylosis [3]. Males are more likely to develop the radiographic form, although the progression rate is relatively slow – reported as affecting 8–44% of patients over the period of 2–11 years [4]. A classic hallmark of r-axSpA disease is the pathological new bone formation; in addition, an important paradoxical comorbidity of axSpA is the high prevalence of osteopenia and osteoporosis, which, depending on the population studied, can reach up to 56% in the lumbar spine and 86% in the femoral neck [5]. Similar to their higher propensity for r-axSpA, male axSpA patients are at an increased risk of bone loss at the femur [6]. Importantly, lumbar spine bone mineral density (BMD) values can be artificially inflated by structural changes and new bone formation, making femoral BMD a potentially more reliable proxy for studying systemic bone loss in axSpA [7].
Inflammation plays an important role in axSpA pathogenesis, with a central pathogenic function attributed to the interleukin (IL)-23/IL-17 axis [8]. On one hand, the overexpression of IL-23 initiates enthesitis by activating tissue-resident entheseal T cells that produce proinflammatory cytokines, such as IL-22 and IL-17, which subsequently act on osteoblasts to promote site-specific bone formation [9]. On the other hand, chronic systemic inflammation stimulates osteoclast precursors to differentiate through both direct and indirect mechanisms, explaining the concurrent systemic bone loss [8]. Well-described is the effect of IL-23 on Th17 cells to promote IL-17 production, which in turn stimulates the expression of receptor activator of nuclear factor kappa-B ligand (RANKL) across various cell types [10,11], thereby shifting the osteoprotegerin (OPG)/RANKL ratio – a central regulator of osteoclastogenesis. As a result, the dual effect of inflammation triggered by IL-23 offers a plausible explanation for the co-occurrence of bone loss and new bone formation, with these phenomena potentially representing different consequences of a common denominator [8]. However, clinical observations – such as the association between low femoral BMD and r-axSpA [7], and longitudinal data identifying low BMD as a predictor of new syndesmophyte formation [12] – suggest that this interplay may be even more complex.
An evolving area of axSpA research focuses on evaluating the osteoclastogenic potential of peripheral blood monocytes (PBM). Multiple studies have reported reduced osteoclast differentiation and/or diminished responsiveness to osteoclastogenic stimuli by PBM derived from r-axSpA patients compared to healthy controls [13,14,15,16]. Although the biological significance of PBM osteoclastogenesis in relation to bone pathology remained elusive for a long time, a recent key study demonstrated that the course of r-axSpA is associated with a gradual loss of PBM commitment to the osteoclast cell fate [15], underscoring a crucial functional link. Notably, research to date has predominantly focused on the r-axSpA phenotype, whereas the osteoclastogenic potential in nr-axSpA patients and its relationship to systemic bone loss remains largely unexplored.
In this study, we addressed this research gap by examining in vitro PBM osteoclastogenic potential alongside in vivo serum markers of bone metabolism and inflammation. We hypothesized that inflammatory and disease-related factors, including PBM osteoclastogenic potential, are associated with systemic bone loss in axSpA and reflect differences between the radiographic and non-radiographic disease phenotypes.
2. Materials and Methods
1. AxSpA Patients
Patients were consecutively enrolled for this cross-sectional study. All participants were informed about the study’s purpose and procedures and provided written informed consent. The study protocol was approved by the ethical committee No 6482/2020, Institute of Rheumatology.
1. a. Patient Characteristics
The radiographic assessment and bone densitometry were performed on-site. Dual energy X-ray absorptiometry (DEXA) was used to evaluate BMD at three skeletal sites (lumbar spine, proximal femur, and femoral neck), with corresponding T-scores and Z-scores calculated for each site. Patients were stratified into “normal BMD” and “low BMD” groups to evaluate differences in clinical and biochemical markers and in the in vitro osteoclastogenesis. In accordance with the International Society for Clinical Densitometry guidelines [17], T-scores were used in males aged >50 years and postmenopausal females, whereas Z-scores were used in males aged <50 years and premenopausal females. Consistently with previously published axSpA cohorts [7,18], low BMD was defined as a T-score ≤−1.0 or a Z-score ≤−1.0, respectively. Importantly, to further support and expand the results obtained on clinical and serum biochemical markers during stratified analysis, we utilized continuous DEXA data for downstream analyses.
Disease activity scores Ankylosing spondylitis (AS) disease activity score with C-reactive protein (ASDAS-CRP), Bath AS disease activity index (BASDAI), and Bath AS functional index (BASFI) were evaluated by a rheumatologist based on respective questionnaires filled by patients during the clinical appointment. Other demographic and clinical characteristics such as biological sex, age, body mass index (BMI), disease and symptom duration, comorbidities, extra-articular manifestations, HLA-B27 positivity, and smoking were also recorded. In this study, “disease duration” was defined as the time from the date of clinical diagnosis confirmation to the date of assessment, while “duration of symptoms” referred to the time elapsed from the onset of musculoskeletal symptoms reported by patient (retrospectively assessed by a clinician as consistent with the disease) to the date of assessment.
Biochemical markers C-reactive protein (CRP), erythrocyte sedimentation rate (ESR), thyroid-stimulating hormone (TSH), parathormone (PTH), 25-hydroxyvitamin D3 (25(OH)D3), beta cross-linked C-telopeptides of type I collagen (bCTX), procollagen type I N-propeptide (PINP), osteocalcin, alkaline phosphatase bone isoform (bALP), RANKL, OPG, cathepsin K (CTSK), IL-6, and IL-17 were measured in patient sera; furthermore, an osteoclastogenic potential of PBM was assessed.
1. b. Inclusion and Exclusion Criteria
Only axSpA patients fulfilling the Assessment of SpondyloArthritis international Society criteria [19] or modified New York criteria [20] with no history of biological disease-modifying antirheumatic drugs (bDMARDs) treatment or anti-osteoporotic treatment, without other chronic inflammatory conditions (including chronic infections or other autoimmune disorders), were included in the study. The exclusion criteria consisted of pregnancy, malignancies, acute infection 14 days or less prior to the clinical appointment, any surgery (< 6 months before study) and any fracture (< 1 year prior to study).
2. Processing of Blood for Biochemical Assessment
Blood samples were drawn by a nurse in the morning following an overnight fast. Nine mL of whole blood collected into tubes containing CAT Serum Clot Activator (Vacuette) was centrifuged at 560 RCF for 10 min at 4 °C. Acquired serum was then centrifuged again at max RCF for 5 min at room temperature (RT) to get rid of all the remaining cells and cellular debris. Separated serum was aliquoted and stored at –80 °C for later analysis or use in the in vitro experiments.
3. Measurement of Serum Biochemical Markers
Commercially available ELISA kits were used for the measurement of serum IL-6, IL-17, OPG (all RayBiotech), RANKL (Biomedica) and CTSK (Elabscience). Procedures were performed according to the manufacturers’ instructions. Absorbance was read at 450 nm with 620 nm reference on the HiPo MPP-96 plate reader, and analyte concentrations were calculated using QuantAssay software (both Biosan).
ESR was measured on Lena analyzer (automatic ESR analyzer; Linear Chemicals) after one hour of sedimentation. Serum levels of CRP, TSH, PINP and bCTX were analyzed using COBAS pro (Roche), and 25(OH)D3, PTH, osteocalcin and bALP were measured on LIASON XL (Diasorin).
4. Processing of Blood for In Vitro Cultures
Peripheral blood mononuclear cells (PBMC) were isolated from whole blood collected in sodium citrate vacutainers (Vacuette). Briefly, twenty-seven mL of blood was diluted 1:1 with Hanks’ balanced salt solution (HBSS; EuroClone), layered over FicollPaque™ PLUS (GE Healthcare), and centrifuged at 360 RCF for 30 minutes at RT. The mononuclear cell layer was collected and washed three times in fresh HBSS with subsequent centrifugation at decreasing RCF (390 → 270 → 110) for 10 minutes at RT. Washed PBMC were then resuspended in pre-culture Dulbecco’s modified Eagle’s medium (DMEM) (EuroClone) supplemented with 10% fetal bovine serum, 1mM L-glutamine, and 1% penicillin/streptomycin. Finally, cells were seeded at the concentration 8×10⁵/well in 96-well plates (Nunc MicroWell plate; Thermo Fisher Scientific) and PBM were obtained after adhesion for 2–3 hours in a CO2 incubator at 37 °C.
5. In Vitro Osteoclast Generation Procedure and Evaluation
PBM were cultured in complete DMEM supplemented with 10% pooled patient serum, 1 mM L-glutamine, 1% penicillin-streptomycin, and 25 ng/mL recombinant human macrophage colony-stimulating factor (PeproTech). Serum pooling was based strictly on radiographic phenotype: cells from nr-axSpA and r-axSpA patients were cultured with serum pooled from N = 10 donors of the corresponding phenotype, respectively. Medium exchange was performed after the first 24 h and subsequently every 3 days until day 14 of culture. On day 14, cells were fixed with 4% paraformaldehyde for subsequent evaluation. All experiments were performed in technical triplicates.
Differentiated osteoclasts were stained using the Leukocyte Acid Phosphatase (TRAP) Kit (Sigma-Aldrich) according to the manufacturer’s instructions. TRAP-positive cells containing three or more nuclei were counted under an Olympus IX71 inverted microscope. The coefficient of variation (CV) for osteoclast counts determined in each well of the technical triplet was calculated in order to identify and remove outliers (CV > 45%), and the final average value from technical multiplet was used for statistical analysis.
6. Statistical Analysis
Statistical analysis and visualization were carried out in GraphPad Prism 8 (GraphPad Software, Inc.) and jamovi versions 2.3–2.6 (The jamovi project, retrieved from https://www.jamovi.org). Normality was assessed by Anderson-Darling, Shapiro-Wilk, and Kolmogorov-Smirnov tests; a significant result on any test led to rejection of normality. Logarithmic transformation was applied if the data followed log-normal distribution instead, whereas non-parametric tests were applied when the data did not follow normal or log-normal distribution. A small proportion of missing clinical/biochemical data was deemed missing at random or completely at random, both due to factors such as insufficient amount of biological material for analysis or errors in form completion by patient or clinician.
For comparing differences of continuous variables between two groups, Student’s t-test was used for normal or log-normal data. If the assumption of equal variances based on Levene’s test was not met, Welch’s t-test was employed. Non-parametric Mann-Whitney test was used for non-normally distributed data. Categorical variables were compared using chi-square (χ2) test with Yates’s correction or Fisher’s exact test for small samples. Cohen’s D, rank-biserial correlation, or Cramer’s V were calculated to express respective effect sizes. Where specified in the text, group comparisons were additionally adjusted for age using linear regression.
Bivariate correlations were evaluated using Pearson’s correlation coefficient (r) in case of normally or log-normally distributed data, or Spearman’s r for non-normally distributed data. Partial correlation analysis was employed to control for age.
Multivariable regression models were constructed by hypothesis-driven selection of variables. Complete-case analysis, excluding patients with any of the missing covariates, was employed. For linear models, values of serum biochemical markers were log-transformed to satisfy regression assumptions. Multicollinearity in models was addressed by calculating variance inflation factors (values < 5 considered acceptable) and outliers were detected by calculating Cook’s distances (< 1 considered acceptable). All models were adjusted for sex and age.
In the text, means are presented when the data followed normal distribution, whereas medians are presented in case of non-normal or log-normal distribution. In figures, data are presented as mean ± SD in case of normally/log-normally distributed variables and median + IQR in case of non-normally distributed variables. The statistical significance was set at p-value < 0.05. Because the subgroup comparisons across the serum biomarker panel were utilized primarily as a screening step to identify candidate biochemical markers and variables of interest for downstream analyses, no formal adjustment for multiple testing was applied. The primary conclusions are based on the subsequent multivariable regression models and in vitro study data.
3. Results
1. Descriptive Data and Participant Characteristics
A total of eighty-one axSpA patients were enrolled; their basic demographic and clinical characteristics are summarized in Table 1, together with the number of subjects available for each of these characteristics.
2. Clinical Parameters and Variation of Bone Markers According to Radiographic Status
A total of 47 patients in the cohort suffered from r-axSpA whereas 34 patients were diagnosed with nr-axSpA. Compared to nr-axSpA, patients with r-axSpA had longer disease duration (median 25 vs. 12 months, N = 45/34, p < 0.01) and symptom duration (median 10 vs. 5 years, N = 45/34, p < 0.001), higher disease activity (ASDAS-CRP: mean 2.52 vs. 1.84, N = 44/31, p < 0.05; BASDAI: median 4.20 vs. 2.20, N = 44/31, p < 0.05), worse BASFI (median 1.82 vs. 0.77, N = 43/30, p < 0.05), and elevated serum CRP (median 5.73 vs. 1.72 mg/L, N = 45/34, p < 0.01). Differences in disease activity scores, functional index, and CRP were age-adjusted and retained their significance levels after adjustment.
Regarding bone metabolism, r-axSpA patients exhibited significantly lower DEXA Z-scores at the femoral neck (mean −0.50 vs. 0.03, N = 44/31, p < 0.05; Figure 1A) and at the proximal femur (mean −0.42 vs. 0.03, N = 44/31, p < 0.05; Figure 1B) after adjusting for age. Conversely, at the lumbar spine, there was no significant difference (mean −0.60 vs. −0.35, N = 43/30, p = NS; Figure 1C). Additionally, serum bCTX levels were significantly lower in r-axSpA in both unadjusted and age-adjusted analyses (median 0.35 vs. 0.46 μg/L, N = 42/32, p < 0.05; Figure 1D), without an accompanying change in overall PINP/bCTX ratio (median 134 vs. 125, N = 42/32, p = NS).
Complete descriptive statistics, sample sizes, effect sizes, and p-values for all assessed variables are detailed in Supplementary Table S1. Unadjusted and age-adjusted regression coefficients and p-values for presented variables are provided in Supplementary Table S2.
3. Variation in Clinical and Biochemical Markers in axSpA Patients According to Their BMD at Different Skeletal Sites
Stratification by lumbar spine BMD showed that compared to normal BMD patients, those with low BMD were younger (median 31 vs. 39 years, N = 27/46, p < 0.05) and had lower BMI (median 22.9 vs 24.8, N = 27/46, p < 0.05), although the BMI difference was not significant after adjusting for age.
For the proximal femur, low BMD patients similarly exhibited lower BMI (median 22.5 vs 24.6, N = 21/54, p < 0.01), which remained significant after age adjustment. A higher concentration of IL-6 was detected in serum of low BMD patients (median 522 vs. 95 pg/mL, N = 20/49, p < 0.05), but the difference was not significant when controlling for age.
Conversely, at the femoral neck, patients with low BMD did not differ from those with normal BMD in age (median 38 vs. 36 years, N = 23/52, p = NS) or BMI (median 23.5 vs. 24.4, N = 23/52, p = NS). Low BMD at the femoral neck, however, was linked to variations in several serum bone metabolism markers. Levels of PTH were elevated in serum of low BMD patients (median 3.24 vs. 2.14 pmol/L, N = 22/50, p < 0.05; Figure 2A). Although 25(OH)D3 levels did not differ significantly between groups (mean 52.7 vs. 61.5 nmol/L, N = 22/51, p = NS), serum PTH correlated negatively with 25(OH)D3 across the axSpA cohort (unadjusted Pearson’s r = −0.26, age-adjusted Pearson’s r = −0.27, N = 73, p < 0.05).
Strikingly, low femoral neck BMD patients presented with lower serum RANKL concentrations compared to normal BMD group (median 1.80 vs. 2.60 pg/mL, N = 21/50, p < 0.05; Figure 2B) and an elevated OPG/RANKL ratio (median 43.0 vs. 28.3, N = 21/50, p < 0.05; Figure 2C). All presented relationships retained their significance levels after adjusting for age.
Complete descriptive statistics, sample sizes, effect sizes, and p-values for all assessed variables are detailed in Supplementary Tables S3–S5. Unadjusted and age-adjusted regression coefficients and p-values for presented variables are provided in Supplementary Table S2.
4. Association of Femoral Neck BMD with Serum OPG/RANKL Ratio
Given the markedly elevated serum OPG/RANKL ratio in patients with low femoral neck BMD, we hypothesized that this relationship could reflect a potential biological response to heightened bone resorption. To test the association between serum OPG/RANKL and femoral neck BMD on a continuous scale, we constructed a multivariable linear regression model adjusted for age, sex, and PTH (Table 2). In this model, each decrease of femoral neck Z-score by 1 was associated with a 30% increase in serum OPG/RANKL ratio (B = −0.38, 95% CI −0.65 to −0.10, N = 69, p < 0.01).
Because sex had a significant effect in the overall model, and a supplementary model supported potential interaction of BMD and sex (Supplementary Table S6), sex-stratified analyses were performed. In males, femoral neck Z-score was significantly associated with the serum OPG/RANKL ratio after adjustment for age and PTH (B = −0.57, 95% CI −0.94 to −0.19, N = 48, p < 0.01). A one-unit decrease in femoral neck Z-score corresponded to an estimated 48% increase in the OPG/RANKL ratio (Table 3). In contrast, no association was detected in females (B = −0.01, 95% CI −0.48 to 0.46, N = 21, p = NS), though this sub-analysis was limited by the small sample size relative to the number of model covariates (Supplementary Table S7).
5. Evaluation of Femoral Neck BMD and OPG/RANKL Ratio in Relation to r-axSpA
An elevated OPG/RANKL ratio suppresses bone resorption, potentially favoring pro-osteogenic conditions. To evaluate whether femoral neck BMD together with serum OPG/RANKL are associated with radiographic disease status, a multivariable logistic regression model including an interaction term between femoral neck BMD and OPG/RANKL, adjusted for age, sex, and ASDAS-CRP, was constructed (Table 4). This model supports an association of ASDAS-CRP and BMD with the radiographic phenotype of axSpA. A one-unit decrease in femoral neck Z-score was associated with approximately a 2-fold increase in the odds of having radiographic signs of axSpA (OR 1.96, 95% CI 1.05–3.70, N = 67, p < 0.05). This association is independent of OPG/RANKL ratio, which was not significantly associated with radiographic status.
6. Osteoclastogenic Potential of Peripheral Blood Monocytes Originating from axSpA Patients
Finally, we hypothesized that the osteoclastogenic potential of PBM is associated with patient BMD and radiographic disease status. A notable difference in osteoclast generation emerged in axSpA patients with low femoral neck BMD compared to those with normal femoral neck BMD: in the former group, osteoclastogenesis was 2.3× lower (mean number of differentiated osteoclasts 22 vs. 51, N = 10/11, p < 0.05; Figure 3A), which remained significant after adjusting for age. In contrast, osteoclast differentiation did not differ significantly between r-axSpA and nr-axSpA patients even after adjusting for age (median number of differentiated osteoclasts 21 vs. 40, N = 16/10, p = NS; Figure 3B).
4. Discussion
Our findings point to a complex relationship between inflammation, systemic bone loss, and radiographic disease in axSpA. Patients with r-axSpA had higher inflammatory activity, lower serum bCTX levels, and lower femoral BMD than those with nr-axSpA, while lumbar spine BMD did not differ between the groups. Reduced BMD was also associated with altered systemic osteoclast-regulatory markers and lower in vitro osteoclastogenic potential of peripheral blood monocytes. Importantly, the association of femoral neck BMD with the radiographic phenotype persisted after adjustment for inflammatory activity and serum OPG/RANKL, whereas OPG/RANKL itself was not associated with radiographic status. These findings suggest that systemic bone loss and radiographic disease in axSpA are related but may represent partly distinct aspects of bone pathology rather than a single linear process.
In our study, r-axSpA patients had significantly lower serum bCTX levels and lower proximal femur and femoral neck DEXA Z-scores than nr-axSpA patients, whereas lumbar spine Z-scores did not differ between the groups despite being lowest overall. This discrepancy may reflect ongoing spinal new bone formation, which could artificially increase lumbar spine BMD measurements in the r-axSpA subset. Despite known differences between r- and nr-axSpA in terms of disease activity [1,21], confirmed also in our study, the evidence regarding bone turnover markers in axSpA remains inconclusive [22], with limited literature directly comparing r-axSpA and nr-axSpA. A recent cross-sectional study reported no difference in PINP between the subgroups; however, it did not assess bCTX, and its findings may have been limited by a small number of subjects with nr-axSpA [23]. Another study reported elevated PINP but unchanged bCTX in r-axSpA [24], potentially influenced by similar symptom durations between the groups. In our cohort, lower bCTX levels together with an unchanged PINP/bCTX ratio may suggest an overall deceleration of bone turnover in r-axSpA, although the cross-sectional design limits this interpretation.
Multivariable regression revealed a moderate inverse relationship between femoral neck Z-scores and serum OPG/RANKL in our study. When stratified by sex, this association was markedly stronger in males with axSpA. Such sexual dimorphism may reflect hormonal regulation: estradiol modulates osteoblastic RANKL and OPG synthesis in vitro [25], and a sex-specific association between serum OPG and BMD has been reported, albeit with inconsistent findings [26,27,28]. Furthermore, a study directly comparing both sexes found that polymorphisms in genes encoding RANKL and OPG were associated with BMD selectively in males [29], supporting sex-dependent regulation. As male axSpA patients are at higher risk for bone loss [6,30], our findings suggest that serum RANKL and OPG may have potential as biomarkers for early bone loss in axSpA, although this requires further validation.
Serum RANKL and OPG levels did not differ between r-axSpA and nr-axSpA in our cohort. Data on serum RANKL and OPG are heterogeneous and the reasons for these discrepancies remain unclear [31]. Most studies have focused on r-axSpA without direct comparison with nr-axSpA or assessment of associations with BMD. Several studies reported higher OPG/RANKL and/or lower RANKL in sera of r-axSpA patients [13,32,33], in one case also accompanied by reduced PBM osteoclastogenesis [13]. In contrast and similarly to us, Gómez-García et al. [23] found no significant differences in RANKL and OPG between r-axSpA and nr-axSpA. Previous findings of an inverse correlation between serum OPG and BMD [34,35], as well as an association between OPG autoantibodies and low BMD in axSpA [36], are consistent with our finding of higher OPG/RANKL ratio in patients with reduced BMD and may indicate altered regulation of bone resorption.
Nevertheless, serum OPG/RANKL should be interpreted with a caution, as circulating levels do not fully reflect the bone microenvironment. In particular, the present assay did not capture membrane-bound RANKL, an important physiological effector in osteoclastogenesis [37]. In addition, RANKL and OPG derived from other immune and vascular cells may influence their serum levels and consequently, OPG/RANKL balance [38,39,40]. Notably, the reduced in vitro osteoclast differentiation observed in our study was consistent with lower serum RANKL and elevated OPG/RANKL ratio, supporting an association between altered osteoclast-regulatory signaling and reduced osteoclastogenic potential. This finding is also consistent with the phenotype reported by Caparbo et al. [13] in patients with long-standing r-axSpA.
We also evaluated whether OPG/RANKL contributed to the relationship between BMD and radiographic status in our mixed r-axSpA/nr-axSpA cohort. Multivariable logistic regression confirmed an inverse association between femoral neck Z-scores and radiographic signs, whereas OPG/RANKL was not independently associated with radiographic status. Thus, our findings do not support OPG/RANKL as a confounder of the association between low BMD and radiographic disease. Nevertheless, a cross-sectional design of our study does not allow to rule out a potential mediating role, which should be investigated longitudinally.
Finally, we observed no significant difference in osteoclastogenesis between r-axSpA and nr-axSpA; instead, osteoclastogenic potential in our cohort was primarily associated with BMD rather than radiographic status. The in vitro osteoclastogenesis assay provides an important biological context for the in vivo findings, showing that in addition to altered OPG/RANKL, patients with reduced BMD had lower osteoclastogenic potential. Although peripheral precursor dynamics might not properly reflect the site-specific bone remodeling in axSpA, the findings of Ke et al. [15] argue against such a disconnect. Previous research has established suppressed PBM osteoclast differentiation or reduced responsiveness to osteoclastogenic stimuli in r-axSpA compared with healthy controls [13,14,15,16]. Proposed mechanisms include peripheral precursor exhaustion [13], and the effect of bDMARDs treatment [13,14]. In our cohort, however, none of the patients received bDMARDs or anti-osteoporotic treatment, and disease and symptom duration were relatively short. These findings suggest that changes in osteoclastogenic potential may occur early in axSpA rather than solely as a result of the long duration of the disease or treatment.
Several limitations should be considered. The cross-sectional design prevents assessment of temporal relationships, while the relatively small sample size limits statistical power and may have prevented detection of more subtle associations. The application of ≤−1.0 Z-score BMD threshold may constrain direct comparability with studies employing standard diagnostic criteria. In addition, the use of pooled sera and the absence of healthy controls restrict interpretation of the in vitro findings and preclude direct assessment of whether the observed osteoclastogenic phenotype differs from that of the general population. Another limitation of our study is the difference in disease duration between the r-axSpA and nr-axSpA groups (median 25 vs. 12 months, respectively). Although this difference may indicate that our findings partly reflect early disease dynamics, the unequal disease duration may also have influenced the observed differences in bone metabolism. Longitudinal studies are therefore warranted to clarify the temporal relationships between disease progression and changes in bone metabolism. Finally, circulating OPG and RANKL provide only a partial representation of the local bone microenvironment. Despite these limitations, the concordant associations of reduced BMD with altered serum OPG/RANKL and reduced PBM osteoclastogenic potential support the presence of measurable alterations in osteoclast-regulatory biology in relation to bone loss in axSpA.
5. Conclusions
Our findings support the femoral neck as a particularly informative region for studying systemic bone loss in nr-axSpA and r-axSpA. Femoral neck BMD was associated with the serum OPG/RANKL ratio specifically in male patients, while lower femoral neck BMD was independently associated with the radiographic phenotype. Functional in vitro assays have further shown reduced osteoclastogenic potential in patients with lower femoral neck BMD, supporting the biological relevance of the observed bone-related phenotype. Together, these findings propose that systemic bone loss in axSpA is accompanied by alterations in both, circulating osteoclast-regulatory markers, and osteoclastogenic potential of peripheral precursors, although their relationship to radiographic disease appears to be more complex. Longitudinal studies are warranted to determine the temporal relationship between bone loss, osteoclast-regulatory pathways, and radiographic progression in axSpA.
Supplementary Materials
The following supporting information can be downloaded at the website of this paper posted on Preprints.org, Table S1-S7.
Author Contributions
P. Skubica: Conceptualization, Investigation (serum biochemical measurements), Data curation (serum biochemical data), Formal analysis, Visualization, Writing – original draft; E. Sebova: Conceptualization, Methodology, Investigation (sample collection and handling; in vitro cultures), Data curation (clinical data, in vitro data), Visualization, Writing – original draft; M. Husakova: Conceptualization, Data curation (clinical data), Resources, Project administration, Writing – review and editing; K. Pavelka: Resources, Supervision, Writing – review and editing; P. Dankova: Conceptualization, Methodology, Investigation (serum biochemical measurements), Supervision, Project administration, Writing – review and editing.
Funding
The funding sources were not involved in study design; in the collection, analysis and interpretation of data; in the writing of the report; and in the decision to submit the article for publication.
Institutional Review Board Statement
The study was conducted in accordance with the Declaration of Helsinki and approved by the Ethics Committee of Institute of Rheumatology (No 6482/2020; approved on 23/06/2020).
Informed Consent Statement
All patients provided written informed consent for participation and publication of aggregated results.
Data Availability Statement
The data that support this study are not publicly available due to privacy restrictions. Data will be made available from the corresponding author upon reasonable request.
Acknowledgments
The authors would like to thank all patients for their participation in the study, as well as Jana Sindelarova, Monika Gregova and Jirina Kvitkova for organization of clinical appointments. Generative AI (Gemini version 3.6) was used for language improvements during the writing process. The entire text was originally manually written first. Then, selected parts of text were edited with help of generative AI using prompts such as: “Make the following text shorter without losing overall meaning and any main points (scientific writing)” or “Suggest language improvements in the following text (scientific writing)” or “Get rid of repetition in the following text”. All generated content was carefully reviewed and further manually edited, if necessary. The authors take full responsibility for the content of the manuscript.
Conflicts of Interest
The authors declare no relevant conflicts of interest related to the current manuscript. All support received in the previous three years: Research grant dedicated to the Institute of Rheumatology in Prague: KP – NU23-10-00434, research project 00023728 by Ministry of Health, Czech Republic, project BBMRI.cz, reg. No. LM2023033. Meeting supports: MH – UCB Honoraria for lecture and speakers’ fees: KP – AbbVie, Pfizer, Eli Lilly, MSD, Biogen, UCB.
Abbreviations
AS: Ankylosing spondylitis; ASDAS-CRP: Ankylosing spondylitis disease activity score with C-reactive protein; axSpA: axial spondyloarthritis; bALP: alkaline phosphatase bone isoform; BASDAI: Bath ankylosing spondylitis disease activity index; BASFI: Bath ankylosing spondylitis functional index; bCTX: beta cross-linked C-telopeptides of type I collagen; bDMARDs: biological disease-modifying antirheumatic drugs; BMD: bone mineral density; BMI: body mass index; CRP: C-reactive protein; CTSK: cathepsin K; CV: coefficient of variation; DEXA: dual energy X-ray absorptiometry; DMEM: Dulbecco’s modified Eagle medium; ESR: erythrocyte sedimentation rate; HBSS: Hanks’ balanced salt solution; IL: interleukin (e.g., IL-17); nr-axSpA: non-radiographic axial spondyloarthritis; OPG: osteoprotegerin; OPG/RANKL: serum ratio of osteoprotegerin to receptor activator of nuclear factor kappa-B ligand; PBM: peripheral blood monocytes; PBMC: peripheral blood mononuclear cells; PINP: procollagen type I N-propeptide; PTH: parathormone; RANKL: receptor activator of nuclear factor kappa-B ligand; r: correlation coefficient; r-axSpA: radiographic axial spondyloarthritis; RT: room temperature; TRAP: leukocyte acid phosphatase; TSH: thyroid-stimulating hormone; 25(OH)D3: 25-hydroxyvitamin D3
References
- Protopopov, M.; Poddubnyy, D. Radiographic progression in non-radiographic axial spondyloarthritis. Expert Rev. Clin. Immunol. 2018, 14, 525–533. [Google Scholar] [CrossRef] [PubMed]
- Boel, A.; López-Medina, C.; van der Heijde, D.M.F.M.; van Gaalen, F.A. Age at onset in axial spondyloarthritis around the world: data from the Assessment in SpondyloArthritis international Society Peripheral Involvement in Spondyloarthritis study. Rheumatology 2022, 61, 1468–1475. [Google Scholar] [CrossRef] [PubMed]
- Navarro-Compán, V.; Sepriano, A.; Capelusnik, D.; Baraliakos, X. Axial spondyloarthritis. Lancet 2025, 405, 159–172. [Google Scholar] [CrossRef] [PubMed]
- Poddubnyy, D.; Sieper, J.; Akar, S.; Muñoz-Fernández, S.; Haibel, H.; Diekhoff, T.; Protopopov, M.; Altmaier, E.; Ganz, F.; Inman, R.D. Radiographic Progression in Sacroiliac Joints in Patients With Axial Spondyloarthritis: Results From a Five-Year International Observational Study. ACR Open Rheumatol. 2024, 6, 103–110. [Google Scholar] [CrossRef] [PubMed]
- Lim, M.J.; Kang, K.Y. A Contemporary View of the Diagnosis of Osteoporosis in Patients With Axial Spondyloarthritis. Front Med. 2020, 7, 569449. [Google Scholar] [CrossRef] [PubMed]
- Wang, D.M.; Zeng, Q.Y.; Chen, S.B.; Gong, Y.; Hou, Z.D.; Xiao, Z.Y. Prevalence and risk factors of osteoporosis in patients with ankylosing spondylitis: A 5-year follow-up study of 504 cases. Clin. Exp. Rheumatol. 2015, 33, 465–470. [Google Scholar] [PubMed]
- Bautista-Aguilar, L.; López-Medina, C.; Ladehesa-Pineda, L.; Ábalos-Aguilera, M.D.C.; Ruiz-Vilchez, D.; Garrido-Castro, J.L.; Gómez-García, I.; Puche-Larrubia, M.Á.; Salmoral-Chamizo, A.; Collantes-Estévez, E.; Escudero-Contreras, A.; Font-Ugalde, P. Prevalence and Associated Factors of Low Bone Mineral Density in the Femoral Neck and Total Hip in Axial Spondyloarthritis: Data from the CASTRO Cohort. J. Clin. Med. 2021, 10, 2664. [Google Scholar] [CrossRef] [PubMed]
- Gravallese, E.M.; Schett, G. Effects of the IL-23–IL-17 pathway on bone in spondyloarthritis. Nat. Rev. Rheumatol. 2018, 14, 631–640. [Google Scholar] [CrossRef] [PubMed]
- Sherlock, J.P.; Joyce-Shaikh, B.; Turner, S.P.; Chao, C.-C.; Sathe, M.; Grein, J.; Gorman, D.M.; Bowman, E.P.; McClanahan, T.K.; Yearley, J.H.; Eberl, G.; Buckley, C.D.; Kastelein, R.A.; Pierce, R.H.; LaFace, D.M.; Cua, D.J. IL-23 induces spondyloarthropathy by acting on ROR-γt+ CD3+CD4−CD8− entheseal resident T cells. Nat. Med. 2012, 18, 1069–1076. [Google Scholar] [CrossRef] [PubMed]
- Sato, K.; Suematsu, A.; Okamoto, K.; Yamaguchi, A.; Morishita, Y.; Kadono, Y.; Tanaka, S.; Kodama, T.; Akira, S.; Iwakura, Y.; Cua, D.J.; Takayanagi, H. Th17 functions as an osteoclastogenic helper T cell subset that links T cell activation and bone destruction. J. Exp. Med. 2006, 203, 2673–2682. [Google Scholar] [CrossRef] [PubMed]
- Yago, T.; Nanke, Y.; Kawamoto, M.; Furuya, T.; Kobashigawa, T.; Kamatani, N.; Kotake, S. IL-23 induces human osteoclastogenesis via IL-17 in vitro, and anti-IL-23 antibody attenuates collagen-induced arthritis in rats. Arthritis Res. Ther. 2007, 9, R96. [Google Scholar] [CrossRef] [PubMed]
- Kim, H.R.; Hong, Y.S.; Park, S.-H.; Ju, J.H.; Kang, K.Y. Low bone mineral density predicts the formation of new syndesmophytes in patients with axial spondyloarthritis. Arthritis Res. Ther. 2018, 20, 231. [Google Scholar] [CrossRef] [PubMed]
- Caparbo, V.F.; Saad, C.G.S.; Moraes, J.C.; de Brum-Fernandes, A.J.; Pereira, R.M.R. Monocytes from male patients with ankylosing spondylitis display decreased osteoclastogenesis and decreased RANKL/OPG ratio. Osteoporos. Int. 2018, 29, 2565–2573. [Google Scholar] [CrossRef] [PubMed]
- Engdahl, C.; Erlandsson, M.C.; Hallström, M.; Deminger, A.; Forsblad-d’Elia, H. Osteoclast development from peripheral blood monocytes is reduced in patients with radiographic axial spondyloarthritis on biological therapy. Arthritis Res. Ther. 2025, 27, 117. [Google Scholar] [CrossRef] [PubMed]
- Ke, D.; Dai, H.; Han, J.; Su, Y.; Zhu, H.; Zhang, R.; Gao, T.; Yang, L.; Yu, Y.; Bai, X.; Zhang, C.; Xu, J. Human peripheral osteoclast-precursor-development patterns reveal the significance of RPS17-dependent ribosome synthesis to Ankylosing Spondylitis lesions. Bone Res. 2025, 13, 100. [Google Scholar] [CrossRef] [PubMed]
- Perpétuo, I.P.; Caetano-Lopes, J.; Vieira-Sousa, E.; Campanilho-Marques, R.; Ponte, C.; Canhão, H.; Ainola, M.; Fonseca, J.E. Ankylosing Spondylitis Patients Have Impaired Osteoclast Gene Expression in Circulating Osteoclast Precursors. Front Med. 2017, 4, 5. [Google Scholar] [CrossRef] [PubMed]
- The Writing Group for the ISCD Position Development Conference (2004) Diagnosis of Osteoporosis in Men, Premenopausal Women, and Children. J. Clin. Densitom. 7, 17–26. [CrossRef] [PubMed]
- Arends, S.; Spoorenberg, A.; Efde, M.; Bos, R.; Leijsma, M.K.; Bootsma, H.; Veeger, N.J.G.M.; Brouwer, E.; van der Veer, E. Higher Bone Turnover Is Related to Spinal Radiographic Damage and Low Bone Mineral Density in Ankylosing Spondylitis Patients with Active Disease: A Cross-Sectional Analysis. PLoS ONE 2014, 9, e99685. [Google Scholar] [CrossRef] [PubMed]
- Sieper, J.; Rudwaleit, M.; Baraliakos, X.; Brandt, J.; Braun, J.; Burgos-Vargas, R.; Dougados, M.; Hermann, K.-G.; Landewé, R.; Maksymowych, W.; van der Heijde, D. The Assessment of SpondyloArthritis international Society (ASAS) handbook: a guide to assess spondyloarthritis. Ann. Rheum. Dis. 2009, 68, ii1–ii44. [Google Scholar] [CrossRef] [PubMed]
- Van Der, Linden S; Valkenburg, H.A.; Cats, A. Evaluation of Diagnostic Criteria for Ankylosing Spondylitis. Arthritis Rheum. 1984, 27, 361–368. [Google Scholar] [CrossRef] [PubMed]
- López-Medina, C.; Ramiro, S.; van der Heijde, D.; Sieper, J.; Dougados, M.; Molto, A. Characteristics and burden of disease in patients with radiographic and non-radiographic axial Spondyloarthritis: a comparison by systematic literature review and meta-analysis. RMD Open 2019, 5, e001108. [Google Scholar] [CrossRef] [PubMed]
- Liu, D.; Xie, Y.; Tu, L.; Wen, X.; Lv, Q.; Liu, B.; Yang, M.; Wu, X.; Zheng, X.; Luo, X.; Zhou, L.; Wu, J.; Liu, B.; Wang, K.; Jin, O.; Wang, X.; Qin, J.; Wu, L.; Zhao, D.; He, D.; He, S.; Huang, W.; Ye, S.; Zhou, H.; Wu, J.; Wang, Y.; Liu, S.; Li, Z.; Tan, Z.; Xu, C.; Wang, Y.; Zheng, D.; Zhan, F.; Lin, C.; Wen, Y.; Wu, J.; Wen, S.; Liao, Z.; Shen, Y.; Yang, K.; Gu, J. A guideline on biomarkers in the diagnosis and evaluation in axial spondyloarthritis. Front Immunol. 2024, 15, 1394148. [Google Scholar] [CrossRef] [PubMed]
- Gómez-García, I.; Ladehesa-Pineda, M.L.; Diaz-Tocados, J.M.; López-Medina, C.; Abalos-Aguilera, M.C.; Ruiz-Vilches, D.; Paz-Lopez, G.; Gonzalez-Jimenez, A.; Ranea, J.A.G.; Escudero-Contreras, A.; Moreno-Indias, I.; Tinahones, F.J.; Collantes-Estévez, E.; Ruiz-Limón, P. Bone metabolism and inflammatory biomarkers in radiographic and non-radiographic axial spondyloarthritis patients: a comprehensive evaluation. Front Endocrinol. 2024, 15, 1227196. [Google Scholar] [CrossRef] [PubMed]
- Li, X.; Liang, A.; Chen, Y.; Lam, N.S.; Long, X.; Xu, X.; Zhong, S. Procollagen I N-terminal peptide correlates with inflammation on sacroiliac joint magnetic resonance imaging in ankylosing spondylitis but not in non-radiographic axial spondyloarthritis: A cross-sectional study. Mod. Rheumatol. 2022, 32, 770–775. [Google Scholar] [CrossRef] [PubMed]
- Bord, S.; Ireland, D.; Beavan, S.; Compston, J. The effects of estrogen on osteoprotegerin, RANKL, and estrogen receptor expression in human osteoblasts. Bone 2003, 32, 136–141. [Google Scholar] [CrossRef] [PubMed]
- Indridason, O.S.; Franzson, L.; Sigurdsson, G. Serum osteoprotegerin and its relationship with bone mineral density and markers of bone turnover. Osteoporos. Int. 2005, 16, 417–423. [Google Scholar] [CrossRef] [PubMed]
- Jørgensen, L.; Vik, A.; Emaus, N.; Brox, J.; Hansen, J.-B.; Mathiesen, E.; Vestergaard, P. Bone loss in relation to serum levels of osteoprotegerin and nuclear factor-κB ligand: the Tromsø Study. Osteoporos. Int. 2010, 21, 931–938. [Google Scholar] [CrossRef] [PubMed]
- Khosla, S.; Arrighi, H.M.; Melton; III, L.J.; Atkinson, E.J.; O’Fallon, W.M.; Dunstan, C.; Riggs, B.L. Correlates of Osteoprotegerin Levels in Women and Men. Osteoporos. Int. 2002, 13, 394–399. [Google Scholar] [CrossRef] [PubMed]
- Hsu, Y.-H.; Niu, T.; Terwedow, H.A.; Xu, X.; Feng, Y.; Li, Z.; Brain, J.D.; Rosen, C.J.; Laird, N.; Xu, X. Variation in genes involved in the RANKL/RANK/OPG bone remodeling pathway are associated with bone mineral density at different skeletal sites in men. Hum. Genet 2006, 118, 568–577. [Google Scholar] [CrossRef] [PubMed]
- van der Weijden, M.A.C.; van der Horst-Bruinsma, I.E.; van Denderen, J.C.; Dijkmans, B.A.C.; Heymans, M.W.; Lems, W.F. High frequency of vertebral fractures in early spondylarthropathies. Osteoporos. Int. 2012, 23, 1683–1690. [Google Scholar] [CrossRef] [PubMed]
- Chen, M.; Hu, X.; Wu, M.; Yang, J.; Han, R.; Ma, Y.; Zhang, X.; Yuan, Y.; Liu, R.; Wang, M.; Jiang, G.; Deng, J.; Xu, S.; Xu, J.; Shuai, Z.; Pan, F. Serum Levels of OPG, RANKL, and RANKL/OPG Ratio in Patients with Ankylosing Spondylitis: A Systematic Review and Meta-analysis. Immunol. Invest 2019, 48, 490–504. [Google Scholar] [CrossRef] [PubMed]
- Korkosz, M.; Czepiel, M.; Guła, Z.; Stec, M.; Węglarczyk, K.; Rutkowska-Zapała, M.; Gruca, A.; Lenart, M.; Baran, J.; Gąsowski, J.; Błyszczuk, P.; Siedlar, M. Sera of patients with axial spondyloarthritis (axSpA) enhance osteoclastogenic potential of monocytes isolated from healthy individuals. BMC Musculoskelet. Disord. 2018, 19, 434. [Google Scholar] [CrossRef] [PubMed]
- Klingberg, E.; Nurkkala, M.; Carlsten, H.; Forsblad-d’Elia, H. Biomarkers of Bone Metabolism in Ankylosing Spondylitis in Relation to Osteoproliferation and Osteoporosis. J. Rheumatol. 2014, 41, 1349–1356. [Google Scholar] [CrossRef] [PubMed]
- Liu, J.; Zhao, L.; Yang, X.; Liu, C.; Kong, N.; Yu, Y.; Xuan, D.; Wan, W.; Xue, Y. Bone mineral density, bone metabolism-related factors, and microRNA-218 are correlated with disease activities in Chinese ankylosing spondylitis patients. J. Clin. Lab Anal. 2022, 36, e24223. [Google Scholar] [CrossRef] [PubMed]
- Stupphann, D.; Rauner, M.; Krenbek, D.; Patsch, J.; Pirker, T.; Muschitz, C.; Resch, H.; Pietschmann, P. Intracellular and surface RANKL are differentially regulated in patients with ankylosing spondylitis. Rheumatol. Int. 2008, 28, 987–993. [Google Scholar] [CrossRef] [PubMed]
- Hauser, B.; Zhao, S.; Visconti, M.R.; Riches, P.L.; Fraser, W.D.; Piec, I.; Goodson, N.J.; Ralston, S.H. Autoantibodies to Osteoprotegerin are Associated with Low Hip Bone Mineral Density and History of Fractures in Axial Spondyloarthritis: A Cross-Sectional Observational Study. Calcif. Tissue Int. 2017, 101, 375–383. [Google Scholar] [CrossRef] [PubMed]
- Zhang, T.; Feng, Y.; Wang, W.; Wang, W.; Shan, L.; Yang, X.; Sun, H.; Feng, S. Membrane-bound or soluble, mesenchymal or myeloid: which RANKL drives osteoclastogenesis? J. Transl. Genet Genom. 2026, 10, 74–88. [Google Scholar] [CrossRef]
- Chakravarti, A.; Marceau, A.-A.; Flamand, L.; Poubelle, P.E. Normal human primary CD4+ T lymphocytes synthesize and release functional osteoprotegerin in vitro. Lab Investig. 2008, 88, 171–184. [Google Scholar] [CrossRef] [PubMed]
- Kong, Y.-Y.; Feige, U.; Sarosi, I.; Bolon, B.; Tafuri, A.; Morony, S.; Capparelli, C.; Li, J.; Elliott, R.; McCabe, S.; Wong, T.; Campagnuolo, G.; Moran, E.; Bogoch, E.R.; Van, G.; Nguyen, L.T.; Ohashi, P.S.; Lacey, D.L.; Fish, E.; Boyle, W.J.; Penninger, J.M. Activated T cells regulate bone loss and joint destruction in adjuvant arthritis through osteoprotegerin ligand. Nature 1999, 402, 304–309. [Google Scholar] [CrossRef] [PubMed]
- Collin-Osdoby, P.; Rothe, L.; Anderson, F.; Nelson, M.; Maloney, W.; Osdoby, P. Receptor Activator of NF-κB and Osteoprotegerin Expression by Human Microvascular Endothelial Cells, Regulation by Inflammatory Cytokines, and Role in Human Osteoclastogenesis. J. Biol. Chem. 2001, 276, 20659–20672. [Google Scholar] [CrossRef] [PubMed]
Figure 1.
Differences in bone metabolism markers between r-axSpA and nr-axSpA patients. Panels show comparison of femoral neck Z-scores (A), proximal femur Z-scores (B), lumbar spine Z-scores (C), and serum levels of beta cross-linked C-telopeptides of type I collagen (bCTX) (D) between non-radiographic (nr-axSpA) and radiographic (r-axSpA) axial spondyloarthritis patients. Significantly lower Z-scores were observed in r-axSpA patients at the femoral neck (r-axSpA: mean ± SD −0.50 (1.16), N = 44; nr-axSpA: mean ± SD 0.03 (0.85), N = 31; Student’s t-test), at the proximal femur (r-axSpA: mean ± SD −0.42 (0.97), N = 44; nr-axSpA: mean ± SD 0.03 (0.98), N = 31; Student’s t-test), and lower r-axSpA serum concentrations of bCTX were detected (presented in log10 values – r-axSpA: mean ± SD −0.45 (0.22) μg/L, N = 42; nr-axSpA: mean ± SD −0.34 (0.17) μg/L, N = 32; Student’s t-test). No significant difference in Z-scores was observed at the lumbar spine (r-axSpA: mean ± SD −0.60 (1.59), N = 43; nr-axSpA: mean ± SD −0.35 (1.36), N = 30; Student’s t-test). Symbols: Dots represent values measured in individual patients; lines and whiskers represent mean ± SD; asterisk denotes statistical significance (* p<0.05). Abbreviations: NS: not significant.
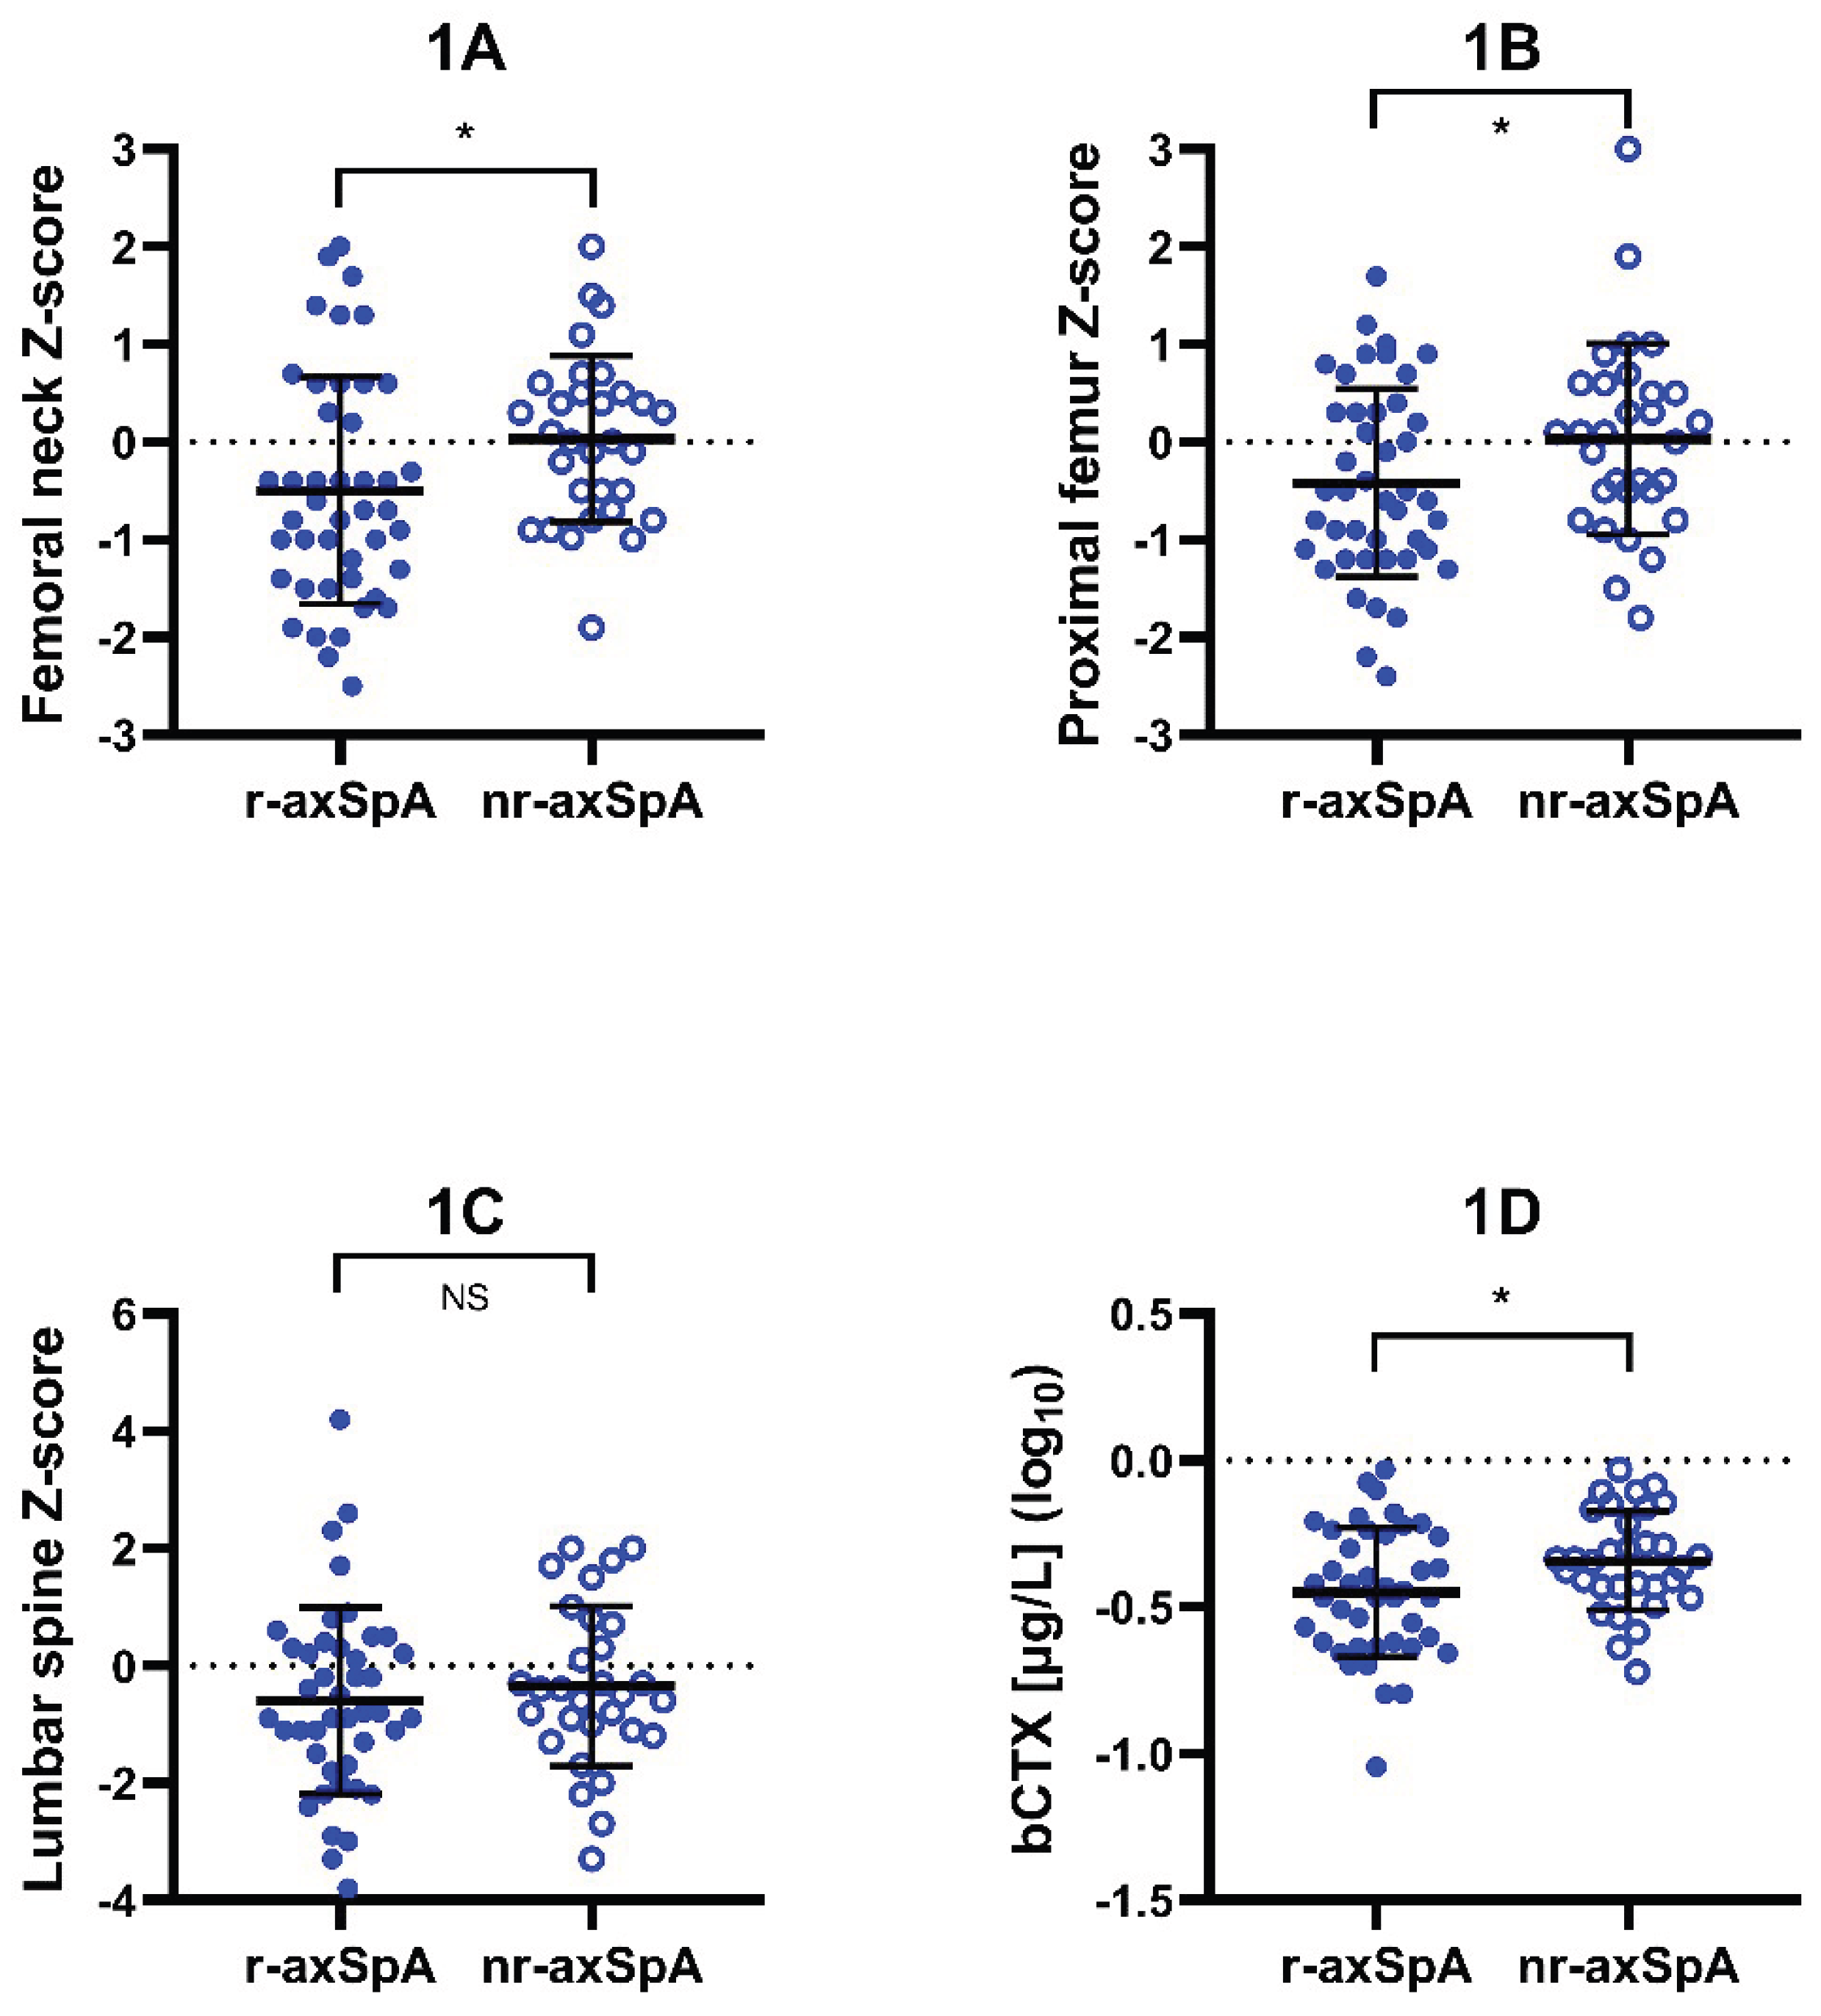
Figure 2.
Variations in serum bone metabolism markers according to BMD. Axial spondyloarthritis patients were divided into low bone mineral density (BMD) and normal BMD groups according to calculated T-scores and Z-scores at the femoral neck. T-scores were used in males older than 50 years and postmenopausal females, while Z-scores were utilized in males under 50 years of age and premenopausal females. Low BMD was defined as a T-score ≤ –1.0 or a Z-score ≤ –1.0, respectively. Panels show comparison of serum levels of parathormone (PTH) (A), receptor activator of nuclear factor kappa-B ligand (RANKL) (B), and osteoprotegerin (OPG)/RANKL ratio (C) between low BMD and normal BMD patients. Low BMD group had higher serum concentrations of PTH (presented in log10 values – low BMD: mean ± SD 0.48 (0.20) pmol/L, N = 22; normal BMD: mean ± SD 0.37 (0.17) pmol/L, N = 50; Student’s t-test) and higher OPG/RANKL ratio (presented in log10 values – low BMD: mean ± SD 1.67 (0.41), N = 21; normal BMD: mean ± SD 1.46 (0.37), N = 50; Student’s t-test), whereas the serum concentrations of RANKL were lower in low BMD patient group (presented in log10 values – low BMD: mean ± SD 0.24 (0.38) pg/mL, N = 21; normal BMD: mean ± SD 0.41 (0.26) pg/mL, N = 50; Student’s t-test). Symbols: Squares represent values measured in individual patients; lines and whiskers represent mean ± SD; asterisk denotes statistical significance (* p<0.05).
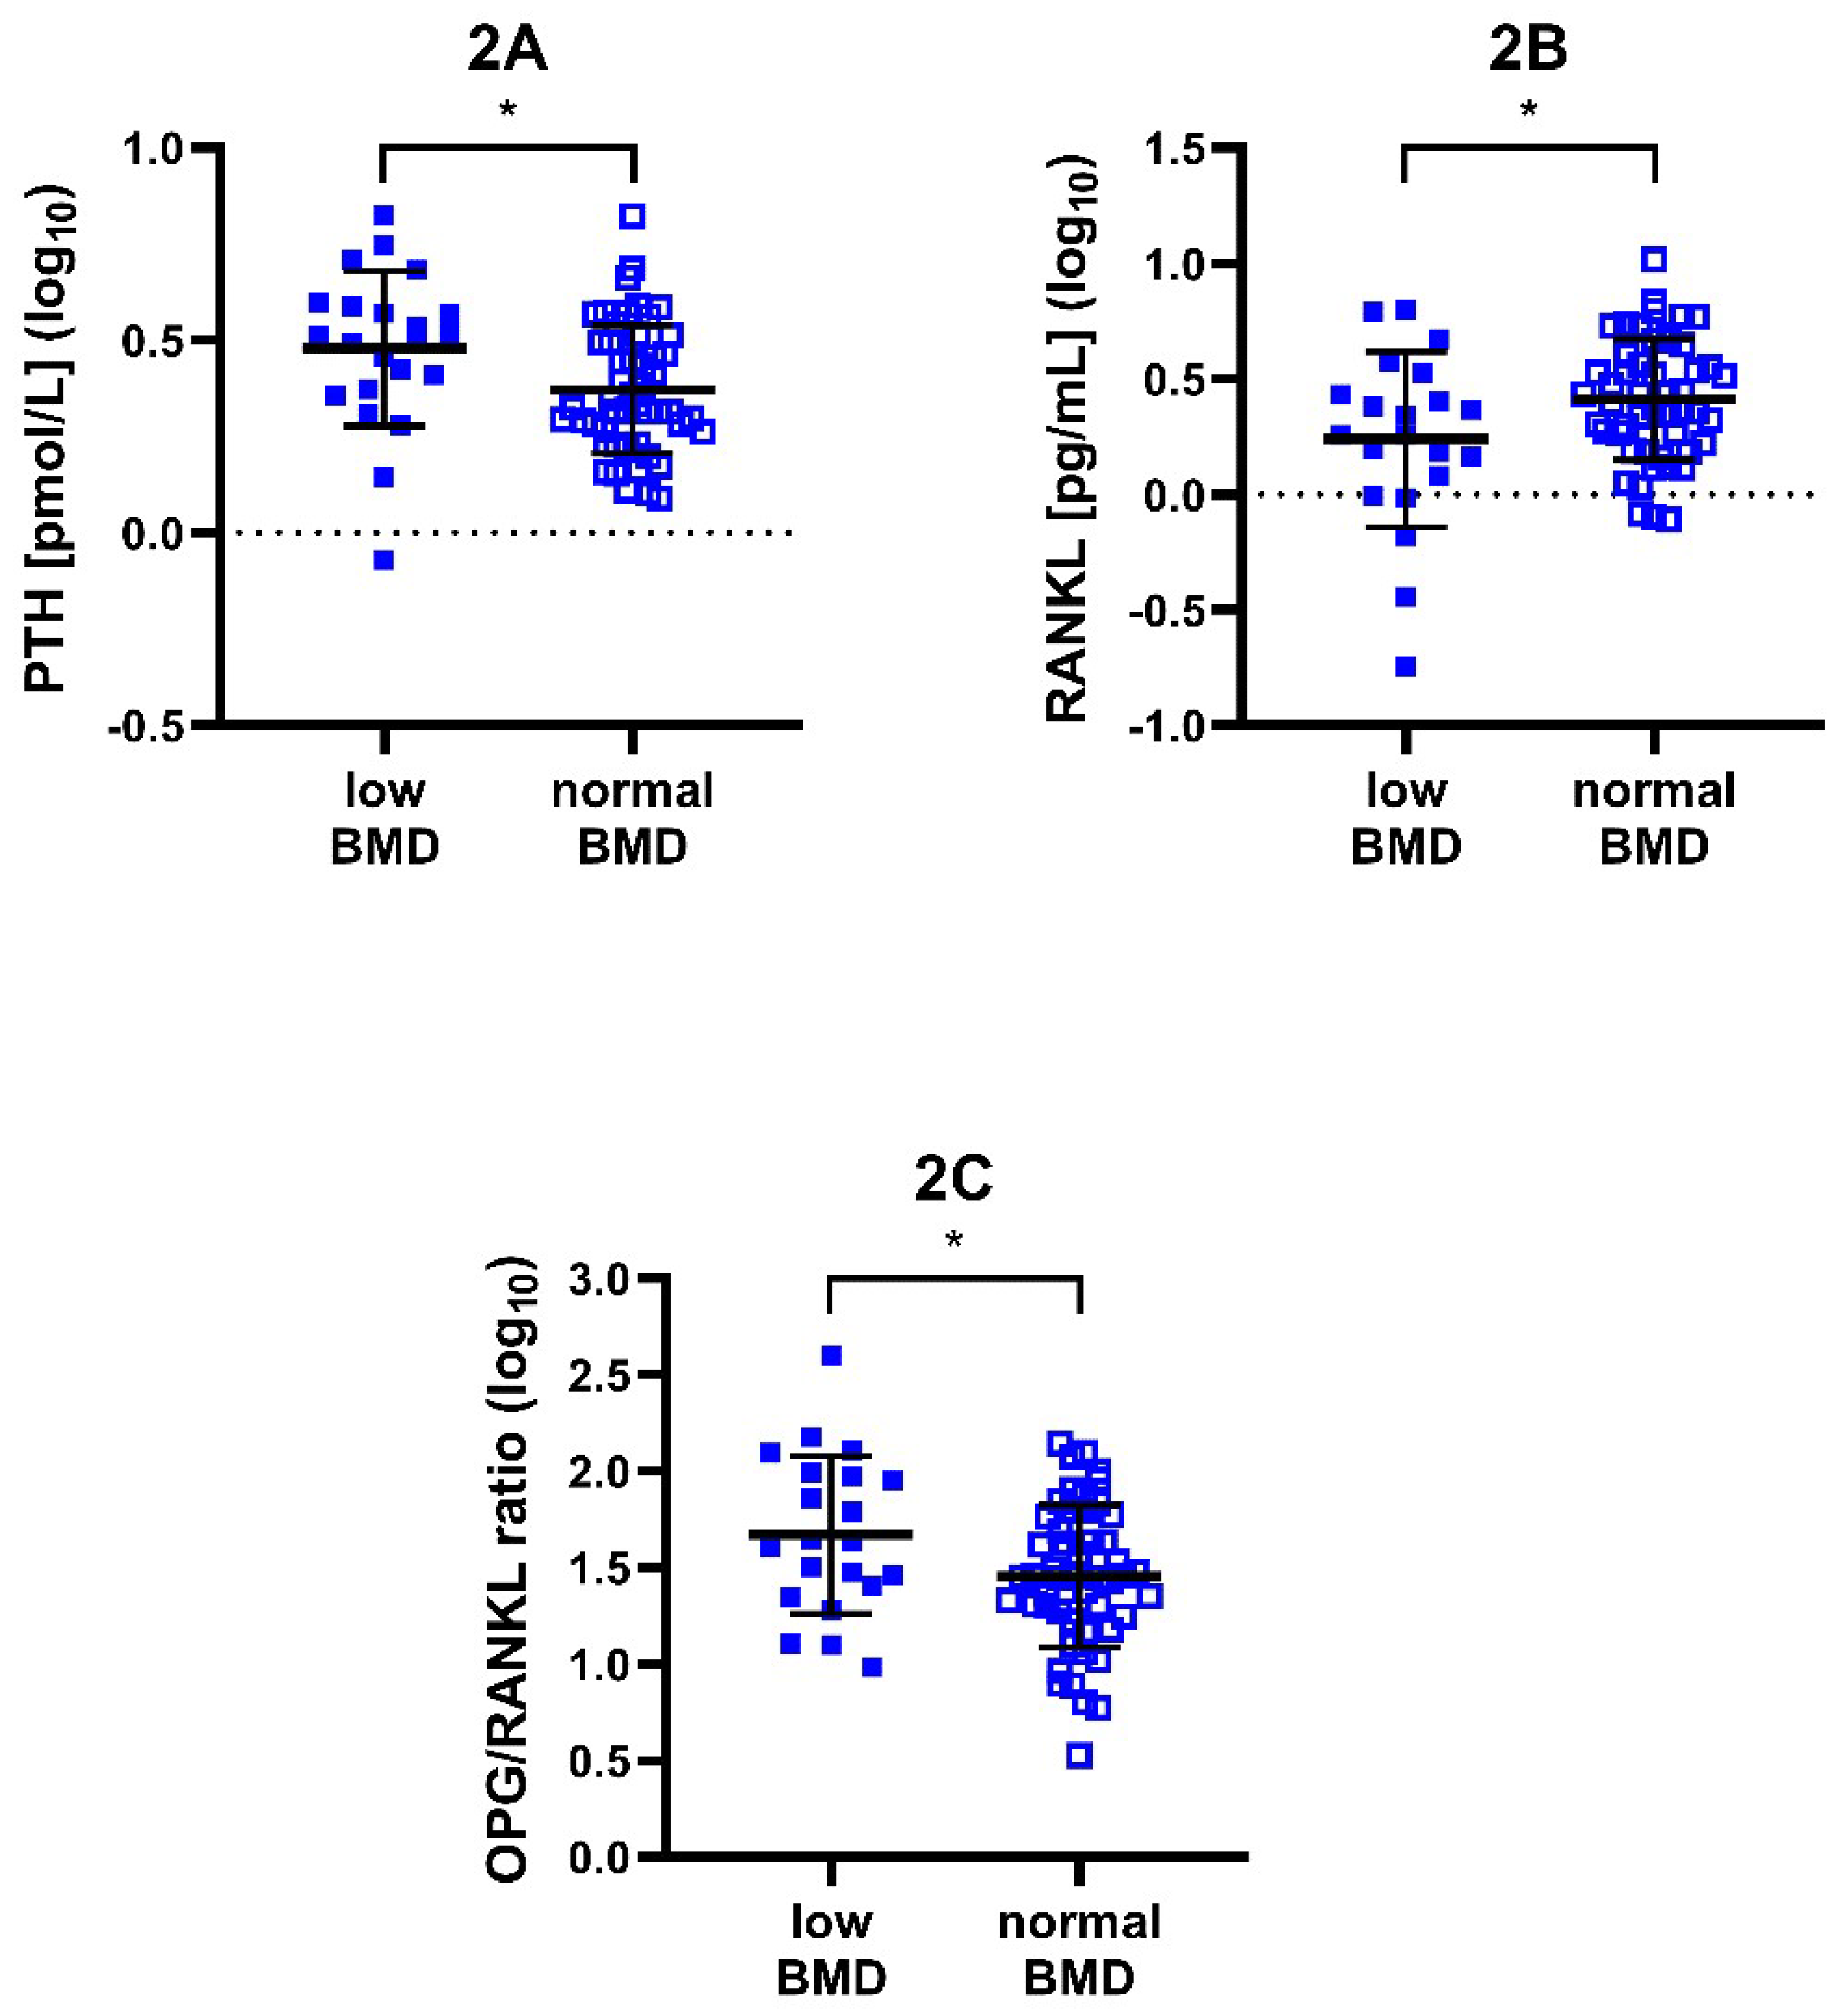
Figure 3.
In vitro osteoclast differentiation from PBM of axSpA patients. Axial spondyloarthritis (axSpA) patients were divided into low bone mineral density (BMD) and normal BMD groups according to calculated T-scores and Z-scores at the femoral neck. T-scores were used in males older than 50 years and postmenopausal females, while Z-scores were utilized in males under 50 years of age and premenopausal females. Low BMD was defined as a T-score ≤ –1.0 or a Z-score ≤ –1.0, respectively. Panels compare osteoclast counts derived from peripheral blood monocytes (PBM) of low BMD patients and normal BMD patients (A) or from patients with radiographic axSpA (r-axSpA) and non-radiographic axSpA (nr-axSpA) (B). Osteoclastogenesis was lower in patients with low BMD (low BMD: mean ± SD 21.5 (11.7) differentiated osteoclasts, N =10; normal BMD: mean ± SD 50.8 (33.9) differentiated osteoclasts, N = 11; Welch’s t-test). On the other hand, there was no difference in osteoclastogenesis between r-axSpA and nr-axSpA (presented in log10 values – r-axSpA: mean ± SD 1.31 (0.49) differentiated osteoclasts, N = 16; nr-axSpA: mean ± SD 1.53 (0.29) differentiated osteoclasts, N = 10; Student’s t-test). Symbols: Dots and squares represent values measured in individual patients; lines and whiskers represent mean ± SD; asterisk denotes statistical significance (* p<0.05). Abbreviations: NS: not significant.
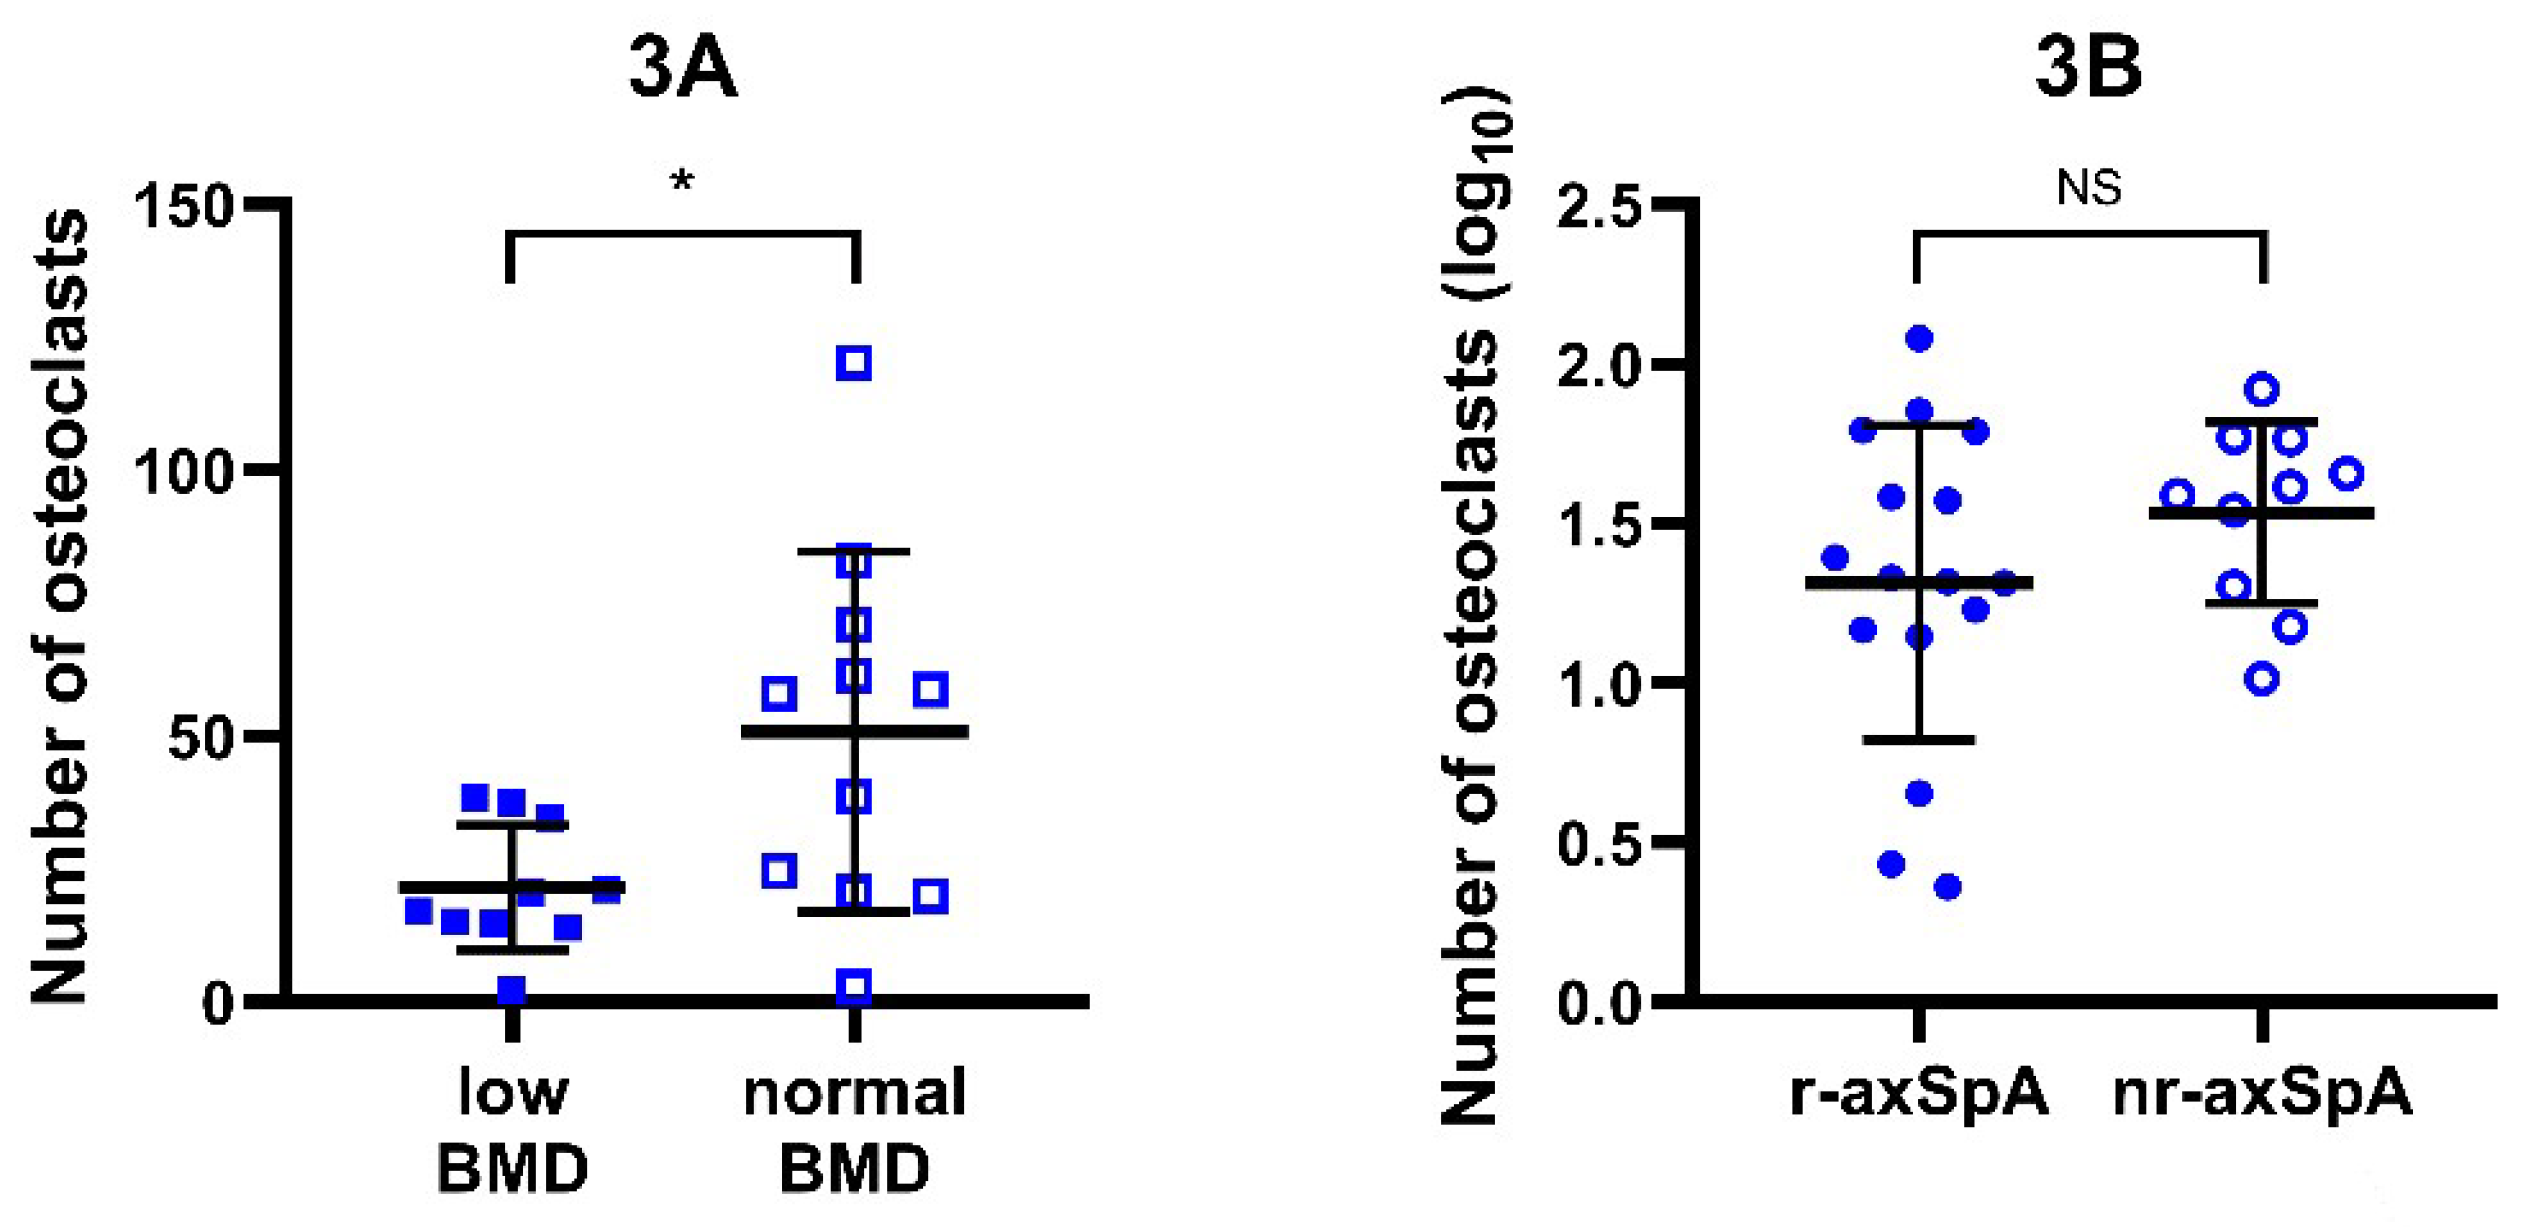

Table 1.
Basic demographic and clinical characteristics of axial spondyloarthritis (axSpA) patients.
Table 1.
Basic demographic and clinical characteristics of axial spondyloarthritis (axSpA) patients.
| Demographic/clinical marker | Value | Available N (Total N = 81) |
|---|---|---|
| Biological sex (males/females) [N] | 57/22 | 79 |
| Age (median + IQR) [years] | 36 (30–44) | 79 |
| BMI (median + IQR) | 24.3 (22.0–26.6) | 78 |
| Duration of disease (median + IQR) [months] | 17 (7–35) | 79 |
| Duration of musculoskeletal symptoms (median + IQR) [years] | 8 (4–14) | 79 |
| HLA-B27 positivity [yes/no] | 68/11 (86%) | 79 |
| Comorbidities [yes/no] | 14/65 (18%) | 79 |
| Smoking [yes/no] | 32/47 (41%) | 79 |
| bDMARDs [yes/no] csDMARDs [yes/no] NSAIDs [without/on demand/regular] |
0/81 (0%) 8/70 (10%) 2/43/33 (3%/55%/42%) |
81 78 78 |
| ASDAS-CRP (median + IQR) | 2.13 (1.16–3.09) | 75 |
| BASDAI (median + IQR) | 3.10 (0.75–4.84) | 75 |
| BASFI (median + IQR) | 1.24 (0.20–3.84) | 73 |
| DEXA lumbar spine Z-score (mean + SD) | −0.50 (1.50) | 73 |
| DEXA proximal femur Z-score (mean + SD) | −0.23 (0.99) | 75 |
| DEXA femoral neck Z-score (mean + SD) | −0.28 (1.07) | 75 |
| CRP (median + IQR) [mg/L] | 4.60 (1.42–8.47) | 79 |
| ESR (median + IQR) [mm/hr] | 6 (4–13) | 77 |
| TSH (mean + SD) [mIU/L] | 2.12 (0.85) | 75 |
| PTH (median + IQR) [pmol/L] | 2.48 (1.92–3.44) | 73 |
| 25(OH)D3 (median + IQR) [nmol/L] | 57.5 (40.4–74.5) | 75 |
Abbreviations: 25(OH)D3: 25-hydroxyvitamin D3; ASDAS-CRP: Ankylosing spondylitis disease activity score with C-reactive protein; BASDAI: Bath ankylosing spondylitis disease activity index; BASFI: Bath ankylosing spondylitis functional index; bDMARDs: biological disease-modifying antirheumatic drugs; BMI: body mass index; CRP: C-reactive protein; csDMARDs: conventional synthetic disease-modifying antirheumatic drugs; DEXA: dual energy X-ray absorptiometry; ESR: erythrocyte sedimentation rate; HLA-B27: human leukocyte antigen-B27; IQR: interquartile range; NSAIDs: non-steroidal anti-inflammatory drugs; PTH: parathormone; SD: standard deviation; TSH: thyroid-stimulating hormone.
Table 2.
Association of femoral neck Z-score with serum OPG/RANKL ratio.
| Model Fit Measures | ||||||||||||
| Overall Model Test | ||||||||||||
| R | R2 | AIC | F | df1 | df2 | p | ||||||
| 0.49 | 0.24 | 224.44 | 4.99 | 4 | 64 | 0.0015 | ||||||
| Model Coefficients – OPG/RANKL ratio (log2) | ||||||||||||
| 95% Confidence Interval | ||||||||||||
| Predictor | Estimate | SE | Lower | Upper | t | p | ||||||
| Intercept | 3.82 | 0.59 | 2.64 | 5.01 | 6.44 | < 0.0001 | ||||||
| Femoral neck Z-score | −0.38 | 0.14 | −0.65 | −0.10 | −2.75 | 0.0078 | ||||||
| PTH [pmol/L] (log2) | 0.30 | 0.25 | −0.19 | 0.79 | 1.21 | 0.2292 | ||||||
| Age [years] | 0.01 | 0.01 | −0.02 | 0.04 | 0.60 | 0.5527 | ||||||
| Sex (F – M) | 1.22 | 0.32 | 0.58 | 1.85 | 3.83 | 0.0003 | ||||||
Model estimated using sample size N = 69. Abbreviations: AIC: Akaike information criterion; df: degrees of freedom; OPG: osteoprotegerin; PTH: parathormone; RANKL: receptor-activator of nuclear factor kappa-B ligand; SE: standard error.
Table 3.
Association of femoral neck Z-score with serum OPG/RANKL ratio – males only.
| Model Fit Measures | ||||||||||||
| Overall Model Test | ||||||||||||
| R | R2 | AIC | F | df1 | df2 | p | ||||||
| 0.48 | 0.23 | 158.93 | 4.49 | 3 | 44 | 0.0078 | ||||||
| Model Coefficients – OPG/RANKL ratio (log2) | ||||||||||||
| 95% Confidence Interval | ||||||||||||
| Predictor | Estimate | SE | Lower | Upper | t | p | ||||||
| Intercept | 3.97 | 0.73 | 2.50 | 5.44 | 5.46 | < 0.0001 | ||||||
| Femoral neck Z-score | −0.57 | 0.19 | −0.94 | −0.19 | −3.03 | 0.0041 | ||||||
| PTH [pmol/L] (log2) | 0.28 | 0.34 | −0.40 | 0.97 | 0.84 | 0.4057 | ||||||
| Age [years] | 0.00 | 0.02 | −0.03 | 0.04 | 0.18 | 0.8545 | ||||||
Model estimated using sample size N = 48. Abbreviations: AIC: Akaike information criterion; df: degrees of freedom; OPG: osteoprotegerin; PTH: parathormone; RANKL: receptor-activator of nuclear factor kappa-B ligand; SE: standard error.
Table 4.
Connection of bone mineral density and serum OPG/RANKL ratio to presence of r-axSpA signs.
| Model Fit Measures | ||||||||||||
| Overall Model Test | ||||||||||||
| Deviance | AIC | R2McF | χ2 | df | p | |||||||
| 77.66 | 91.66 | 0.15 | 13.41 | 6 | 0.0370 | |||||||
| Model Coefficients – presence of radiographic signs | ||||||||||||
| 95% Confidence Interval | ||||||||||||
| Predictor | Estimate | SE | Z | p | Odds ratio | Lower | Upper | |||||
| Intercept | −2.04 | 1.21 | −1.69 | 0.0917 | 0.13 | 0.01 | 1.39 | |||||
| Femoral neck Z-score | −0.68 | 0.32 | −2.12 | 0.0338 | 0.51 | 0.27 | 0.95 | |||||
| OPG/RANKL ratio (median-centered) | 0.01 | 0.01 | 1.10 | 0.2703 | 1.01 | 0.99 | 1.02 | |||||
| ASDAS-CRP | 0.65 | 0.27 | 2.39 | 0.0169 | 1.91 | 1.12 | 3.24 | |||||
| Age [years] | 0.02 | 0.03 | 0.89 | 0.3712 | 1.02 | 0.97 | 1.08 | |||||
| Sex (F – M) | −0.43 | 0.64 | −0.68 | 0.4950 | 0.65 | 0.19 | 2.25 | |||||
| OPG/RANKL ratio (median-centered) ✻ Femoral neck Z-score | 0.00 | 0.01 | 0.41 | 0.6834 | 1.00 | 0.99 | 1.01 | |||||
Model estimated using sample size N = 67. Abbreviations: AIC: Akaike information criterion; ASDAS-CRP: Ankylosing spondylitis disease activity score with C-reactive protein; df: degrees of freedom; OPG: osteoprotegerin; R2McF: McFadden’s R-squared; RANKL: receptor-activator of nuclear factor kappa-B ligand; SE: standard error.
Disclaimer/Publisher’s Note: The statements, opinions and data contained in all publications are solely those of the individual author(s) and contributor(s) and not of MDPI and/or the editor(s). MDPI and/or the editor(s) disclaim responsibility for any injury to people or property resulting from any ideas, methods, instructions or products referred to in the content. |
© 2026 by the authors. Licensee MDPI, Basel, Switzerland. This article is an open access article distributed under the terms and conditions of the Creative Commons Attribution (CC BY) license (http://creativecommons.org/licenses/by/4.0/).
Copyright: This open access article is published under a Creative Commons CC BY 4.0 license, which permit the free download, distribution, and reuse, provided that the author and preprint are cited in any reuse.