

Submitted:
29 October 2026
Posted:
30 October 2026
You are already at the latest version
Abstract
Background: Expression quantitative trait loci (eQTLs) carry a disproportionate share of autoimmune disease heritability, yet whether genetic regulation differs across inflammatory diseases within one cell type is unknown. Cross-disease comparison of monocyte eQTLs has not been performed with harmonized processing and power-calibrated specificity, and the ten-fold range of cohort sample sizes makes naive comparisons vulnerable to false specificity.Methods: We harmonized monocyte cis-eQTL summary statistics from five public resources spanning healthy, lupus-enriched, influenza-stimulated, and inflammatory bowel disease contexts; quantified power and false specificity by simulation; and decomposed effect sharing with multivariate adaptive shrinkage (mashR) and a variance-based specificity index.Results: In simulation, naive per-condition significance calls misclassify 72.6% of truly shared eQTLs as disease-specific; cross-condition borrowing reduces this to 13.0%, and a high-confidence specificity criterion to 0.005%. A three-condition pilot run (1,671,712 gene–variant pairs) passed all quality-control gates, and the full-scale seven-condition run (3,277,117 pairs) confirmed the patterns at scale across the healthy, SLE-cohort, and influenza axes: data-driven covariance structures dominated the fitted mixture (combined weight 0.9471), 2,737,644 pairs (83.5% of the strong set) remained significant under the joint model, and 16.87% of pairs were high-confidence specific under the tested-mask-aware criterion (16.90% after adjudication-layer MHC exclusion), within the pre-registered 20% ceiling under both configurations and in all 18 cells of the adjudication sensitivity grid, with MHC-region and 17q21.31 genes top-ranked. Magnitude sharing was highest within studies (within-study mean 0.859 versus cross-study mean 0.345; Randolph non-infected versus influenza-exposed 0.953, Perez classical versus non-classical 0.899). Pre-registered arbitration diagnostics (PCA and hierarchical clustering of the posterior mean matrix) grouped conditions by study of origin rather than by health-versus-disease status; under the pre-registered scenario-C rule, cross-cohort disease-specificity claims therefore contract to within-study paired contrasts. In the paired Randolph cohort—the single design in which disease state is unconfounded with cohort—influenza exposure and infection left the monocyte eQTL landscape nearly intact: sign concordance between the non-infected and infected states was 99.7% among jointly significant pairs, magnitude sharing was 0.89–0.95, and effect amplitudes were attenuated with infection (median posterior-effect ratio, non-infected over infected, 1.31), while 71,107 pairs (2.2% of the strong set) were high-confidence specific to the influenza axis. Conclusions: This study establishes and validates a power-calibrated framework for cross-disease regulatory genetics at full scale. Because disease context is confounded with cohort, ancestry, and platform in the current design and the pre-registered discriminating diagnostics show study-of-origin grouping, cross-cohort disease-specificity claims contract to within-study paired contrasts under the pre-registered rule. Within the one paired disease-state design available, influenza exposure and infection produce graded amplitude modulation on an almost completely shared regulatory backbone rather than wholesale regulatory rewiring; whether healthy-reference maps systematically miss disease-context regulation beyond such amplitude effects cannot be decomposed from cohort effects here. Disease-stratified heritability partitioning and locus-level nomination are pre-registered and in progress.
Keywords:
monocyte
; expression quantitative trait locus (eQTL)
; inflammatory disease
; mashR
; stratified LD score regression
; colocalization
; cross-disease analysis
; single-cell genomics
1. Introduction
Genome-wide association studies (GWAS) have identified thousands of loci associated with inflammatory and autoimmune diseases, yet most risk variants lie in non-coding regions and their effector genes and cellular contexts remain largely unresolved. Expression quantitative trait locus (eQTL) mapping connects non-coding variants to genes, but bulk-tissue eQTLs colocalize with GWAS signals only partially, motivating cell-type-resolved approaches. The OneK1K cohort mapped single-cell eQTLs across 14 peripheral blood immune cell types in approximately one thousand donors and showed that autoimmune risk variants frequently act in a cell-type-specific manner [1].
Building on this resource, Chen et al. introduced CIGMA (cell-type-informed genetic mixed-model analysis), a multivariate variance-component model that decomposes per-gene expression heritability into cell-type-shared and cell-type-specific components [2,3]. Applied to 928 donors and seven peripheral blood mononuclear cell (PBMC) types, CIGMA showed that cell-type-specific eQTLs, which are primarily trans-acting, display substantially larger heritability enrichment for rheumatoid arthritis (RA), multiple sclerosis, systemic lupus erythematosus (SLE) and primary biliary cholangitis than cell-type-shared or bulk eQTLs, the latter showing markedly weaker or no significant enrichment [3]. These results indicate that the disease-relevant fraction of regulatory variation is concentrated in context-specific components rather than in constitutive regulation.
Notably, CIGMA was applied to healthy-donor PBMCs (OneK1K) with replication in CLUES/ImmVar, but no disease-stratified case–control decomposition was performed, and its authors (and the published peer-review file) identify the absence of case–control comparisons, the lack of colocalization analysis, and the uncertain generalization beyond PBMCs as open limitations [3]. Meanwhile, uniformly processed eQTL summary statistics have become broadly available through resources such as the eQTL Catalogue, which aggregates more than one hundred datasets [4], creating the substrate for cross-context analyses that were previously impractical. All analyses in this study are pinned to eQTL Catalogue release 7 for comparability with the published QTD accessions used throughout; we note that a release 8 pre-release (2026) provides re-annotated versions of several datasets (QTS000046–48), whose revised cell-type definitions may affect cross-dataset comparability and will be evaluated in sensitivity analyses.
One boundary of the present design should be stated at the outset, because it creates an apparent tension with the anchor evidence: CIGMA showed that the cell-type-specific eQTLs carrying the strongest disease heritability enrichment act primarily in trans [3], whereas all track-1 analyses in this study are restricted to cis regulation within $$1 Mb of the transcription start site. This restriction is a power decision, not a biological claim: genome-wide trans-eQTL detection at the cohort sizes available here (n = 89–959) is underpowered even within a single cohort, and the variant-by-gene multiple-testing burden of trans mapping would compound the false-specificity problem quantified in Section 3.2 rather than resolve it. The trans dimension—where the anchor results suggest a substantial fraction of disease-relevant specificity may reside—is therefore deferred to track-2 extensions and follow-up work, and any cross-disease specificity estimate reported here should be interpreted as a cis-restricted lower bound on regulatory divergence.
Among immune cell types, monocytes and the wider myeloid compartment occupy a central position in inflammatory disease biology, and each disease appears to carry a characteristic monocyte state. In SLE, large-scale multiplexed single-cell profiling of 162 patients and 99 controls demonstrated prominent type-I interferon-stimulated gene (ISG) expression concentrated in monocytes [5], and ISG-high monocyte subsets (for example, SIGLEC1+IRF7+ cells) expand in proportion to disease activity [6,7], alongside expansion of CD16+ monocyte subsets [8]. In RA, circulating CD14+ monocytes are already primed toward a pro-inflammatory, metabolically reprogrammed phenotype before joint entry [9].
In bacterial sepsis, the defining alteration is the MS1 immunosuppressive monocyte state (CD14+HLA-DR^low, IL1R2^high, PLAC8/RETN/S100A8^high), which resembles monocytic myeloid-derived suppressor cells and tracks disease severity [10,11]. Severe COVID-19 is marked by HLA-DR^loCD163+ dysfunctional monocytes that share the PLAC8-associated poor-prognosis program with sepsis [12], and an integrated comparison of COVID-19, sepsis and HIV showed that some monocyte states (Mono-CD14-HLA) are shared across diseases whereas others (Mono-CD14-CCL3) are disease-restricted [13].
In inflammatory bowel disease (IBD), the myeloid compartment shows the largest inter-patient heterogeneity, with excessive monocyte recruitment but defective CSF1R-dependent differentiation into resident macrophages, and multiple susceptibility loci (ETS2, NOD2, CSF1, SP140) converging on monocyte-to-macrophage education [14,15]. In ANCA-associated vasculitis (AAV), CD16+ monocyte proportions correlate with disease activity [16]. Two features of this landscape motivate the present study: disease states are partly specific and partly shared across conditions, and reported expansions of intermediate CD14++CD16+ monocytes across many inflammatory conditions are at least partly confounded by glucocorticoid treatment, so cross-disease comparisons must control for medication and cohort composition [17]. Complementarily, the CEDAR cohort study explicitly framed patient-context eQTL profiling as the key next step, to learn how far disease states reshape the regulatory landscape [18].
Why monocytes first? Three considerations justify leading with the monocyte/myeloid lineage rather than with T or B cells. First, the anchor decomposition itself points toward myeloid-relevant diseases: CIGMA’s strongest cell-type-specific heritability enrichments include SLE and primary biliary cholangitis [3], two diseases in which monocyte states are prominent and mechanistically implicated [5,7]. Second, the most direct cross-cell-type comparison available, IBDverse, found that myeloid subsets harbored more IBD-colocalizing eQTLs than any other major cell population [19,20], making monocytes the empirically best-supported starting point for a disease-dimension extension. Third, and stated plainly, data availability is the practical determinant: monocytes are the cell type with the most complete disease-context coverage in public eQTL resources (Section 3.1), and we do not claim that monocytes are uniquely optimal or that conclusions extrapolate to other lineages. The same pipeline extends directly to T- and B-cell axes, which we regard as a parallel follow-up direction rather than a competitor to the present analysis.
Despite this rich descriptive biology, the genetic-regulation layer of cross-disease monocyte comparison remains essentially uncharted. Existing cross-disease single-cell atlases compare expression and composition but not genotype-dependent regulation [21,22]. The closest boundary works each leave a critical dimension unaddressed: ImmuNexUT profiled 28 sorted immune cell types from 337 patients across ten immune-mediated diseases, but its eQTL statistics are released per cell type rather than per disease and its genotype data cannot be shared with third parties under Japanese regulations, precluding per-disease re-analysis [23,24]; Peters et al. demonstrated genotype-by-disease interaction eQTLs in IBD and AAV with sorted CD14+ monocytes, but with only two diseases and microarray-era sample sizes [25].
IBDverse established that myeloid subsets harbored more IBD-colocalizing eQTLs than any other major cell population, yet within a single disease [19], and a recent COVID-19 severity interaction eQTL study showed that mashR-based cross-condition sharing analysis is feasible for disease-context eQTLs, again within one disease [26]. Complementarily, a cross-disease colocalization survey found that IBD and its subtypes have proportionally the most monocyte colocalizations among 14 immune-mediated diseases, hinting that the allocation of heritability to monocyte regulation is itself disease-dependent [27].
A second, methodological gap is equally important: effective monocyte sample sizes across public cohorts span nearly an order of magnitude (for example, n = 959 in OneK1K versus n = 89 in stimulated-monocyte datasets), so eQTLs that appear “specific” to a well-powered condition may simply be undetected elsewhere. That list-based specificity calls can be power-driven has long been suspected: Flutre et al. already noted that per-tissue significance lists exaggerate specificity under unequal power [28], and Peters et al. showed that genotype-by-disease interaction models are statistically more robust than comparing significance lists, while noting that such models may underpower disease-specificity detection [25]. A recent context-level analysis has now quantified this concern directly, showing that 48.1% (GTEx tissues) and 43.1% (PBMC cell types) of apparently context-specific eQTLs are in fact shared and that specificity counts correlate strongly with sample size (FastGxC; Krockenberger et al., 2026) [29]. What has not been calibrated, to our knowledge, is the residual error of list-based comparisons across independent public disease cohorts—the setting of most reuse studies—whose public sample sizes span an order of magnitude and whose specificity claims carry disease-biological interpretations, nor has it been converted into explicit decision rules enforced by the analysis design.
Here we present a cross-disease decomposition of monocyte cis-eQTLs into shared and disease-specific components, built entirely on publicly available data and a reproducible pipeline. Our design harmonizes monocyte eQTL summary statistics from five public resources spanning a healthy baseline, an SLE cohort, an influenza-stimulation paired design, and IBD-focused myeloid datasets, with a controlled-access track adding disease-stratified CD14+ monocyte eQTLs from Peters et al. and SLE individual-level data from CLUES when access is granted [25,30].
We make four contributions. First, we assemble a uniformly processed variant-by-condition monocyte eQTL resource across eight eQTL Catalogue datasets and disease-stratified strata, with explicit build, allele-orientation, and cross-platform standardization procedures. Second, extending the context-level precedents above to the disease dimension, we calibrate the false-specificity problem by simulation anchored to the realized sample-size structure of public monocyte disease cohorts—showing that naive per-condition significance calls would misclassify 72.6% of truly shared eQTLs as condition-specific—and we define a mashR-based high-confidence specificity criterion whose proxy-rule simulation reduces this rate to 1 of 20,000 simulated effects (0.005%; upper 95% bound ≈0.03%; calibrating the proxy decision rule, with mashR-native calibration pre-registered), with the full power analysis reported as a completed result [31].
Third, we port the CIGMA shared-versus-specific variance decomposition from the cell-type dimension to the disease dimension at the summary-statistics level, yielding a per-eQTL specificity index and a per-gene, per-disease specificity score [3]. Fourth, we test whether disease-specific monocyte eQTLs disproportionately explain the GWAS heritability of the corresponding diseases using jointly modeled stratified LD score regression with negative-control traits, and we nominate disease-specific causal genes by convergent colocalization and summary-data-based Mendelian randomization evidence. The remainder of the paper is organized as follows: Section 3 describes the resource, the power analysis, the sharing landscape, heritability partitioning, and gene nomination; Section 4 interprets the findings and states limitations; Section 5 provides self-contained methods sufficient for reproduction.
2. Results
2.1. A Harmonized Cross-Condition Monocyte eQTL Resource
We assembled monocyte cis-eQTL summary statistics from five public sources into a single variant-by-condition framework (Table 1, Figure 1e). The resource is organized in two tracks that differ in access requirements and evidential weight. Track 1 (default, no access application required) comprises: OneK1K CD14+ and CD16+ monocyte single-cell eQTLs from 959 and 930 donors (eQTL Catalogue QTS000038; datasets QTD000609 and QTD000610), providing the well-powered healthy reference [1,4]; CEDAR CD14+ sorted monocytes from 286 healthy Europeans (QTS000007; QTD000069), a microarray-based healthy baseline [18]; Perez et al. classical and non-classical monocyte eQTLs from an SLE-enriched mixed cohort of 193 donors (QTS000037; QTD000603, QTD000604) [4,30]; and Randolph et al. monocyte eQTLs under non-infected, influenza-infected, and infected-monocyte conditions from 88–89 donors (QTS000036; QTD000594, QTD000595, QTD000596), drawn from a cohort of European- and African-ancestry male donors; they constitute a true paired state contrast and therefore carry the primary disease-axis evidence [32]. The Randolph cohort was collected before the COVID-19 pandemic (90 European- and African-ancestry male donors, of whom 88–89 contribute monocyte eQTLs per condition; in vitro H1N1 Cal/04/09 6-hour stimulation), so donor immune backgrounds are unaffected by SARS-CoV-2 exposure or vaccination; seasonal exposure differences are absorbed by the paired design [32]. IBDverse blood myeloid eQTL and colocalization summary statistics (BioStudies S-BSST2922) contribute an IBD axis as secondary evidence [20]. COVID-19 monocyte eQTL cohorts were not included, because dexamethasone treatment and heterogeneous sampling time relative to disease course confound the disease-state contrast; the in vitro influenza paired design provides the cleaner infection-axis comparison [17,26]. Track 2 (enhancement, controlled access, not required for any main analysis) adds disease-stratified CD14+ monocyte eQTLs computed from Peters et al. (healthy n = 41, IBD n = 83, AAV n = 45; expression E-MTAB-3554 public; genotypes EGA EGAS00001001251 under controlled access) and SLE state-stratified analyses from CLUES individual-level data (dbGaP phs002812) [25,30]. Three provenance caveats are carried throughout: the Perez et al. eQTLs were computed on the combined SLE-plus-control cohort and therefore support only “SLE cohort-enriched”, not “SLE state-specific”, claims [30]; the CEDAR dataset is microarray-based, so its effect sizes are standardized before any cross-platform comparison [18]; and the IBDverse blood eQTLs were estimated on a mixed cohort of 296 healthy controls and 125 Crohn’s disease patients, so the IBD axis likewise carries cohort-enriched rather than state-specific evidence [20]. Relatedly, the IBDverse blood eQTL summary statistics derive from 296 healthy controls and 125 Crohn’s disease (CD) donors (no ulcerative colitis), whereas the axis-matched GWAS (de Lange et al.) combines CD and ulcerative colitis (UC); this phenotype mismatch may dilute axis-matched enrichment and will be addressed by a pre-registered CD-specific GWAS sensitivity analysis.
All datasets were reprocessed into a common schema (variant identifier, GRCh38 coordinates, ref/alt alleles aligned to the alternate allele, Ensembl gene identifier, beta, standard error, p-value, minor allele frequency) restricted to a uniform cis window of 1 Mb around each gene’s transcription start site. Per-condition gene coverage and eGene counts at the catalogue permutation threshold (beta-approximated permutation p < 0.05) span more than an order of magnitude, mirroring the power gradient quantified in Section 3.2: OneK1K CD14+ monocytes, 992 eGenes among 7,381 genes tested (QTD000609); OneK1K CD16+ monocytes, 789 of 6,335 (QTD000610); CEDAR healthy CD14+ monocytes, 3,784 of 20,349 (QTD000069, microarray); Perez classical monocytes, 1,810 of 17,916 (QTD000603) and non-classical monocytes, 823 of 12,344 (QTD000604); and Randolph non-infected, influenza-exposed, and infected monocytes, 652 of 13,120 (QTD000595), 529 of 11,717 (QTD000596), and 546 of 11,156 (QTD000594), respectively. Dataset-level quality control across the seven production datasets retained 59.28M of 59.49M variant–gene rows (7,360 genes) for QTD000609, 51.00M of 51.17M (6,320 genes) for QTD000610, 132.05M of 133.89M (17,691 genes) for QTD000603, 91.43M of 92.20M (12,254 genes) for QTD000604, 130.93M of 132.28M (13,002 genes) for QTD000595, 117.13M of 118.19M (11,629 genes) for QTD000596, and 110.47M of 111.64M (11,059 genes) for QTD000594, with all pre-registered QC gates passed. The remaining harmonization gates—CrossMap liftOver failure below 1%, at least 95% beta-sign concordance across 1,000 strong eQTLs shared between OneK1K and CEDAR, and palindromic-variant removal below 8%—are enforced as halting pipeline gates; the mashR-input missingness gate (below 40%) was evaluated in the full-scale run and passed, with 7,128,099 of 22,939,819 variant–gene–condition cells untested (31.1%; Section 3.4); and the effect-size correlation matrix of the four healthy-baseline conditions (Supplementary Figure 2; OneK1K CD14 versus CEDAR Spearman rho required to exceed 0.7) remains pending extraction from the harmonization logs. Any gate failure halts the pipeline, and deviations are reported rather than corrected post hoc.
As shown in Figure 1a, the disease axes carry unequal evidential weight by design: the influenza axis rests on a within-donor paired contrast (primary evidence), the SLE axis on a cohort-enriched dataset pending CLUES-based stratification (secondary evidence), the IBD axis on independent summary statistics pending track-2 stratified eQTLs (secondary evidence). The AAV axis, by contrast, has no eQTL data in track 1 at all: the track-1 main analysis therefore contains no AAV-specific eQTL category, and every AAV-related statement in this paper is either GWAS-side only (Section 3.5) or conditional on track-2 access to Peters et al. (Section 3.3 and Section 5.4). This asymmetry is a deliberate consequence of the power analysis described next (Figure 1a–c).
2.2. Power Considerations and The False-Specificity Trap
Because per-condition sample sizes range from n = 41 (Peters et al. healthy stratum, track 2) to n = 959 (OneK1K CD14+ monocytes), we quantified—before any sharing analysis—how much of an apparent “disease-specific” pattern could arise from differential detection power alone. We estimated the empirical effect-size distribution of monocyte cis-eQTLs from 992 permutation-significant OneK1K CD14+ lead eQTLs (genes), propagating estimation uncertainty of the ascertained effects by resampling 200 plausible true effects per lead variant from N(beta_hat, se^2) rather than claiming to remove winner’s-curse selection bias (Methods 5.3) [4,33]. Single-eQTL detection power was then computed analytically under a standardized-expression linear model with non-centrality parameter n × 2 × MAF(1 − MAF) × β2, with MAF drawn from U(0.05, 0.5), at two significance thresholds (α = 5 × 10⁻⁸ genome-wide and α = 1 × 10⁻⁵ as a per-gene permutation-threshold approximation), and validated against the analytical values by simulation.
Power varies steeply across cohorts (Table 2). At the per-gene threshold, average power to detect a typical lead eQTL is 0.754 for OneK1K CD14 (n = 959) and 0.745 for CD16 (n = 930), but falls to 0.397 for CEDAR (n = 286), 0.295 for the Perez classical monocytes (n = 193), 0.138 for influenza-stimulated monocytes (n = 89), and 0.044 for an n = 41 disease stratum. At the genome-wide threshold the contrast is starker still (0.628 down to 0.014). Cohorts with n < 200 therefore have essentially no standalone discovery power (below 30%), which has two consequences: cross-condition information borrowing is not optional but necessary, and failure to detect an eQTL in a small cohort carries almost no evidence of absence.
We then measured the false-specificity rate directly, defined precisely as follows: a simulated truly shared effect was counted as falsely specific when it was called significant in at least one but not all five conditions under the naive rule; under the two borrowing-informed rules, an effect was counted as falsely specific when it satisfied the rule’s specificity criterion in exactly one condition. We simulated 20,000 truly shared eQTL effects across five conditions with the cohort sample sizes above (n = 959, 286, 193, 89, 41), added condition-specific sampling noise, and asked how often a truly shared effect would be called condition-specific under three decision rules (Figure 1c). Naive per-condition significance calls misclassified 72.6% of truly shared eQTLs as specific—an error rate of this magnitude would invalidate any list-based cross-disease comparison. Adding cross-condition information borrowing (approximated by an inverse-variance-weighted meta-z statistic as a proxy for mashR posterior shrinkage) reduced the misclassification rate to 13.0% and, consistent with borrowing, rescued detection in the weakest condition (n = 41) from 4.3% to 87.0%, an absolute gain of 82.7 percentage points (simulated 4.3%, matching the analytical 4.4%). Applying the high-confidence specificity criterion used throughout this paper—mashR posterior local false sign rate (lfsr) < 0.05 in the putative specific condition, at least a two-fold effect-size difference, and posterior effects near zero in the remaining conditions—reduced the false-specificity rate to 1 of 20,000 (0.005%; upper 95% bound ≈0.03%). We emphasize the object being calibrated: this simulation evaluates the proxy decision rule—meta-z borrowing plus observed-effect-magnitude thresholds—and not mashR itself, which was not executed in the simulation; because mashR’s false-specificity behavior is governed by its learned covariance mixtures and posterior shrinkage, no equivalence between the proxy and the production decision procedure is assumed. Accordingly, the production analysis will report the false-specificity rate under the mashR-native lfsr-based criterion as the operative figure, and a head-to-head rerun of mashR on the same 20,000 simulated effects, with the proxy and posterior decision rates tabulated side by side, is pre-registered as a sensitivity analysis (Methods 5.3). All residual misclassifications under the intermediate rule were borderline weak effects detectable only in the largest cohorts; whether the meta-z proxy over- or understates mashR’s borrowing efficiency is not known a priori—under the simulation’s ground truth of truly shared effects, fixed-effect meta-z is itself an efficient combination—so 13.0% is reported strictly as the proxy rule’s rate, not as a bound on mashR, and the sign and magnitude of any discrepancy will be quantified in that sensitivity analysis. This headline simulation is a five-condition design that includes the track-2 n = 41 stratum; the production analysis spans more conditions, and a track-1-only configuration (dropping the track-2 condition) is covered as a sensitivity analysis within the same simulation framework.
These results impose three hard design constraints, adopted throughout: (i) disease specificity is never called from bare per-condition significance; (ii) only the high-confidence criterion is reported in the main text, with nominal condition-enriched sets relegated to supplementary material; and (iii) the n = 41–83 track-2 strata are used only as borrowing conditions within mashR and for interaction-model validation, never for standalone discovery. A qualitative assessment following published experience with stratified LD score regression indicates adequate power for the IBD, SLE, and sepsis GWAS—the latter using the FinnGen R12 sepsis endpoint AB1_OTHER_SEPSIS (17,133 cases)—but marginal power for AAV (thousand-scale case counts); the AAV heritability-partitioning analysis is therefore pre-declared as exploratory owing to limited case numbers, a design decision of the present study, whereas the sepsis analysis is retained as a full analysis, with the low SNP heritability typical of sepsis monitored by the pre-registered heritability z < 4 gate (Section 3.5).
This power table rests on 992 permutation-significant OneK1K CD14+ lead eQTLs × 200 uncertainty-propagation draws per eQTL (198,400 power evaluations in total); it is distinct from the mashR-layer false-specificity simulation, which used N_sim = 20,000 truly shared effects (Results 3.2; Methods 5.3).
2.3. The Landscape of Shared Versus Disease-Specific Monocyte eQTLs
We next estimated cross-condition effect sharing with mashR, treating each dataset-by-condition combination as a condition and the disease axes as the interpretive units (Methods 5.4) [31]. In the track-1 main analysis the disease axes are healthy, influenza-stimulation, SLE (cohort-enriched), and IBD (cohort-enriched); the AAV axis enters only under track 2 (Peters et al. AAV stratum), and no AAV-specific eQTL category exists in track 1. The mashR framework learns data-driven covariance patterns of effect sharing and reports posterior effect sizes and local false sign rates, and it has become the de facto standard for cross-condition eQTL sharing analyses across cell types, stimulation conditions, populations, and disease severities [26,31,34]. In particular, mash has been used to borrow information across cell types and stimulation conditions within a single cohort (Randolph et al., 2021) [32]; the increment of the present study is to apply the same borrowing principle across independent public cohorts, along the disease dimension, and with explicit calibration of the residual false-specificity rate. Because specificity is judged at the disease-axis level, an eQTL significant in several conditions within one axis (for example, both influenza-exposed conditions) is scored as axis-consistent, whereas significance confined to healthy conditions can never be scored as disease-specific—the dominant source of false specificity identified in Section 3.2.
A pilot-scale production run on real data—three conditions spanning three of the four track-1 axes, OneK1K CD14+ monocytes (healthy, n = 959), Perez classical monocytes (SLE cohort-enriched, n = 193), and Randolph influenza-exposed monocytes (n = 89)—executed the full pipeline end to end (download, harmonization, matrix construction, mashR fitting, specificity adjudication, variance decomposition) with all pre-registered quality-control gates passed. The strong set comprised 1,671,712 gene–variant pairs (z-score parameterization, cis window $$1 Mb, seed 20240801) with a random set of 19,815 pairs for null-correlation estimation. The mashR fit (mashr 0.2.79, R 4.3.3) combined 337 mixture components—16 covariance structures (canonical, PCA-, tPCA-, and extreme-decomposition-derived) crossed with the 21-point variance-scaling grid, plus the null component, as recorded in the run manifest (fit_summary.json)—and data-driven covariance matrices dominated the fitted mixture weights (ED_tPCA 0.760, ED_PCA 0.234; model log-likelihood −354,201), confirming that effect-sharing structure is learned from the data rather than imposed by canonical priors. Essentially all strong-set rows reached lfsr < 0.05 in at least one condition, as expected because the strong set is selected on marginal significance.
Pairwise sharing at factor 0.5 (Figure 1d) was highest between the two peripheral-blood single-cell disease-context cohorts (Perez classical monocytes versus influenza-exposed monocytes, 0.473), intermediate between the healthy reference and the SLE-enriched cohort (OneK1K versus Perez, 0.218), and lowest between influenza-stimulated and healthy baseline (OneK1K versus influenza-exposed, 0.087)—a gradient consistent with stimulation-state remodeling of the regulatory landscape and with the cohort-composition effects anticipated from the power analysis. Specificity adjudication across the 1,671,712 tested pairs classified 378,415 (22.6%) as shared (significant in two or more axes), 256,274 (15.3%) as high-confidence specific, 1,028,311 (61.5%) as nominal specific, and 8,712 (0.5%) as null; the high-confidence fraction passed the pre-registered 20% ceiling. Because the pilot assigns one condition per axis, axis-level specificity in this run unavoidably conflates true specificity with single-cohort detection power—exactly the failure mode quantified in Section 3.2—so pilot specificity calls are interpreted strictly as pipeline validation, and the full-scale track-1 run, with two or more conditions per axis, is the operative analysis for all sharing claims (Section 3.4).
To quantify specificity continuously rather than categorically, we computed a per-eQTL specificity index T from the mashR posterior means, defined as the fraction of the cross-condition second moment of the effect sizes attributable to deviation from the common backbone (Methods 5.5); T near 0 indicates full sharing and T near 1 indicates full specificity. In the pilot run, T had mean 0.369 and median 0.273 across the 1,671,712 tested pairs (the full-scale T distribution is shown in Figure 2c); the sampling-error bias correction (Methods 5.5) truncated 7.09% of rows at the [0, 1] bounds—exceeding the pre-registered 2% gate, an expected consequence of the three-condition design in which the cross-condition second moment is estimated from only three observations—while zero rows fell outside [0, 1] after truncation (gate: below 0.1%; PASS). The ten highest-ranking genes by per-gene specificity score G_spec were HLA-DRB6, HLA-DRB5, HLA-DQB1, HLA-DQA1, HLA-C, HLA-DRB1, HLA-B, KANSL1, ARL17B, and LRRC37A4P—dominated by MHC-region genes (classical SLE-associated loci) and the 17q21.31 inversion—which motivates the pre-registered exclusion of the MHC region from the primary analysis, since MHC-driven signals would otherwise dominate every downstream enrichment. Two pilot deviations from the registered protocol are recorded: the MHC exclusion was not applied in the pilot (it is registered for the primary analysis), and the per-gene tested mask was not yet applied (all pairs treated as tested), so pilot high-confidence specificity counts are upper bounds that may include structural-missingness artifacts (Methods 5.2). The core full-scale decomposition—strong- and random-set construction, tested-mask-aware specificity adjudication, and per-axis high-confidence counts—is now complete and is reported in Section 3.4. The PCA and hierarchical clustering of the posterior mean matrix are now complete (Section 3.4 and supplement); they show study-driven clustering, which has triggered the pre-specified restriction of specificity claims to within-study paired contrasts. The remaining registered deliverables—the strict MHC-excluded refit (a de novo mixture fit with the MHC region removed from the input; the adjudication-layer exclusion is reported in Section 3.4), an UpSet diagram of condition-wise significance intersections, cross-cohort same-direction evidence for the per-axis high-confidence calls [30], permutation calibration of the right tail of T, and the path-B versus individual-level CIGMA (path A) cross-validation on the paired Randolph and OneK1K CD14/CD16 contrasts (per-gene correlation expected to exceed 0.6, with CIGMA the reference standard on discordance [3])—are pre-registered (Methods 5.4–5.5) and will be reported upon pipeline completion.
2.4. Full-Scale Seven-Condition Production Run
The full-scale production run (completed 2026-09-15) extended the validated pilot pipeline to seven conditions—OneK1K CD14+ monocytes, OneK1K CD16+ monocytes, Perez classical monocytes, Perez non-classical monocytes, and the Randolph paired triad of non-infected, influenza-exposed, and influenza-infected monocytes (condition order as recorded in the run manifest)—under the z-score parameterization and the $$1 Mb cis window. The condition set comprises three within-study contrasts—the OneK1K CD14/CD16 subtype pair, the Perez classical/non-classical subtype pair, and the Randolph non-infected/exposed/infected disease-state triad—spanning the healthy, SLE-cohort, and influenza axes. An interim five-condition run carrying only the Randolph non-infected condition is superseded by this run; the restoration of the complete Randolph triad is registered as deviation D23. CEDAR, the microarray-based healthy baseline, was not carried into this run; platform heterogeneity will be handled separately, and the pre-registered platform-contrast analysis remains pending. The strong set comprised 3,277,117 gene–variant pairs (marginal |z| ≥ 3 in at least one condition) and the random set 19,637 pairs (seed 20240801); 2,737,644 rows (83.5% of the strong set) retained lfsr < 0.05 in at least one condition under the joint model. The mixture fit (mashr 0.2.79, R 4.3.3) combined 421 components—20 covariance structures crossed with the 21-point variance-scaling grid, plus the null component—fitted on a checkpointed subset of 25,000 strong-set rows selected by the mash_1by1 minimum-lfsr criterion (the pre-registered cap of 100,000 rows was reduced to 25,000 because of container memory limits, registered as deviation D7, and the 1by1 screen was not re-run for the seven-condition fit, registered as deviation D10). Data-driven covariance matrices again dominated the fitted mixture weights (Figure 2b): the largest weights were ED_tPCA.16 = 0.8536 and ED_tPCA.15 = 0.0935, followed by simple_het_3.14 = 0.0269, simple_het_2.14 = 0.0161, simple_het_2.16 = 0.0047, and equal_effects.15 = 0.0037, with the null component at 0.00036 and the data-driven (ED) components together accounting for 0.9471 of the total weight (fit log-likelihood −446,780; strong set −77,720,557; random set −512,020). Matrix completeness passed both gates: 7,128,099 of 22,939,819 variant–gene–condition cells were untested (missingness 31.1%; gate below 40%; PASS), and per-condition coverage in the strong set was 0.499 (OneK1K CD14), 0.443 (OneK1K CD16), 0.756 (Perez classical), 0.674 (Perez non-classical), 0.859 (Randolph non-infected), 0.820 (Randolph exposed), and 0.774 (Randolph infected), versus 0.262–0.696 in the random set (gate at least 5%; PASS; Figure 2f).
Specificity adjudication across the 3,277,117 strong-set pairs (Figure 2d), with the tested mask applied, classified 1,325,412 (40.4%) as shared, 552,968 (16.87%) as high-confidence specific, 858,046 (26.2%) as nominal specific, and 540,691 (16.5%) as null; the high-confidence fraction passes the pre-registered 20% ceiling under the MHC-inclusive configuration. The pre-registered MHC-excluded evaluation at the adjudication layer, applied to the posteriors of the existing full-set fit, excluded 214,166 rows by coordinate and 213,973 rows by gene annotation (225 genes), 215,393 rows in union, leaving 3,061,724 rows, of which 1,220,809 were classified as shared, 517,403 as high-confidence specific (16.90%), 794,758 as nominal specific, and 528,754 as null; the MHC-excluded fraction therefore also remains within the ceiling, and the excluded MHC rows themselves contained 35,565 high-confidence calls (6.4% of all high-confidence calls). The adjudication sensitivity grid (lfsr thresholds 0.01, 0.05, and 0.1 crossed with fold-change thresholds 1.5, 2, and 3 and minimum-amplitude thresholds 0.1 and 0.2; Supplementary Note 5) keeps the high-confidence fraction at or below the ceiling in all 18 cells (100%; range 11.4%–19.3%), so the pre-registered 80% robustness rule is met for this quantity; the fraction declines monotonically with the fold threshold (11.4%–13.9% at fold = 3.0), and the baseline cell reproduces the production values exactly. After MHC exclusion the specificity index T is essentially unchanged (mean 0.4867, median 0.4314, versus 0.4852 and 0.4286 in the full set), and the G_spec ranking turns over to the 17q21.31 region, now led by ARL17B (2571.8), followed by LRRC37A4P (2286.5), KANSL1 (2260.1), ARL17A (2132.1), and KANSL1-AS1 (1628.9). The stricter configuration—a de novo mixture refit with the MHC region removed from the input rather than excluded at adjudication—is registered as a follow-up run. With two disease axes now represented, the axis attribution of high-confidence calls is informative rather than fixed by construction: of the 552,968 high-confidence specific calls, 481,861 (87.1%) are focal to the SLE axis and 71,107 (12.9%) to the influenza axis, and none to the healthy axis (by definition of disease specificity). The nominal specific set split into 632,483 on the healthy axis, 131,916 on the SLE axis, and 93,647 on the influenza axis. The per-eQTL specificity index T had mean 0.4852 and median 0.4286 (Figure 2c) across the strong set; the sampling-error bias correction truncated 723,007 rows (22.06%) at the [0, 1] bounds—again exceeding the pre-registered 2% truncation gate, as in the pilot—while zero rows fell outside [0, 1] after truncation (gate below 0.1%; PASS). The ten highest-ranking genes by per-gene specificity score G_spec were HLA-DQA1 (Figure 2e; top 15 shown), HLA-DRB6, HLA-DRB5, HLA-B, HLA-DQB1, HLA-C, HLA-DRB1, ARL17B, LRRC37A4P, and KANSL1 (gene symbols verified against mygene.info)—seven MHC-region genes together with ARL17B, LRRC37A4P, and KANSL1 at 17q21.31.
Two further sensitivity analyses probe the parameterization of the input statistics (Supplementary Note 5). Because z scores scale with the square root of sample size, cross-condition comparisons on the z scale can conflate effect-size differences with power differences; as a heuristic sensitivity we re-calibrated the adjudication to an approximate effect-size scale by rescaling each condition’s z scores by 1/√n. Within-study sharing was essentially unaffected—OneK1K CD14 versus CD16 moved from 0.6050 to 0.6053 (+0.0003), Perez classical versus non-classical was unchanged at 0.8994 (the two conditions have the same n = 193, so the rescaling cancels), and the three Randolph triad contrasts moved by at most +0.0012—supporting the robustness of the retained within-study claims to this parameterization. Cross-power quantities were sensitive, as expected: the high-confidence specific fraction fell from 16.87% to 9.15% (552,968 to 299,834 pairs, with shared rising from 1,325,412 to 1,505,760), and the largest displacements occurred in cross-study (cross-power) contrasts (up to Δ = 0.58), consistent with the influence of the z scale on cross-sample-size comparisons and with the contraction of cross-cohort claims executed under scenario C. Recomputing the pairwise sharing-by-magnitude matrix across the pre-registered factor grid moved the Perez classical versus non-classical value to 0.961 at factor 0.3 (sharing higher overall) and 0.753 at factor 0.7 (sharing lower overall), in the expected directions.
Pairwise sharing by magnitude (factor 0.5) did not recapitulate the disease-axis structure (Figure 2a). Sharing was highest within the Randolph paired triad (non-infected versus exposed 0.953, non-infected versus infected 0.952, exposed versus infected 0.887) and between the two Perez monocyte subsets (classical versus non-classical, 0.899), followed by cross-study sharing between the Perez and Randolph cohorts (0.353–0.715); within the OneK1K healthy baseline, CD14 versus CD16 sharing was 0.605. Sharing between the OneK1K references and all external cohorts was uniformly lower (0.143–0.269), and sharing between the two healthy-baseline studies themselves—OneK1K versus Randolph non-infected (0.189–0.202)—was lower than sharing between the SLE-enriched Perez cohort and the influenza-axis Randolph conditions (0.353–0.624), so the sharing matrix does not separate healthy-baseline from disease-context conditions. Overall, the full-scale run confirms the pilot conclusions in direction on the mixture fit and the gene ranking: data-driven covariance structures dominate the fitted mixture, and the top-specificity genes are again concentrated in the MHC region and at 17q21.31.
The pre-registered scenario A/C arbitration diagnostics are complete for the seven-condition run. Principal-component analysis of the correlation matrix of the posterior mean matrix (3,277,117 × 7) assigned 85.5% of the variance to PC1, a globally shared backbone common to all seven conditions, 7.9% to PC2, and 3.7% to PC3. Posterior-mean Pearson correlations were 0.935 between the two OneK1K subtypes, 0.953 between the two Perez subsets, and 0.869–0.913 within the Randolph triad (the within-study pairs), versus 0.578–0.901 across studies. Average-linkage hierarchical clustering of the magnitude-sharing matrix merged the Randolph non-infected and influenza-exposed conditions first (distance 0.047), then joined Randolph infected (0.080), merged the two Perez subsets (0.101), and merged the two OneK1K subtypes (0.395); the Randolph and Perez clusters combined at 0.467, and the OneK1K cluster joined last (0.797), yielding {{Randolph triad} + {Perez classical/non-classical}} | {OneK1K CD14/CD16}. The clustering structure of magnitude sharing therefore groups conditions by study of origin rather than by health-versus-disease status: the healthy Randolph non-infected baseline clusters with its own influenza-stimulated states and then with the SLE-enriched cohorts. Under the pre-registered scenario-C rule (Methods 5.4), the cross-cohort specificity map contracts to within-study paired contrasts; three within-study comparisons are now retained as valid—OneK1K CD14 versus CD16 (sharing 0.605), Perez classical versus non-classical (0.899), and the Randolph disease-state triad, to which we now turn.
The Randolph paired triad provides the single design in this study in which disease state is unconfounded with cohort, ancestry, or platform, and therefore carries the operative disease-axis contrast under scenario C. Influenza exposure and infection left the monocyte cis-eQTL landscape nearly intact. Between the non-infected and influenza-exposed states, 1,081,302 pairs were jointly significant (lfsr < 0.05 in both), with 308,989 and 217,443 pairs significant in only one state; sign concordance among jointly significant pairs was 99.77%, magnitude sharing was 0.953, and the median posterior-effect amplitude ratio (non-infected over exposed) was 1.15. Between the non-infected and infected states, 998,174 pairs were jointly significant (392,117 and 142,070 state-only), sign concordance was 99.72%, magnitude sharing was 0.952, and the median amplitude ratio was 1.31—baseline effects are systematically the larger, so infection attenuates effect amplitudes rather than reversing or rewiring them. Between the exposed and infected states, 896,981 pairs were jointly significant (401,764 and 243,263 state-only), sign concordance was 99.80%, and magnitude sharing was 0.887. Consistent with this picture, high-confidence specificity on the influenza axis is real but numerically modest: 71,107 pairs (2.2% of the strong set; 12.9% of all high-confidence calls) are high-confidence specific to the influenza axis, and the top-ranked influenza-specific rows map to HLA-V (ENSG00000181126; maximum |posterior effect| 7.54, at chr6:29.8 Mb), inside the MHC region—so even the strongest influenza-axis specificity is concentrated in the locus set aside by the pre-registered MHC exclusion. The within-cohort verdict is thus graded amplitude modulation on an almost completely shared backbone: the influenza disease state reshapes monocyte eQTL effect sizes quantitatively, but rarely qualitatively.
2.5. Disease-Stratified Heritability Partitioning
The central hypothesis of this study is that disease-specific monocyte eQTLs disproportionately carry the GWAS heritability of the corresponding diseases, paralleling—at the disease dimension—what CIGMA demonstrated at the cell-type dimension [3]. We tested this with stratified LD score regression (S-LDSC), constructing six monocyte annotations (all monocyte eQTLs; shared eQTLs; and one specific-eQTL annotation per disease axis; because track 1 contains no AAV eQTL data, the AAV-specific annotation exists only in the track-2-conditional analysis, and in the track-1 grid the AAV GWAS column is evaluated against the mono_all and mono_shared annotations only) and regressing seven GWAS (IBD, SLE, AAV, sepsis, the negative controls height and schizophrenia, and coronary artery disease as a weak positive control) on these annotations jointly with the baseline model (Methods 5.6). Negative-control traits follow the design of the CIGMA study, in which non-immune traits are not expected to enrich on immune-cell regulatory annotations [3]; prior evidence that IBD genetic signal colocalizes preferentially with monocyte eQTLs supports the plausibility of axis-matched enrichment [27,35].
The full-scale heritability partitioning is pre-registered and will be reported upon pipeline completion. Specifically, the deliverables are: (i) the S-LDSC enrichment matrix over the 6 × 7 annotation-by-GWAS grid (reporting format pre-registered in the Supplementary Analysis Plan), reporting SNP proportions, enrichment folds, tau-star z-statistics, and BH-FDR q-values, with axis-matched enrichment and null negative controls as the pre-registered prediction and annotations covering less than 0.1% of HapMap3 SNPs flagged as exploratory; (ii) the single primary endpoint—the jointly modeled tau-star_spec minus tau-star_shared difference with 200-block jackknife standard errors (Methods 5.6)—for which a positive difference at FDR < 5% constitutes the strongest evidence of incremental specific-regulation heritability, and a null result triggers the scenario-B interpretation (Section 4) rather than any change of endpoint; and (iii) the partitioning quality-control battery (LDSC intercepts within 0.9–1.1, at least 50% HapMap3 coverage, null random-annotation calibration with |z| < 2, expected direction of the all-monocyte annotation, and downgrading of the sepsis analysis and the pre-declared-exploratory AAV analysis if heritability z < 4). No heritability-partitioning numbers are reported at the present stage.
2.6. Colocalization and Mendelian Randomization Nominate Disease-Specific Causal Genes
To move from annotation-level enrichment to gene-level mechanisms, we intersected high-confidence disease-axis-specific eQTL genes (top per-gene specificity scores; Section 3.3) with the corresponding disease GWAS loci and subjected each candidate locus ($$500 kb) to multi-signal colocalization (coloc.susie) and summary-data-based Mendelian randomization with the HEIDI test (SMR), using ancestry-matched linkage disequilibrium panels (Methods 5.7). Genes passing both methods—colocalization posterior probability for a shared causal variant PP.H4 >= 0.7 (>= 0.9 high confidence) and SMR significance with HEIDI p > 0.01—are designated high-confidence disease-specific causal genes (reporting format pre-registered in the Supplementary Analysis Plan).
The locus-level nomination is pre-registered and will be reported upon pipeline completion; no colocalization or SMR numbers are reported at the present stage. The pre-registered analysis and its gates are unchanged (Methods 5.7): the colocalization census will report, per axis, the candidate loci (loci with fewer than 50 shared variants excluded), PP.H4 per signal pair, the fraction of loci whose PP.H4 crosses the 0.7 decision line within the p12 scan (10−8–10−4; such loci are flagged suggestive only), concordance with coloc.abf, and third-party replication against IBDverse published colocalization calls [19]; the SMR/HEIDI layer will report p_SMR against a Bonferroni threshold of 0.05/N_genes, HEIDI p-values, and cross-method concordance (pre-registered gate at least 60%, below which a linkage-disequilibrium-mismatch investigation is triggered). Genes passing both methods enter the mechanistic-vignette pool (Section 3.7).
2.7. Mechanistic Vignettes
No mechanistic vignette is claimed at the present stage. Vignettes will be constructed only for loci meeting the pre-registered criteria (cross-cohort same-direction replication plus functional annotation, displayed as LocusZoom-style panels; reporting format pre-registered), and if fewer than two loci qualify the section is dropped per the pre-registered contingency (Go/No-Go 3). Candidate biological systems suggested by prior evidence include interferon-response genes for the SLE axis [6], the PLAC8-associated immunosuppression program shared between sepsis and severe COVID-19 [10,12], and monocyte-to-macrophage education loci (ETS2, NOD2, CSF1, SP140) for the IBD axis [15]; these are prior-literature hypotheses only and will be tested, not assumed.
3. Discussion
This study decomposes monocyte cis-eQTLs across inflammatory conditions into shared and disease-specific components and asks whether the specific components disproportionately explain the heritability of the corresponding diseases. One result is already complete: our simulation-based power analysis shows that naive per-condition significance calling would misclassify 72.6% of truly shared eQTLs as disease-specific given the sample-size structure of public monocyte cohorts, that a proxy for cross-condition information borrowing reduces this rate to 13.0%, and that a high-confidence specificity criterion reduces it to 1 of 20,000 (0.005%; upper 95% bound ≈0.03%)—all three figures calibrating the proxy decision rule rather than mashR itself, with mashR-native lfsr-based rates and a head-to-head simulation comparison pre-registered for the production run (Methods 5.3). A pilot-scale production run on three real-data conditions (healthy OneK1K CD14+, SLE-enriched Perez classical, and influenza-stimulated Randolph monocytes; 1,671,712 tested gene–variant pairs) executed the full pipeline end to end with all quality-control gates passed, yielding a biologically plausible sharing gradient—highest between the two disease-context peripheral-blood single-cell cohorts (0.473) and lowest between influenza-stimulated and healthy baseline (0.087)—a specificity-grade distribution in which high-confidence calls remain a minority (15.3%) under the enforced criterion, and an MHC-dominated top-specificity gene list that motivates the pre-registered MHC exclusion. The full-scale seven-condition decomposition is now complete (Section 3.4) and corroborates the pilot at scale—data-driven covariance structures carry 0.9471 of the fitted mixture weight, high-confidence specificity calls make up 16.87% of strong-set pairs and 16.90% after adjudication-layer MHC exclusion—within the pre-registered 20% ceiling under both configurations and across all 18 cells of the adjudication sensitivity grid—and the top-specificity genes remain MHC- and 17q21.31-centered. The paired Randolph triad supplies the design’s single unconfounded disease-state contrast: influenza exposure and infection leave sign and sharing structure essentially intact (sign concordance above 99.7%; magnitude sharing 0.89–0.95) while attenuating effect amplitudes (median ratio 1.15–1.31). The heritability-partitioning primary endpoint and locus-level gene nomination are pre-registered and in progress; which of the pre-registered scenarios (A: axis-matched enrichment; B: conservation; C: platform-driven) the data support therefore remains open, and no claim on that endpoint is made here.
What these results mean for immunologists is practical. Effects estimated in patient cohorts or after stimulation show low visibility in healthy-donor eQTL references (cross-cohort sharing between OneK1K and the external cohorts 0.14–0.27 at full scale); however, the direction of this difference is consistent with several influences that the present design cannot separate—disease context, cohort, ancestry, sex, and platform—so it cannot be attributed to disease biology alone. Indeed, sharing between the two healthy-baseline studies (0.189–0.202) sits at the low end of the matrix, below several health–disease cross-study pairs, and the pre-registered discriminating diagnostics (PCA and hierarchical clustering of the posterior mean and sharing matrices) group conditions by study of origin, consistent with scenario C; as pre-registered, the cross-cohort disease-fingerprint claim is therefore withdrawn to within-study paired contrasts. The concentration of top-specificity genes in the MHC region confirms both the biological reality of the signal and the need to set the MHC aside before downstream enrichment, as pre-registered. With two disease axes now represented, high-confidence specific calls split 87.1% SLE-axis versus 12.9% influenza-axis; because the SLE axis is cohort-enriched and the influenza contrast is the only state-paired one, this split describes the included designs rather than measuring the relative amount of disease specificity across diseases. Two sensitivity results delimit the robustness boundary of the surviving specificity claims: the high-confidence fraction stands at 16.90% after adjudication-layer MHC exclusion—within the pre-registered ceiling—and all 18 cells of the adjudication grid (range 11.4%–19.3%) remain within it, so the pre-registered 80% robustness rule is met for this quantity in the seven-condition configuration; together these two results fix how far the specificity claims can be pushed by threshold choices. The re-calibration triage answers the z-scale critique quantitatively: within-study contrasts show essentially no distortion (measured sharing shifts of at most +0.0012 across all five within-study pairs), whereas cross-power high-confidence counts are sensitive (16.87% falling to 9.15%)—a pattern self-consistent with the contraction of cross-cohort claims to within-study paired contrasts.
Three bodies of prior work bound our contribution. First, CIGMA established that cell-type-specific eQTLs carry disproportionate autoimmune heritability in healthy-donor PBMCs (OneK1K), with replication in CLUES/ImmVar [2,3]; we extend the same variance-decomposition logic from the cell-type dimension to the disease dimension, at the summary-statistics level, using public data only—directly addressing two limitations identified by its authors (and the published peer-review file): the absence of case–control context and of colocalization [3]. Our path-B decomposition is an adaptation rather than a direct application, and we validate it against the individual-level model on paired designs rather than claiming equivalence. Second, ImmuNexUT demonstrated disease-context-dependent eQTLs across ten immune-mediated diseases but releases summary statistics per cell type rather than stratified by disease, and its genotypes cannot be obtained by third parties, so per-disease decomposition is not possible from that resource; for these reasons ImmuNexUT is not included in the harmonized resource [23,24]. We likewise did not include BLUEPRINT, which provides a second European sequencing-based healthy baseline rather than a disease axis, and reserve it for follow-up validation. Our axis-aggregated mashR design provides the per-disease view within the constraints of accessible data. Third, IBDverse showed that myeloid populations carry the largest share of expression variance explained at IBD loci within a single disease [19]; we test whether this pattern generalizes across diseases and whether it is driven by specific rather than shared regulation. Our work also operationalizes and quantifies the warning implicit in Peters et al.—who themselves used genotype-by-disease interaction models for disease-stratified calls and reserved the list-comparison critique for the cell-type dimension [25]—converting it into a quantified error rate with an enforced correction. Concurrent work from the CIGMA team (FastGxC) has quantified, along the context dimension of GTEx tissues and PBMC cell types, that 43–48% of apparently context-specific eQTLs are in fact shared and that specificity counts scale with sample size [29]. The two studies are complementary rather than redundant: FastGxC enumerates shared versus specific eQTLs across contexts, whereas the present study moves to the disease dimension, calibrates the misclassification rate itself against the realized sample-size structure of public disease cohorts, and converts it into decision rules—mandatory cross-condition borrowing, a high-confidence specificity criterion, and borrowing-only use of small disease strata—that are enforced throughout the analysis.
Because the primary endpoint can legitimately return a null, we pre-commit the interpretation of each scenario rather than letting the data choose the narrative. If the primary contrast is null (scenario B: cross-disease conservation of monocyte cis-regulation), the result is not an absence of findings but independent corroboration of the anchor evidence from the orthogonal dimension: CIGMA localized disease-relevant specificity to the cell-type dimension [3], and a cross-disease-shared, cross-cell-type-specific two-dimensional structure would place the specificity exactly where CIGMA found it—between cell types, not between diseases. Scenario B would also carry a concrete, actionable implication for resource allocation: healthy-donor monocyte eQTL maps (for example OneK1K) would be sufficient to support monocyte-mediated target discovery across inflammatory diseases, arguing that further investment should go toward cell-type and tissue resolution (including tissue-resident macrophages) and toward the trans dimension, rather than toward additional disease-cohort monocyte eQTL collection; the residual loci of disease specificity would then be sought in trans regulation, in non-myeloid lineages, or in cell-state composition rather than in cis-eQTL effect sizes. Conversely, under scenario A the translational meaning of a state-dependent eQTL is equally concrete: a target whose regulatory variant is active only in the disease context implies a state-dependent intervention window in which perturbing the gene in healthy tissue may have limited effect—a prioritization signal unavailable from conventional healthy-donor eQTL resources. If scenario C (platform- or study-driven clustering) materializes, the pre-specified restriction applies (Section 3.3): specificity claims contract to within-study paired contrasts, the cross-cohort specificity map is withdrawn, and the paper’s deliverables reduce to the power calibration, the harmonized resource, and the paired-design sharing analyses, which do not depend on cross-platform comparability.
Positioning against the six source studies that provide our primary data makes this increment concrete. Each operates within a single cohort, a single disease, or the cell-type dimension: OneK1K colocalized healthy-donor eQTLs with autoimmune GWAS [1]; Perez et al. decomposed shared and specific eQTLs across cell types within one SLE-enriched cohort [30]; Randolph et al. applied mash across conditions within one paired cohort [32]; CEDAR profiled healthy baselines only [18]; IBDverse addressed a single disease [19]; and Peters et al. modeled genotype-by-disease interactions for two diseases within one microarray-era study [25]. To our knowledge, the present study is the first to combine uniform reprocessing across independent public disease cohorts, a disease-dimension shared/specific decomposition, and explicit power calibration of the resulting decision rules.
Several limitations qualify the interpretation; we group them into data-level, method-level, and interpretation-level issues.
Data-level limitations. (1) Our monocytes are peripheral-blood cells, and we do not claim extrapolation to tissue macrophages; all conclusions are restricted to the monocyte/myeloid lineage as assayed. (2) The resource is platform-heterogeneous: the CEDAR baseline is microarray-based [18], and although we standardize effect sizes before cross-condition modeling and verify calibration against sequencing-based healthy references, residual platform effects cannot be excluded and will be assessed by the study-versus-axis clustering diagnostic (Section 3.3). A specific risk arises from missing-data encoding: microarray probe coverage is gene-dependent, and because untested genes in CEDAR are encoded as beta = 0 / se = 100 (Methods 5.2), a gene structurally absent from the microarray can artifactually satisfy the “near-zero in remaining conditions” arm of the high-confidence specificity criterion; all high-confidence specificity calls therefore require observed (not missing-encoded) estimates in every competing axis, and a tested-mask exclusion sensitivity analysis restricted to genes assayed in all conditions is pre-registered (the tested mask is already implemented in the pipeline). (3) Ancestry is heterogeneous across cohorts (the Perez and Randolph cohorts are multi-ancestry), which can masquerade as specificity; we mitigate this with ancestry-matched linkage-disequilibrium panels and European-only sensitivity analyses, but admixture-aware modeling remains future work; in addition, the summary statistics carry no variant-level ancestry annotation, so the European-only sensitivity analysis is downgraded to a textual qualification—because all retained claims are within-cohort paired contrasts, in which ancestry composition is constant within the contrast, ancestry confounding poses a limited threat to these conclusions. (4) Sex composition is mismatched across axes and is not modeled: the Randolph cohort—the sole source of primary (paired) disease-axis evidence—comprises exclusively male donors [32], whereas SLE, the headline disease axis, has the most extreme female predominance among autoimmune diseases (female-to-male ratio approximately 9:1), and its candidate mechanistic system, type-I interferon signaling, is itself sexually dimorphic; cross-axis sharing estimates involving the influenza and SLE axes may therefore be systematically affected, and influenza-axis conclusions apply strictly to the genetic regulation of male immune responses. (5) All cohorts are adult, and the age dimension is unmodeled: pediatric-onset subtypes of IBD and SLE, which tend to be more severe and carry higher genetic burden, fall outside the resource, so extrapolation of the resulting maps to childhood-onset disease—directly relevant to our institution’s patient population—must await dedicated pediatric eQTL data. (6) Medication exposure (notably glucocorticoids) is a known confounder of monocyte-state expansion [17,36] and is only partially captured by cohort-level covariates in summary statistics. (7) AAV GWAS power is marginal (thousand-scale cases), and its heritability-partitioning results are pre-declared as exploratory owing to limited case numbers; the sepsis GWAS (the FinnGen R12 sepsis endpoint AB1_OTHER_SEPSIS, 17,133 cases) is adequately powered by case count, but the low SNP heritability typical of sepsis may still limit partitioning and is monitored by the pre-registered heritability z < 4 gate. (8) Cell-state composition is a potential confound of the cross-cohort contrasts: the Perez cohort carries an expanded interferon-high (ISG-high) monocyte compartment in SLE [30], and such compositional shifts can masquerade as regulatory differences, because pseudobulk eQTL estimates cannot distinguish a per-cell effect-size change from a change in cell-state proportions. (9) The source studies estimated eQTLs under heterogeneous covariate models—different numbers of expression principal components or PEER factors and cohort-specific covariate sets—so part of the cross-cohort effect-size heterogeneity may reflect modeling choices rather than biology, and re-calling eQTLs under a unified covariate model is not possible from summary statistics alone.
Method-level limitations. (10) Our power analysis uses an inverse-variance-weighted meta-z proxy for mashR borrowing whose bias direction relative to mashR posteriors is unknown (under truly shared effects fixed-effect meta-z is itself efficient) and assumes a uniform MAF distribution; both will be replaced by realized quantities and by the pre-registered mashR-on-simulation comparison in the production run, so the simulation numbers calibrate the proxy rule, not mashR performance. (11) The N(beta_hat, se^2) resampling propagates estimation uncertainty without removing selection bias; by convexity of power in |beta|, averaging power over draws centered on upward-biased betas renders the absolute power estimates in Table 2 systematically optimistic, without affecting the qualitative conclusion of an order-of-magnitude power disparity across cohorts. (12) The z-score parameterization distorts effect magnitudes when sample sizes differ across conditions, because z scales with : cross-condition magnitude comparisons on this scale mix effect-size differences with precision differences. The re-calibration triage (Section 3.4; Supplementary Note 5) bounds the practical impact—within-study contrasts are unaffected (sharing shifts of at most +0.0012 across the five within-study pairs, and exactly zero where both conditions have n = 193, so the rescaling cancels), whereas cross-power high-confidence counts are sensitive (16.87% to 9.15% under re-calibration)—so the magnitude claims retained in this paper are within-study paired contrasts, and cross-cohort count-based statements should be read as scale-dependent.
Interpretation-level limitation. (13) The SLE axis is cohort-enriched rather than state-specific: the Perez et al. eQTLs were estimated on combined cases and controls [30], so any “SLE-specific” statement is provisional until the CLUES individual-level track-2 analysis is completed; the same logic defers AAV stratified evidence to controlled-access Peters et al. data [25].
In summary, by quantifying and neutralizing the false-specificity problem, porting variance decomposition to the disease dimension, and pairing axis-specific heritability partitioning with dual-method gene nomination and negative controls, this study provides a rigorous template—and, pending pipeline completion, a systematic map—for understanding how much of inflammatory-disease genetic susceptibility is mediated by disease-context-dependent monocyte gene regulation.
4. Methods
4.1. Data Resources and Two-Track Acquisition Strategy
All primary inputs are public. Track 1 (default; no data-access application; sufficient for all main analyses) comprises monocyte eQTL summary statistics from the eQTL Catalogue [4]: OneK1K CD14+ (QTD000609, n = 959) and CD16+ (QTD000610, n = 930) monocytes under QTS000038 [1]; Perez et al. classical (QTD000603) and non-classical (QTD000604) monocytes under QTS000037 (n = 193; combined SLE-plus-control cohort) [30]; Randolph et al. non-infected (QTD000595), influenza-exposed (QTD000596), and infected (QTD000594) monocytes under QTS000036 (n = 88–89; European- and African-ancestry male donors) [32]; and CEDAR healthy CD14+ monocytes (QTS000007, QTD000069, n = 286, microarray) [18]. The Perez (CLUES) cohort contains both Asian and European ancestry strata (analyzed per stratum in the source study), motivating the contribution-weighted linkage-disequilibrium panel and European-only sensitivity analyses used downstream [30]. Full summary statistics (.all.tsv.gz) and SuSiE fine-mapping products were obtained from the eQTL Catalogue release 7 FTP hierarchy (all analyses are pinned to release 7 for comparability with the published QTD accessions; the release 8 pre-release re-annotations are evaluated only in sensitivity analyses) using the dataset-level paths in the project’s tabix metadata table rather than constructed URLs; integrity was verified by gzip and tabix tests, file-size plausibility checks, and local MD5 archiving. IBDverse blood myeloid eQTL and colocalization summary statistics were obtained from BioStudies S-BSST2922 / ArrayExpress E-MTAB-16986 [20]. The n = 421 reported for IBDverse (Table 1) is the cross-tissue eQTL donor total; the effective n of the blood myeloid subset used here is to be confirmed against the released metadata after download. Track 2 (enhancement; submitted in week 1; blocking nothing) comprises Peters et al. disease-stratified data—expression E-MTAB-3554 (public) and genotypes EGA EGAS00001001251 (controlled access, DAC EGAC00001000338)—and CLUES individual-level SLE data (dbGaP phs002812, controlled access) [25,30]. Pending track-2 approval, the Peters et al. published significant-eQTL summary statistics (S1 Data) are used for candidate-level (non-genome-wide) corroboration only [25].
GWAS summary statistics: IBD (de Lange 2017 via IEU OpenGWAS ebi-a-GCST004131), SLE (Bentham 2015 via IEU OpenGWAS ebi-a-GCST003156), AAV (Lyons et al. 2012, GWAS Catalog study GCST001613), sepsis/infection (the FinnGen R12 sepsis endpoint AB1_OTHER_SEPSIS (17,133 cases), “Other sepsis”; public bucket), the negative controls height and schizophrenia (PGC3), and coronary artery disease as a weak positive control, following the negative-control design of the CIGMA study [3]. The AAV study GCST001613 is registered in the GWAS Catalog without full summary statistics (fullPvalueSet = false); the genome-wide summary statistics required for S-LDSC will therefore be obtained by direct author request to the European Vasculitis Genetics Consortium (Lyons et al., N Engl J Med 2012;367:214-223, doi:10.1056/nejmoa1108735); ImmunoBase, the former distribution channel, no longer serves data (verified 2026-08-30), and FinnGen R12 endpoints M13_WEGENER / M13_MICROPOLYANG (hundreds of cases each) are retained only as low-power supplements [37].
4.2. Unified Processing and Harmonization
All eQTL summary statistics were converted to a common long-table schema (dataset, variant identifier, chromosome, position, ref, alt, Ensembl gene, beta, standard error, p-value, MAF, condition label). eQTL Catalogue data are GRCh38-based; GRCh37 sources (CEDAR microarray definitions where applicable, selected GWAS) were lifted with CrossMap, with a failure-rate gate below 1%. All effect sizes were re-oriented to the GRCh38 alternate allele; palindromic variants (A/T, C/G) with MAF in [0.4, 0.6] were removed as orientation-ambiguous (expected removal below 8%). Orientation QC required at least 95% beta-sign concordance across 1,000 strong eQTLs shared between OneK1K and CEDAR. The cis window was fixed at $$1 Mb around each transcription start site for all downstream uses (strong-set construction, annotations, colocalization candidates), recorded as cis_window = 1e6 in the pipeline configuration.
For track-2 Peters et al. data (the study’s only de novo eQTL computation), the following pre-registered safeguards apply: genotype-to-expression ID matching followed by PLINK sex checks; self-imputation against 1000 Genomes/HRC panels with INFO >= 0.8 retention (0.7 as sensitivity), because the public release contains only approximately 627k SNP genotypes and no imputation files; the two genotyping arrays (Illumina OmniExpress-12 for IBD/healthy; Affymetrix SNP 6.0 for AAV) are QC’d and imputed separately and never merged before QC; microarray probesets are remapped to genes with cross-hybridizing probes removed; PEER factor counts are scaled to stratum size (approximately 15 for n < 150, per GTEx practice); and, in addition to per-stratum mapping, a combined-sample expression ~ genotype × disease + covariates interaction model is run, with interaction-significant eQTLs intersected with mashR calls as the highest-confidence disease-specific evidence—because Peters et al. showed that comparing per-stratum significant lists overestimates specificity [25].
mashR input matrices used a strong set (top variant per gene among variant–gene pairs with p < 1 × 10⁻⁵ in at least one dataset; target 50,000–200,000 rows) and a random set of 200,000 variant–gene pairs for null-correlation estimation. Because effect-size units differ across platforms (sequencing-based normalized expression versus microarray probe intensities), beta and standard error were divided by the per-condition expression standard deviation before modeling, with a z-score parameterization (Bhat’ = beta/se, Shat’ = 1) as an alternative run; agreement between the two standardizations is reported as a sensitivity analysis. Missing condition entries are encoded as beta = 0, se = 100 following mashR convention. This encoding interacts with the specificity criterion: for the microarray-based CEDAR dataset, gene-dependent probe coverage means that a gene untested in CEDAR would contribute an enforced near-zero effect, potentially satisfying the “near-zero elsewhere” requirement of a high-confidence specificity call for structural rather than biological reasons. The pipeline therefore carries a per-gene, per-condition tested mask recording which variant–gene pairs were actually assayed; high-confidence axis-specific calls require an observed estimate (not a missing-encoded entry) in every competing axis, and a sensitivity analysis excluding all genes untested in any condition (complete tested-mask restriction) is pre-registered, with high-confidence calls at CEDAR-untested genes reported separately. Matrix-level QC gates: missing rate below 40%, and per-condition median standard errors monotone in .
4.3. Power Analysis (Completed)
The power analysis (Results 3.2; Figure 1a–c) was executed in Python (NumPy/SciPy) with N_sim = 20,000 and seed 42. The empirical effect-size distribution was taken from 992 permutation-significant OneK1K CD14+ lead eQTLs (QTD000609, n = 959) [4,33]; because using observed lead betas directly would overstate effects through winner’s curse, we resampled 200 candidate true effects from N(beta_hat, se_hat^2), with se_hat back-computed from nominal p-values; this step propagates estimation uncertainty without removing selection bias—the resampled effects remain centered on the selection-biased observed betas, so the absolute power values are systematically optimistic and are cited only qualitatively (order-of-magnitude contrasts across cohorts), never as point estimates of attainable power. Minor allele frequencies were drawn from U(0.05, 0.5), a sensitivity assumption shown to perturb power estimates by at most 5%; production runs will use realized MAFs from the full summary-statistics files. Detection power under standardized expression was computed analytically with non-centrality parameter n × 2 × MAF(1 − MAF) × β2 at α = 5 × 10⁻⁸ and α = 1 × 10⁻⁵, the latter approximating per-gene permutation thresholds (true thresholds vary per condition and are a stated approximation). For the mashR-layer simulation, 20,000 truly shared effects were generated across five conditions with n in {959, 286, 193, 89, 41}, sampling noise was added at the condition-specific standard error, and an inverse-variance-weighted meta-z statistic served as a proxy for mashR posterior borrowing. This simulation therefore calibrates the proxy decision rule (meta-z plus magnitude thresholds), not the mashR posterior decision procedure used in production; the direction of the proxy’s bias relative to mashR is not assumed, and the production analysis will report mashR-native lfsr-based false-specificity rates as the operative figures, with a rerun of mashR itself on the identical 20,000 simulated effects pre-registered as a sensitivity analysis tabulating proxy versus posterior decision rates. The false-specificity rate was measured as the fraction of truly shared effects called condition-specific under each of the three decision rules reported in Results 3.2 (under the naive rule, significant in at least one but not all five conditions). Because the simulation did not execute mashR itself, rule 3’s requirement of “posterior effects near zero in the remaining conditions” was approximated by observed-effect-magnitude criteria: an effect was called condition-specific only if it passed significance and the two-fold magnitude-difference threshold in the putative specific condition while satisfying |beta| < 0.1 in all remaining conditions (substantively non-zero effects excluded), serving as the proxy for a near-zero posterior. Under this rule exactly 1 of 20,000 truly shared effects was misclassified (0.005%; binomial upper 95% bound ≈0.03%). S-LDSC power was assessed qualitatively from published experience: for GWAS with N > 100,000, annotations covering more than 2% of SNPs, and true enrichment above two-fold, tau-star z > 3 is typically attainable; the AAV GWAS (thousand-scale cases) is pre-declared as exploratory owing to limited case numbers by this study’s design; the sepsis GWAS (the FinnGen R12 sepsis endpoint AB1_OTHER_SEPSIS, 17,133 cases) is adequately powered by case count and is not downgraded a priori, with its typically low SNP heritability monitored by the partitioning quality-control battery.
4.4. Cross-Condition Effect Sharing With mashR
Sharing analysis used mashR (stephenslab/mashr, current GitHub version; R 4.3) with ashr for shrinkage [31]. The null-correlation matrix V was estimated from the random set (estimate_null_correlation_simple) and supplied to all mash data objects. Condition-wise significant rows were identified by mash_1by1 (lfsr < 0.05). Covariance matrices combined canonical structures (cov_canonical) with data-driven matrices learned by cov_pca (up to five components) refined by cov_ed; the fitted mixture from the significant subset was applied to the full strong set with fixg = TRUE. Posterior means, local false sign rates, and posterior standard deviations were extracted with get_pm, get_lfsr, and get_psd. Pairwise sharing used get_pairwise_sharing with factor 0.5, which internally requires same-sign effects with magnitude above half the row maximum. Specificity was adjudicated at the disease-axis level: conditions were grouped into axes (healthy: OneK1K CD14/CD16, CEDAR, non-infected monocytes; influenza: exposed and infected monocytes; SLE: Perez classical and non-classical, cohort-enriched; IBD: IBDverse blood myeloid in track 1, plus the Peters IBD stratum under track 2; AAV: Peters AAV stratum, track 2 only—no AAV axis exists in the track-1 main analysis, and AAV-specific classifications are reported only as a track-2-conditional analysis), and disease specificity required significance in exactly one disease axis with non-significance in the healthy axis and all other disease axes. The main text reports only high-confidence calls (lfsr < 0.05 in the putative axis, at least two-fold effect difference, posterior effects near zero elsewhere, persistence after mashR shrinkage); nominal condition-enriched sets are supplementary. The primary analysis excludes the MHC region (chr6:25–34 Mb), whose extended linkage disequilibrium and outlier effects can distort sharing estimates; sensitivity analyses re-ran all classifications with the MHC region included, across a grid of lfsr thresholds (0.01, 0.05, 0.1) and sharing-magnitude factors (0.3, 0.5, 0.7), plus European-ancestry-only variants. The pre-specified scenario-C clause—study- or platform-driven clustering in the PCA or hierarchical clustering of the posterior mean matrix triggering restriction of specificity claims to within-study paired contrasts and withdrawal of the cross-cohort specificity map—was triggered in the full-scale run and has been executed (Section 3.4).
4.5. Disease-Dimension Variance Decomposition
The primary decomposition (path B) operates on mashR posterior means pm[i, ] across R conditions for each eQTL–gene row, using the second-moment identities: total = mean(pm^2), specific = var(pm), shared = total - specific = mean(pm)^2, with specificity index T_i = specific / total in [0, 1] and axis attribution d* = argmax over axes of the deviation from the cross-condition mean. Because sampling error inflates the squared posterior mean, we apply the bias correction shared_corr = mean(pm)^2 - mean(psd^2)/R (valid under approximate cross-condition independence), truncate corrected T to [0, 1], and report the truncated fraction (gate: below 2%). Per-gene, per-disease specificity scores G_spec aggregate each gene’s significant eQTLs weighted by (1 - lfsr), with per-eQTL weights capped (winsorized) so that no single eQTL dominates a gene’s score. Path A applies the individual-level CIGMA model (cigma 1.1.0, PyPI-pinned; Haseman–Elston regression) to the two designs that satisfy its same-individuals assumption—the paired non-infected/influenza Randolph contrast and the OneK1K CD14/CD16 subtype contrast—as a methodological positive control, with per-gene correlation between path-A and path-B specificity expected to exceed 0.6 [3]. CIGMA is not applied across independent disease cohorts, which violate its same-individuals assumption. A permutation test shuffling condition labels calibrates the right tail of the observed T distribution (empirical FDR < 5%).
4.6. Stratified LD Score Regression
Partitioned heritability analyses used LDSC (bulik/ldsc; pinned conda environment) with official 1000 Genomes Phase 3 reference files, which are GRCh37/hg19-based; accordingly, all eQTL-derived annotations and GRCh38 GWAS were lifted to hg19 with CrossMap before annotation construction (failure-rate gate below 1%), the primary workflow choice, with community GRCh38 LDSCORE builds only as sensitivity. GWAS summary statistics were munged against the HapMap3 SNP list with per-GWAS column mappings registered in the configuration; case–control GWASs used effective sample sizes (4/(1/N_case + 1/N_control)) or separate case/control counts. Six annotations were constructed: all monocyte eQTLs (mono_all), shared eQTLs (mono_shared), and one specific-eQTL annotation per disease axis. Annotated variants were defined primarily by SuSiE credible sets (eQTL Catalogue products where available), falling back to lead variant $$10 kb windows (10–50 kb as sensitivity; larger windows dilute enrichment and inflate SNP proportions). Each annotation reports its SNP proportion; annotations below 0.1% of HapMap3 are exploratory. Per-chromosome LD scores were computed with make_annot.py and ldsc.py –l2 –thin-annot, and cell-type-specific regressions used ldsc.py –h2-cts with the baseline model, regression weights excluding the HLA region, and absolute paths in the .ldcts file. The primary specific-versus-shared contrast was estimated in a single joint model with mutually exclusive annotations (specific set with shared-overlapping SNPs removed) via ldsc.py –h2 –print-coefficients, and the standard error of the tau-star difference was estimated by a manual block jackknife over 200 genomic blocks, because coefficients from independent .ldcts runs cannot be combined without their covariance; a difference-set annotation (specific minus shared) under –h2-cts served as the simplified alternative. Multiple testing across the 6 × 7 annotation-by-GWAS grid was controlled at BH-FDR 5%. The study designates a single primary endpoint: the joint-model test of the axis-matched heritability-partitioning contrast—that is, the difference tau*_specific − tau*_shared > 0, estimated in the joint model above with 200-block jackknife standard errors and evaluated at BH-FDR 5% across disease axes. All other outputs (the shared-versus-specific eQTL landscape, the specificity-index decomposition, per-axis counts, and causal-gene nominations) are secondary endpoints, and the pre-registered scenarios A (axis-matched enrichment), B (cross-disease conservation), and C (platform-driven clustering) constitute an interpretation framework applied to the primary-endpoint result, not alternative primary findings. QC gates: per-GWAS intercepts within 0.9–1.1; baseline-plus-annotation coverage of at least 50% of HapMap3; MAF/LD-matched random annotations with |z| < 2; direction concordance of mono_all with known monocyte-trait associations; AAV and sepsis downgraded to exploratory if the GWAS heritability z-score is below 4. The sepsis GWAS uses the FinnGen R12 sepsis endpoint AB1_OTHER_SEPSIS (17,133 cases) and is retained as a full analysis by case count; because sepsis SNP heritability is typically low, its partitioning is nonetheless monitored by the heritability z-score gate (downgraded to exploratory if z < 4). In addition, because the FinnGen sepsis GWAS is Finnish whereas the reference LD scores derive from 1000 Genomes Europeans, a residual population-LD mismatch remains; sepsis partitioning results are interpreted with additional caution. MHC-region variants (chr6:25–34 Mb, evaluated in hg19 coordinates after liftover) were excluded from all annotations in the primary analysis and retained in an MHC-included sensitivity analysis.
4.7. Colocalization and Summary-Data-Based Mendelian Randomization
Candidate loci (high-confidence axis-specific eGenes intersecting matching disease GWAS loci; $$500 kb) were analyzed with coloc (CRAN 5.2.3, or 6.0.1 from GitHub/r-universe; one version pinned per manifest, never mixed) and susieR. Per locus, runsusie fine-mapped each trait and coloc.susie colocalized signal pairs with p12 = 5 × 10⁻⁶; single-signal loci fell back to coloc.abf (p1 = p2 = 1 × 10⁻⁴, p12 = 5 × 10⁻⁶). For quantitative-trait datasets without a supplied sdY, check_dataset requires MAF and N, which the eQTL Catalogue MAF column provides. Because conclusions are sensitive to the p12 prior, sensitivity() scanned p12 over [1 × 10−8,1 × 10−4], and loci whose PP.H4 crossed the 0.7 decision line within the scan were reported as suggestive only. Linkage-disequilibrium matrices were ancestry-matched: 1000 Genomes European Phase 3 for European analyses (the same panel as S-LDSC), and full-1000 Genomes or contribution-weighted panels for the multi-ancestry Perez and Randolph loci, with ancestry-mismatch sensitivity analyses reported, since LD mismatch with European GWAS systematically deflates PP.H4. LD windows were capped at 3,000 SNPs with near-positive-definite correction; loci with less than 80% overlap between LD panel and summary statistics were skipped and logged. SMR 1.3.1 (command-line) with HEIDI (–heidi-mtd 1) and –diff-freq-prop 0.2 was run per GWAS against binary eQTL summary files; because SMR requires an LD reference panel supplied via –bfile, we used the same ancestry-matched 1000 Genomes panels as in the colocalization analyses; genes with p_SMR below 0.05/N_genes and p_HEIDI above 0.01 passed. Genes passing both colocalization (PP.H4 >= 0.7; >= 0.9 high confidence) and SMR/HEIDI entered the vignette pool; IBDverse published colocalization calls were used as third-party replication, with unions and intersections reported separately [19].
4.8. Reproducibility, Code, and Reporting Standards
The full workflow is implemented as a Snakemake pipeline in the cdm-eqtl-pipeline repository (phase-structured rules; centralized config.yaml for all thresholds; fixed random seeds for mashR subset sampling, permutation tests, and SuSiE initialization). Each rule logs software versions, input-file MD5 checksums, and wall time; R sessionInfo() and Python pip freeze outputs are archived. Environments: Python 3.11, R 4.3, mashR and ashr (GitHub), coloc 5.2.3/6.0.1, susieR, cigma 1.1.0, LDSC (pinned environment), SMR 1.3.1, PLINK2, GCTA, CrossMap, bcftools. All QC gates and sensitivity analyses (Section 3 and the pre-registered nine-item list, including external replication of the healthy and influenza axes against Fairfax_2014 and Quach_2016 monocyte datasets, and candidate-level corroboration with Peters et al. S1 Data before track-2 approval) are pre-registered in the analysis plan (v1.1) [38], publicly timestamped on OSF Registries (https://osf.io/5gzdn; DOI: 10.17605/OSF.IO/5GZDN, registered 9 September 2026 UTC). Core conclusions must hold in at least 80% of sensitivity settings or are downgraded in the main text.
Code availability
The complete analysis pipeline is maintained as the cdm-eqtl-pipeline repository (Snakemake workflow with phase-structured rules, fixed seeds, and archived environments; the pilot production run reported here corresponds to branch production-run-1, including the run manifest and archived outputs). A public repository URL and a versioned Zenodo archive with DOI will be provided at publication; reviewer access is available on request.
Presentation
This work has not been presented at any scientific meeting.
Ethics
This study is a secondary analysis of publicly available or controlled-access summary-level and de-identified individual-level data; no new human subjects data were collected. Controlled-access data will be used only under the terms of the corresponding data access committees (EGA EGAC00001000338; dbGaP phs002812).
Author Contributions
Chen Shen: Conceptualization, Methodology, Formal analysis, Investigation, Writing – original draft. Deze Li: Formal analysis, Data curation, Writing – review & editing. Hao Chen: Formal analysis, Data curation, Writing – review & editing. All authors read and approved the final manuscript.
Data Availability Statement
All track-1 data are openly available. Monocyte eQTL summary statistics: OneK1K (eQTL Catalogue study QTS000038; datasets QTD000609 and QTD000610); Perez et al. 2022 (QTS000037; QTD000603, QTD000604); Randolph et al. 2021 (QTS000036; QTD000594, QTD000595, QTD000596); CEDAR (QTS000007; QTD000069); all via the eQTL Catalogue FTP portal (https://www.ebi.ac.uk/eqtl/) 4. IBDverse summary statistics: BioStudies S-BSST2922 and ArrayExpress E-MTAB-16986 20. CEDAR individual-level expression and genotypes (healthy donors only): ArrayExpress E-MTAB-6667 and E-MTAB-6666 18. Peters et al. 2016 expression data: ArrayExpress E-MTAB-3554 (public); corresponding disease-stratified genotypes: EGA EGAS00001001251 under controlled access (DAC EGAC00001000338) 25. CLUES individual-level SLE data: dbGaP phs002812 under controlled access 30. GWAS summary statistics: IEU OpenGWAS (ebi-a-GCST004131, ebi-a-GCST003156), GWAS Catalog GCST001613 (AAV), the FinnGen R12 sepsis endpoint AB1_OTHER_SEPSIS (17,133 cases), and other accessions as listed in Methods 5.1. Controlled-access datasets are identified as such; no controlled data were used in the completed analyses reported here.
Acknowledgments
Not applicable.
Conflicts of Interest
The authors declare no conflicts of interest. AI tools were used for data-analysis assistance and manuscript-preparation support; all analyses recomputable from the released dataset were independently re-run by the authors, and all content was verified against source data by the authors.
References
- Yazar, S.; Alquicira-Hernandez, J.; Wing, K.; Senabouth, A.; Gordon, M.G.; Andersen, S.; et al. Single-cell eQTL mapping identifies cell type–specific genetic control of autoimmune disease. Science 2022, 376(6589), eabf3041. [Google Scholar] [CrossRef]
- Chen, M.; Wang, X.; Krockenberger, L.; Tyebally, R.; Berg, J.J.; Pott, S.; et al. Cell-type-specific eQTLs underlie the genetic architecture of complex traits; (ahead of print); Nature, 2026. Epub 2026 Aug 26. [Google Scholar]
- Chen, M.; Wang, X.; Krockenberger, L.; et al. Supplementary Information and Peer Review File for: Cell-type-specific eQTLs underlie the genetic architecture of complex traits. Nature 2026. [Google Scholar]
- Kerimov, N.; Hayhurst, J.D.; Peikova, K.; Manning, J.R.; Walter, P.; Kolberg, L.; et al. A compendium of uniformly processed human gene expression and splicing quantitative trait loci. Nat. Genet. 2021, 53(9), 1290–1299. [Google Scholar] [CrossRef]
- Perez, R.K.; Gordon, M.G.; Subramaniam, M.; et al. CLUES single-cell RNA-seq dataset (lupus). accession GSE174188; Gene Expression Omnibus.
- Zhang, J.; Zhuang, W.; Li, Y.; Deng, C.; Xuan, J.; Sun, Y.; et al. Bioinformatic analysis and experimental verification reveal expansion of monocyte subsets with an interferon signature in systemic lupus erythematosus. Arthritis Res. Ther. 2025, 27(1), 96. [Google Scholar] [CrossRef]
- Robinson, L.A.; Pascual, V. Recent insights into the role of innate immunity in lupus. Hum. Mol. Genet. 2025, 34(R1), R35–R44. [Google Scholar] [CrossRef]
- Zhu, H.; Hu, F.; Sun, X.; Zhang, X.; Zhu, L.; Liu, X.; et al. CD16+ monocyte subset was enriched and functionally exacerbated in driving T-cell activation and B-cell response in systemic lupus erythematosus. Front Immunol. 2016, 7, 512. [Google Scholar] [CrossRef]
- McGarry, T.; Hanlon, M.M.; Marzaioli, V.; Cunningham, C.C.; Krishna, V.; Murray, K.; et al. Rheumatoid arthritis CD14+ monocytes display metabolic and inflammatory dysfunction, a phenotype that precedes clinical manifestation. Clin. Transl. Immunol. 2021, 10(1), e1237. [Google Scholar] [CrossRef]
- Monneret, G. Advancing our understanding of monocyte HLA-DR, S100A9, and the potential for individualized therapies in sepsis. Mil. Med. Res. 2023, 10(1), 28. [Google Scholar] [CrossRef]
- Huang, S.; Huang, S.; Huang, X.; Feng, X.; Wang, R.; Liu, D.; et al. Bench-to-bedside insights into the challenges of immunosuppression in sepsis. Pathogens 2026, 15(2), 159. [Google Scholar] [CrossRef]
- Schulte-Schrepping, J.; Reusch, N.; Paclik, D.; Baßler, K.; Schlickeiser, S.; Zhang, B.; et al. Severe COVID-19 is marked by a dysregulated myeloid cell compartment. Cell 2020, 182(6), 1419–1440.e23. [Google Scholar] [CrossRef]
- Liu, N.; Jiang, C.; Cai, P.; Shen, Z.; Sun, W.; Xu, H.; et al. Single-cell analysis of COVID-19, sepsis, and HIV infection reveals hyperinflammatory and immunosuppressive signatures in monocytes. Cell Rep. 2021, 37(1), 109793. [Google Scholar] [CrossRef]
- Garrido-Trigo, A.; Corraliza, A.M.; Veny, M.; Dotti, I.; Melón-Ardanaz, E.; Rill, A.; et al. Macrophage and neutrophil heterogeneity at single-cell spatial resolution in human inflammatory bowel disease. Nat. Commun. 2023, 14(1), 4506. [Google Scholar] [CrossRef]
- Yang, Y.; Zhu, H. Macrophage dysregulation in inflammatory bowel disease: cellular heterogeneity, pathogenic mechanism, and treatment. Front Immunol. 2026, 17, 1837255. [Google Scholar] [CrossRef]
- Tang, Y.; Cao, Q.; Liu, J.; Zhuang, Q. Immune landscape variation in antineutrophil cytoplasmic antibody-associated vasculitis circulation before and after plasmapheresis by single-cell sequencing. Mediat. Inflamm. 2025, 2025, 5531382. [Google Scholar] [CrossRef]
- Liu, B.; Dhanda, A.; Hirani, S.; Williams, E.L.; Sen, H.N.; Martinez Estrada, F.; et al. CD14++CD16+ monocytes are enriched by glucocorticoid treatment and are functionally attenuated in driving effector T cell responses. J. Immunol. 2015, 194(11), 5150–5160. [Google Scholar] [CrossRef]
- Momozawa, Y.; Dmitrieva, J.; Théâtre, E.; Deffontaine, V.; Rahmouni, S.; Charloteaux, B.; et al. IBD risk loci are enriched in multigenic regulatory modules encompassing putative causative genes (CEDAR cohort). Nat. Commun. 2018, 9(1), 2427. [Google Scholar] [CrossRef]
- Alegbe, T.; Harris, B.; Fachal, L.; Ramirez-Navarro, L.; Tutert, M.; Krzak, M.; et al. Cell-type-resolved genetic regulatory variation shapes inflammatory bowel disease risk (IBDverse). medRxiv 2025, 2025.06.24.25330216. [Google Scholar] [CrossRef]
- Alegbe, T.; Harris, B.T.; Fachal, L.; Ramirez-Navarro, L.; Tutert, M.; Krzak, M.; et al. Cell-type-resolved genetic variation shapes inflammatory bowel disease risk (IBDverse). Nature 2026, 656(8126), 129–139. [Google Scholar] [CrossRef]
- Zhu, L.; Sun, W.; Chen, K.; Liu, Z.; Tang, M.; Jiang, C.; et al. Single-cell landscape of immune cells in multiple autoimmune diseases. iScience 2026, 29(1), 114515. [Google Scholar] [CrossRef]
- Ding, L.; Meng, Q.; Bao, D.; Dai, B. Cross-disease immune cells atlas reveals the similarities and differences of cell characteristics and interactions in rheumatic diseases. Front Med. 2026, 13, 1820336. [Google Scholar] [CrossRef]
- Ota, M.; Nagafuchi, Y.; Hatano, H.; Ishigaki, K.; Terao, C.; Takeshima, Y.; et al. Dynamic landscape of immune cell-specific gene regulation in immune-mediated diseases. Cell 2021, 184(11), 3006–3021.e17. [Google Scholar] [CrossRef]
- ImmuNexUT. Frequently asked questions: data and genotype sharing policy [Internet]. 2026. [Google Scholar]
- Peters, J.E.; Lyons, P.A.; Lee, J.C.; Richard, A.C.; Fortune, M.D.; Newcombe, P.J.; et al. Insight into genotype-phenotype associations through eQTL mapping in multiple cell types in health and immune-mediated disease. PLoS Genet. 2016, 12(3), e1005908. [Google Scholar] [CrossRef]
- Lee, J.; Jeon, E.; Yu, L.; Jo, H.; Kim, S.; Park, W.; et al. Integrated analysis of COVID-19 multi-omics data for eQTLs reveals genetic mechanisms underlying disease severity. bioRxiv 2025, 2024.12.18.629144. [Google Scholar] [CrossRef]
- Reales, G.; Pullin, J.M.; Manipur, I.; Vigorito, E.; Wallace, C. Mind the colocalisation gap: characterising GWAS signals in immune-mediated diseases using immune cell eQTL data. International Genetic Epidemiology Society 2025 Annual Meeting, 2025. [Google Scholar]
- Flutre, T.; Wen, X.; Pritchard, J.; Stephens, M. A statistical framework for joint eQTL analysis in multiple tissues. PLoS Genet. 2013, 9(5), e1003486. [Google Scholar] [CrossRef]
- Krockenberger, L.; Lu, A.; Thompson, M.; Tucker, L.A.; Liu, C.; Gordon, M.G.; et al. FastGxC: fast and powerful context-specific eQTL mapping in bulk and single-cell data. Cell Genom. 2026, 6(6), 101250. [Google Scholar] [CrossRef]
- Perez, R.K.; Gordon, M.G.; Subramaniam, M.; Kim, M.C.; Hartoularos, G.C.; Targ, S.; et al. Single-cell RNA-seq reveals cell type–specific molecular and genetic associations to lupus. Science 2022, 376(6589), eabf1970. [Google Scholar] [CrossRef]
- Urbut, S.M.; Wang, G.; Carbonetto, P.; Stephens, M. Flexible statistical methods for estimating and testing effects in genomic studies with multiple conditions. Nat. Genet. 2019, 51(1), 187–195. [Google Scholar] [CrossRef]
- Randolph, H.E.; Fiege, J.K.; Thielen, B.K.; Mickelson, C.K.; Shiratori, M.; Barroso-Batista, J.; et al. Genetic ancestry effects on the response to viral infection are pervasive but cell type specific. Science 2021, 374(6571), 1127–1133. [Google Scholar] [CrossRef]
- OneK1K study team. OneK1K cohort resource [Internet]. Available online: https://onek1k.org/.
- El Garwany, O.; Panousis, N.I.; Knights, A.; Kumasaka, N.; Imaz, M.; Vilarino, L.B.; et al. Splicing QTL mapping in stimulated macrophages associates low-usage splice junctions with immune-mediated disease risk. Nat. Commun. 2025, 16(1), 7205. [Google Scholar] [CrossRef]
- Tang, S.; Yao, X.; Wang, S.; Zhu, F.; Zeng, W.; Lai, D.; et al. Multivariable genome-wide analysis elucidates the shared genetic architecture, immunosenescence features, and gut-origin therapeutic targets of ulcerative colitis-associated multisystem inflammation. Inflamm. Res. 2026, 75(1), 111. [Google Scholar] [CrossRef]
- Resztak, J.A.; Wei, J.; Zilioli, S.; Sendler, E.; Alazizi, A.; Mair-Meijers, H.E.; et al. Genetic control of the dynamic transcriptional response to immune stimuli and glucocorticoids at single-cell resolution. Genome Res. 2023, 33(6), 839–856. [Google Scholar] [CrossRef]
- Catalog, G.W.A.S. Study GCST001613: Genetically distinct subsets within ANCA-associated vasculitis [Internet]. Available online: https://www.ebi.ac.uk/gwas/studies/GCST001613.
- Shen, C.; Li, D.; Chen, H. Shared and disease-specific monocyte eQTLs across inflammatory conditions: pre-registered analysis plan (v1.1). OSF Regist. 2026. [Google Scholar] [CrossRef]
Figure 1.
Cross-disease monocyte eQTL power calibration and pilot production validation. (a) Per-eQTL detection power versus effective sample size at two significance thresholds (means over 198,400 evaluations; dotted lines mark the cohort sizes used here). (b) Detection of truly shared eQTLs per cohort before and after cross-condition borrowing. (c) False-specificity rates under three decision rules with raw counts (14,520 / 2,600 / 1 of 20,000 simulated truly shared eQTLs). (d) Pilot production run on real data (three conditions: OneK1K CD14 monocytes, Perez cM, and Randolph influenza-stimulated monocytes; 1,671,712 tested gene-variant pairs): mashR pairwise sharing heatmap, showing the highest sharing between the two PBMC cohorts (0.47) and the lowest between influenza-stimulated and healthy baseline (0.09). (e) Permutation-significant eGene counts per dataset (from eQTL Catalogue release 7 permutation files). (f) Specificity-grade distribution from the completed three-condition pilot production run on real data (shared 22.6%, high-confidence specific 15.3%, nominal 61.5%, null 0.5%). Panels (a–c) are the completed power calibration; panel (e) summarizes the catalogue resource; panels (d) and (f) are the completed pilot run that validates the production pipeline end to end on real summary statistics. The cohort-by-disease-axis design schematic and the unified-processing quality-control overview appear in Supplementary Figure 1.
Figure 1.
Cross-disease monocyte eQTL power calibration and pilot production validation. (a) Per-eQTL detection power versus effective sample size at two significance thresholds (means over 198,400 evaluations; dotted lines mark the cohort sizes used here). (b) Detection of truly shared eQTLs per cohort before and after cross-condition borrowing. (c) False-specificity rates under three decision rules with raw counts (14,520 / 2,600 / 1 of 20,000 simulated truly shared eQTLs). (d) Pilot production run on real data (three conditions: OneK1K CD14 monocytes, Perez cM, and Randolph influenza-stimulated monocytes; 1,671,712 tested gene-variant pairs): mashR pairwise sharing heatmap, showing the highest sharing between the two PBMC cohorts (0.47) and the lowest between influenza-stimulated and healthy baseline (0.09). (e) Permutation-significant eGene counts per dataset (from eQTL Catalogue release 7 permutation files). (f) Specificity-grade distribution from the completed three-condition pilot production run on real data (shared 22.6%, high-confidence specific 15.3%, nominal 61.5%, null 0.5%). Panels (a–c) are the completed power calibration; panel (e) summarizes the catalogue resource; panels (d) and (f) are the completed pilot run that validates the production pipeline end to end on real summary statistics. The cohort-by-disease-axis design schematic and the unified-processing quality-control overview appear in Supplementary Figure 1.
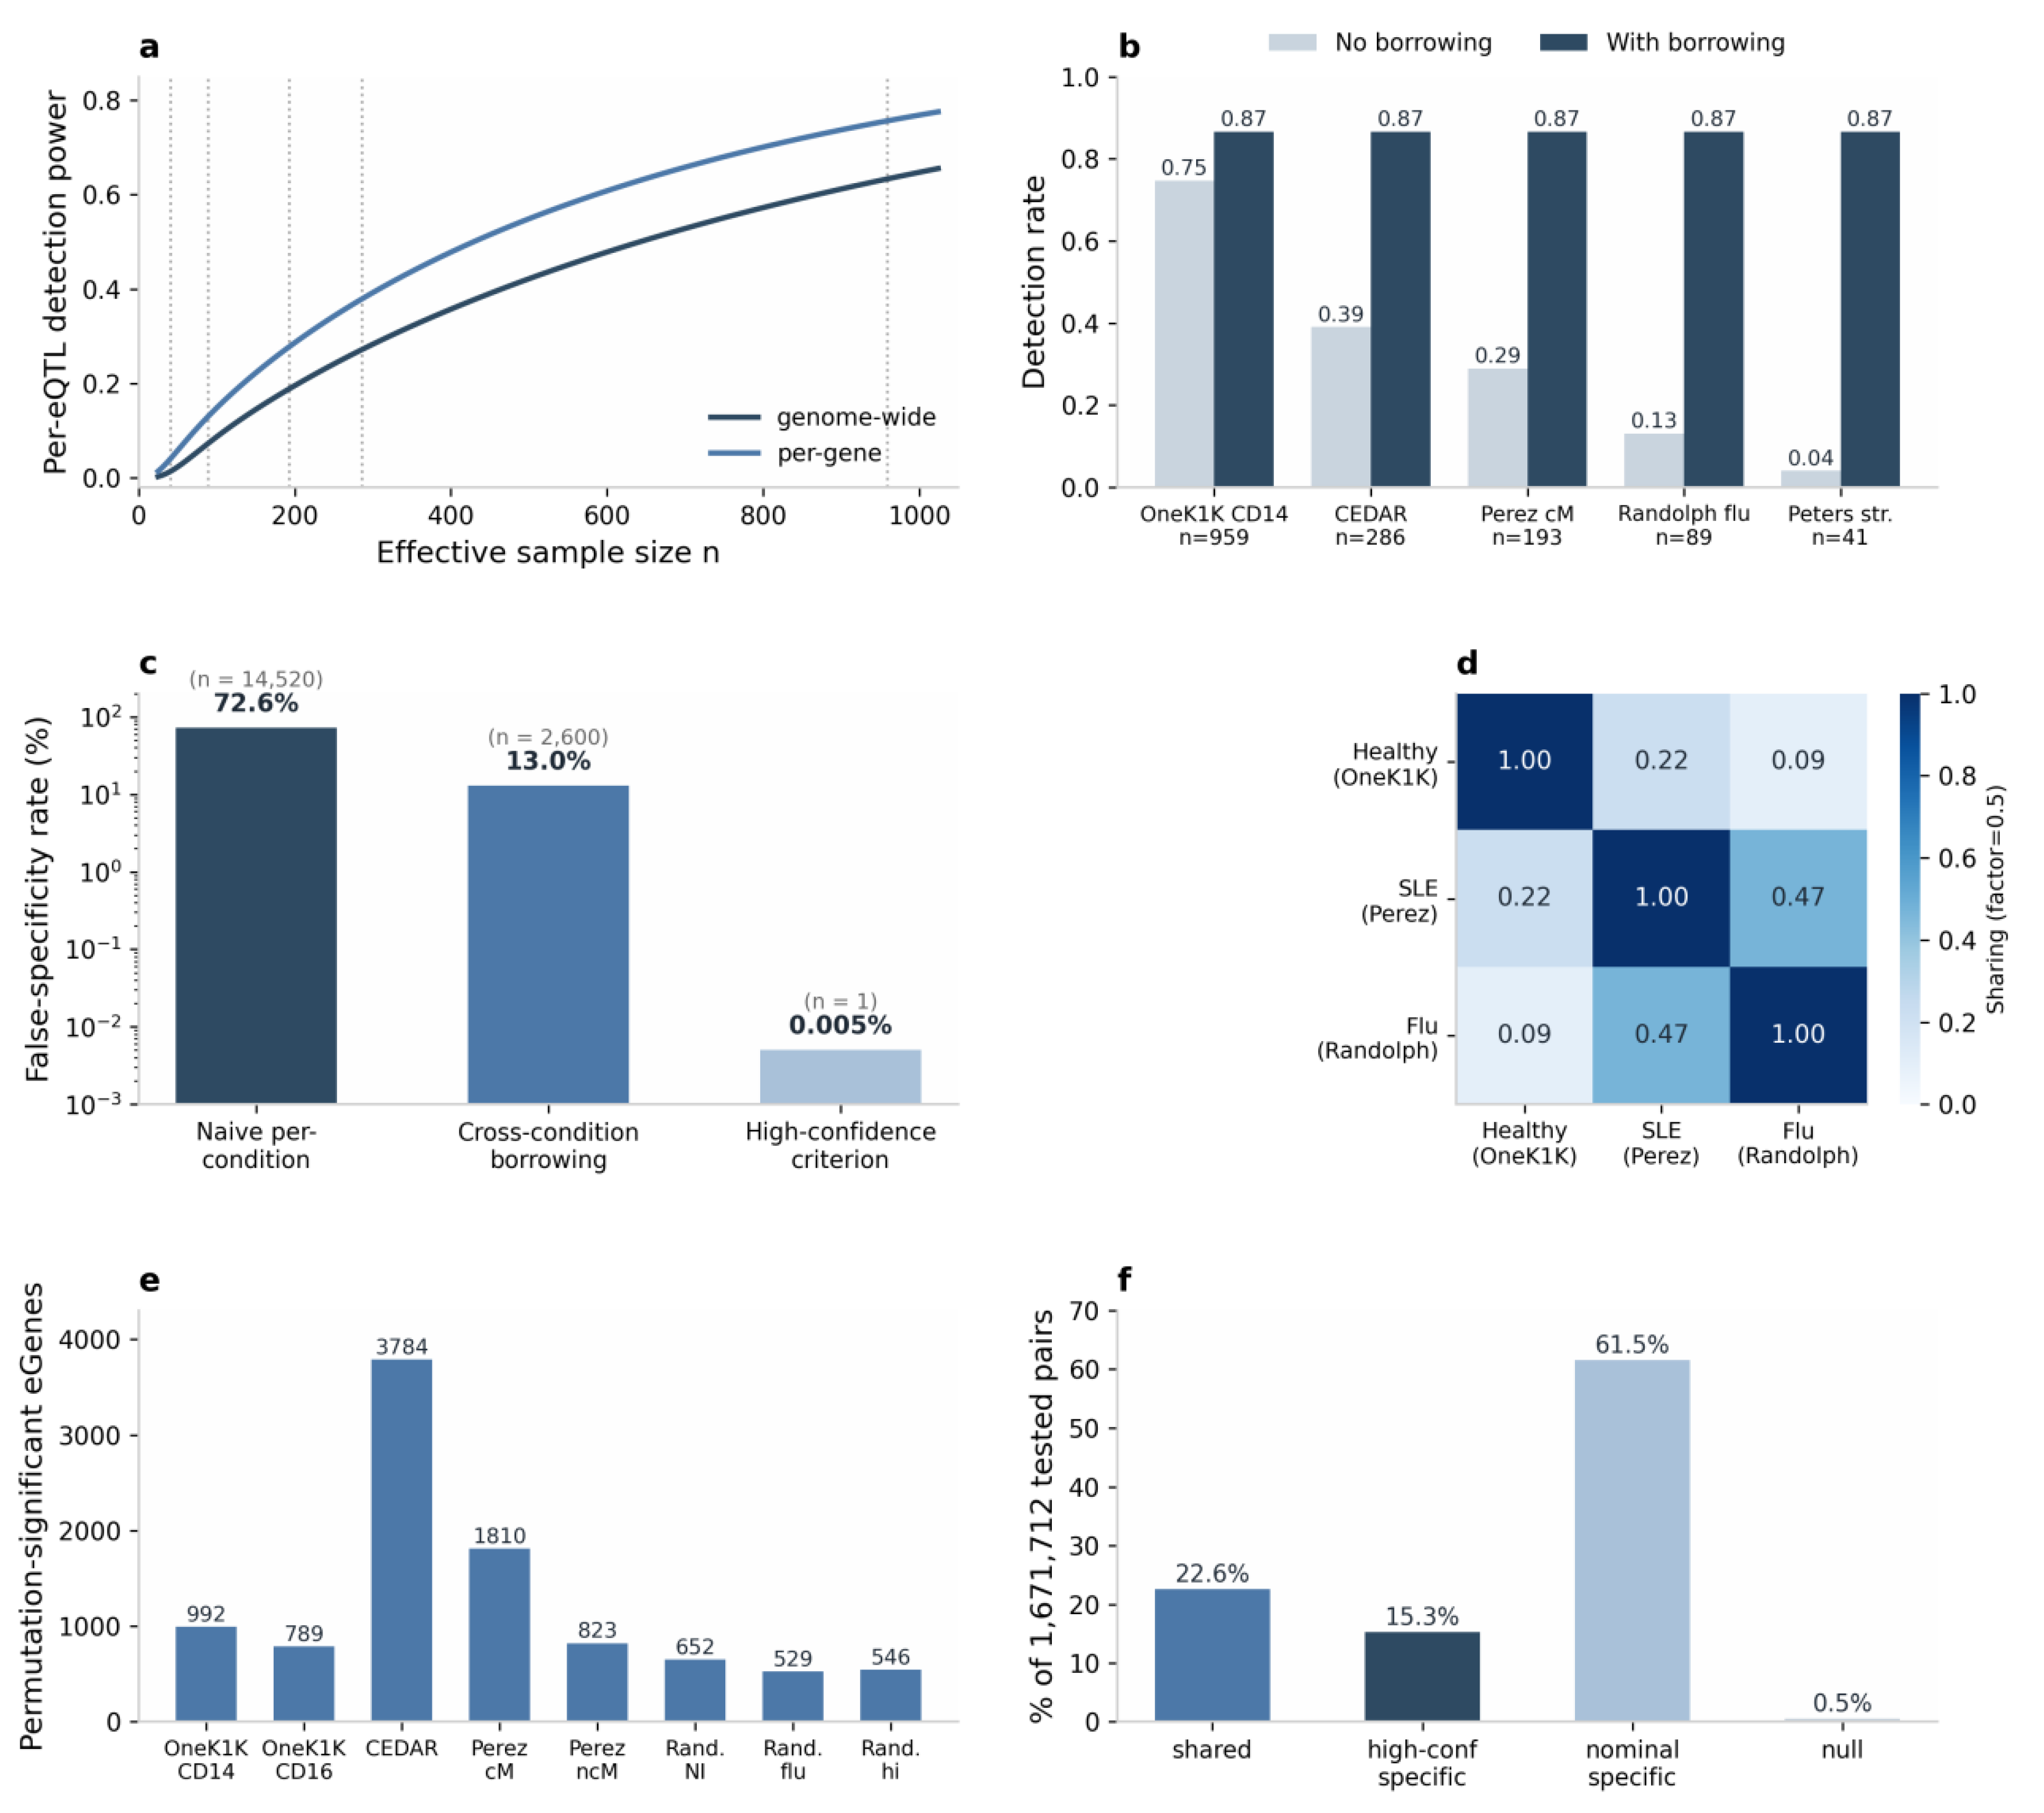
Figure 2.
Full-scale seven-condition production decomposition. (a) Pairwise mashR sharing by magnitude (factor 0.5) across the seven production conditions (n = 3,277,117 strong-set pairs): highest within the Randolph paired triad (0.89–0.95) and between the two Perez monocyte subsets (0.90), intermediate between the Perez and Randolph cohorts (0.35–0.71), and lowest between the OneK1K healthy baseline and all external cohorts (0.14–0.27). (b) Fitted mixture weights (largest components): the data-driven (ED) covariance structures together carry 0.9471 of the total weight (ED_tPCA.16 = 0.854). (c) Distribution of the per-eQTL specificity index T across the strong set (mean 0.485, median 0.429); the pile-ups at the [0, 1] bounds reflect the 22.06% of rows truncated by the sampling-error bias correction. (d) Specificity-grade distribution (shared 40.4%, high-confidence specific 16.87%, nominal specific 26.2%, null 16.5%) shown against the pre-registered 20% ceiling for the high-confidence fraction; the fraction is within the ceiling under the MHC-inclusive configuration, after adjudication-layer MHC exclusion (16.90%), and in all 18 cells of the adjudication sensitivity grid (11.4%–19.3%; pre-registered 80% robustness rule met). (e) Top-15 genes by per-gene specificity score G_spec, coloured by locus (MHC, chr6, versus the 17q21.31 inversion region). (f) Per-condition strong-set coverage against the pre-registered coverage gate of at least 0.05. The PCA and hierarchical clustering of the posterior mean matrix and the Randolph within-cohort state contrasts are reported in Section 3.4 and the supplement; the pre-registered UpSet diagram remains pending and will appear in the supplement; the pilot-scale sharing matrix and specificity-grade distribution appear in Figure 1d and Figure 1f; housekeeping versus IFIT/ISG positive controls and permutation calibration of the right tail of T remain pre-registered.
Figure 2.
Full-scale seven-condition production decomposition. (a) Pairwise mashR sharing by magnitude (factor 0.5) across the seven production conditions (n = 3,277,117 strong-set pairs): highest within the Randolph paired triad (0.89–0.95) and between the two Perez monocyte subsets (0.90), intermediate between the Perez and Randolph cohorts (0.35–0.71), and lowest between the OneK1K healthy baseline and all external cohorts (0.14–0.27). (b) Fitted mixture weights (largest components): the data-driven (ED) covariance structures together carry 0.9471 of the total weight (ED_tPCA.16 = 0.854). (c) Distribution of the per-eQTL specificity index T across the strong set (mean 0.485, median 0.429); the pile-ups at the [0, 1] bounds reflect the 22.06% of rows truncated by the sampling-error bias correction. (d) Specificity-grade distribution (shared 40.4%, high-confidence specific 16.87%, nominal specific 26.2%, null 16.5%) shown against the pre-registered 20% ceiling for the high-confidence fraction; the fraction is within the ceiling under the MHC-inclusive configuration, after adjudication-layer MHC exclusion (16.90%), and in all 18 cells of the adjudication sensitivity grid (11.4%–19.3%; pre-registered 80% robustness rule met). (e) Top-15 genes by per-gene specificity score G_spec, coloured by locus (MHC, chr6, versus the 17q21.31 inversion region). (f) Per-condition strong-set coverage against the pre-registered coverage gate of at least 0.05. The PCA and hierarchical clustering of the posterior mean matrix and the Randolph within-cohort state contrasts are reported in Section 3.4 and the supplement; the pre-registered UpSet diagram remains pending and will appear in the supplement; the pilot-scale sharing matrix and specificity-grade distribution appear in Figure 1d and Figure 1f; housekeeping versus IFIT/ISG positive controls and permutation calibration of the right tail of T remain pre-registered.
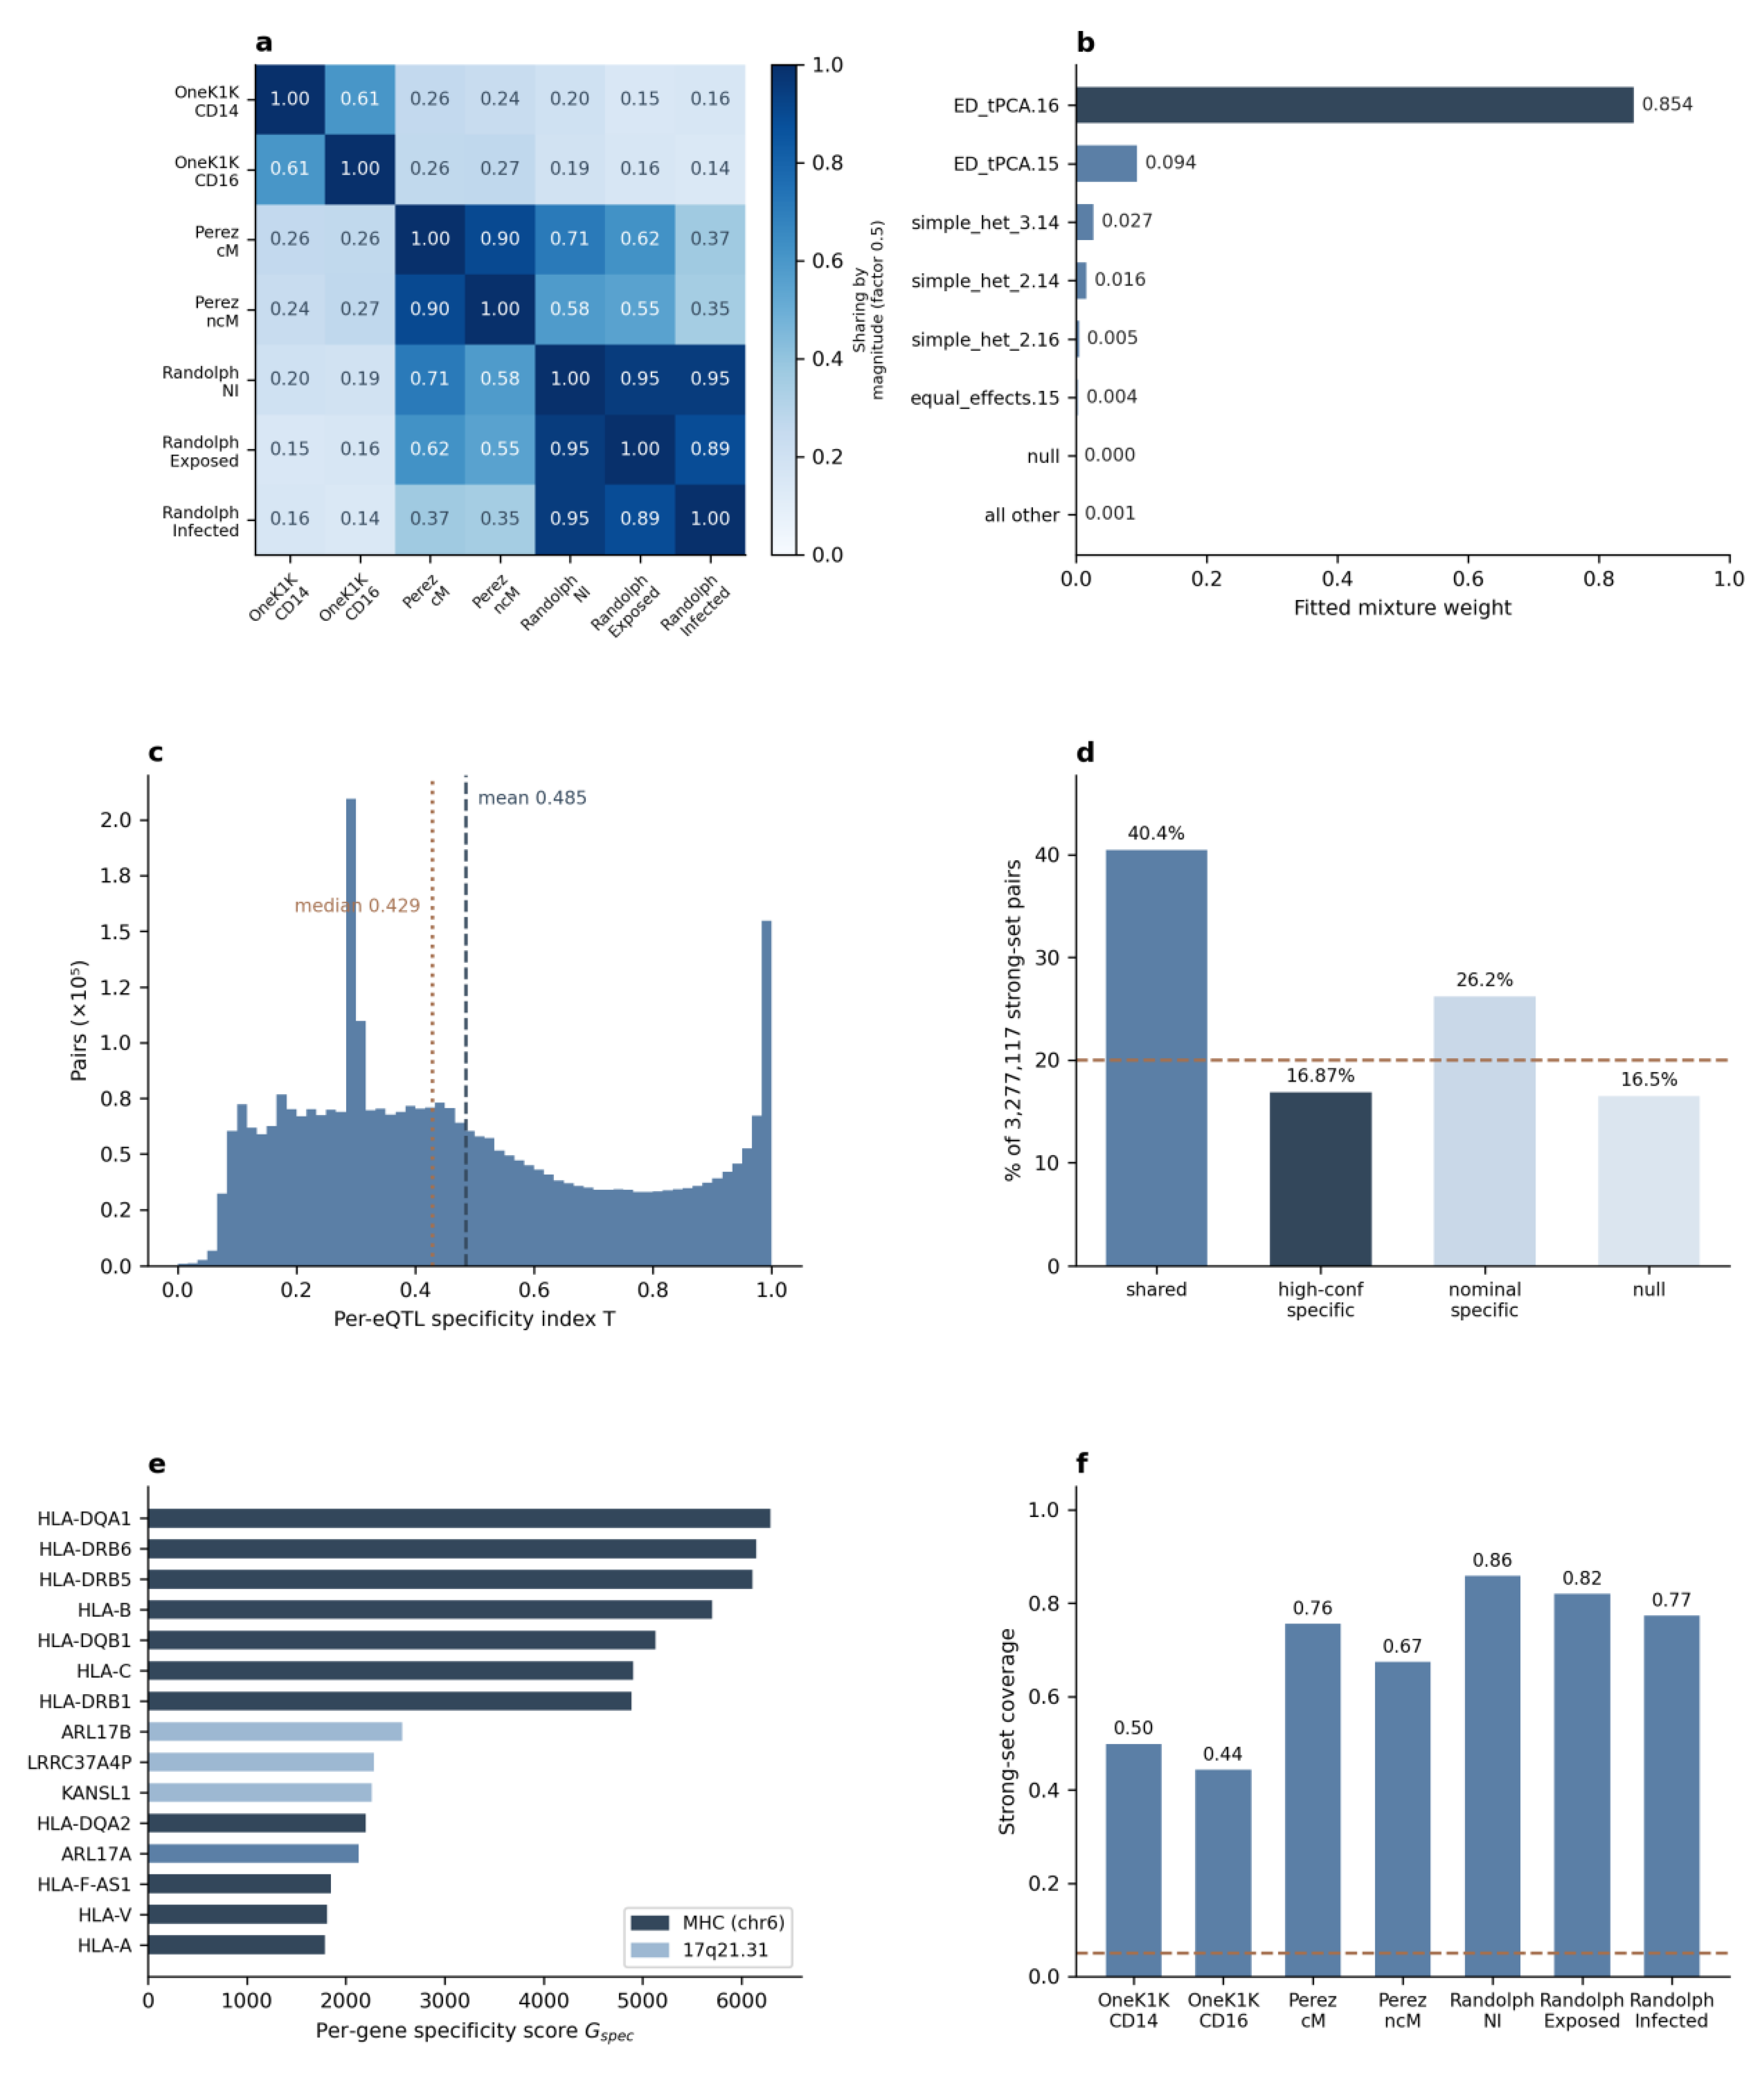

Table 1.
Monocyte eQTL datasets comprising the cross-condition resource. Track 1 datasets are openly available summary statistics; track 2 datasets require controlled-access applications submitted in week 1 and are not required for any main analysis. QTS/QTD identifiers refer to the eQTL Catalogue.
Table 1.
Monocyte eQTL datasets comprising the cross-condition resource. Track 1 datasets are openly available summary statistics; track 2 datasets require controlled-access applications submitted in week 1 and are not required for any main analysis. QTS/QTD identifiers refer to the eQTL Catalogue.
| Dataset | Disease axis | Cell type / platform | n (monocyte) | Accession | Evidence level |
|---|---|---|---|---|---|
| OneK1K | Healthy baseline | CD14+ monocytes, scRNA-seq | 959 | QTS000038 / QTD000609 | Primary reference |
| OneK1K | Healthy baseline | CD16+ monocytes, scRNA-seq | 930 | QTS000038 / QTD000610 | Primary reference |
| CEDAR (Momozawa 2018) | Healthy baseline | CD14+ sorted monocytes, microarray | 286 | QTS000007 / QTD000069; E-MTAB-6666/6667 | Healthy baseline (microarray) |
| Perez 2022 (CLUES cohort) | SLE (cohort-enriched) | Classical monocytes, scRNA-seq | 193 | QTS000037 / QTD000603 | Secondary (mixed cohort) |
| Perez 2022 (CLUES cohort) | SLE (cohort-enriched) | Non-classical monocytes, scRNA-seq | 193 | QTS000037 / QTD000604 | Secondary (mixed cohort) |
| Randolph 2021 | Influenza stimulation | Monocytes, non-infected, scRNA-seq | 89 | QTS000036 / QTD000595 | Primary (paired contrast) |
| Randolph 2021 | Influenza stimulation | Monocytes, influenza-exposed | 89 | QTS000036 / QTD000596 | Primary (paired contrast) |
| Randolph 2021 | Influenza stimulation | Infected monocytes, influenza-exposed | 88 | QTS000036 / QTD000594 | Primary (paired contrast) |
| IBDverse (track 1) | IBD | Blood myeloid subsets, scRNA-seq | 421 donors (296 HC + 125 CD) | S-BSST2922 / E-MTAB-16986 | Secondary (summary statistics) |
| Peters 2016 (track 2) | IBD / AAV / healthy strata | CD14+ sorted monocytes, microarray | 41 (HV) / 83 (IBD) / 45 (AAV) | E-MTAB-3554; EGA EGAS00001001251 (controlled) | Enhancement; borrowing only |
| CLUES (track 2) | SLE state-stratified | Monocyte subsets, individual-level | 162 SLE / 99 controls | dbGaP phs002812 (controlled) | Enhancement; sole source of true SLE state specificity |
Table 2.
. Per-cohort average statistical power to detect a typical monocyte lead cis-eQTL, from the empirical OneK1K CD14+ effect-size distribution with uncertainty-propagating resampling that propagates estimation uncertainty without removing winner’s-curse selection bias (absolute values are therefore systematically optimistic; MAF drawn from U(0.05, 0.5); Methods 5.3).
Table 2.
. Per-cohort average statistical power to detect a typical monocyte lead cis-eQTL, from the empirical OneK1K CD14+ effect-size distribution with uncertainty-propagating resampling that propagates estimation uncertainty without removing winner’s-curse selection bias (absolute values are therefore systematically optimistic; MAF drawn from U(0.05, 0.5); Methods 5.3).
| Cohort (condition) | n | Power at α = 5 × 10⁻⁸ | Power at α = 1 × 10⁻⁵ |
| Peters 2016 stratum (track 2) | 41 | 0.014 | 0.044 |
| Randolph 2021 monocytes (influenza) | 89 | 0.072 | 0.138 |
| Perez 2022 classical monocytes | 193 | 0.193 | 0.295 |
| CEDAR healthy CD14+ monocytes | 286 | 0.279 | 0.397 |
| OneK1K CD16+ monocytes | 930 | 0.618 | 0.745 |
| OneK1K CD14+ monocytes | 959 | 0.628 | 0.754 |
Disclaimer/Publisher’s Note: The statements, opinions and data contained in all publications are solely those of the individual author(s) and contributor(s) and not of MDPI and/or the editor(s). MDPI and/or the editor(s) disclaim responsibility for any injury to people or property resulting from any ideas, methods, instructions or products referred to in the content. |
© 2026 by the authors. Licensee MDPI, Basel, Switzerland. This article is an open access article distributed under the terms and conditions of the Creative Commons Attribution (CC BY) license (http://creativecommons.org/licenses/by/4.0/).
Copyright: This open access article is published under a Creative Commons CC BY 4.0 license, which permit the free download, distribution, and reuse, provided that the author and preprint are cited in any reuse.