

Submitted:
28 October 2026
Posted:
29 October 2026
You are already at the latest version
Abstract
Public genomic and wastewater surveillance data for highly pathogenic avian influenza A(H5N1) in the United States are open, large, and held in systems that do not speak to one another. We describe H5N1 Marker Watch, an open dataset that tabulates published antiviral-resistance and mammalian-adaptation marker positions in publicly deposited U.S. A(H5N1) protein sequences by state, collection year and host group, and places those counts alongside CDC National Wastewater Surveillance System H5 detections for the same state and year. Version 1.0.0 covers 95,582 protein sequences from 18,378 distinct isolates collected between 2022 and 2026 across 52 states and territories, screened at 36 marker positions drawn from WHO and CDC sources, producing 688,287 individual calls, joined to 124,427 wastewater results from 49 states of which 3,010 detected H5. Markers associated with reduced susceptibility to clinically used antivirals are rare: the neuraminidase substitution H275Y, the one substitution WHO identifies as a known clinical resistance marker, appears in 7 of 19,141 covering sequences (0.037%). The mammalian-adaptation picture differs: PB2 E627K rises across the period, from 0.126% of covering sequences in 2022 to 5.18% in the partial year 2026, while two further markers sit at frequencies better read as fixed features of the circulating clade. We report a methodological finding of general relevance: published marker positions arrive in several numbering conventions and some sources list the same site twice under two of them, so every position is validated against a named reference before it is counted. 11 of 36 markers required a numbering translation and 3 proved to be duplicates. Marker status throughout is genotype, not confirmed phenotype; no susceptibility testing was performed or is implied. Data, code and documentation are released openly and the pipeline is built for annual refresh.
Keywords:
H5N1 marker
; antiviral-resistance
; influenza A(H5N1)
1. Introduction
Highly pathogenic avian influenza A(H5N1) of clade 2.3.4.4b has circulated widely in United States wild birds and poultry since its intercontinental introduction in 2021 (Bevins et al., 2022), and since 2024 in dairy cattle (Burrough et al., 2024; Caserta et al., 2024), with onward interstate spread (Nguyen et al., 2025) and sporadic human infections (Uyeki et al., 2024). Two questions recur in outbreak response, in press coverage and in federal rulemaking dockets: is the circulating virus acquiring the genetic changes associated with reduced susceptibility to influenza antivirals, and is it acquiring the changes associated with adaptation to mammalian hosts?
The raw material to address both questions is already public. Federal and state laboratories deposit sequences in NCBI Virus, and CDC publishes sample-level wastewater H5 results through the National Wastewater Surveillance System (Louis et al., 2024; Boehm et al., 2024). Neither source, however, answers the question as posed. The sequence archive stores one protein at a time with no column indicating marker status, and the wastewater dataset is a separate table with a different unit of observation. Joining them, and screening sequences against the published marker literature, is a day of specialist work that is not repeated systematically and whose intermediate judgements are rarely written down.
This note describes an open dataset that performs that work reproducibly and records every judgement it makes. The contribution is not a new method. It is a documented, versioned, citable artifact with an explicit audit trail, built so that a state epidemiologist, a journalist or a federal commenter can obtain a number with a denominator attached instead of an impression.
Genotype, not phenotype. Every count in this dataset records which amino acid a deposited sequence carries at a published position. It does not record, test or imply what the virus does in a laboratory susceptibility assay, in an animal or in a person. Phenotypic susceptibility of contemporary clade 2.3.4.4b viruses is assessed separately, by reference laboratories running inhibition assays on live virus (Pascua et al., 2025; Patel et al., 2025). WHO is explicit that, among the neuraminidase substitutions in its reference table, only H275Y is identified as a known clinical resistance marker, that for the remainder clinical significance has not been demonstrated, and that the relationship between reduced inhibition in an assay and reduced susceptibility in a patient has not been established. The present work is one step further removed again, since it does not measure inhibition at all (WHO, 2026a). This distinction is carried through every table, figure and sentence that follows.
2. Data and Methods
2.1. Data Sources
Sequence data comprise every public NCBI Virus protein record for Influenza A virus (taxid 11320), serotype H5N1, country USA, in the five proteins screened: PB2, PA, HA, NA and M2 (NCBI Virus, 2026). Metadata were exported from the NCBI Virus search service and amino acid sequences retrieved through NCBI efetch on 14 October 2026. Across all collection years 95,952 protein records exist; 95,582 fall in the 2022-onward analysis window and all were returned, with 0 retrieval failures.
Wastewater data are the CDC National Wastewater Surveillance System dataset Wastewater Data for Avian Influenza A(H5) (dataset identifier mtpu—urpp), (CDC NWSS, 2026), downloaded in full on the same date: 124,432 sample-level results, each carrying a treatment plant, state, county, collection date and a binary H5 detection result. The dataset refreshes weekly.
Every download is recorded in a provenance log with its byte count, SHA-256 hash, source URL and access date, so that a reader can establish exactly which snapshot produced a given release.
2.2. Marker Definitions
Marker definitions are held in a data file rather than in code, one row per marker carrying its protein, published position, wild-type and variant residue, numbering convention, category, the effect as the source states it, and the source with its URL and access date. 39 markers were defined. The neuraminidase markers derive from the WHO GISRS table of neuraminidase substitutions assessed for their effects on inhibition, A(H5N1) section (WHO, 2026a; WHO, 2026b); PB2 E627K and the hemagglutinin context derive from CDC’s technical update on the Texas H5N1 sequences (CDC, 2024); the remainder from the established avian influenza marker literature, for which Suttie et al. (2019) provides a comprehensive inventory. Holding the list as data means it can be corrected, extended or disputed without touching the pipeline, and that a reader who rejects a particular marker can re-run the analysis without it.
The list is deliberately conservative rather than comprehensive. Markers outside it were not screened, and their absence from the results is not evidence of their absence from the sequences.
2.3. Reference Sequences and Position Resolution
A published position number is not by itself sufficient to locate a residue, because influenza marker positions are published in several numbering conventions. Neuraminidase substitutions in particular are reported both in full-length N1 numbering and in the numbering of a stalk-deleted N1, and hemagglutinin substitutions are conventionally reported in H3 mature numbering, which omits the signal peptide.
The pipeline therefore validates rather than assumes. For each marker it confirms that the project reference carries either the published wild-type residue (preferred) or the published variant residue at the candidate position, and records which. Candidates are tried in order: the published position; for neuraminidase, the published position plus a 20 amino acid stalk offset; the N2-equivalent position where the source supplies one; and for hemagglutinin, the H3 mature position plus a 16 amino acid signal peptide, translated into H5 coordinates by global pairwise alignment to A/Aichi/2/1968. A marker that resolves to no valid position is excluded and reported rather than guessed. Markers resolving to the same protein, position, wild-type and variant residue are the same site published under two conventions and are counted once, under the name a reader is likelier to recognise.
Of 39 markers defined, 36 resolved and are counted and 3 were identified as duplicate sites. 11 required a numbering translation. In 2 cases the reference isolate itself carries the marker, which is why calls are made against the published wild-type residue rather than against the reference.
Reference sequences for all five proteins are taken from A/Texas/37/2024, the human case analysed by CDC in its April 2024 technical update, listed in Table 1. The reference supplies coordinates only.
2.4. Marker Calling
Each sequence is compared to the reference for its protein. Sequences of identical length and high sampled identity are read by direct indexing; the remaining 519 of 95,582 sequences are globally aligned with a BLOSUM62 pairwise alignment and the reference position mapped through the alignment. Each sequence-marker pair receives one of four calls (Table 2).
The treatment of partial sequences is the single most consequential convention here. A sequence that terminates before a position carries no information about that position. Counting it as wild-type would inflate every denominator and understate every reported frequency. Such calls are therefore excluded from all denominators and reported separately.
2.5. Host Grouping, Geography and the Join
Host is taken from the NCBI host field and mapped to groups by documented keyword rules. Screened sequences distribute as: wild bird 34,662; dairy cattle 23,247; poultry 14,540; other mammal 1,766; human 270; and 21,097 in an unknown group, overwhelmingly records for which NCBI carries no host value at all. Host is not inferred from strain names in this version, because that would substitute inference for recorded metadata; it is planned as a separately flagged field in a later version.
State is taken from the NCBI state field, with records lacking one retained under UNKNOWN rather than dropped. Sequence and wastewater records are joined on state and collection year. Of 252 state-year cells, 143 carry both sources, 103 sequences only and 6 wastewater only. Single-source cells are retained, since dropping them would conceal precisely where one surveillance system operates and the other does not.
Counts are reported for every cell. Percentages are reported only where the denominator reaches 10; 13,317 of 25,947 rows in the finest-grained table fall below that threshold, and a proportion computed on a handful of sequences is not a rate.
3. Results
3.1. Overall Marker Prevalence
Across the analysis window, 25,344 of 688,287 calls were marker-positive. The distribution is strongly skewed (Figure 1): a small number of positions are near-fixed in the circulating clade, while the markers of greatest clinical interest sit at or below one tenth of one percent.
3.2. Antiviral-Resistance Markers
22 of the 26 antiviral-resistance markers screened were detected at least once. The most frequent appear in Table 3. The neuraminidase substitution H275Y was detected in 7 of 19,141 covering sequences (0.037%), a substitution documented in H5N1 during oseltamivir treatment (de Jong et al., 2005); the polymerase acidic substitution I38T, associated with reduced susceptibility to the cap-dependent endonuclease inhibitor baloxavir (Omoto et al., 2018; Noshi et al., 2018; Hayden et al., 2018; Mishin et al., 2019), in 19 of 19,080 (0.100%); and the M2 substitution S31N, associated with adamantane resistance (Hay et al., 1985), in 75 of 19,130 (0.392%). All H275Y-positive accessions are enumerated individually in the released quality report so that any reader can confirm them against the source archive. Frequencies of this order are consistent with the global susceptibility surveillance picture (Govorkova et al., 2022; Hussain et al., 2025).
3.3. Mammalian-Adaptation Markers
7 of the 10 adaptation markers screened were detected at least once, and two require care in interpretation. HA T160A appears in 18,939 of 19,161 covering sequences (98.84%), which is near-fixation. A substitution present in almost every sequence is a property of the circulating clade, not a signal that changes from season to season, and should not be reported as though it were. PB2 M631L stands at 28.12% overall, but its year profile shows why a pooled figure can mislead: 0.025% in 2022, rising to 67.49% in 2024 and falling back to 12.47% in 2026, a profile consistent with a genotype sweeping through one host population and then receding. Neither marker should be confused with the hemagglutinin receptor-binding substitutions that experimental work has associated with respiratory droplet transmission between ferrets (Herfst et al., 2012; Imai et al., 2012), none of which was detected in any sequence screened here.
PB2 E627K shows the clearest directional trend in the dataset (Figure 2): 0.126% of covering sequences in 2022, 0.773% in 2023, 0.544% in 2024, 2.55% in 2025 and 5.18% in the partial year 2026, on denominators of 6,467 and 1,892 sequences in the final two years. E627K enhances polymerase activity and replication in mammalian cells, and CDC describes it as having the potential to affect pathogenesis or transmission in infected mammals on the basis of mouse, guinea pig and ferret studies (Subbarao et al., 1993; Hatta et al., 2001; Steel et al., 2009). The companion substitution D701N, also screened here, has a comparable experimental basis (Li et al., 2005; Gabriel et al., 2005; Steel et al., 2009).
This trend should be read with its principal confound stated plainly. Public sequences are deposited through outbreak investigation, not through a sampling frame, and mammalian infections are investigated intensively precisely because they are concerning. A rising frequency among deposited sequences is therefore not equivalent to a rising frequency in circulating virus, and the present data cannot separate the two explanations. The 2026 figure additionally rests on a partial year, since deposition lags collection.
3.4. Wastewater Detections Alongside Sequences
Across the window, 3,010 of 124,427 wastewater samples detected H5 (2.42%). Detection is concentrated in time and place rather than distributed evenly (Figure 3). Table 4 gives the state-years carrying the most sequences together with their wastewater figures.
The two measures are placed side by side and nothing here tests whether they are related. They do not measure the same thing: wastewater sampling has a catchment population and a cadence set by participating utilities, whereas sequence deposition has no catchment and follows investigations. Their denominators are not comparable, and a state-year cell may carry hundreds of wastewater samples and no sequences, or the reverse.
4. Limitations
The dataset’s limitations are documented in full with the release; the following are those that bear directly on how the results above may be read.
- Genotype, not phenotype. No susceptibility testing was performed, cited as confirmation, or implied. A marker-positive sequence is not a resistant virus.
- Convenience sample. Public sequences arise from outbreak investigation, regulatory response and research, not from a sampling frame. Counts by state and year reflect sequencing effort at least as much as viral activity, and comparisons between states are comparisons of what was sequenced.
- Metadata gaps. 21,097 of 95,582 screened sequences carry no host value, leaving real holes in the host-stratified tables.
- Numbering conventions are interpretive. 11 marker positions required translation before they could be located. The procedure is validated and fully recorded, but it remains an interpretive step that a reader may revisit.
- A single reference per protein. A different reference could in principle resolve an ambiguous position differently; neuraminidase, with its stalk-length variation, is the most exposed to this.
- No association tested. Wastewater and sequence measures are reported side by side and are not modelled against one another.
- Partial final year. 2026 covers collections through 14 October 2026, and deposition lags collection, so recent months are undercounted.
- Moving sources. Both sources update continuously, so published versions are snapshots and are versioned and dated accordingly.
5. Reproducibility, Data and Code Availability
The pipeline comprises numbered scripts run in order, each independently runnable and idempotent, such that a reader can reproduce the committed outputs from the README alone. Every download is logged with a cryptographic hash and access date. The released quality report records row counts at each stage, 0 internal consistency problems across 25,947 marker rows, and 15 named spot checks: individual accessions with direct archive links and the expected residue at the stated position, verifiable by hand. Every number in this document is interpolated from a statistics file written by the pipeline, so the text cannot diverge from the data.
Data, code and documentation are released openly. Code is licensed under the MIT licence; data and documents under CC BY 4.0, with attribution to NCBI Virus, the CDC National Wastewater Surveillance System and the marker sources named per row in the marker definition file. The underlying federal datasets are United States Government works. The repository and DOI are given in the release record; the dataset is versioned for annual refresh.
Data Availability Statement
The marker definition file carries a source, URL and access date for every marker row. Raw-data provenance, including the byte count, SHA-256 hash and access date of every downloaded file, is released with the repository. The primary data sources are (NCBI Virus, 2026; CDC NWSS, 2026); marker definitions draw principally on (WHO, 2026a; WHO, 2026b; CDC, 2024).
Acknowledgments
Data assembly, code, and drafting mechanics were AI-assisted. The author selected the marker list, made every analytic decision, verified the numbers against their sources, and is responsible for the content.
Conflicts of Interest
The author declares no competing interests and received no funding for this work.
References
- Bevins, S. N.; Shriner, S. A.; Cumbee, J. C., Jr. Intercontinental movement of highly pathogenic avian influenza A(H5N1) clade 2.3.4.4 virus to the United States, 2021. Emerging Infectious Diseases 2022, 28(5), 1006–1011. [Google Scholar] [CrossRef] [PubMed]
- Boehm, A. B.; Wolfe, M. K.; Bidwell, A. L. Human pathogen nucleic acids in wastewater solids from 191 wastewater treatment plants in the United States. Scientific Data 2024, 11, 1141. [Google Scholar] [CrossRef] [PubMed]
- Burrough, E. R.; Magstadt, D. R.; Petersen, B. Highly pathogenic avian influenza A(H5N1) clade 2.3.4.4b virus infection in domestic dairy cattle and cats, United States, 2024. Emerging Infectious Diseases 2024, 30(7), 1335–1343. [Google Scholar] [CrossRef] [PubMed]
- Caserta, L. C.; Frye, E. A.; Butt, S. L. Spillover of highly pathogenic avian influenza H5N1 virus to dairy cattle. Nature 2024, 634, 669–676. [Google Scholar] [CrossRef] [PubMed]
- Centers for Disease Control and Prevention. Technical update: summary analysis of genetic sequences of highly pathogenic avian influenza A(H5N1) viruses in Texas. 2024. Available online: https://vvv.cdc.gov/bird-flu/spo (accessed on 14 October 2026).
- Centers for Disease Control and Prevention. Wastewater data for avian influenza A(H5), National Wastewater Surveillance System, dataset ntpu—urpp. 2026. Available online: https://data.cdc.gov/d/ntpu-urpp (accessed on 14 October 2026).
- de Jong, M. D.; Tran, T. T.; Truong, H. K. Oseltamivir resistance during treatment of influenza A, 2005.
- infection. New England Journal of Medicine 353(25), 2667–2672. [CrossRef]
- Gabriel, G.; Dauber, B.; Wolff, T. The viral polymerase mediates adaptation of an avian influenza virus to a mammalian host. Proceedings of the National Academy of Sciences 2005, 102(51), 18590–18595. [Google Scholar] [CrossRef]
- Govorkova, E. A.; Takashita, E.; Daniels, R. S. Global update on the susceptibilities of human influenza viruses to neuraminidase inhibitors and the cap-dependent endonuclease inhibitor baloxavir, 2018–2020. Antiviral Research 2022, 200, 105281. [Google Scholar] [CrossRef]
- Hatta, M.; Gao, P.; Halfmann, P. Molecular basis for high virulence of Hong Kong H5N1 influenza A viruses. Science 2001, 293(5536), 1840–1842. [Google Scholar] [CrossRef] [PubMed]
- Hay, A. J.; Wolstenholme, A. J.; Skehel, J. J. The molecular basis of the specific anti-influenza action of amantadine. The EMBO Journal 1985, 4(11), 3021–3024. [Google Scholar] [CrossRef]
- Hayden, F. G.; Sugaya, N.; Hirotsu, N. Baloxavir marboxil for uncomplicated influenza in adults and adolescents. New England Journal of Medicine 2018, 379(10), 913–923. [Google Scholar] [CrossRef]
- Herfst, S.; Schrauwen, E. J. A.; Linster, M. Airborne transmission of influenza A/H5N1 virus between ferrets. Science 2012, 336(6088), 1534–1541. [Google Scholar] [CrossRef] [PubMed]
- Hussain, S.; Meijer, A.; Govorkova, E. A. Global update on the susceptibilities of influenza viruses to neuraminidase inhibitors and the cap-dependent endonuclease inhibitor baloxavir. Antiviral Research 2025, 241, 106217. [Google Scholar] [CrossRef] [PubMed]
- Imai, M.; Watanabe, T.; Hatta, M. Experimental adaptation of an influenza H5 HA confers respiratory droplet transmission to a reassortant H5 HA/H1N1 virus in ferrets. Nature 2012, 486, 420–428. [Google Scholar] [CrossRef] [PubMed]
- Li, Z.; Chen, H.; Jiao, P. Molecular basis of replication of duck H5N1 influenza viruses in a mammalian mouse model. Journal of Virology 2005, 79(18), 12058–12064. [Google Scholar] [CrossRef] [PubMed]
- Louis, S.; Mark-Carew, M.; Biggerstaff, M. Wastewater surveillance for influenza A virus and H5 subtype concurrent with the highly pathogenic avian influenza A(H5N1) virus outbreak in cattle and poultry. MMWR Morbidity and Mortality Weekly Report 2024, 73(37), 804–809. [Google Scholar] [CrossRef]
- Mishin, V. P.; Patel, M. C.; Chesnokov, A. Susceptibility of influenza A, B, C, and D viruses to baloxavir. Emerging Infectious Diseases 2019, 25(10), 1969–1972. [Google Scholar] [CrossRef] [PubMed]
- National Center for Biotechnology Information. NCBI Virus. 2026. Available online: https://vvv.ncbi.nln.nih.gov/labs/virus/ (accessed on 14 October 2026).
- Nguyen, T. Q.; Hutter, C. R.; Markin, A. Emergence and interstate spread of highly pathogenic avian influenza A(H5N1) in dairy cattle in the United States. Science 2025, 388(6742), eadq0900. [Google Scholar] [CrossRef] [PubMed]
- Noshi, T.; Kitano, M.; Taniguchi, K. In vitro characterization of baloxavir acid, a first-in-class cap-dependent endonuclease inhibitor of the influenza virus polymerase PA subunit. Antiviral Research 2018, 160, 109–117. [Google Scholar] [CrossRef] [PubMed]
- Omoto, S.; Speranzini, V.; Hashimoto, T. Characterization of influenza virus variants induced by treatment with the endonuclease inhibitor baloxavir marboxil. Scientific Reports 2018, 8, 9633. [Google Scholar] [CrossRef] [PubMed]
- Pascua, P. N. Q.; Chesnokov, A.; Nguyen, H. T. Antiviral susceptibility of influenza A(H5N1) clade 2.3.2.1c and 2.3.4.4b viruses from humans, 2023–2024. Emerging Infectious Diseases 2025, 31(4), 751–760. [Google Scholar] [CrossRef] [PubMed]
- Patel, M. C.; Nguyen, H. T.; Mishin, V. P. Antiviral susceptibility monitoring: testing algorithm, methods, and findings for influenza season, 2023–2024. Antiviral Research 2025, 244, 106299. [Google Scholar] [CrossRef] [PubMed]
- Steel, J.; Lowen, A. C.; Mubareka, S. Transmission of influenza virus in a mammalian host is increased by PB2 amino acids 627K or 627E/701N. PLoS Pathogens 2009, 5(1), e1000252. [Google Scholar] [CrossRef]
- Subbarao, E. K.; London, W.; Murphy, B. R. A single amino acid in the PB2 gene of influenza A virus is a determinant of host range. Journal of Virology 1993, 67(4), 1761–1764. [Google Scholar] [CrossRef]
- Suttie, A.; Deng, Y.-M.; Greenhill, A. R. Inventory of molecular markers affecting biological characteristics of avian influenza A viruses. Virus Genes 2019, 55(6), 739–768. [Google Scholar] [CrossRef] [PubMed]
- Uyeki, T. M.; Milton, S.; Abdul Hamid, C. Highly pathogenic avian influenza A(H5N1) virus infection in a dairy farm worker. New England Journal of Medicine 2024, 390(21), 2028–2029. [Google Scholar] [CrossRef]
- World Health Organization. Antiviral susceptibility of influenza viruses. 2026. Available online: https://www.who.int/teams/global-influenza-programme/laboratory-network/quality-assurance/antiviral-susceptibility-influenza (accessed on 14 October 2026).
- World Health Organization; Global Influenza Surveillance and Response System. Summary of neuraminidase amino acid substitutions assessed for their effects on inhibition; Last updated; A(H5N1) section, 2026; (accessed on 14 October 2026). [Google Scholar]
Figure 1.
Marker prevalence across all states, hosts and collection years, on a logarithmic scale, coloured by category. The denominator for each marker is the number of sequences whose amino acid sequence spans that position. Markers at or near 100% are fixed or near-fixed features of the circulating clade rather than emerging signals.
Figure 1.
Marker prevalence across all states, hosts and collection years, on a logarithmic scale, coloured by category. The denominator for each marker is the number of sequences whose amino acid sequence spans that position. Markers at or near 100% are fixed or near-fixed features of the circulating clade rather than emerging signals.
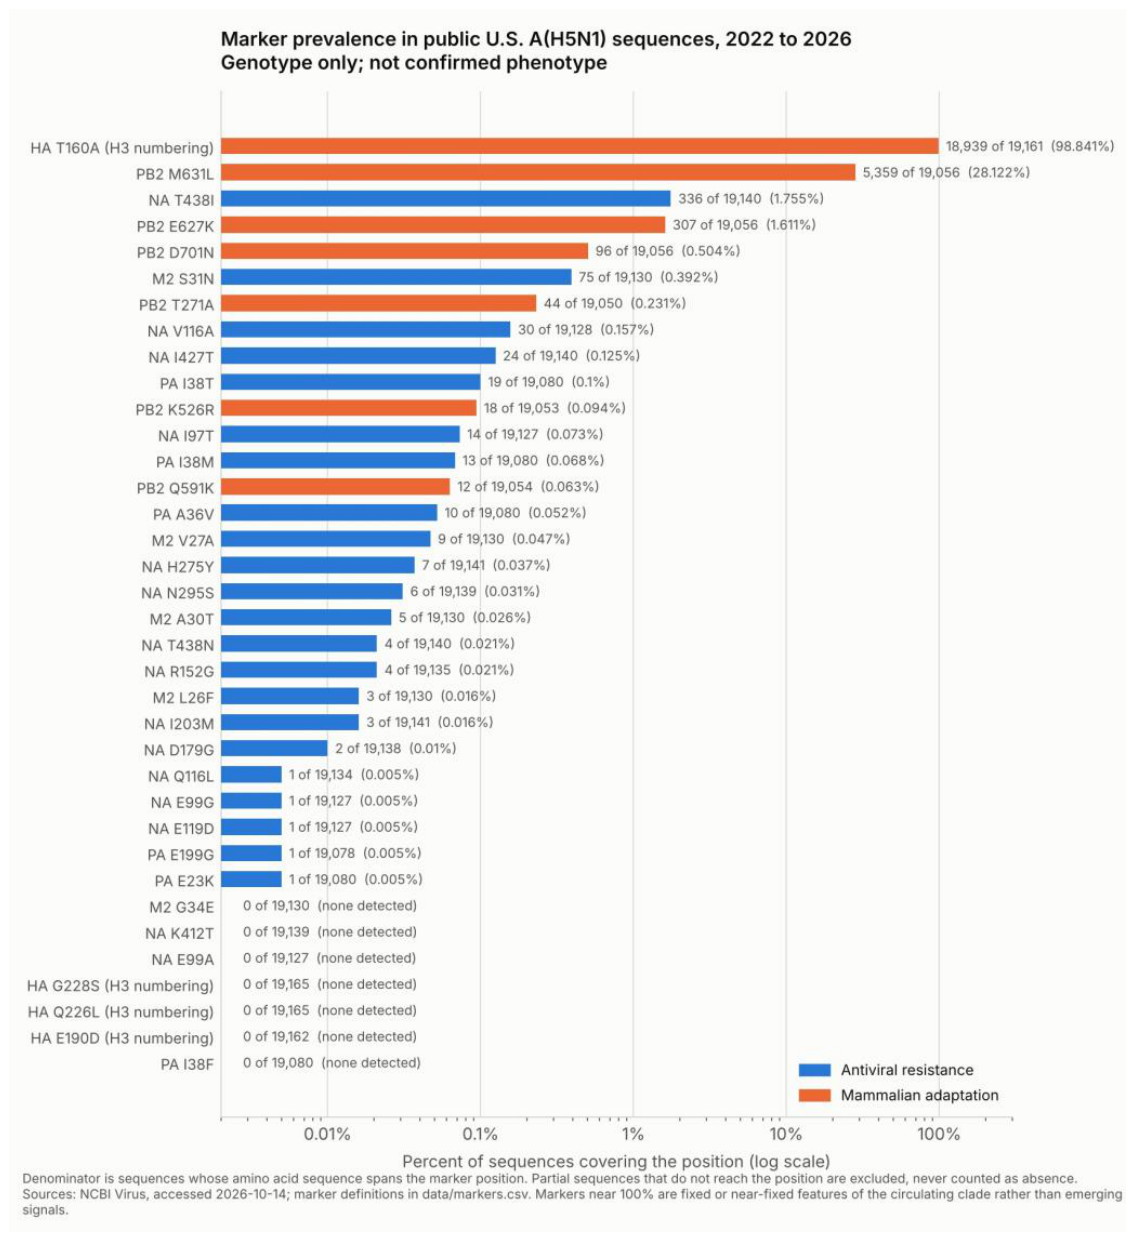
Figure 2.
Marker frequency by collection year for the markers with at least ten positive sequences. Each panel carries its own vertical scale and prints the positive count over the denominator. 2026 is a partial year, covering collections through 14 October 2026.
Figure 2.
Marker frequency by collection year for the markers with at least ten positive sequences. Each panel carries its own vertical scale and prints the positive count over the denominator. 2026 is a partial year, covering collections through 14 October 2026.
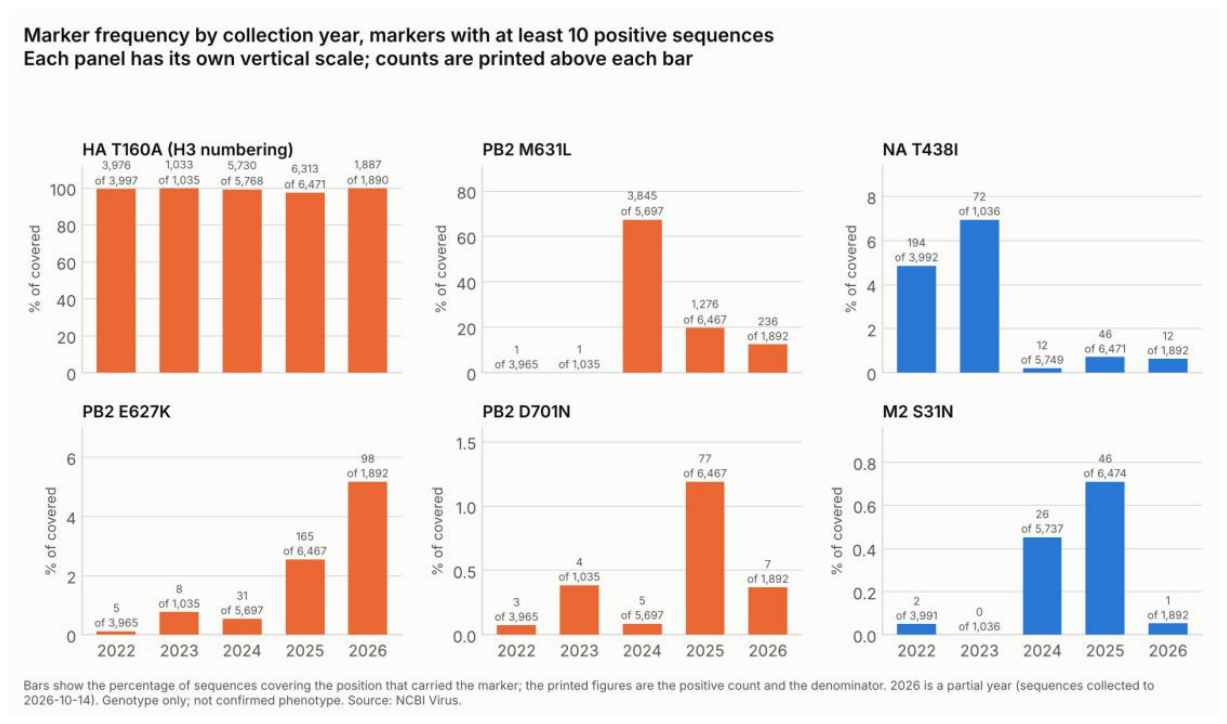
Figure 3.
National monthly wastewater H5 detection rate and monthly sequence volume, plotted on separate axes. The two panels are shown together for temporal context only; no association between them is modelled or tested.
Figure 3.
National monthly wastewater H5 detection rate and monthly sequence volume, plotted on separate axes. The two panels are shown together for temporal context only; no association between them is modelled or tested.
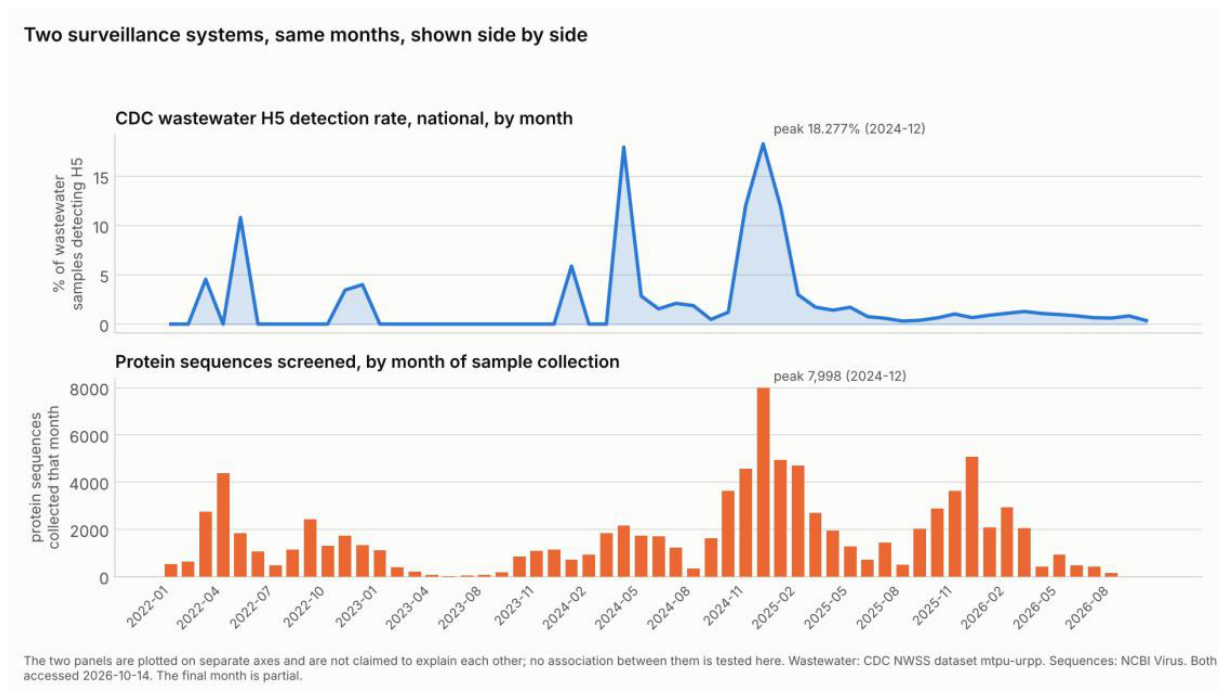

Table 1.
Project reference sequences, all from A/Texas/37/2024. The reference establishes coordinates; marker calls are made against the published wild-type and variant residues, not against the reference, which itself carries PB2 627K and HA 160A.
Table 1.
Project reference sequences, all from A/Texas/37/2024. The reference establishes coordinates; marker calls are made against the published wild-type and variant residues, not against the reference, which itself carries PB2 627K and HA 160A.
| Protein | Accession | Length (aa) |
|---|---|---|
| PB2 | WYN03024.1 | 759 |
| PA | WYN03017.1 | 716 |
| HA | WYN03019.1 | 567 |
| NA | WYN03022.1 | 469 |
| M2 | WYN03021.1 | 97 |
Table 2.
Distribution of the 688,287 sequence-marker calls. not_covered calls are excluded from every denominator and are never treated as absence of a marker.
Table 2.
Distribution of the 688,287 sequence-marker calls. not_covered calls are excluded from every denominator and are never treated as absence of a marker.
| Call | Condition | Count | Share |
|---|---|---|---|
| narker | carries the published variant residue | 25,344 | 3.68% |
| vild_type | carries the published wild-type residue | 660,787 | 96.00% |
| other | carries some third residue | 1,998 | 0.29% |
| not_covered | does not span the position | 158 | 0.02% |
Table 3.
Most frequently detected antiviral-resistance markers. Detection of a marker is a genotypic observation and is not evidence of reduced susceptibility in any assay or patient.
Table 3.
Most frequently detected antiviral-resistance markers. Detection of a marker is a genotypic observation and is not evidence of reduced susceptibility in any assay or patient.
| Marker | Positive | Covered | Percent |
|---|---|---|---|
| NA T438I | 336 | 19,140 | 1.755% |
| M2 S31N | 75 | 19,130 | 0.392% |
| NA V116A | 30 | 19,128 | 0.157% |
| NA I427T | 24 | 19,140 | 0.125% |
| PA I38T | 19 | 19,080 | 0.100% |
| NA I97T | 14 | 19,127 | 0.073% |
| PA I38M | 13 | 19,080 | 0.068% |
| PA A36V | 10 | 19,080 | 0.052% |
| M2 V27A | 9 | 19,130 | 0.047% |
| NA H275Y | 7 | 19,141 | 0.037% |
Table 4.
State-years carrying the most sequences, with wastewater figures for the same cell. The isolate count is distinct strain names while the E627K column counts PB2 sequences, so the two differ where an isolate has more than one deposited PB2 record.
Table 4.
State-years carrying the most sequences, with wastewater figures for the same cell. The isolate count is distinct strain names while the E627K column counts PB2 sequences, so the two differ where an isolate has more than one deposited PB2 record.
| State | Year | Isolates | WW samples | WW detect | WW % | E627K |
|---|---|---|---|---|---|---|
| CA | 2024 | 2,093 | 5,543 | 1,198 | 21.61% | 3 / 2,337 |
| CA | 2025 | 1,027 | 13,222 | 578 | 4.37% | 83 / 1,062 |
| MN | 2022 | 488 | no data | – | – | 0 / 488 |
| NY | 2025 | 454 | 667 | 5 | 0.75% | 1 / 469 |
| ID | 2025 | 407 | 764 | 0 | 0.00% | 1 / 409 |
| UNKNOWN | 2022 | 399 | no data | – | – | 3 / 372 |
| IN | 2025 | 383 | 849 | 0 | 0.00% | 0 / 429 |
| UNKNOWN | 2024 | 378 | no data | – | – | 11 / 368 |
| CO | 2024 | 368 | 772 | 43 | 5.57% | 0 / 394 |
| PA | 2025 | 343 | 713 | 0 | 0.00% | 4 / 356 |
Disclaimer/Publisher’s Note: The statements, opinions and data contained in all publications are solely those of the individual author(s) and contributor(s) and not of MDPI and/or the editor(s). MDPI and/or the editor(s) disclaim responsibility for any injury to people or property resulting from any ideas, methods, instructions or products referred to in the content. |
© 2026 by the author. Licensee MDPI, Basel, Switzerland. This article is an open access article distributed under the terms and conditions of the Creative Commons Attribution (CC BY) license.
Copyright: This open access article is published under a Creative Commons CC BY 4.0 license, which permit the free download, distribution, and reuse, provided that the author and preprint are cited in any reuse.