
Submitted:
28 October 2026
Posted:
29 October 2026
You are already at the latest version
Abstract
Low-precision rollouts can reduce the cost of reinforcement learning for large language models, but numerical discrepancies between the sampler and learner can compromise policy optimization. Even with synchronized parameters and identical token histories, the two execution paths may assign different token probabilities, altering gradient estimation and update decisions. This survey examines how training–rollout mismatch arises, propagates through policy optimization, and evolves over training. We develop a component-level taxonomy that organizes existing approaches by intervention target into two complementary families: numerical design, which aligns execution across learner and sampler paths or preserves numerical fidelity and update visibility; and learning under residual mismatch, which corrects gradient estimation or controls policy updates. We compare the mechanisms, information requirements, and residual errors of these interventions to explain their limitations and how they can be combined. We further synthesize measurement practices and experimental evidence across precision regimes, architectures, and training configurations, examining how numerical discrepancies affect optimization stability, policy improvement, and computational cost. We clarify how differences in policy pairs, metric definitions, and training horizons shape the interpretation of reported results. Open challenges include predicting harmful mismatch, reducing mitigation overhead, sustaining policy improvement over longer training, and comparing methods at matched quality or end-to-end cost.
Keywords:
quantized rollout
; low-precision reinforcement learning
; training–inference mismatch
; importance sampling
; quantization-aware training
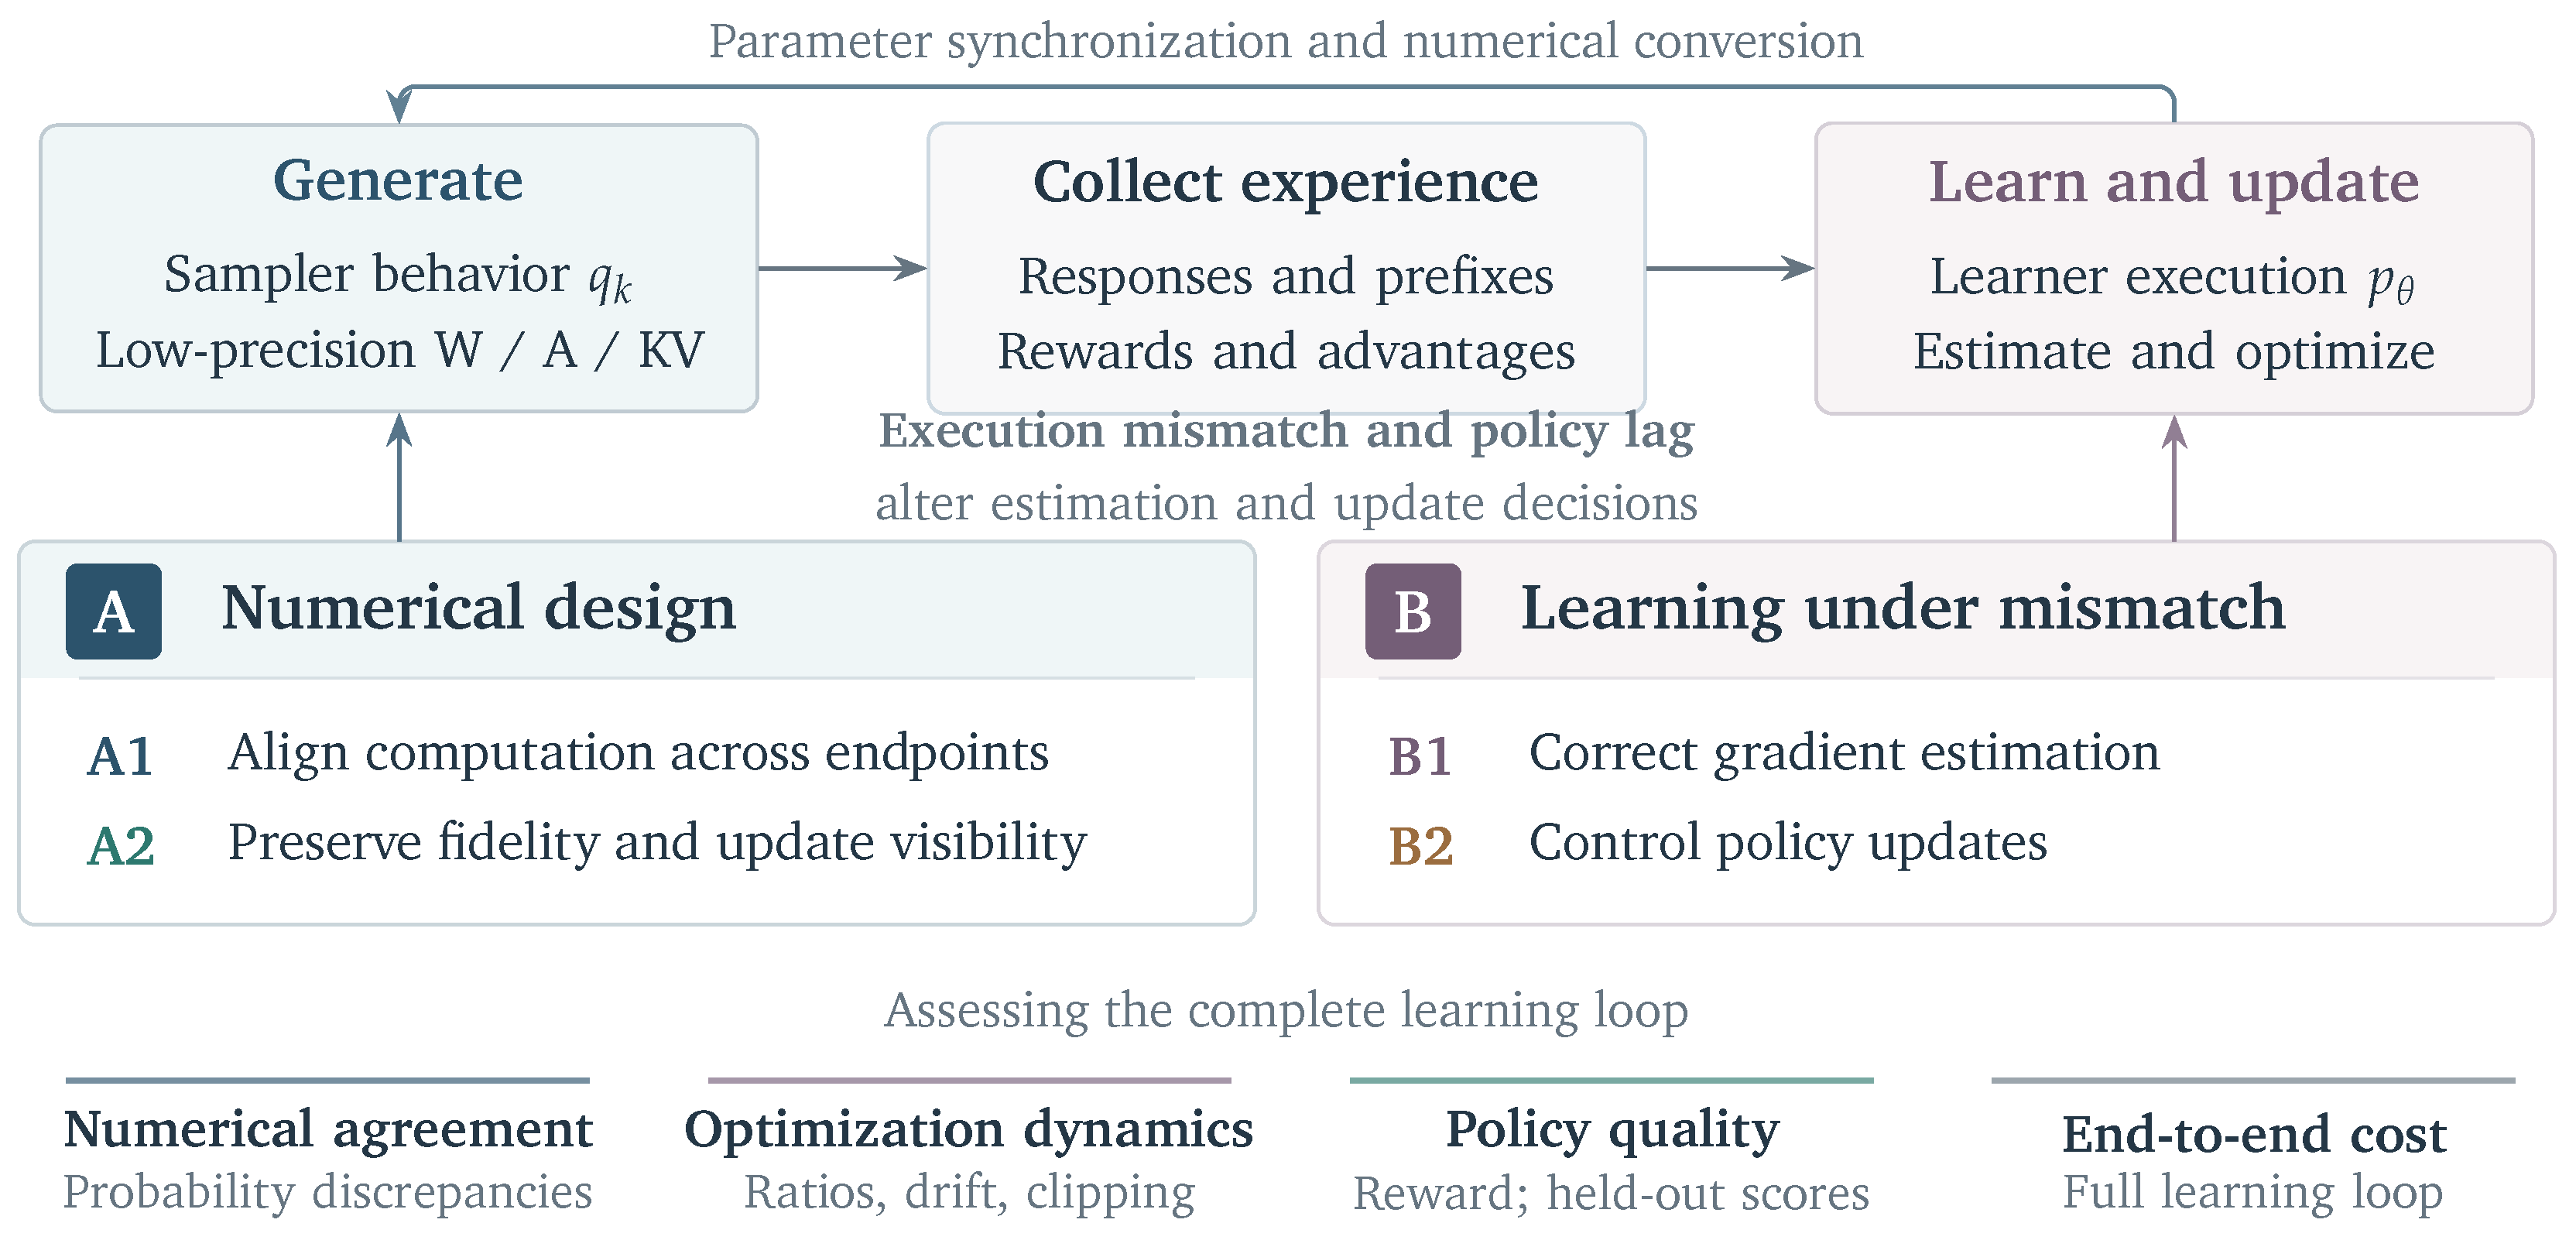
Figure 1.
Survey overview: A changes numerical computation; B corrects estimation or controls updates. W, A, and KV denote weights, activations, and key–value cache.
Figure 1.
Survey overview: A changes numerical computation; B corrects estimation or controls updates. W, A, and KV denote weights, activations, and key–value cache.
Reading pathways
| Foundations | Methods | Evidence |
| Policy roles, execution mismatch, and its effects on learning. | Numerical interfaces, estimator correction, and update control. | Within-study findings, system costs, and open problems. |
| Section 2 and Section 3 | Section 4 and Section 5 | Section 6 and Section 7 |
Appendix A: surveyed papers·Appendix B and Appendix C: sources and assumptions·Appendix D: terminology
Appendix E: mismatch measurements across core studies
1. Introduction and Scope
1.1. Why Low-Precision Rollouts Complicate Policy Optimization
Response generation can account for a substantial share of language-model RL cost, particularly with long rollouts. Low precision can reduce computation and memory costs [4,12], but discrepancies between rollout and learner execution can compromise the policy updates that use this experience.
The sampler generates responses, and the learner recomputes token probabilities for updates. Even with synchronized parameters, differences in kernels, numerical representations, routing, or cached states can yield unequal probabilities for the same token and history [1,12]. Quantization can enlarge this training–inference mismatch (TIM), changing both the sampled experience and its influence through importance weights and clipping. Each update then changes the policy, its numerical behavior, and the histories sampled next.
Recent methods intervene at different points in this loop. Jet-RL coordinates precision across execution paths, FlashRL reweights behavior samples, and TRIAGE controls contributions using mismatch direction [1,3,12]. Their mechanisms differ in whether they change the computations that generate probabilities or the learning rules applied to sampled experience. This distinction also determines how they can be combined and which errors remain.
Figure 2 traces representative developments in rollout correction, quantization-assisted exploration, FP8 execution, FP4 alignment, and cache-aware mitigation.
We organize these studies by intervention target. Numerical design (A) acts on the computations that produce mismatch through alignment or fidelity control. Learning under residual mismatch (B) acts on its effects through estimator correction or update control (Figure 4). Papers can contribute to both families; Appendix A maps their components.
1.2. Scope and Related Work
The survey examines quantized rollouts with higher-precision learners or low precision in both learner and sampler. Weight, activation, and key–value (KV) cache quantization affect different numerical interfaces; parameter staleness can compound their mismatch.
Direct low-precision methods and systems form the core, supported by estimation theory and general training–inference mismatch studies. A study can serve several roles: MiniRL develops the formulation and evaluates FP8 rollout [14]. Quantization-assisted exploration provides a boundary case. Appendix B details source selection and versions.
Broader surveys cover low-precision training and reasoning-model RL [33,35]. Other rollout surveys organize pipelines by lifecycle [34] or efficiency mechanisms and bottlenecks [36]. Here, numerical execution links alignment, correction, and cache design through their effects on estimation and policy updates [3,6,10,12,17].
1.3. Perspective and Contributions
Distinguishing learner, behavior, proximal, and reference policies separates execution discrepancy from lag and clarifies correction ratios and update constraints.
The taxonomy separates computation alignment, fidelity and update visibility, gradient estimation, and update control. Precision, W/A/KV target, architecture, and collection protocol define settings; granularity and information requirements distinguish components within each class.
The evidence synthesis compares measurement practices, policy quality, and total cost, identifying gaps in long-horizon stability and quality–cost evaluation.
2. Background and Problem Formulation
2.1. Learner, Behavior, Proximal, and Reference Policies
Let x be a prompt, a response, and its prefix. A policy depends on both parameters and numerical execution. Write for the current learner and for the same computation at sampling snapshot .
The behavior policy samples tokens through the rollout engine and its numerical and decoding rules, including temperature and vocabulary truncation. Raw-model log-probabilities need not describe this sampling distribution.
The proximal policy anchors the PPO and GRPO update ratio, commonly using a frozen pre-update learner [30,31]. A separate fixed checkpoint can supply the regularization reference . Mismatch-aware formulations distinguish the proximal policy from behavior [1,14].
A running GRPO update.
For one prompt, the sampler generates G responses with rewards . In RL with verifiable rewards, a correctness checker can replace a learned reward model. A common group-relative advantage is , where and are the group reward mean and standard deviation, and stabilizes normalization. Binary rewards give advantages approximately . The advantage remains fixed during optimization and is usually shared by valid tokens of a response; some variants omit standard-deviation normalization [31].
At the learning stage, a representative clipped objective on this fixed group is
Here counts valid response tokens, , sets the clipping interval, and controls optional reference regularization. The conditional KL is ; implementations can use sampled estimators. Maximizing the surrogate encourages positive-advantage actions and discourages negative-advantage actions. Clipping limits incentives for large changes relative to the proximal policy; reference KL provides a separate anchor.
Weights are synchronized and converted for the next rollout. Matched execution and decoding can give ; quantization can break this equality before any update. At , the proximal ratio is one, but can differ from one. Behavior correction and the update ratio therefore have separate roles (Section 5.1): numerical design changes computation, estimator correction adjusts gradient estimation, and update control constrains learning.
MIPU targets improvement in the inference policy obtained after conversion and synchronization, since it supplies the next experience [23].

Table 1.
Policies and quantities used throughout the survey. Execution paths are part of policy identity.
Table 1.
Policies and quantities used throughout the survey. Execution paths are part of policy identity.
| Symbol | Meaning |
|---|---|
| Current learner policy under its specified execution path. | |
| Learner-side policy evaluated at sampling snapshot . | |
| Actual behavior policy that sampled the token. | |
| Policy used to define the proximal update ratio. | |
| Policy used for KL regularization; not the behavior denominator. | |
| Same-snapshot log-probability difference, . | |
| Current learner–behavior gap, . | |
| Advantage or other policy-gradient learning signal. | |
| Score vector, . | |
| Behavior-to-proximal correction and its truncated or masked form. | |
| Proximal update ratio, . | |
| Complete-response likelihood ratio, . | |
| Valid-token count and stop-gradient operator in Equation (10). |
2.2. Execution Mismatch Versus Policy Staleness
At a fixed prefix and token with positive relevant probabilities,
The first factor captures parameter change since collection, including asynchronous lag; no independence assumption is required. The second compares execution at the sampling snapshot, isolating numerical differences under matched decoding and including decoding effects otherwise. Implementations need not retain . Under partial rollout, can vary across tokens. Retained KV entries encode earlier computations, so abbreviates behavior dependent on the parameter versions and numerical paths that produced this state.
Figure 3 separates these snapshot comparisons from the two policy roles used by the loss. A proximal anchor and a KL reference can be chosen independently of the actual sampler.
At the sampling snapshot, the first factor is one despite possible execution mismatch. Matched execution and decoding set the second factor to one without removing lag. Numerical alignment and staleness correction address these distinct factors.
Importance sampling requires positive behavior probability wherever the target has support. Vocabulary truncation can violate this condition despite a defined denominator for every observed token. At fixed h,
holds under support and integrability assumptions. It corrects the action distribution at a fixed prefix while leaving the distribution over prefixes unchanged.
2.3. A Component-Level Taxonomy of Interventions
Components are classified by their intervention target: the computation or learning rule they change. Mismatch sources explain why probabilities differ; experimental settings specify precision, adaptation, and collection. Neither determines the method class.
A: numerical design changes the computations that produce mismatch. A1 aligns learner and sampler paths; A2 preserves fidelity or parameter-update visibility after quantization. Either can act on the learner, sampler, or both. B: learning under residual mismatch changes how collected samples influence learning. B1 corrects gradient estimation; B2 constrains, selects, or accepts updates. These interventions can preserve learning without reducing the policy gap (Table 2).
Figure 4.
Component taxonomy of the focal studies. Papers can occupy several primary classes through distinct components. Scheduling, supporting connections, and the QeRL exploration boundary are shown separately. Numerical regimes are independent comparison axes; Appendix A maps the discussions.
Figure 4.
Component taxonomy of the focal studies. Papers can occupy several primary classes through distinct components. Scheduling, supporting connections, and the QeRL exploration boundary are shown separately. Numerical regimes are independent comparison axes; Appendix A maps the discussions.
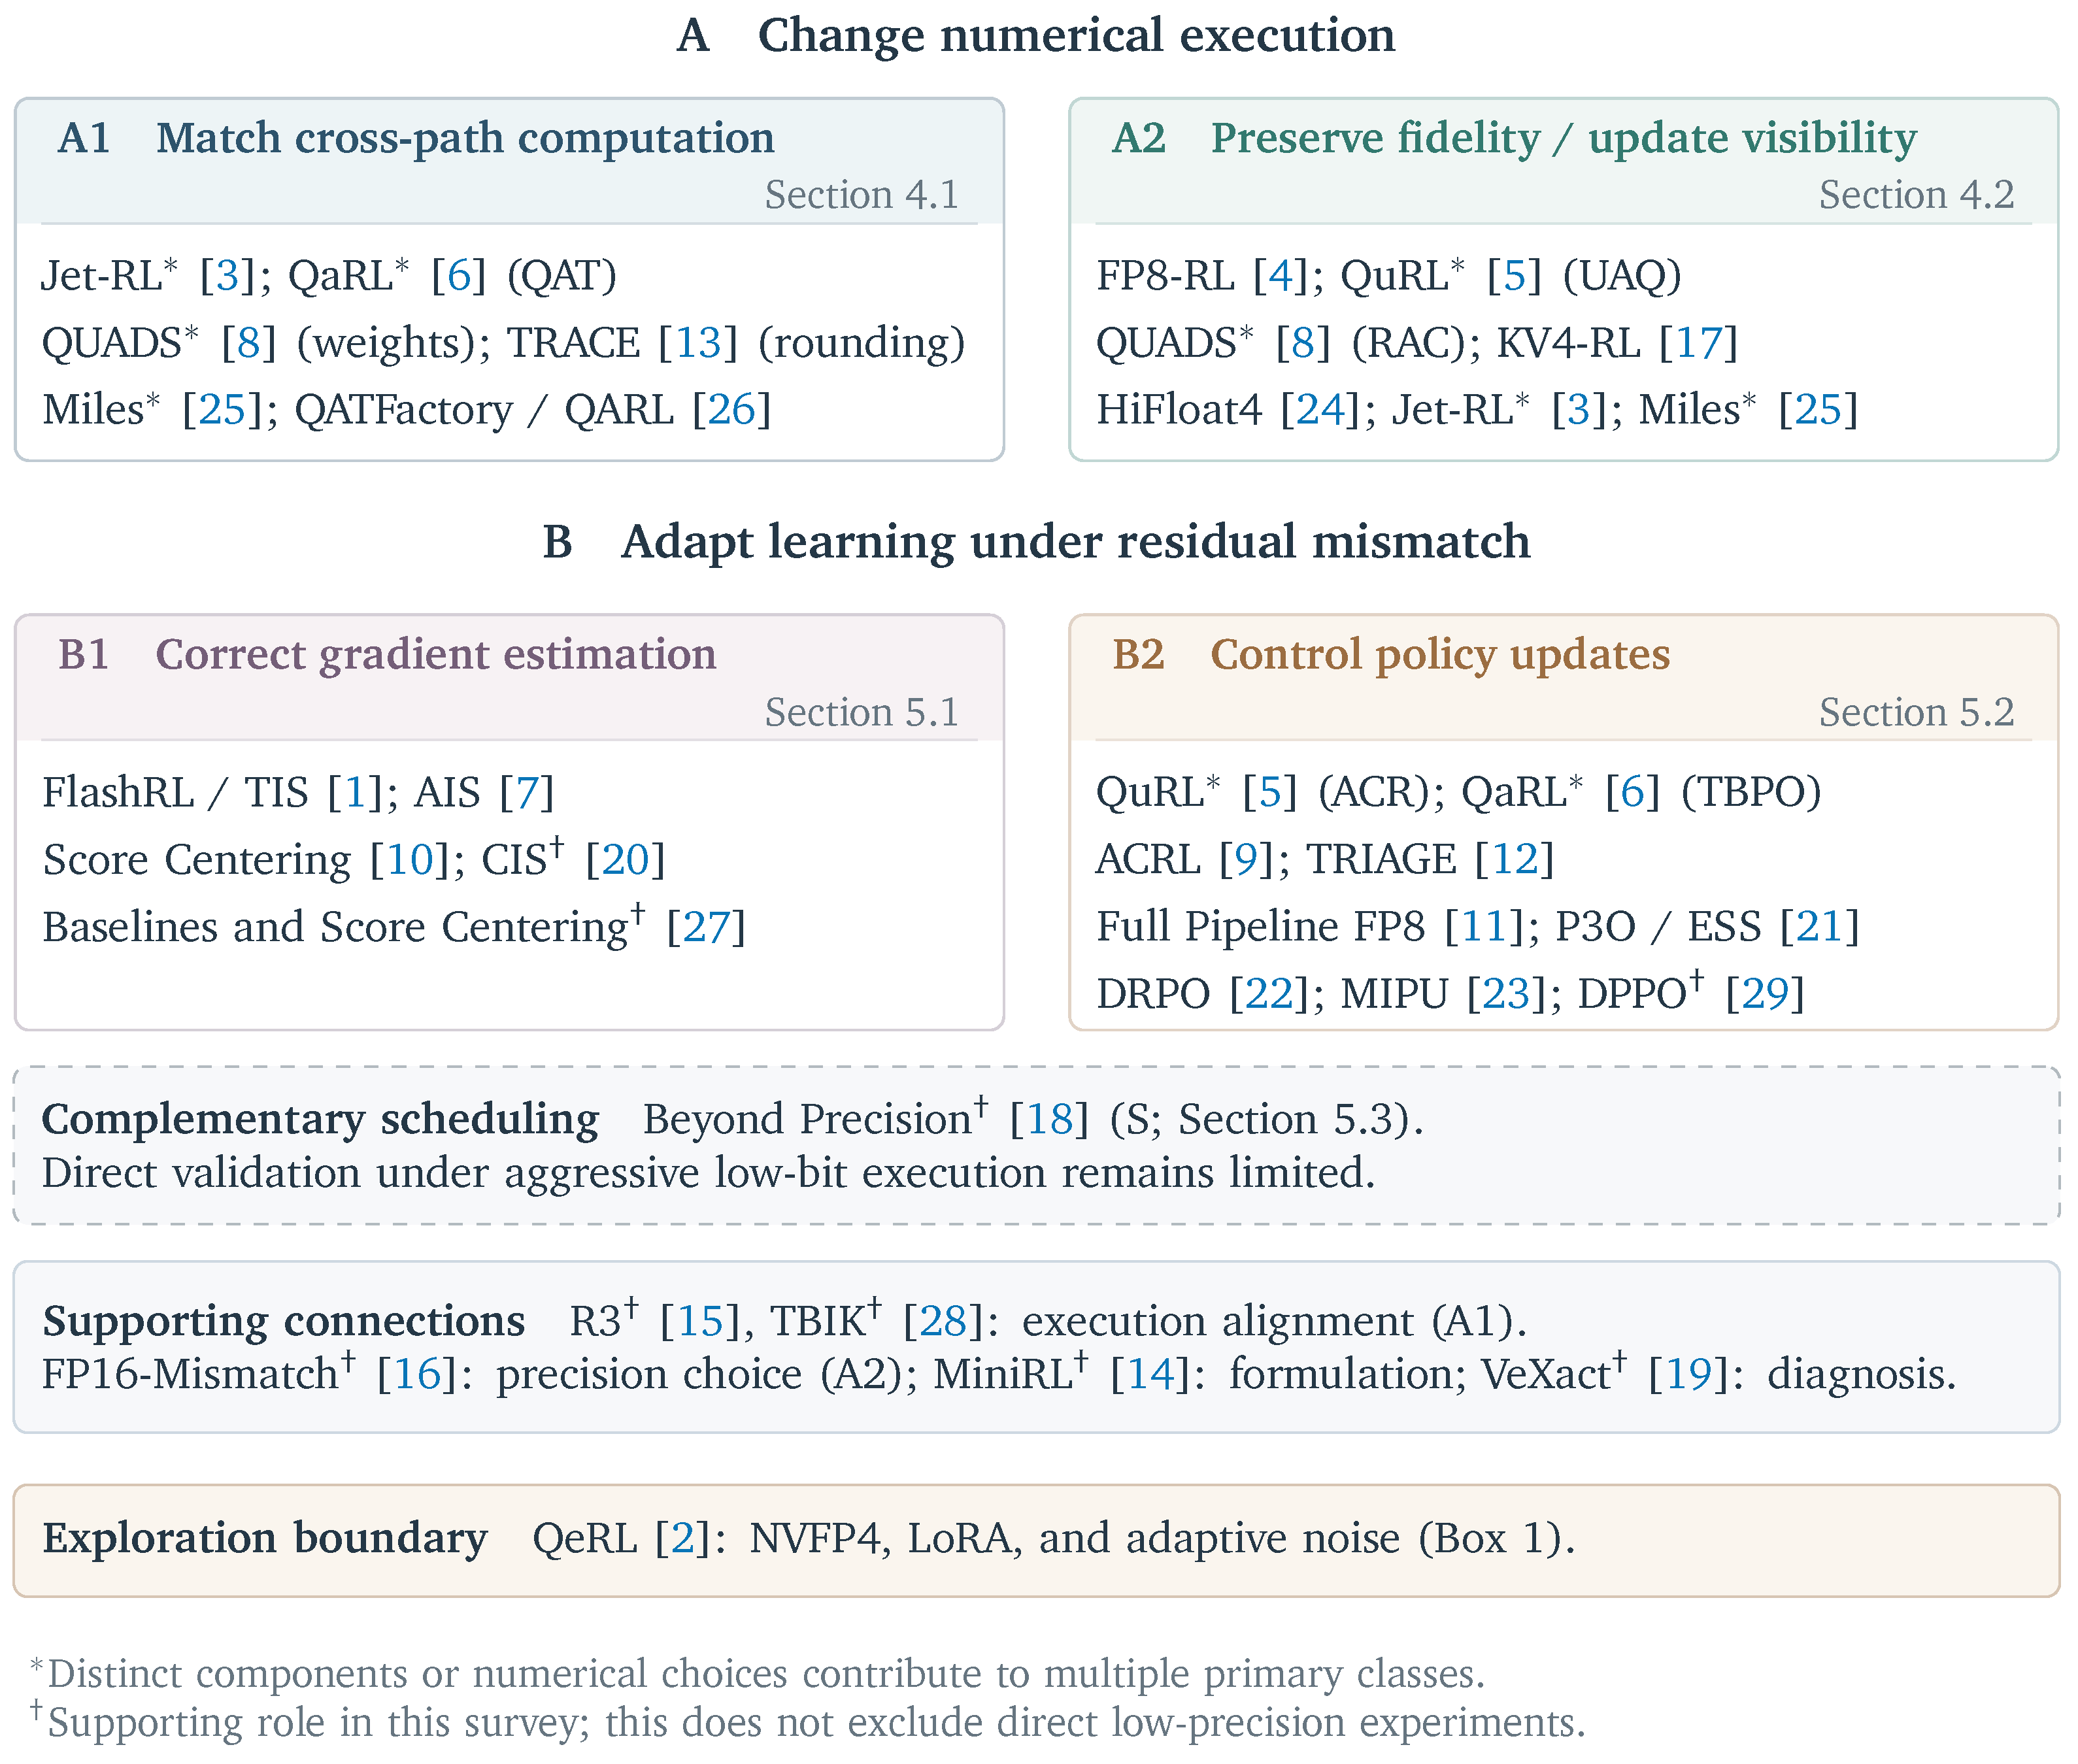
Classification follows purpose rather than loss form. B1 corrects a specified expectation or gradient; B2 constrains, selects, or accepts updates. Both can weight a loss, and truncation can bias a B1 estimator. DPPO and DRPO change trust-region geometry (B2), while Score Centering corrects a conditional score expectation (B1) [10,22,29].
QaRL combines aligned QAT (A1) with TBPO (B2); QuRL combines update-aware quantization (A2) with adaptive clipping (B2); QUADS combines weight alignment (A1) with activation compensation (A2) [5,6,8]. Adopted corrections such as TIS are separate from these contributions. Scheduling complements both families (S; Section 5.3).
2.4. Numerical Regimes and Contribution Roles
Quantization maps values to a discrete set through a format, scale, and rounding rule. Weight quantization changes parameters shared within a sampling version; activation quantization acts on values recomputed each forward pass; KV quantization changes attention state retained across tokens. Their errors therefore arise at different stages and persist for different durations.
Post-training quantization converts a learned model without adaptation through the target quantizer; quantization-aware training (QAT) models quantization during learning. Fake quantization quantizes and dequantizes operands while matrix multiplication can remain at higher precision. A straight-through estimator supplies surrogate rounding derivatives, as in QUADS [8]. Native kernels perform low-precision arithmetic directly. QAT specifies adaptation, separately from execution speed and backward, master-weight, and optimizer precision.
QuRL adapts to quantized rollout without an explicit learner-side QAT path: the sampler is repeatedly quantized while a higher-precision learner trains on its experience [5]. Low-rank or full-parameter updates, native or simulated arithmetic, architecture, and collection protocol specify the setting independently of the intervention target.
3. How Execution Mismatch Affects Learning
3.1. Sources and Propagation of Execution Discrepancy
Scales, rounding, accumulation, kernels, batch shape, and cached state can alter probabilities at the same nominal precision. FP16-based analysis examines precision selection [16]; R3 isolates routing differences that can occur without quantization [15].
Reduction order can change even when precision is fixed. TBIK coordinates reduction trees across tensor-parallel sizes, providing a matched-execution reference [28]. Under low precision, HiFloat4’s ablations link degraded learning to outlier-driven underflow in rollout activations [24].
Shared-prefix probes fix histories; free-running comparisons also capture trajectory changes.
Quantization can hide an update within one cell or amplify a small change across a boundary. QuRL seeks to make updates visible to the sampler; TRACE reduces inconsistent rounding [5,13]. Both effects depend on the values’ positions relative to quantization boundaries.
Backward arithmetic can change updates despite forward agreement. Jet-RL specifies backward precision; Miles offers a dequantized backward path to protect gradients [3,25]. Both policy gaps and derivative computation therefore matter to low-precision failures.
Figure 5 shows how discrepancy changes sample influence, induces score drift, and alters update selection. An aggregate gap does not distinguish these mechanisms.
3.2. Distorted Estimation and Update Decisions
Discrepancy affects relative sample influence, conditional score drift, and update decisions, depending on the policy, learning signal, and objective.
Relative influence.
Writing gives : the same absolute perturbation has greater relative influence when q is small. Tail and confidence-conditioned statistics expose structure hidden by a mean absolute error; CIS uses confidence in its correction [20].
DPPO distinguishes relative ratios from moved probability mass [29]. A large ratio on a rare token can move little mass, while a moderate ratio on a common token can move much more. Ratio magnitude alone does not specify an appropriate update constraint.
Conditional score drift.
Estimation can also acquire a systematic drift. For a normalized differentiable learner distribution, . Under behavior sampling, the corresponding expectation need not vanish. At fixed h,
At a fixed prefix, the expectations include the sampled action and any random continuation used to form A. Centering advantages within a prompt group need not center their conditional mean at each prefix. Score Centering removes this first-moment term without changing behavior [10]. The covariance remains under q, and prefix-distribution error is uncorrected.
Update decisions.
Mismatch can change which branch of a clipped surrogate is active and remove a token’s gradient contribution. The full-pipeline FP8 study identifies excessive clipping of negative-advantage tokens [11]. This decision error is distinct from high variance in an importance weight.
Away from the boundaries, the clipped surrogate with fixed A and satisfies
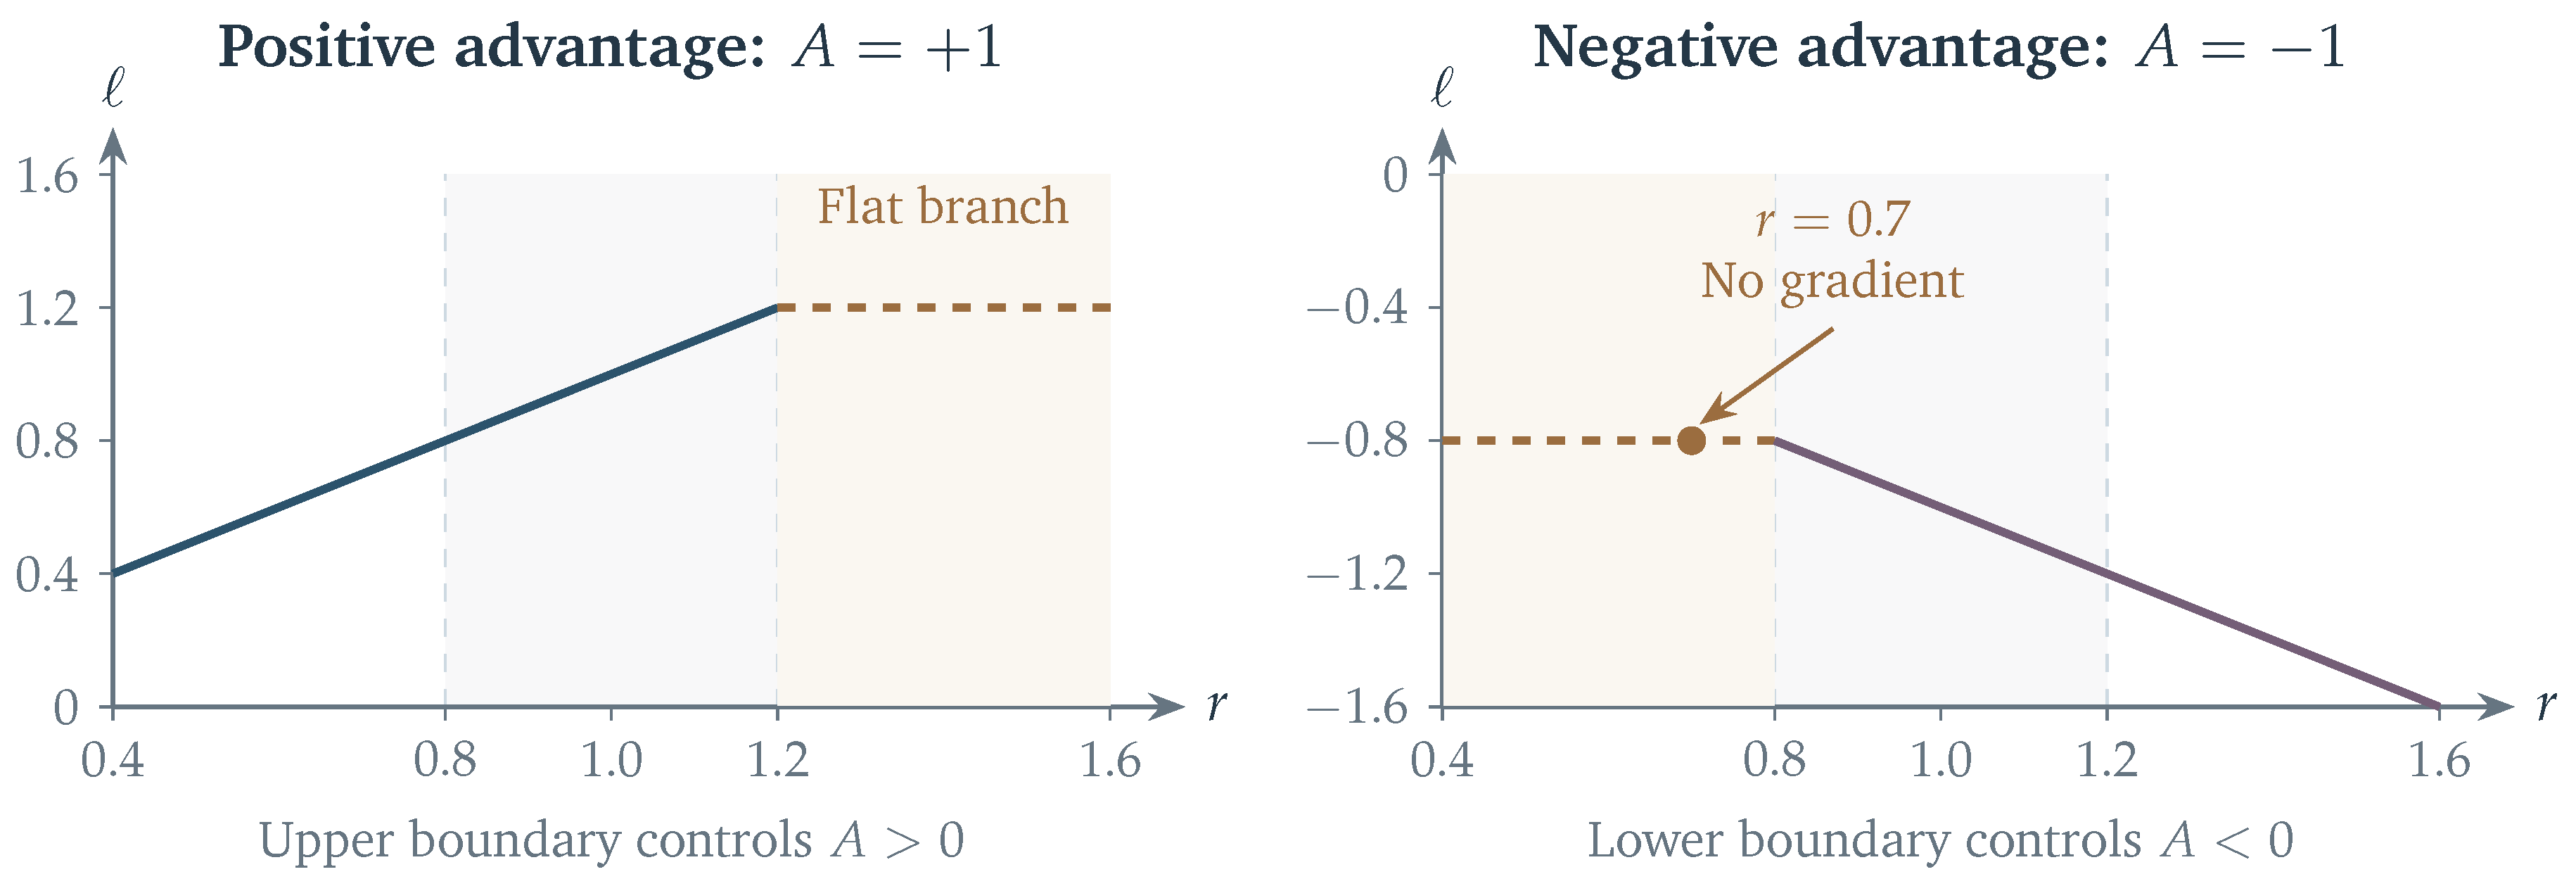
The active branch depends on the advantage sign and the ratio being clipped. Clipping the combined learner–behavior ratio suppresses a negative-advantage token at when , even at the sampling snapshot. Section 5.1 separates this combined ratio from a decoupled surrogate; Figure 13 in Appendix F illustrates the branches.
3.3. Feedback Across Optimization Steps
Updates move values relative to quantization boundaries, changing scales and sampler update visibility [4,5]. The changed sampler visits different histories, altering rewards, group advantages, and subsequent data [10]. Fixed-batch probes characterize local effects without following the feedback through subsequent sampling and optimization.
The direction of an update matters as well as the gap’s magnitude. Locally, reducing a learner probability already below the behavior probability can enlarge the log gap. ACRL and TRIAGE use directional information to control updates [9,12]. In a shared-parameter network, one token’s gradient also changes other probabilities, so this local sign argument alone cannot guarantee stability.
Beyond Precision responds to this feedback with response-length-triggered learning-rate decay [18]. Its effectiveness under aggressive FP4 execution remains to be established.
3.4. Diagnosing and Measuring Mismatch
Mismatch diagnostics address computational disagreement, estimator reliability, update decisions, and learning outcomes (Table 3). Their interpretation depends on the policy pair, conditioning, and aggregation; Appendix E records these choices across the core studies.
Policy comparison and conditioning.
A controlled numerical probe fixes parameters and prefixes to compare execution paths; an online diagnostic compares the current learner with recorded behavior and can include policy lag (Equation (2)). Figure 6 contrasts them. Raw, decoded, and recomputed probabilities remain distinct; VeXact supplies a matched-execution reference [19].
KV4-RL computes full-vocabulary at identical BF16-generated prefixes from the same checkpoint, before temperature or truncation [17]. The probe isolates conditional KV distortion and excludes trajectory selection. Conditioning also differs within TRIAGE: its 30B characterization replays sampled MoE routes, whereas its 4B run measures the ordinary learner–sampler gap. Their raw magnitudes are therefore not directly comparable [12].
Probability gaps and KL answer different questions.
For a specified pair of normalized conditional policies , let on sampled actions . Common summaries include
Here N counts valid measured tokens, and discards sign. Under common support and finite expectations, both KL estimators target conditional averaged over observed prefixes. Finite-sample can be negative; every summand is nonnegative. Neither estimate should be conflated with reverse-direction , full-vocabulary evaluation, or KL to a regularization reference.
TRIAGE and AIS report mean absolute log gaps; TRACE reports maxima and minima; QUADS tracks a maximum gap; QuRL reports behavior-to-proximal KL and a maximum ratio; MIPU uses sampled-token K3 [5,7,8,12,13,23]. Extremes can expose errors hidden by a mean, but also depend on population size and composition. Their magnitudes are comparable only under matched definitions, populations, and reductions.
Estimator and update diagnostics.
Normalized empirical effective sample size (ESS) summarizes weight concentration:
P3O computes ESS from raw current-to-behavior ratios; AIS uses truncated weights [7,21]. The values can therefore differ on identical data. Uniform nonzero weights give normalized ESS one regardless of their common value, so high ESS establishes neither calibration nor gradient fidelity. Score Centering addresses the conditional score mean instead (Section 5.1) [10].
The full-pipeline FP8 study uses BF16 shadow passes to identify tokens whose active clipping branch changes under FP8, separating the two advantage signs [11]. This counterfactual over-clipping is not an ordinary clipping fraction. TRIAGE measures directional mass and local concentration from signed gaps, then tests the indicator against realized updates [12]. These diagnostics assess how discrepancy changes an update; legitimate learning can still increase disagreement.
Measurement population and aggregation.
Token and response averages weight data differently; masking can lower a gap by selection, and capping can raise ESS by removing its tail. Appendix E details the corresponding populations, reductions, and probability conventions.
Training duration and delayed instability.
Longer training tests persistence across updates; longer responses test trajectory length. Late-stage and best-checkpoint measurements need optimizer steps, rollout and learner tokens, and elapsed cost as context. Paired probes isolate execution error from lag; online diagnostics and held-out quality assess learning.
Time to failure requires a defined event and persistence window, such as sustained quality loss supported by update diagnostics. Independent runs measure variation in onset; failure-free runs establish only an observation limit. Retained contributions distinguish learning from suppression.
The distinction between execution error and policy movement determines how an online gap is interpreted. Its evolution can reflect both numerical disagreement and the intended departure of the learner from the collection policy.
|
Box 1. Quantization and exploration QeRL combines low-precision execution, low-rank adaptation, and adaptive quantization noise, making exploration an explicit part of the training design [2]. It occupies a boundary of this survey: the numerical perturbation changes the search process as well as agreement between computations. The reported benefit concerns structured quantization noise under low-rank adaptation and depends on the induced sampling distribution and the learner’s adaptation capacity. |
4. Numerical Design and Execution Alignment
Numerical design acts on the learner, sampler, or their interface. Alignment brings corresponding computations closer; fidelity control limits information loss under low precision. Two approximate paths can agree without either approaching a higher-precision reference.
4.1. Aligning Learner and Rollout Computation
Alignment couples operator precision, quantized representations, or realized rounding outcomes. The coupled object determines the required coordination and residual discrepancy.
Jet-RL shares precision and quantization granularity across training and rollout [3]. Linear-layer GEMMs use FP8 inputs in forward and backward passes, with BF16 inter-operator gradients.
QaRL combines rollout-aligned learner QAT (A1) with TBPO (B2) [6]. QAT matches the quantized representation; TBPO controls sequence-level updates on problematic low-bit responses.
QUADS distinguishes synchronized weights from activations recomputed from inputs that can differ across engines [8]. Nearby activations can map to different codewords even under the same quantizer. It fake-quantizes learner weights, retains BF16 learner activations, and compensates selected rollout activation errors. Its asymmetric-versus-symmetric ablation shows that quantizing the same operands on both sides need not improve agreement. Section 4.2 examines the compensation.
Representation alignment leaves rounding dependent on each path’s inputs. TRACE couples realized rounding decisions [13]: with exact guidance and fixed rollout scales, it chooses the learner value’s neighboring codeword nearest the rollout codeword. Figure 7 shows how this can reduce cross-path discrepancy while slightly increasing learner quantization error.
TRACE approximates this reference by caching one low code bit and scales from the latter half of the layers by default, paired by trajectory, token position, and quantization site. Reconstruction uses the learner sign and the E2M1 magnitude nearest the scale-normalized learner activation among those consistent with the retained bits. Adjacent learner candidates are compared with this reference. The record narrows a local choice rather than recovering arbitrary rollout values independently, relying on paired activations remaining locally adjacent.
TRACE’s main rollout quantizes expert W/A and softmax-layer KV to NVFP4, retaining BF16 elsewhere. The learner uses guided fake quantization at matching sites, with BF16 matrix multiplication, attention, and backward computation. Routing replay and token-level correction address residual differences; unpaired sites and policy lag remain sources of error [13].
Alignment must survive conversion and synchronization. Miles coordinates checkpoint conversion, learner forward, rollout kernels, and live export through shared quantization rules; its MXFP8 and NVFP4 recipes include precision exceptions and are designated Beta [25]. QATFactory’s QARL uses BF16 quantization simulation in training, native NVFP4 rollout, and low-bit weight export [26].
4.2. Controlling Quantization Error and Preserving Parameter Updates
A2 preserves information within a numerical path by retaining activation or state fidelity and making parameter changes visible after quantization.
Preserving update visibility.
Cross-path agreement and update visibility are separate numerical objectives (Figure 7 and Figure 8). Alignment alone does not ensure that the sampler can express the changes made by training. For an illustrative deterministic quantizer Q, an update can satisfy
even when . Visibility depends on update magnitude, distance to a quantization boundary, and scale behavior. QuRL’s Update-Aware Quantization applies one-time invariant rescaling before RL [5]. The identity preserves the initial real-valued layer output while changing the magnitudes seen by quantization and optimization. Rescaling seeks to improve update size relative to quantization noise, but also changes gradients and potentially later optimization. UAQ targets sampler update visibility; ACR controls learner clipping (Section 5.2).
Figure 8 shows a smaller update crossing a boundary while a larger one stays within its cell. Changing the scale moves these boundaries.
Preserving activation and state fidelity.
QUADS complements learner-side weight alignment with Residual Activation Compensation, restoring selected high-error channels around native W4A4 rollout computation [8]. Compensation changes the sampler’s activation approximation.
HiFloat4 / Rollout-ResQ corrects rollout activation underflow with sparse residuals [24]. Its learner–sampler precision comparisons isolate an error that raising learner precision alone does not resolve. These FP4 experiments simulate the arithmetic and do not measure native-FP4 acceleration.
FP8-RL maintains numerical fidelity as the policy changes through blockwise W8A8 rollout, scale recalibration for FP8 attention and KV execution, and dynamic weight synchronization [4]. It integrates these components with adopted TIS/MIS correction. Its v2 experiments also explore end-to-end FP8, so learner precision varies across the paper’s experimental settings.
Miles retains selected tensors in BF16 and offers an optional dequantized backward path that trades training throughput for gradient stability without changing the quantized forward values [25]. These choices specify the fidelity of its forward and derivative computations separately.
KV4-RL uses INT4 KV with bounded INT8 protection for attention-sink and recent positions [17]. TIS remains fixed across cache-precision comparisons, isolating the benefit of changing the sampler computation. In colocated, quota-based partial collection, generation and optimization alternate; responses can span collection boundaries.
4.3. Residual Mismatch and Limits of Alignment
Alignment compares learner and sampler computation at a specified interface, snapshot, and history. Fidelity measures approximation to a higher-precision reference. Shared quantizers can still disagree because their inputs or surrounding kernels differ.
A numerically faithful sampler can still lag behind the learner. Agreement at observed prefixes also leaves differences in how often those prefixes are reached. Learning-side correction and control address the resulting effects on estimation and updates.
5. Learning Under Residual Mismatch
Learning-side methods act on collected experience: B1 corrects gradient estimation, while B2 controls how samples influence policy updates. Their information requirements and effects on bias, variance, and update selection distinguish the mechanisms within each family.
5.1. Correcting Gradient Estimation
Multiplicative correction and truncation.
Equation (3) gives the conditional change of measure. A decoupled surrogate separates behavior correction from the proximal update ratio. For a frozen proximal policy and recorded behavior q, define
A representative decoupled surrogate is
where is a possibly truncated correction, advantages remain fixed, N counts valid tokens, and sg stops gradients through the correction weight. Before truncation and clipping, . Bounding limits behavior correction; clipping limits incentives for change from the proximal policy. Upper truncation uses ; masking discards selected ratios. Response averaging and length normalization change relative weights and therefore the estimator.
FlashRL uses actual rollout probabilities for truncated importance sampling (TIS) [1]. MiniRL distinguishes behavior and proximal policies [14]. FP8-RL adopts token-level TIS and masked importance sampling (MIS), while KV4-RL retains TIS alongside cache protection [4,17]. Truncation bounds influence but introduces bias.
Adapting the amount and location of correction.
Adaptive importance sampling (AIS) adjusts correction to its necessity and reliability [7]. Its multiplier is : gives the uncorrected estimator, and gives truncated weight . A mean absolute log gap measures the need for correction; capped-weight ESS and advantage-weight variance amplification assess reliability. AIS can reduce correction under large mismatch when weights are concentrated or noisy.
Calibrated importance sampling (CIS) adjusts the truncation cap according to confidence. It represents cross-engine perturbation as a log-odds displacement, which can produce very different ratios for low- and high-probability actions [20]. Thus, AIS adapts the mixture strength, whereas CIS adapts the cap. CIS evaluates BF16 cross-engine mismatch; transfer to FP4 remains untested.
Additive score correction.
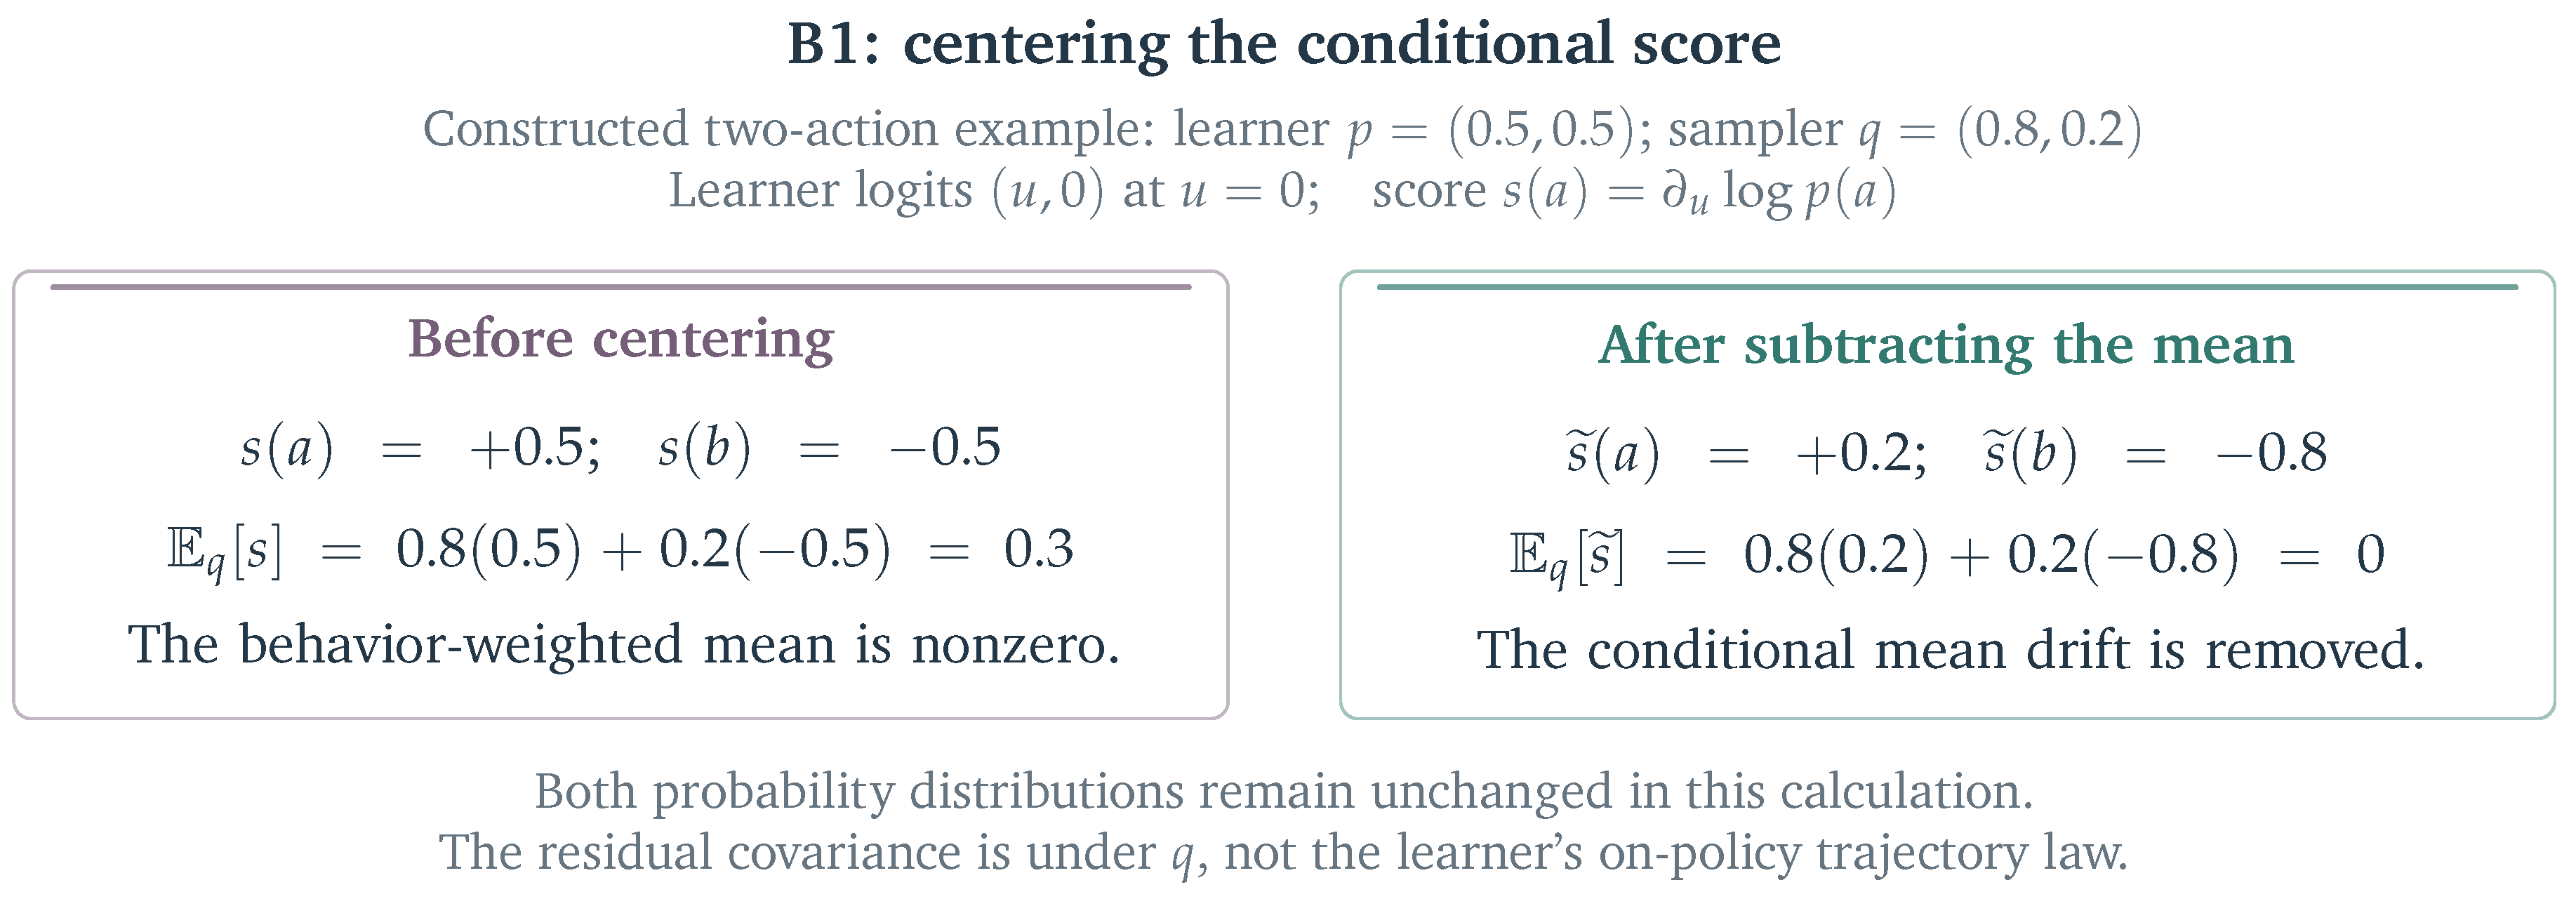
Score Centering corrects the score vector , rather than a reward or sampled-token importance weight [10]. Its mean is zero under the learner distribution but can be nonzero under behavior sampling, producing the extra term in Equation (4). Prompt-group reward centering need not remove this prefix-conditional term.
Score Centering replaces the score at a prefix with
With an exact expectation, the mean under q vanishes and the drift term in Equation (4) is removed [10]. The covariance remains under q, so the result does not recover the full on-policy gradient. The implementation reconstructs behavior using sampler top-k log-probabilities ( by default), modeling the omitted tail with the learner distribution [10]. Correction coefficients are detached; fidelity depends on this reconstruction.
Figure 14 in Appendix F illustrates centering with both policies fixed. Estimator correction can therefore leave numerical disagreement unchanged. Under importance weighting, the center must correspond to the weighted score; applying an unweighted center to an arbitrary weighted loss need not cancel the intended term [10].
Baselines and score centering interact differently at token and sequence level [27]. For the sequence-level regularized importance estimators studied there, the group-mean baseline already supplies the centering benefit. At token level, that baseline generally leaves bias under regularized ratios. Centering must match the estimand, weights, and reduction.
TIS, AIS, and CIS require sampled-action probabilities; Score Centering reconstructs a behavior law. Truncation and masking trade tail control for bias.
5.2. Controlling the Influence of Policy Updates
Update controls differ in their decision rule, control signal, and application unit (Table 5). Signal and application granularity can differ: P3O uses batch statistics and ACRL uses response statistics to guide token contributions [9,21].
Restoring or reshaping update constraints.
QuRL’s Adaptive Clipping Range (ACR) uses proximal and behavior probabilities to reshape a region already distorted at collection [5]. UAQ (Section 4.2) makes the resulting weight changes visible to the quantized sampler. The two components address learning an update and expressing it through quantization.
QaRL’s TBPO constrains whole responses through negative-sample treatment and a sequence-level trust band [6]. Full-pipeline FP8 instead calibrates clipping against BF16: it matches the lower quantile on negative-advantage tokens, then adjusts the upper boundary to rebalance signed contributions [11]. Periodic reference passes amortize calibration of the update boundary.
Clipping statistics require the advantage sign, reduction, and comparison policy to be specified. An aggregate fraction cannot reveal which useful contributions a boundary removes.
Adapting control to batch reliability.
P3O uses normalized effective sample size (ESS) of the batch’s policy ratios to adapt a score-weight cap and off-policy regularization [21]. Its FP8-rollout experiment studies numerical mismatch directly, while broader comparisons show dependence on the model and collection setting. AIS adapts an estimator mixture; P3O adjusts update constraints.
Choosing the constraint geometry.
Directional control.
ACRL steers disagreement through advantage-guided token reweighting controlled by response-level discrepancy from a reference [9].
TRIAGE combines advantage sign with the learner–sampler log gap [12]. In our notation, identifies the sign of a simplified token’s own mismatch-energy contribution, where . Cross-token coupling and optimizer history can alter the realized motion. Both and are locally amplifying; TRIAGE selectively gates the latter because increasing a reward-positive response’s probability can be useful even when its gap grows.
The gate first diagnoses 64-position segments of negative-advantage responses from their mean gap and deep negative tail. Within an eligible risky segment, only negative-gap tokens receive an attenuated raw weight . The weighted response loss is normalized by the sum of its weights. Relative to ordinary response averaging, its effective multiplier is therefore , not simply . Normalization reallocates contributions: for illustrative raw weights , the effective multipliers are approximately . If every weight is equal, the normalization cancels it. This controls relative influence, not the total gradient norm.
Repair targets positive-advantage responses with sufficiently negative mean gaps in 128-position segments. A one-sided pseudo-Huber penalty raises learner log probabilities. Its derivative bounds the additive coefficient, not the full gradient or every token’s gap. All valid tokens in an active segment share that coefficient, including positive-gap tokens. Gating and repair thus address different signed contributions [12]. The tested recipe uses native W4A4 forward on both endpoints and BF16 KV. Applying it to KV4 remains an untested transfer.
Accepting whole updates in the inference policy.
MIPU constructs candidates relative to the sampler and assesses each after synchronization and numerical conversion [23]. Its inference-gap proxy supports acceptance or rollback in the evaluated FP8 runs; a general monotonic-improvement guarantee requires stronger conditions.
Token and segment rules localize effects; batch aggregation pools evidence; whole-policy acceptance assesses the synchronized result. Granularity thus trades localization against statistical reliability, while clipping and regularization determine enforcement.
5.3. Adapting the Optimization Schedule
Beyond Precision adapts learning rates to evolving optimization and mismatch [18], complementing numerical alignment and sample-level control. Direct aggressive-quantization evidence remains limited. Reduced update sizes can delay divergence and learning alike.
5.4. Compatibility, Bias, and Failure Modes
Complementary methods address different residual errors. Weight alignment can leave activation error, while a more faithful sampler can still generate off-policy data. QaRL, QuRL, and QUADS test combinations addressing such residual effects [5,6,8].
Estimator compatibility depends on weighting, centering, masking, and reduction. Token- and sequence-level regularized estimators can require different centers [27]. Figure 9 distinguishes this estimation target from the contributions selected by update control.
6. Evidence Synthesis and System Trade-Offs
Published comparisons relate numerical agreement, policy quality, and cost within specific execution settings, evaluators, and training budgets.
6.1. Experimental Regimes
A higher-precision learner and quantized sampler differ in representation; quantizing both sides can still leave different kernels, activations, and updates. KV quantization changes retained state, while W/A quantization changes other computations. Low-rank and full-parameter adaptation also differ in their capacity to absorb these errors.
AIS evaluates diffusion-based LLaDA alongside autoregressive Qwen models [7]. The Qwen experiments follow the token-level formulation used here; the denoising results require likelihoods defined for their generation process.
KV4-RL evaluates learned parameters through a common BF16 path [17]; TRACE evaluates the FP4 policy [13]. The same checkpoint can therefore receive different quality assessments.
Routing, cache costs, and version mixing under partial collection affect mismatch and cost.
6.2. Findings on Stability and Learning Quality
Component comparisons connect changes in numerical execution or gradient estimation to learning outcomes. Figure 10 maps the TRACE and TRIAGE baselines; Table 9 compares their findings with Score Centering and KV4-RL. Appendix E details the corresponding measurements.
Numerical agreement and learning quality.
Policy entropy, mean reward, and probability gaps summarize the token distribution, sampled performance, and learner–sampler disagreement (Table 8). Their interpretation depends on the policy pairs and reductions in Section 3.4.
TIS prevents aggregate-gap divergence in TRIAGE’s 30B experiment but trails the full method in late reward and downstream scores [12]. The full method adds direction-dependent gating and repair, whose effects extend beyond aggregate gap control.
Persistence over training.
As the policy and numerical state evolve, early stabilization can give way to renewed disagreement or quality loss. QuRL’s disagreement after initial stability motivates joint attention to clipping and update visibility [5]. Adaptive correction, directional control, and centering address different feedback mechanisms [7,9,10]; P3O’s Qwen3-8B FP8 experiment shows preserved later performance over its evaluated horizon [21].
Learning effects depend on update decisions.
The full-pipeline FP8 study links excessive lower-side clipping of negative-advantage tokens to pathological training dynamics; TRIAGE selects interventions using local, directional information [11,12]. DRPO preserves corrective gradients outside its trust region; MIPU assesses a whole candidate after conversion to the inference policy [22,23]. These controls act at different locations and stages, which aggregate clipping fractions or mean gaps cannot distinguish. TRIAGE’s routing-conditioned MoE analysis also finds that a population-level directional trend need not predict every token’s motion. Checkpoint selection further affects the comparison: the full-pipeline FP8 study chooses its main GRPO endpoints by best average performance over 500 steps [11], whereas TRIAGE uses the final scheduled step for stable arms. Similar endpoint scores can summarize different learning trajectories.
Table 9.
Within-study evidence with mechanistic interpretations. The controlled setting, checkpoint rule, and evaluation protocol bound each conclusion.
Table 9.
Within-study evidence with mechanistic interpretations. The controlled setting, checkpoint rule, and evaluation protocol bound each conclusion.
| Study | Controlled comparison | Reported result | Evidence and scope |
|---|---|---|---|
| TRACE [13] 35B MoE | Joint NVFP4 W/A/KV rollout; TIS+SC uses cap 2 and top-128 reconstruction. | Four-task mean: TRACE 75.3, TIS+SC 74.1, BF16 74.9. | Recipe comparison in the joint W/A/KV regime. SC uses its best mean checkpoint through 400 steps; task-wise gains are mixed and aggregate uncertainty is unreported. |
| TRIAGE [12] 30B MoE | BF16, native NVFP4, TIS, and full gating/repair recipe. Stable arms use step 1700. | Five-task mean: TRIAGE 70.96, TIS 63.18, BF16 72.41. | Stabilization comparison beyond TIS in native W4A4. SC/TIS+SC, TRACE, and KV4 are outside this comparison. |
| Score Centering [10] 30B MoE | Correction rules share the objective; quantization and lag are tested separately. | With FP4 KV, SC and TIS remain stable; stronger INT8/INT4 stress separates them further. | Correction-rule comparison under a shared objective. Curves report training accuracy; shared-objective controls do not reproduce every baseline recipe. |
| KV4-RL [17] 8B dense | Cache precision varies with TIS retained; all learned policies are evaluated in BF16. | At 400 updates, six-task mean: 52.8 versus BF16’s 52.4; cumulative full-iteration speedup 1.27×. | Cache-precision control with TIS retained. Common BF16 evaluation assesses learned parameters; evaluation-seed variation differs from training-run variation. |
Residual errors motivate component combinations.
Ablations identify which residual error makes a second component useful. QUADS separates weight alignment from activation compensation, QuRL combines update visibility with clipping control, and KV4-RL changes cache fidelity while retaining TIS [5,8,17]. These results support the tested combinations; extending them requires identifying the residual error in the new setting.
6.3. Efficiency Gains and Implementation Costs
Under serialized execution, total iteration time is
with synchronization and quantization/calibration accounted for separately. Accelerating one phase increases the relative cost of the others. Overlapped execution instead depends on the critical path, for which the additive model in Equation (12) does not apply.
For fixed workload and remaining phases, rollout fraction f, rollout speedup s, and added work give (Figure 11). Overlap, response-length changes, or altered concurrency require a different model.
Mitigation adds scale estimation and conversion in FP8-RL [4], learner passes for reference calibration, storage and transport for guided rounding, and computation in selectively protected regions. Table 10 connects these costs to information requirements.
Information requirements constrain practical scope. P3O needs batch ratio statistics; MIPU adds candidate assessment and possible rollback [21,23]; Miles and QATFactory require coordinated conversion and inference-ready weight transfer [25,26]. TBIK’s reduction coordination can cost kernel performance [28]. Rollout-ResQ targets efficient sparse correction, but its simulations do not establish native-FP4 speedup [24].
The useful quantization target depends on the workload as well as the format. QUADS targets native W4A4 expert computation, whereas KV4-RL studies how sustained concurrency and long contexts increase the value of reducing KV processing [8,17]. Their settings motivate different numerical targets; a bit-width comparison alone does not identify the dominant cost.
Response length and memory-dependent concurrency also change total work. PagedAttention illustrates how cache management and scheduling improve serving efficiency [32].
KV4-RL reports cumulative rollout speedup and cumulative full-iteration speedup over BF16 rollout across 400 Qwen3-8B-Base iterations [17]. The difference reflects the cost of the remaining phases. Its common-BF16 evaluation separately compares learned-policy quality, with both results tied to the evaluated collection workload.
Three complementary comparisons relate quality to cost [17,36]: quality at a fixed budget, cost to a target quality, and extended-budget trajectories. Comparisons specify the evaluator, include extra passes and response-length changes, and account for failures to reach the target. Under overlap, guidance traffic can also affect the critical path.
6.4. Evidence Limits and Coverage Gaps
Controlled execution settings provide the clearest mechanism evidence. Mathematical reasoning dominates the collection; interactive tasks and hardware transfer have fewer controlled comparisons. Native arithmetic, simulation, and BF16 computation on quantized operands must be distinguished.
Comparisons depend on horizon, budget, checkpoint selection, and uncertainty units (Section 3.4). Best-checkpoint scores can hide later loss. Repeated decoding measures evaluation variation; independent RL runs measure training variation. Smoothing estimates neither.
Separate W4A4 and KV4 studies do not establish their joint behavior; asynchronous demonstrations do not isolate every precision–lag interaction. Scheduling needs direct low-bit validation, while diffusion needs generation-specific likelihoods before the autoregressive analysis can transfer.
These differences in execution and evaluation limit cross-study comparisons. A controlled comparison can isolate an intervention’s effect by matching the numerical setting, base objective, and resource budget, then measuring the resulting policy quality and additional cost.
7. Open Problems
Sustained learning, mitigation costs, method composition, and transfer remain open problems.
7.1. Predicting Harmful Mismatch and Sustaining Learning
Predictive diagnostics should detect lost learning before held-out quality deteriorates. Ratio tails, conditional score drift, clipping errors, and segment concentration provide mechanism-specific signals. Useful diagnostics must distinguish harmful mismatch from ordinary policy movement and changes caused by sample selection. Paired probes isolate execution, fixed-batch audits isolate update effects, and continued training tests the timing and severity of deterioration.
Extended runs distinguish continued improvement, delayed deterioration, and stagnation as policies and numerical states evolve. Recalibration, guidance allocation, and update control trade persistent gains against adaptation cost.
ACRL identifies a specific durability question: its reference discrepancy is fixed at initialization, and substantially longer training may require a moving baseline [9]. Score Centering notes that its severe-mismatch, short-sequence experiments proxy longer training under milder mismatch [10]. Whether these stress tests predict long-run failures remains unresolved.
7.2. Composing Numerical and Learning Interventions
Weight alignment can leave activation error; estimator correction may reduce the need to suppress updates. Score Centering leaves a behavior-weighted reward–score covariance, motivating importance weighting under severe staleness [10]. Guided rounding with centering and cache protection with directional control remain untested (Table 6). Precision, guidance, and correction can share a budget, with ablations distinguishing error reduction, retained contributions, cost, and retuning.
7.3. Reducing Information and Control Costs
TRACE records low code bits and scales for selected layers [13]. Compression or selection by layer, token, or training phase could retain alignment benefits with lower acquisition, storage, transfer, reconstruction, and synchronization costs.
TRIAGE combines segment tests, token gates, normalization, and repair. Adapting control to mismatch magnitude, locality, and persistence [12] could retain gains with less tuning and overhead.
7.4. Modeling Stateful and Asynchronous Behavior
TRIAGE leaves asynchronous validation open; KV4-RL identifies disaggregated systems, other attention architectures, and multi-turn workloads as extensions [12,17]. These settings add dependencies on parameter versions, cache history, and external state.
Responses can cross synchronization boundaries, while retained KV entries encode earlier computations. Correction and controlled comparison therefore need sufficient token, version, and cache provenance (Equation (2)) without retaining the full execution history.
Early perturbations change later prefixes beyond conditional token correction. Precision allocation should therefore follow learning benefit across layers, positions, and training phases. Multi-turn workloads extend this dependence to tool observations and state transitions.
7.5. Generalization and Quality–Cost Evaluation
Transfer depends on the availability of behavior information and numerical interfaces. AIS leaves quantization-driven exploration open [7], where exploration, smoothing, and weighting require separate ablations. Component comparisons can share execution settings and objectives; complete-system comparisons retain each method’s essential design under matched resources. Quality at a fixed budget and cost to a target quality capture the resulting trade-offs (Section 6).
8. Conclusion
Low-precision RL couples rollout computation, gradient estimation, and policy updates. Separating computation alignment, fidelity and update visibility, gradient correction, and update control explains both combined methods and their residual errors.
Assessing an intervention requires linking its effects on estimation and updates to policy quality and total cost. Lower-cost mitigation, reliable long-horizon diagnostics, and comparisons across matched execution settings remain central research directions.
Declaration of AI-Assisted Language Editing
AI-assisted tools were used for language polishing during the preparation of this manuscript. The authors are responsible for the final content.
Conflicts of Interest
The authors declare no conflicts of interest.
A. Surveyed Papers and Section Mapping
Table 11 maps the twenty-nine focal studies to regimes, components, and discussion locations. Years mark first public appearance; bibliography entries may cite later publications. Parentheses give additional discussion locations. Appendix B defines contribution roles.
Table 11.
Surveyed papers: numerical regimes, method components, and section mapping. Conference and preprint versions count as one contribution.
Table 11.
Surveyed papers: numerical regimes, method components, and section mapping. Conference and preprint versions count as one contribution.
| Work / first year | Numerical regime | Component(s) and contribution | Discussion |
| Core method and system studies (19) | |||
| FlashRL / TIS [1] 2025 | Higher-precision learner; quantized rollout | B1: Recorded behavior probabilities and truncated correction. | 5.1 (1.1; 2.1) |
| Jet-RL [3] 2026 | Unified FP8 learner and rollout paths | A1; A2: Unified FP8 precision flow. | 4.1 (6.2) |
| FP8-RL [4] 2026 | W8A8 rollout; FP8 attention / KV; FP8 learner explored in v2 | A2; system: W8A8 rollout, FP8 attention/KV, and stack integration. | 4.2 (5.1; 6.2; 6.3) |
| QuRL [5] 2026 | INT8 / FP8 rollout | B2; A2: Adaptive clipping and update-aware quantization. | 5.2 (3.1; 4.2; 5.4; 6.2) |
| QaRL [6] 2026 | Quantized MoE rollout; aligned learner QAT | A1; B2: Rollout-aligned QAT and trust-band updates. | 4.1 (5.2; 5.4; 6.2; 7.3) |
| P3O / ESS [21] 2026 | BF16 learner / FP8 rollout; dense reasoning models | B2: Batch-adaptive ESS cap and regularization. | 5.2 (6.2; 6.3) |
| AIS [7] 2026 | BF16 learner / FP8 rollout; autoregressive and diffusion models | B1: Adaptive importance-weighted estimator mixture. | 5.1 (6.1; 6.2; 7.5) |
| DRPO [22] 2026 | BF16, FP8 rollout-only, and FP8 end-to-end MoE settings | B2: Smooth corrective divergence regularization. | 5.2 (6.2) |
| MIPU [23] 2026 | BF16 learner / FP8 rollout; Qwen3-1.7B and 4B | B2; formulation: Inference-policy candidate construction and acceptance. | 5.2 (2.1; 6.2; 6.3; 7.3) |
| QUADS [8] 2026 | NVFP4 MoE rollout; learner weight QAT | A1; A2: NVFP4 MoE weight alignment and activation compensation. | 4.1 (4.2; 5.4; 6.2) |
| ACRL [9] 2026 | FP8 rollout; discrepancy-dependent updates | B2: Discrepancy-dependent update control. | 5.2 (3.3; 6.2; 7.1) |
| HiFloat4 / Rollout-ResQ [24] 2026 | Simulated end-to-end HiF4 / MXFP4; rollout residual correction | A2: Sparse residual correction for FP4 rollout activations. | 4.2 (3.1; 6.2; 6.3) |
| Miles v0.1 [25] 2026 | FP8 / MXFP8 / NVFP4 RL recipes; precision exceptions | A1; A2; system: Shared quantization, synchronization, and precision contracts. | 4.1 (4.2; 6.1; 6.3) |
| Score Centering [10] 2026 | BF16 learner; FP4/INT4 KV stress and separate lag tests | B1: Additive behavior-weighted score correction. | 5.1 (2.2; 3.2; 5.4; 6.2; 7.1; 7.2) |
| Full Pipeline FP8 RL [11] 2026 | FP8 learner and rollout; calibration against BF16 | B2; system: FP8 learner/rollout and calibrated clipping. | 5.2 (3.2; 6.2; 6.3) |
| QATFactory / QARL [26] 2026 | Native NVFP4 rollout; simulated-quantization BF16 training | A1; system: Deployment-aligned QARL and inference-ready weight synchronization. | 4.1 (6.2; 6.3) |
| TRIAGE [12] 2026 | Native W4A4 forward; documented BF16 KV; synchronous RL | B2: Direction-aware control for native NVFP4. | 5.2 (3.3; 6.2; 7.3; 7.4) |
| TRACE [13] 2026 | NVFP4 expert W4A4 + softmax KV4; guided QAT, BF16 backward | A1: Rollout-guided FP4 rounding for MoE. | 4.1 (3.1; 6.2; 7.3) |
| KV4-RL [17] 2026 | BF16 learner; INT4 KV with bounded INT8 protection | A2; system: INT4 KV with selective INT8 protection. | 4.2 (5.1; 6.2; 6.3; 7.4) |
| Supporting formulation, theory, and general TIM studies (9) | |||
| R3 [15] 2025 | MoE routing; general execution mismatch | Support; A1: MoE routing alignment. | 3.1 (4.1) |
| FP16-Mismatch [16] 2025 | BF16 / FP16 numerical comparison | Support; A2: BF16/FP16 precision-selection evidence. | 3.1 |
| TBIK / Deterministic Inference [28] 2025 | BF16 / FP32; matched reduction order across TP sizes | Support; A1: Cross-TP deterministic kernels as an alignment reference. | 3.1 (4.1; 6.3) |
| MiniRL [14] 2025 | Hybrid-engine RL; includes FP8-rollout experiments | Support; B1/B2: Policy roles and mismatch-aware formulation; FP8 experiments. | 2.1 (1.2; 5.1) |
| Beyond Precision [18] 2026 | General TIM; optimization scheduling | Support; S: Optimization schedule under general TIM. | 5.3 (3.3) |
| DPPO [29] 2026 | General LLM trust-region and cross-engine mismatch evidence | Support; B2: Divergence-based trust regions under general TIM. | 5.2 (3.2) |
| VeXact / Diagnosing TIM [19] 2026 | Matched-execution diagnostic reference | Diagnostic: Zero-mismatch diagnostic reference. | 3.4 |
| CIS [20] 2026 | BF16 cross-engine mismatch | Support; B1: Confidence-dependent correction under BF16 cross-engine mismatch. | 5.1 (3.2) |
| Baselines and Score Centering [27] 2026 | Sequence- and token-level regularized importance sampling | Support; B1: Granularity-dependent roles of baselines and score centering. | 5.1 (5.4) |
| Exploration boundary case (1) | |||
| QeRL [2] 2025 | NVFP4 with LoRA and adaptive noise | Boundary: NVFP4 with LoRA and adaptive noise; exploration setting. | Box 1 |
B. Source Selection and Version Handling
Literature identification.
Targeted searches for quantized rollout, low-precision RL, and training–inference mismatch are followed by primary-text review and backward citation tracing. Inclusion follows relevance to the learner–sampler interface; classification follows intervention target.
Inclusion and exclusion.
Focal studies contribute a low-precision RL intervention, an explanatory mechanism, or quantization-assisted exploration. General quantization and RL supply background. Low-precision pretraining, unrelated generation modalities, and alternative rollout acceleration are excluded unless they directly explain the learner–sampler interface.
Versions and names.
The companion catalog identifies source versions and locations, distinguishing first appearance, venue, and reviewed revision. QeRL, QuRL, and QaRL use formal publication records; aliases and publication versions count once.
Attribution of evidence.
Method claims and experimental observations cite primary sources. Likelihood, drift, and clipping identities explain mechanisms under stated assumptions. Figures and tables synthesize the literature; constructed examples are distinguished from published measurements. The companion evidence collection links observations to sources.
Contribution roles and empirical scope.
Core, supporting, and boundary roles describe relevance to the review, independently of experimental quality. Results are taken from cited studies without independent reproduction. Training-run replication, negative findings, and cross-hardware reproduction were not systematically extracted.
Table 12 summarizes the reviewed settings and contribution roles.
Table 12.
Coverage across independent setting axes. Joint regimes require direct evaluation.
| Dimension | Represented in the focal collection | Boundary of the synthesis |
|---|---|---|
| Intervention | A1/A2 numerical design; B1/B2 learning rules; complementary scheduling. | Direct low-bit validation of scheduling remains limited. |
| Numerical interface | Weight/activation quantization, KV storage, scales, rounding, routing, and synchronization. | An interface-level result does not establish full-network agreement. |
| Precision | FP8, FP4/NVFP4, INT8/INT4; BF16/FP16 comparisons provide context. | Format labels omit scale granularity, precision exceptions, and native versus simulated arithmetic. |
| Model and adaptation | Dense and MoE models; low-rank and full-parameter updates appear in different studies. | Architecture and adaptation are separate axes; cross-regime transfer is not assumed. |
| Collection | Snapshot-based hybrid execution, policy lag, and quota-based partial collection. | Stateful provenance and fully overlapped execution require additional behavior and timing semantics. |
| Learning and generation | PPO/GRPO-style autoregressive RL; AIS also studies diffusion generation. | This survey’s likelihood equations are autoregressive; denoising requires its own formulation. |
| Contribution role | Nineteen core studies, nine supporting studies, and one exploration boundary. | Role identifies relevance to the argument, independently of experimental strength. |
C. Evidence, Assumptions, and Transfer
The behavior law depends on parameter versions, numerical execution, decoding, and retained state; learner, proximal, and reference policies serve distinct roles in the loss. Transfer requires reassessing them: conditional correction leaves prefix selection unchanged, truncation adds bias, alignment leaves unmatched operations, and reconstructed expectations remain approximate.
Conditional and complete-response correction.
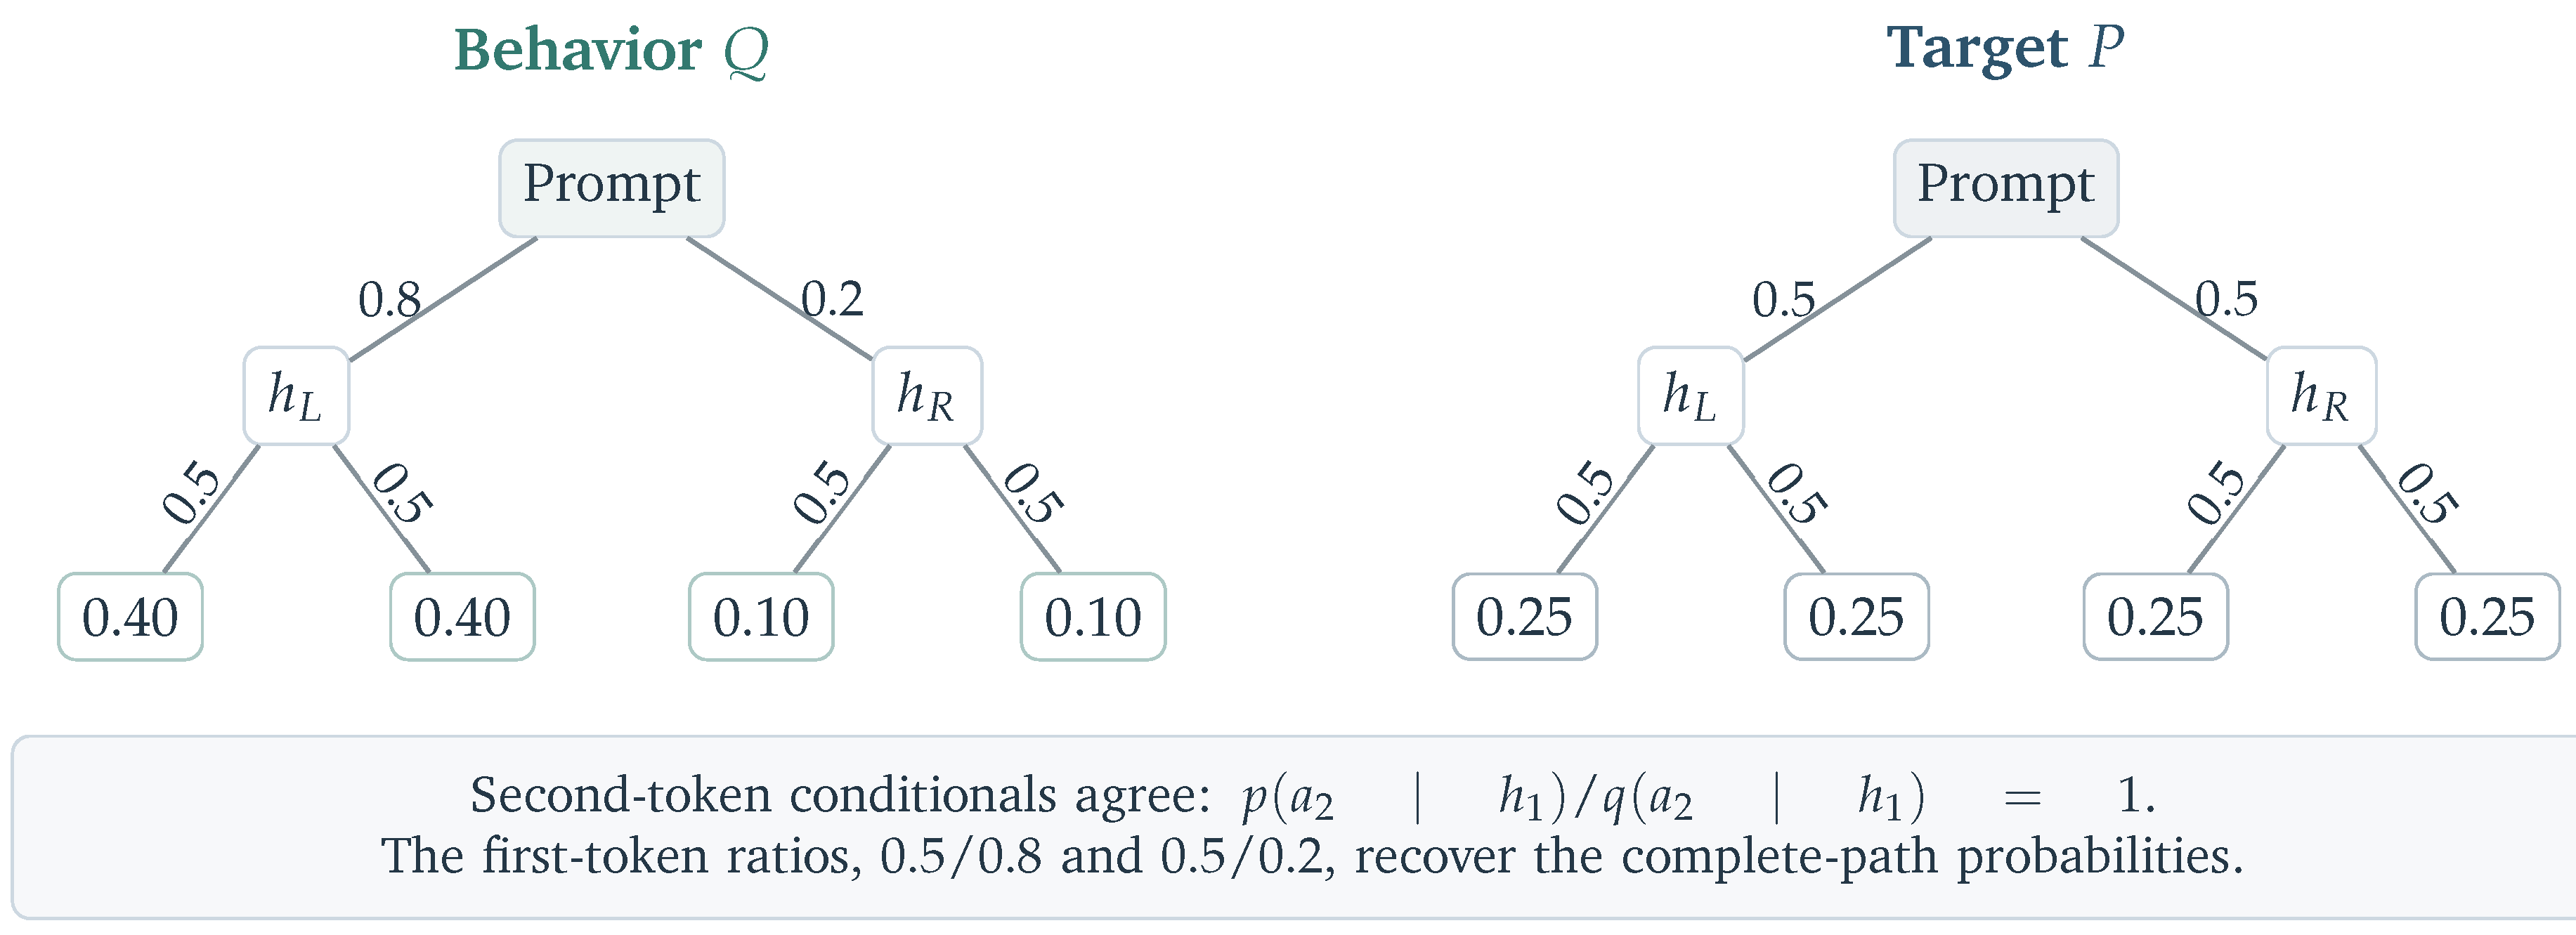
Equation (3) corrects actions at a fixed prefix. A response-level expectation also requires correction of how frequently that prefix is reached.
For comparison, the full-response likelihood ratio is
Here and Q are response laws under a common stopping convention, including end-of-sequence decisions when applicable. Denominator factors must be actual conditional probabilities. Unobserved execution randomness must be marginalized or included through an extended likelihood over the corresponding execution events.
For a fixed behavior law and a parameter-independent reward R, the usual likelihood-ratio identity gives
under support, integrability, and differentiation assumptions. The product illustrates why exact response-level correction can have high variance; multiplying only the current token ratio into an arbitrary sampled advantage is a different estimator. Nor does Equation (14) directly justify reusing group-normalized advantages computed under Q. Score Centering explicitly distinguishes sequence-level importance sampling from practical token-level corrections [10].
Figure 12 illustrates the effect of unequal prefix masses.
Figure 12.
Constructed two-step tree with response probabilities at the leaves. Equal second-token conditionals coexist with unequal prefix masses. Full-response weighting recovers all four target probabilities of .
Figure 12.
Constructed two-step tree with response probabilities at the leaves. Equal second-token conditionals coexist with unequal prefix masses. Full-response weighting recovers all four target probabilities of .
D. Terminology
Table 13.
Terminology and component abbreviations used in the text and figures.
| Term | Meaning |
| TIM | Training–inference mismatch; the survey emphasizes the learner–rollout interface. |
| W / A / KV | Weights, activations, and key–value cache; distinct numerical targets. |
| MoE / LoRA | Mixture-of-experts architecture / low-rank adaptation; architecture and adaptation are separate dimensions. |
| FP8 / FP4 / NVFP4 | Floating-point format families with eight or four bits; NVFP4 is a particular four-bit representation. Scaling, accumulation, and exceptions also determine execution. |
| INT8 / INT4 | Integer quantization at eight or four bits, with scales and execution semantics specified separately. |
| QAT | Quantization-aware training: the learner forward path models a quantized representation; this need not reproduce native kernel arithmetic. |
| TIS / MIS | Truncated / masked importance sampling; bounded or discarded corrections alter the estimator. |
| AIS / CIS | Adaptive / calibrated importance sampling: estimator-mixture adaptation and confidence-dependent truncation, respectively. |
| ACR / UAQ | QuRL’s Adaptive Clipping Range / Update-Aware Quantization; B2 update control and A2 update visibility. |
| TBPO / RAC | QaRL’s Trust-Band Policy Optimization / QUADS’s Residual Activation Compensation; distinct objective and numerical components. |
| PPO / GRPO | Proximal Policy Optimization / Group Relative Policy Optimization. Their loss roles require behavior and proximal policies to be distinguished. |
| ESS / P3O | Effective sample size / Policy-on Policy-off Policy Optimization; batch-ratio reliability controls update influence and regularization. |
| DPPO / DRPO | Divergence Proximal / Divergence Regularized Policy Optimization; divergence-based masking versus smooth corrective regularization. |
| MIPI / MIPU | Monotonic Inference Policy Improvement / Update; inference-policy objective and practical candidate construction/acceptance. |
| Rollout-ResQ | Sparse residual correction of rollout activation quantization; the reviewed HiFloat4 experiments simulate FP4. |
| TBIK | Tree-Based Invariant Kernels; matched reduction order across tensor-parallel sizes. |
| Partial rollout | Collection in which a response can span collection boundaries; it does not by itself imply concurrent generation and optimization. |
| Cache provenance | Parameter versions and numerical execution paths that produced retained cache entries. |
| Behavior / proximal / reference | Actual sampling law / update-ratio anchor / KL-regularization target; see Table 1. |
E. Reported Mismatch Measurements
Table 14 compares policy distances, control signals, numerical probes, and learning outcomes across the core studies, with definitions and comparison conditions. The companion repository provides source locations and further detail.
Table 14.
Selected mismatch measurements and comparison conditions across the nineteen core studies. Source locations refer to the reviewed versions.
Table 14.
Selected mismatch measurements and comparison conditions across the nineteen core studies. Source locations refer to the reviewed versions.
| Study | Reported observable and location | Comparison boundary |
| FlashRL / TIS [1] | Cross-engine KL (Fig. 3); TIS uses sampled-action ratios. | The plotted KL direction and reduction are not specified in the caption. |
| Jet-RL [3] | Length- and task-conditioned learning curves (§ 3.2). | Outcome evidence; these curves do not isolate a numerical policy distance. |
| FP8-RL [4] | Rollout-to-training mismatch KL (§ 2.2.1; Fig. 12). | Direction is explicit; estimator and reduction require further implementation detail. |
| QuRL [5] | Behavior-to-proximal KL; maximum proximal/behavior ratio (Fig. 3). | Average discrepancy and rare large weights are distinct; neither is the reference KL penalty. |
| QaRL [6] | Proximal-ratio and mismatch-weight distributions (Fig. 4); response trust bands. | Keep the two ratios separate; geometric-mean response ratios differ from likelihood products. |
| P3O / ESS [21] | Valid-token normalized ESS, using current/behavior ratios (Eq. 11). | Measures concentration; includes policy change and does not identify numerical error alone. |
| AIS [7] | Mean absolute log gap; capped-weight ESS; advantage-weight variance amplification (§ 3.1). | These govern distinct gates; capped and raw ESS are different observables. |
| DRPO [22] | Sampled-action Binary-TV geometry; learning and entropy trajectories (§ 3; App. D.4). | The constraint is not full-vocabulary TV or, by itself, an isolated TIM measurement. |
| MIPU [23] | Sampled-token mismatch K3; inference-gap proxy and rollback rate (§ 5). | KL estimation and candidate acceptance assess different stages of an update. |
| QUADS [8] | Maximum log gap; layer-wise MoE L2 discrepancy (Figs. 6–7). | Local tensor error and policy-level extremes have different scales and comparison populations. |
| ACRL [9] | Absolute probability gap, response/group averaged relative to baseline X (Eqs. 8–12). | Distinct from log gaps; the baseline-relative controller does not define a universal tolerance. |
| HiFloat4 / Rollout-ResQ [24] | Residual sparsification MSE/RMSE and precision ablations (Fig. 4; § 5). | Tensor reconstruction error should not be relabeled a learner–sampler policy distance. |
| Miles v0.1 [25] | Same-token log-probability checks; reference-run KL; exact-mode zero difference (§ 3.1; § 5.3; Fig. 5). | Different modes use different comparisons; exact sampled-token scores do not establish full-distribution equality. |
| Score Centering [10] | Conditional score-mean analysis; controlled learning curves under noise, quantization, and lag (§§ 3–5). | Distinguish the analytical drift term from logged measurements and deliberately amplified stress. |
| Full Pipeline FP8 RL [11] | Probability/ratio NMAE against BF16 shadows; sign-separated over-clipping (§ 3). | Counterfactual branch errors differ from ordinary clipping rates and fixed-snapshot TIM. |
| QATFactory / QARL [26] | QARL learning curves and exported-policy quality (§ 4.6). | Held-out teacher KL elsewhere in the paper belongs to QAD, not an online RL TIM measurement. |
| TRIAGE [12] | Mean absolute gap, signed tails, directional masses, and localization (§ 3; App. B). | 30B characterization is routing-conditioned; its raw magnitude is not directly comparable with ordinary 4B gaps. |
| TRACE [13] | Log-gap maxima/minima; relative excess train–rollout activation MSE (Figs. 4, 11). | Extremes differ from means; excess MSE uses BF16 cross-path MSE as its denominator. |
| KV4-RL [17] | Shared-prefix full-distribution BF16-to-quantized KL (Eq. 5.2; App. B.5). | Same checkpoint and pre-decoding probabilities isolate conditional KV distortion; trajectory shift remains outside the metric. |
Measurement definitions and reproducibility.
Execution controls, reductions, and uncertainty units determine how measurements are interpreted and reproduced (Table 15).
Table 15.
Execution controls, statistical reductions, and uncertainty units used in mismatch diagnostics.
Table 15.
Execution controls, statistical reductions, and uncertainty units used in mismatch diagnostics.
| Measurement choice | Source practice or example | Required interpretation context |
|---|---|---|
| Execution-only comparison | KV4-RL fixes checkpoint and BF16 prefixes for full-distribution KL [17]. | Prefix source; raw versus decoded probabilities; routes and cache state; KL direction. |
| Update-time comparison | TRIAGE replays an identical batch before/after an update with generation log-probabilities held fixed [12]. | Learner versions; pre/post stage; fixed advantages and masks; route replay. |
| Collection-time record | CIS logs generation scores, start-of-update learner scores and rollout versions [20]. | Decode versus prefill rescoring; version lag; stored numeric precision and sample selection. |
| Batch reliability | P3O aggregates raw-ratio moments; AIS uses truncated weights for its ESS gate [7,21]. | Weight definition, cap, valid-token count, and cross-rank reduction. |
| Decision disagreement | Full-pipeline FP8 compares clipping decisions with BF16 shadow ratios [11]. | Reference path; advantage sign; boundary; ordinary versus counterfactual clipping. |
| Uncertainty and time axis | KV4-RL uses response-cluster bootstrap intervals for its paired fidelity probe [17]. | Independent unit: token, response, evaluation seed, or training run; updates, sampled tokens, or elapsed time. |
Policy pairs and paired execution.
Learner–sampler, current–proximal, and learner–reference KL concern behavior disagreement, policy movement, and regularization. An actor KL label needs its policy pair, direction, and estimator. QATFactory’s teacher–student KL evaluates QAD fidelity, separately from online QARL mismatch [26].
TRIAGE’s directional audit replays identical prefixes before and after an update with generation scores fixed [12]. Isolating numerical execution additionally requires matched sampling-snapshot parameters and specified kernels, routes, and cache state. Otherwise, a current-learner/old-behavior gap combines execution differences and lag.
Measurement population and aggregation.
Token averaging weights responses by length; response averaging gives them equal weight. For lengths 2 and 8 with constant absolute gaps 1 and 0.1, the means are 0.28 and 0.55. Global sums and counts define the token mean; P3O likewise reduces ESS moments across workers [21].
Selection can lower a diagnostic without changing the original batch. Separate statistics for all valid tokens and the intervention-eligible subset reveal this effect, especially when combined with occupancy and coefficient- or advantage-weighted mass. TRIAGE separates marginal statistics, gradient-bearing occupancy, and directional mass [12].
Numerical evaluation.
Stored log-probability precision can impose a measurement floor. Saturation and clamping affect log-odds and binary divergences near probability one, as CIS demonstrates in a masking comparison [20]. Logit comparisons additionally require a shared offset convention, since adding the same constant to every vocabulary logit leaves all token probabilities unchanged.
Linking diagnostics to learning outcomes.
Paired activation error quantifies local alignment, weight moments describe estimator concentration, and sign-conditioned branch disagreement identifies clipping errors. These measurements complement policy-gap summaries; held-out quality and total cost assess the intervention’s benefit and overhead.
F. Illustrative Optimization Examples
Constructed examples illustrate advantage-dependent clipping and conditional score centering.
Figure 13.
Signed clipping in Equation (5), with and . The gray interval is ; amber segments are flat. At , a negative-advantage token contributes no gradient through this objective. Constructed example of the PPO surrogate with the specified ratio [30].
References
- Yao, Feng; Liu, Liyuan; Zhang, Dinghuai; Dong, Chengyu; Shang, Jingbo; Gao, Jianfeng. On the Rollout-Training Mismatch in Modern RL Systems. OPT 2025: Optimization for Machine Learning. 2025. Available online: https://www.opt-ml.org/papers/2025/paper116.pdf.
- Huang, Wei; Ge, Yi; Yang, Shuai; Xiao, Yicheng; Mao, Huizi; Lin, Yujun; Ye, Hanrong; Liu, Sifei; Cheung, Ka Chun; Yin, Hongxu; Lu, Yao; Qi, Xiaojuan; Han, Song; Chen, Yukang. QeRL: Beyond Efficiency - Quantization-enhanced Reinforcement Learning for LLMs. International Conference on Learning Representations, 2026; Available online: https://proceedings.iclr.cc/paper_files/paper/2026/hash/a15a2ece7f0663d1ba7db91103ac61c9-Abstract-Conference.html.
- Xi, Haocheng; Ruan, Charlie; Liao, Peiyuan; Lin, Yujun; Cai, Han; Zhao, Yilong; Yang, Shuo; Keutzer, Kurt; Han, Song; Zhu, Ligeng. Jet-RL: Enabling On-Policy FP8 Reinforcement Learning with Unified Training and Rollout Precision Flow. arXiv. 2026. Available online: https://arxiv.org/abs/2601.14243v2.
- Qiu, Zhaopeng; Yu, Shuang; Zhang, Jingqi; Zhang, Shuai; Huang, Xue; Yang, Jingyi; Lai, Junjie. FP8-RL: A Practical and Stable Low-Precision Stack for LLM Reinforcement Learning. arXiv. 2026. Available online: https://arxiv.org/abs/2601.18150v2.
- Li, Yuhang; Elangovan, Reena; Dong, Xin; Panda, Priyadarshini; Khailany, Brucek. QuRL: Low-Precision Reinforcement Learning for Efficient Reasoning. International Conference on Learning Representations, 2026; Available online: https://proceedings.iclr.cc/paper_files/paper/2026/hash/6b4880ced785077159b340710ceb7681-Abstract-Conference.html.
- Gu, Hao; Wang, Hao; Liu, Jiacheng; Li, Lujun; Zhu, Qiyuan; Liu, Bei; Xu, Binxing; Wang, Lei; Yang, Xintong; Lin, Sida; Han, Sirui; Guo, Yike. QaRL: Rollout-Aligned Quantization-Aware RL for Fast and Stable Training under Training–Inference Mismatch. Findings of the Association for Computational Linguistics: ACL 2026. 2026. Available online: https://aclanthology.org/2026.findings-acl.841/.
- Zhou, Jiajun; Shao, Wei; Zheng, Lingchao; Fan, Yuwei; Wong, Ngai. AIS: Adaptive Importance Sampling for Quantized RL. arXiv. 2026. Available online: https://arxiv.org/abs/2605.13907v1.
- Zhuge, Zhengyang; Yu, Hao; Wang, Xin; Li, Zheng; Cao, Yizhong; Liu, Dayiheng; Zhang, Jianwei. QUADS: Stabilizing NVFP4 Reinforcement Learning for MoE via QUantization-error Alignment across Dual Sides. arXiv. 2026. Available online: https://arxiv.org/abs/2607.15810v1.
- Fan, Wenwu; Lin, Qihong; Xia, Zhijie; Zheng, Zhuo; Wang, Sihao; Chen, Qiang; Zhu, Liangsheng. ACRL: Adaptive Control of Training-Inference Discrepancy for Stable Reinforcement Learning. arXiv. 2026. Available online: https://arxiv.org/abs/2607.24062v1.
- Marek, Martin; Ryabinin, Max. Score Centering Stabilizes Off-policy Reinforcement Learning. arXiv. 2026. Available online: https://arxiv.org/abs/2609.20807v1.
- Chen, Fanchao; Jiang, Ziheng; Wei, Ziyun; Zhong, Zheng; Li, Du; Zhang, Chi; Lin, Haibin; Venkataraman, Shivaram. Towards Full Pipeline FP8 Reinforcement Learning for LLMs. arXiv. 2026. Available online: https://arxiv.org/abs/2609.22870v1.
- Li, Zhen; Zhang, Shuai; Gu, Yanggan; Zhang, Yiming; Yu, Yang; Feng, Mingfa; Xie, Congkai; Yu, Shuang; Lai, Junjie; Yang, Hongxia. TRIAGE: Direction-Aware Mismatch Stabilization of Native NVFP4 Reinforcement Learning. arXiv. 2026. Available online: https://arxiv.org/abs/2610.07043v2.
- Wang, Xin; Yu, Hao; Zhuge, Zhengyang; Mao, Bochao; Li, Zheng; Feng, Junda; Luo, Yuyan; Zhang, Yi; Cao, Yizhong; Zhang, Mi; Liu, Dayiheng; Zhang, Jianwei. TRACE: Rollout-Guided Quantization-Aware Training for FP4 Reinforcement Learning of MoE Language Models. arXiv. 2026. Available online: https://arxiv.org/abs/2610.07767v2.
- Zheng, Chujie; Dang, Kai; Yu, Bowen; Li, Mingze; Jiang, Huiqiang; Lin, Junrong; Liu, Yuqiong; Lin, Hao; Wu, Chencan; Hu, Feng; Yang, An; Zhou, Jingren; Lin, Junyang. Stabilizing Reinforcement Learning with LLMs: Formulation and Practices. arXiv. 2025. Available online: https://arxiv.org/abs/2512.01374v3.
- Ma, Wenhan; Zhang, Hailin; Zhao, Liang; Song, Yifan; Wang, Yudong; Sui, Zhifang; Luo, Fuli. Stabilizing MoE Reinforcement Learning by Aligning Training and Inference Routers. arXiv. 2025. Available online: https://arxiv.org/abs/2510.11370v2.
- Qi, Penghui; Liu, Zichen; Zhou, Xiangxin; Pang, Tianyu; Du, Chao; Lee, Wee Sun; Lin, Min. Defeating the Training-Inference Mismatch via FP16. arXiv. 2025. Available online: https://arxiv.org/abs/2510.26788v1.
- Park, Sihwan; Kim, Sung-Yub; Jang, Doohyuk; Yang, Eunho. KV4-RL: Unlocking Faster Asynchronous Rollouts for RLVR with INT4 KV Cache Quantization. arXiv. 2026. Available online: https://arxiv.org/abs/2610.14448v1.
- Zhang, Yaxiang; Li, Yingru; Liu, Jiacai; Xu, Jiawei; Li, Ziniu; Liu, Qian; Li, Haoyuan. Beyond Precision: Training-Inference Mismatch is an Optimization Problem and Simple LR Scheduling Fixes It. arXiv 2026, arXiv:2602.01826v1. [Google Scholar]
- Zhong, Tianle; Ling, Neiwen; Pi, Yifan; Wei, Zijun; Yu, Tianshu; Fox, Geoffrey; Wu, Peng; Yu, Xiao. Diagnosing Training Inference Mismatch in LLM Reinforcement Learning via a Zero-Mismatch Reference. arXiv. 2026. Available online: https://arxiv.org/abs/2605.14220v2.
- Yu, Tianrun; Zhao, Kaixiang; Li, Shangzhe; Yang, Yuxiao; Jenkins, Porter; Zhang, Weitong; Killian, Taylor W. Rethinking Training-Inference Mismatch in LLM Reinforcement Learning: Where It Arises and How to Correct It. arXiv. 2026. Available online: https://arxiv.org/abs/2609.32444v1.
- Fakoor, Rasool; Aubry, Murdock; Stranges, Nicholas; Smola, Alexander J. Let the Batch Decide, On- or Off-Policy: Effective Sample Size for RL Post-Training. arXiv. 2026. Available online: https://arxiv.org/abs/2605.12380v2.
- Yao, Jiarui; Zhou, Xiangxin; Qi, Penghui; Lee, Wee Sun; Bo, Liefeng; Pang, Tianyu. Rethinking the Divergence Regularization in LLM RL. arXiv 2026, arXiv:2606.09821v1. [Google Scholar]
- Liang, Jing; Tang, Hongyao; Ma, Yi; He, Yancheng; Wang, Weixun; Li, Xiaoyang; Huang, Ju; Su, Wenbo; Liu, Jinyi; Zheng, Yan; Hao, Jianye; Zheng, Bo. The Mirage of Optimizing Training Policies: Monotonic Inference Policies as the Real Objective for LLM Reinforcement Learning. arXiv. 2026. Available online: https://arxiv.org/abs/2606.29526v1.
- Mak, Hei Yi; Golestan, Shadan; Le, Hoang; Jazi, Mehran Taghian; Peng, Yunke; Wang, Yaoyuan; Wang, Yao; Wang, Junsong; Hu, Tianchi; He, Fengchen; Hu, Guipeng; Rahman, Tanzila; Raju, Anandharaju Durai. HiFloat4 Format for End-To-End Reinforcement Learning Post-Training of Large Language Models. arXiv. 2026. Available online: https://arxiv.org/abs/2607.26515v1.
- RadixArk; Chen, Tom; Cheng, Mao; Dong, Shi; Du, Kangrui; Jiang, Yanbin; Li, Jiajun; Li, Yiming; Lin, Tao; Su, Yusheng; Ye, Andy; Yuan, Yueming; Zeng, Zhichen. Miles v0.1: Production-Level Post-Training. arXiv 2026, arXiv:2609.08368v1. [Google Scholar]
- Xu, Weili; Li, Jisen; Jian, Yuqing; Li, Chenxi; Sha, Zhizhou; Yu, Yifan; Wu, Qingyang; Xu, Chenfeng; Zhou, Zhongzhu; Zhang, Tianyi; Athiwaratkun, Ben. QATFactory: A Versatile, Deployment-Aligned Framework for Quantization-aware Training and Distillation of LLMs. arXiv. 2026. Available online: https://arxiv.org/abs/2609.39223v2.
- Han, Shuo; Hu, Ziqing. Baselines and Score Centering in Policy Gradient Estimation. arXiv. 2026. Available online: https://arxiv.org/abs/2610.22263v1.
- Zhang, Ziyang; Ding, Xinheng; Yuan, Jiayi; Liu, Rixin; Mao, Huizi; Xing, Jiarong; Liu, Zirui. Deterministic Inference across Tensor Parallel Sizes That Eliminates Training-Inference Mismatch. arXiv. 2025. Available online: https://arxiv.org/abs/2511.17826v2.
- Qi, Penghui; Zhou, Xiangxin; Liu, Zichen; Pang, Tianyu; Du, Chao; Lin, Min; Lee, Wee Sun. Rethinking the Trust Region in LLM Reinforcement Learning. arXiv. 2026. Available online: https://arxiv.org/abs/2602.04879v3.
- Schulman, John; Wolski, Filip; Dhariwal, Prafulla; Radford, Alec; Klimov, Oleg. Proximal Policy Optimization Algorithms. arXiv. 2017. Available online: https://arxiv.org/abs/1707.06347.
- Shao, Zhihong; Wang, Peiyi; Zhu, Qihao; Xu, Runxin; Song, Junxiao; Bi, Xiao; Zhang, Haowei; Zhang, Mingchuan; Li, Y. K.; Wu, Y.; Guo, Daya. DeepSeekMath: Pushing the Limits of Mathematical Reasoning in Open Language Models. arXiv. 2024. Available online: https://arxiv.org/abs/2402.03300.
- Kwon, Woosuk; Li, Zhuohan; Zhuang, Siyuan; Sheng, Ying; Zheng, Lianmin; Yu, Cody Hao; Gonzalez, Joseph E.; Zhang, Hao; Stoica, Ion. Efficient Memory Management for Large Language Model Serving with PagedAttention. arXiv. 2023. Available online: https://arxiv.org/abs/2309.06180.
- Hao, Zhiwei; Guo, Jianyuan; Shen, Li; Luo, Yong; Hu, Han; Wang, Guoxia; Yu, Dianhai; Wen, Yonggang; Tao, Dacheng. Low-Precision Training of Large Language Models: Methods, Challenges, and Opportunities. arXiv. 2025. Available online: https://arxiv.org/abs/2505.01043.
- Surana, Rohan; Mundada, Gagan; Jiang, Xunyi; Wang, Chuhan; Tang, Zhenwei; Jiao, Difan; Huang, Zihan; Xiong, Yuxin; Wu, Junda; Yu, Sheldon; Li, Xintong; Jain, Raghav; Kuang, Nikki; Zhou, Sizhe; Jin, Bowen; Chu, Zhendong; Yu, Tong; Rossi, Ryan; Huang, Kuan-Hao; Shang, Jingbo; Han, Jiawei; McAuley, Julian. Generate, Filter, Control, Replay: A Comprehensive Survey of Rollout Strategies for LLM Reinforcement Learning. arXiv. 2026. Available online: https://arxiv.org/abs/2605.02913.
- Zhang, Kaiyan; Zuo, Yuxin; He, Bingxiang; Sun, Youbang; Liu, Runze; Jiang, Che; Fan, Yuchen; Tian, Kai; Jia, Guoli; Li, Pengfei; Fu, Yu; Lv, Xingtai; Zhang, Yuchen; Zeng, Sihang; Qu, Shang; Li, Haozhan; Wang, Shijie; Wang, Yuru; Long, Xinwei; Liu, Fangfu; Xu, Xiang; Ma, Jiaze; Zhu, Xuekai; Hua, Ermo; Liu, Yihao; Li, Zonglin; Chen, Huayu; Qu, Xiaoye; Li, Yafu; Chen, Weize; Yuan, Zhenzhao; Gao, Junqi; Li, Dong; Ma, Zhiyuan; Cui, Ganqu; Liu, Zhiyuan; Qi, Biqing; Ding, Ning; Zhou, Bowen. A Survey of Reinforcement Learning for Large Reasoning Models. arXiv. 2025. Available online: https://arxiv.org/abs/2509.08827.
- Gholipour, Niloofar; Assuncao, Marcos; Singh, Gursimran; Yu, Timothy; Buyya, Rajkumar; Gascon-Samson, Julien; Fan, Zhenan; Zhang, Yong; Xu, Xiaojie; Yao, Yaqiang; Bai, Xiaolong. Rollout Efficiency in Reinforcement Learning for Reasoning Large Language Models: A Taxonomy and Future Directions. arXiv. 2026. Available online: https://arxiv.org/abs/2609.25463v1.
Figure 2.
Representative milestones by first public release; order does not imply technical inheritance. Marks denote author institutions or teams (up to three per work); selected labels highlight mechanisms. QeRL is an exploration boundary; Appendix A maps all focal studies. MSR: Microsoft Research; THU: Tsinghua.
Figure 2.
Representative milestones by first public release; order does not imply technical inheritance. Marks denote author institutions or teams (up to three per work); selected labels highlight mechanisms. QeRL is an exploration boundary; Appendix A maps all focal studies. MSR: Microsoft Research; THU: Tsinghua.
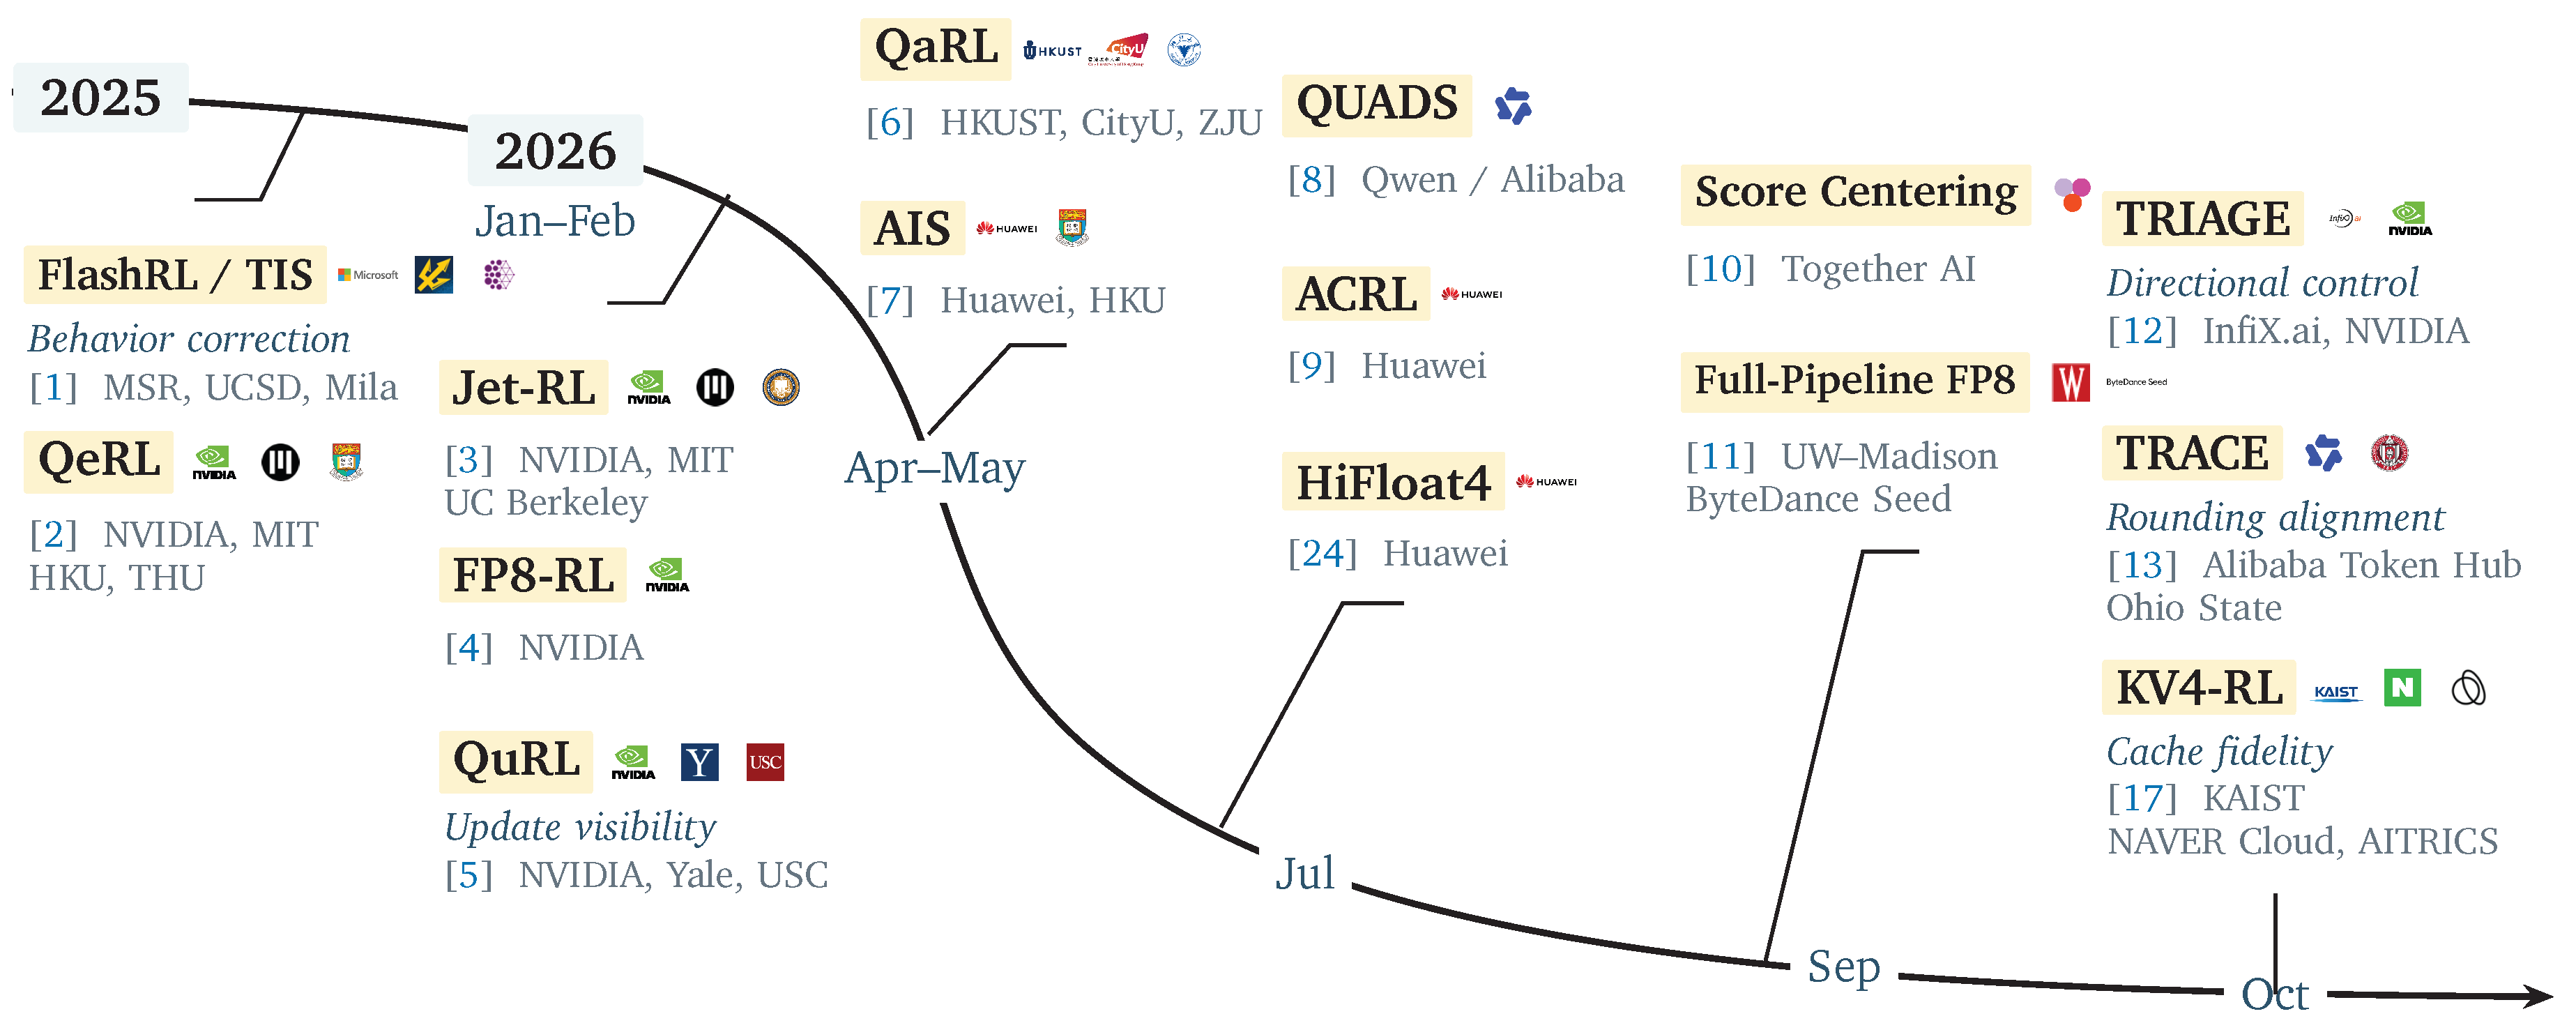
Figure 3.
Policy identities and optimization roles. Horizontal links decompose the ratio in Equation (2); they do not denote data flow. Matched decoding isolates numerical execution differences. The lower panels identify the proximal and reference anchors.
Figure 3.
Policy identities and optimization roles. Horizontal links decompose the ratio in Equation (2); they do not denote data flow. Matched decoding isolates numerical execution differences. The lower panels identify the proximal and reference anchors.
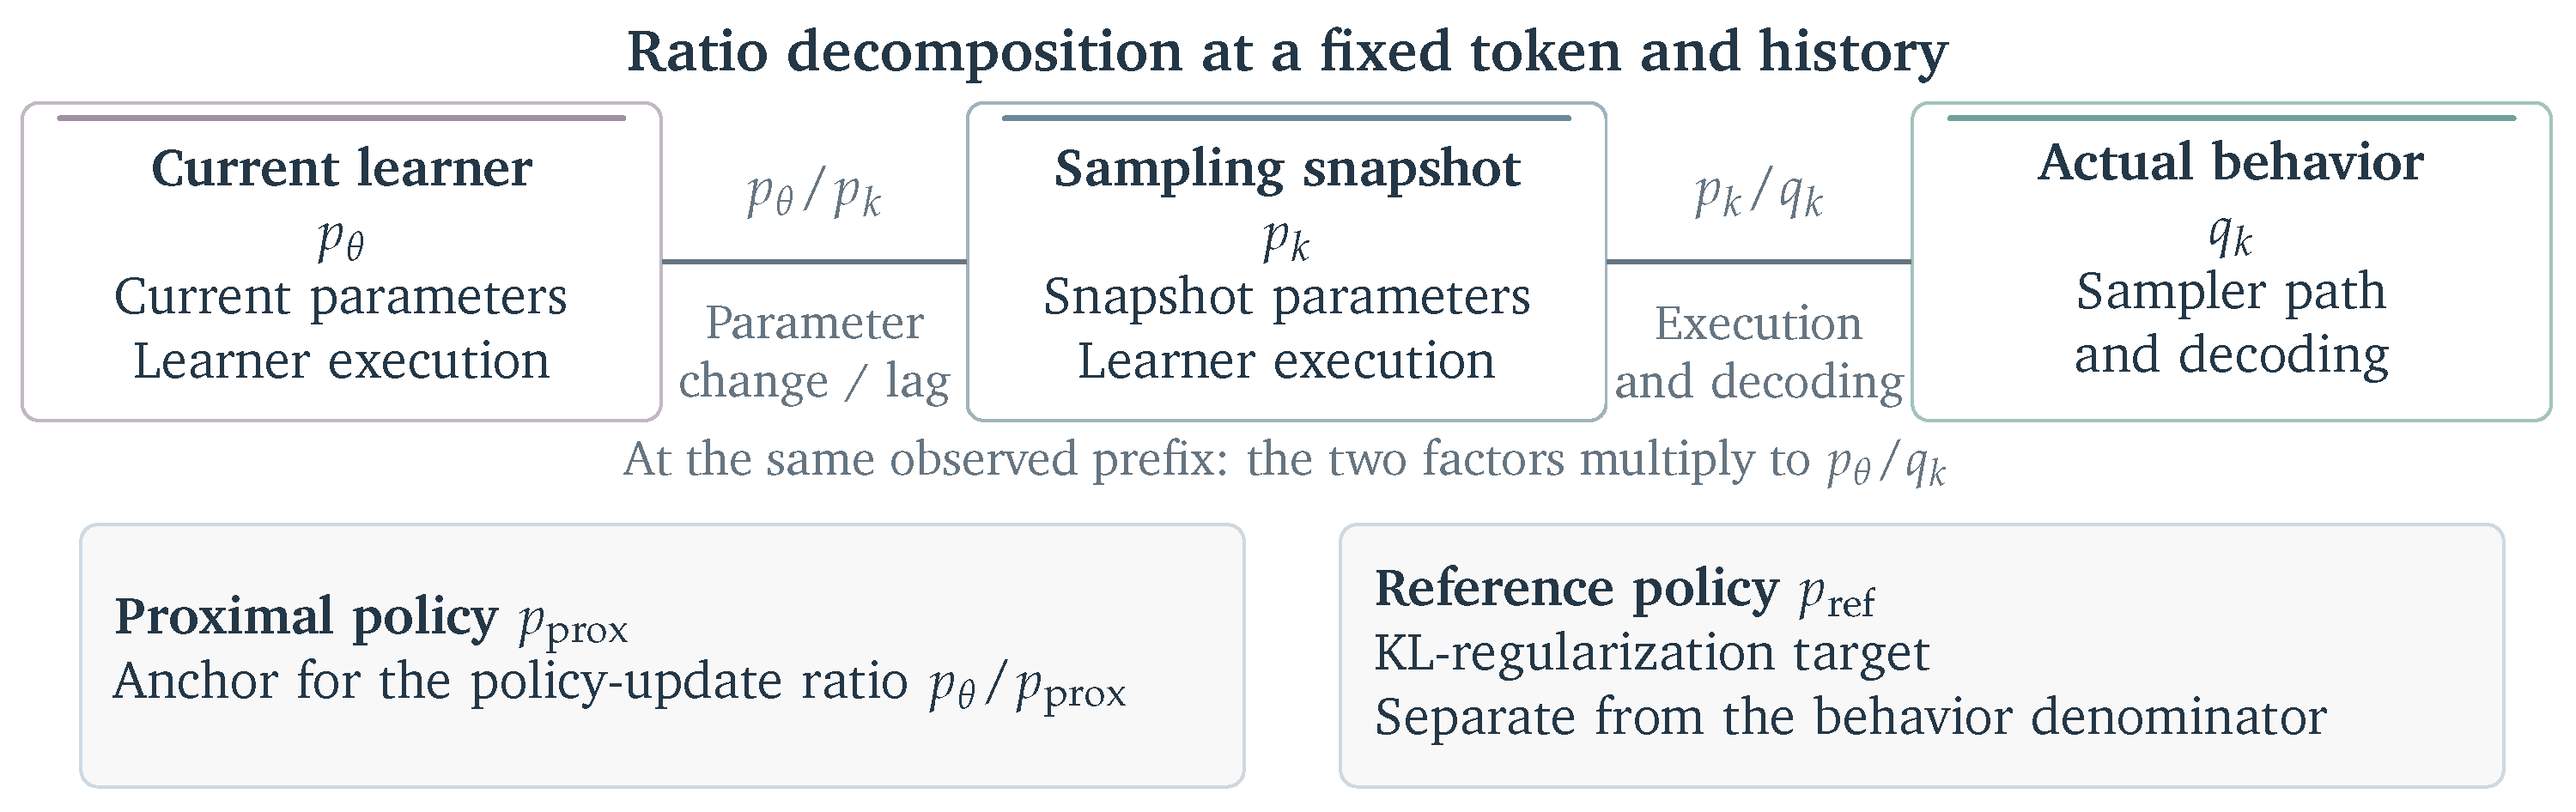
Figure 5.
Optimization effects of execution discrepancy: relative influence [1], conditional score drift [10], and update decisions [11,12]. The effects can interact through numerical and distributional feedback. Arrows show possible propagation; method labels identify representative responses.
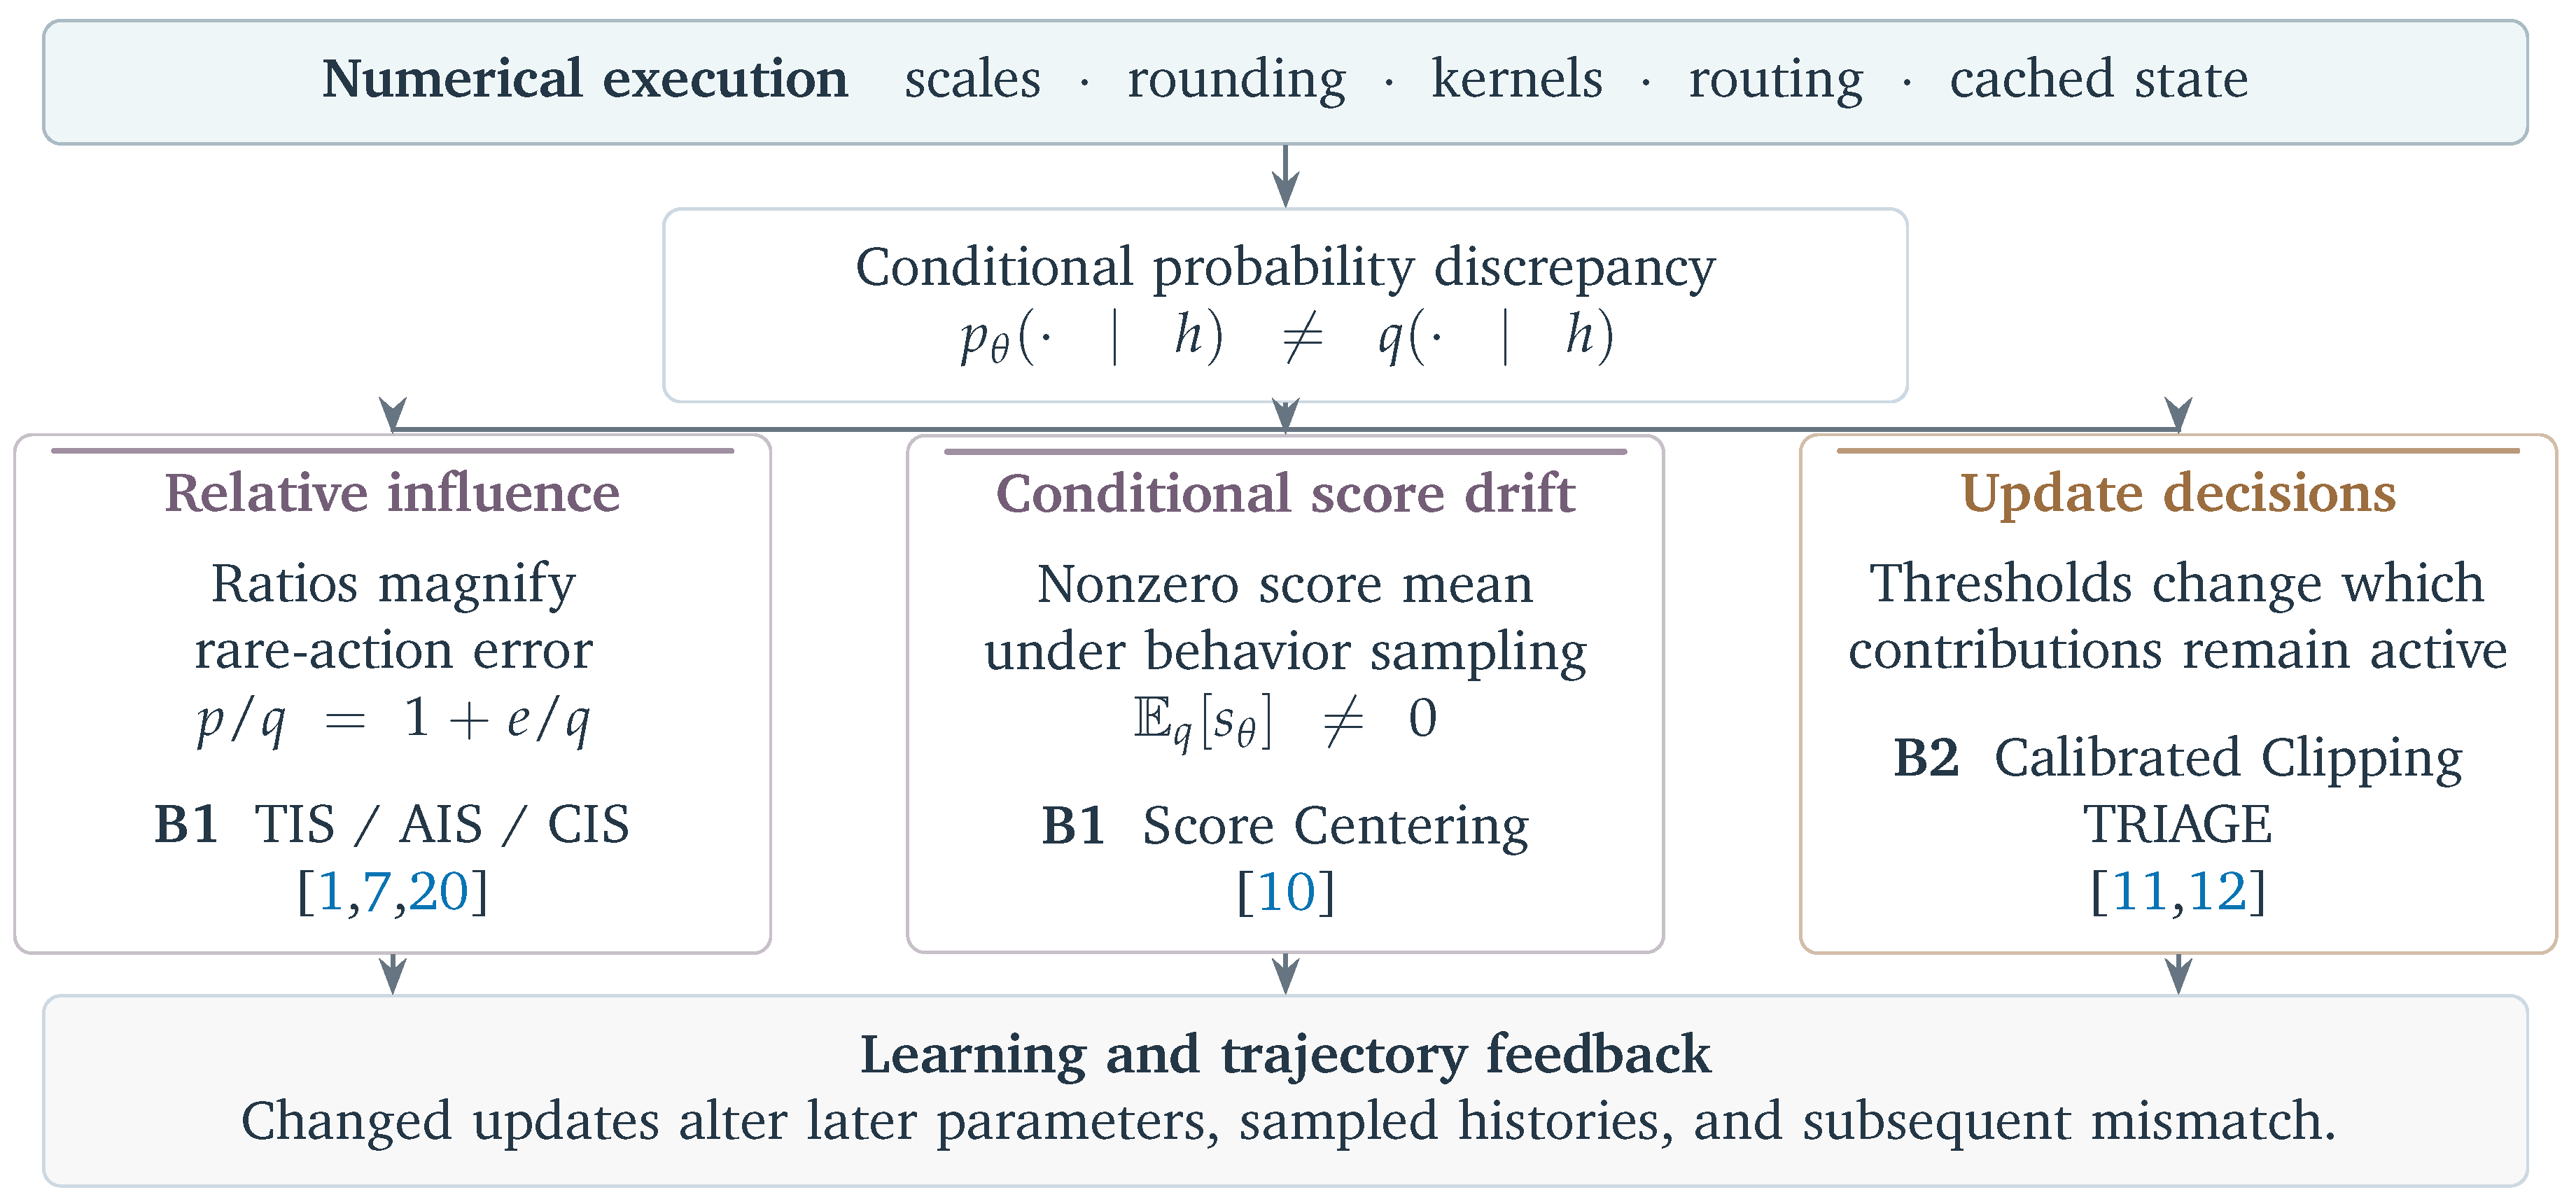
Figure 6.
Controlled probes and online diagnostics compare different policy pairs [12,17,20]. Attribution follows the factors held fixed; online gaps can include policy lag.
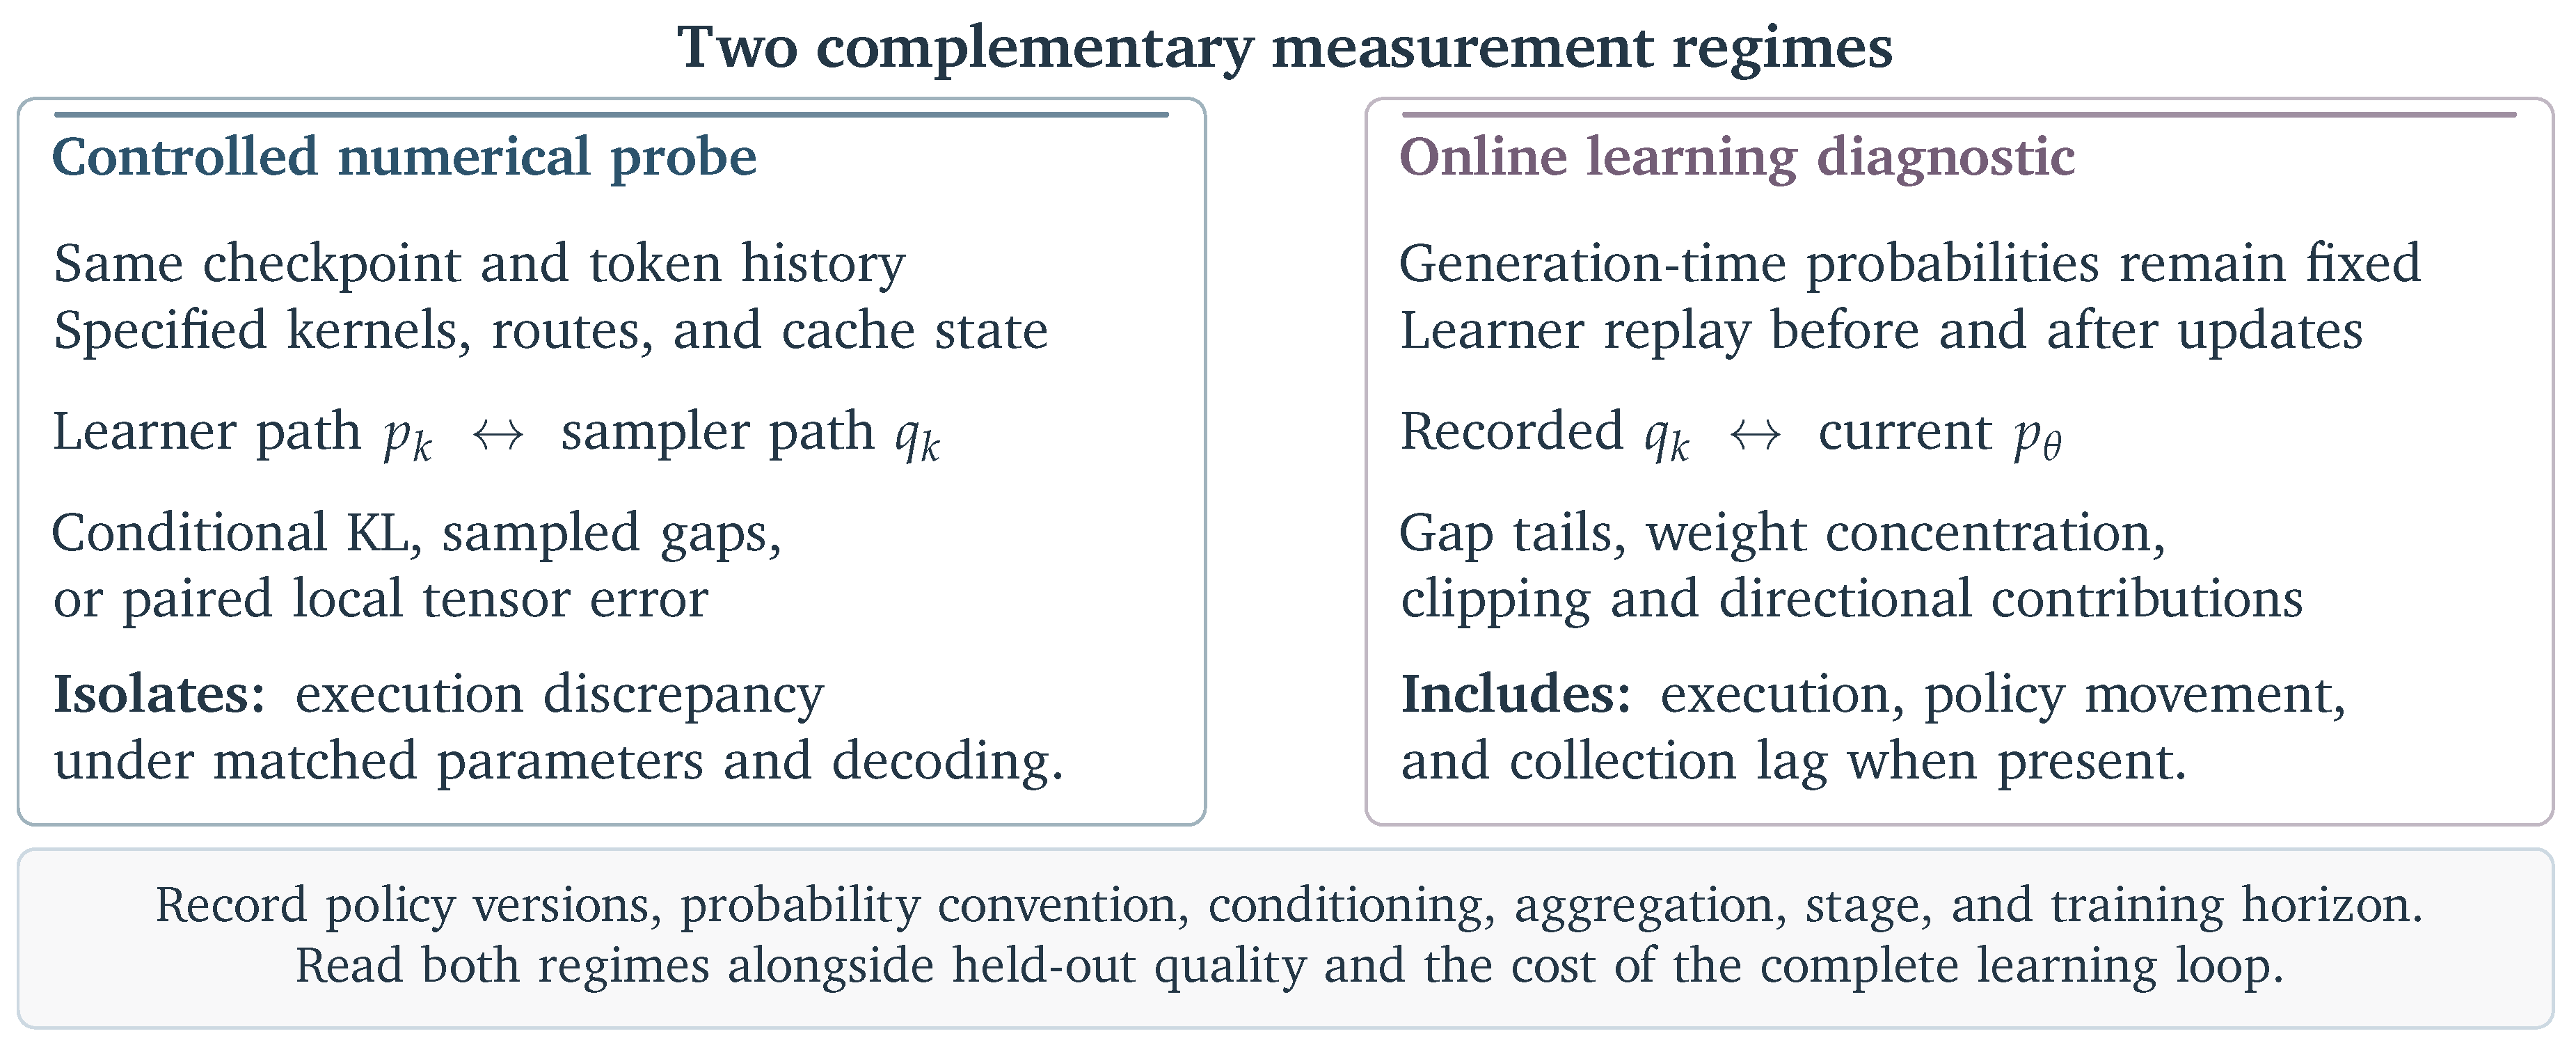
Figure 7.
Constructed E2M1 rounding example at fixed scale. Closer agreement can increase learner approximation error. TRACE uses compact guidance to approximate the paired reference [13].
Figure 7.
Constructed E2M1 rounding example at fixed scale. Closer agreement can increase learner approximation error. TRACE uses compact guidance to approximate the paired reference [13].
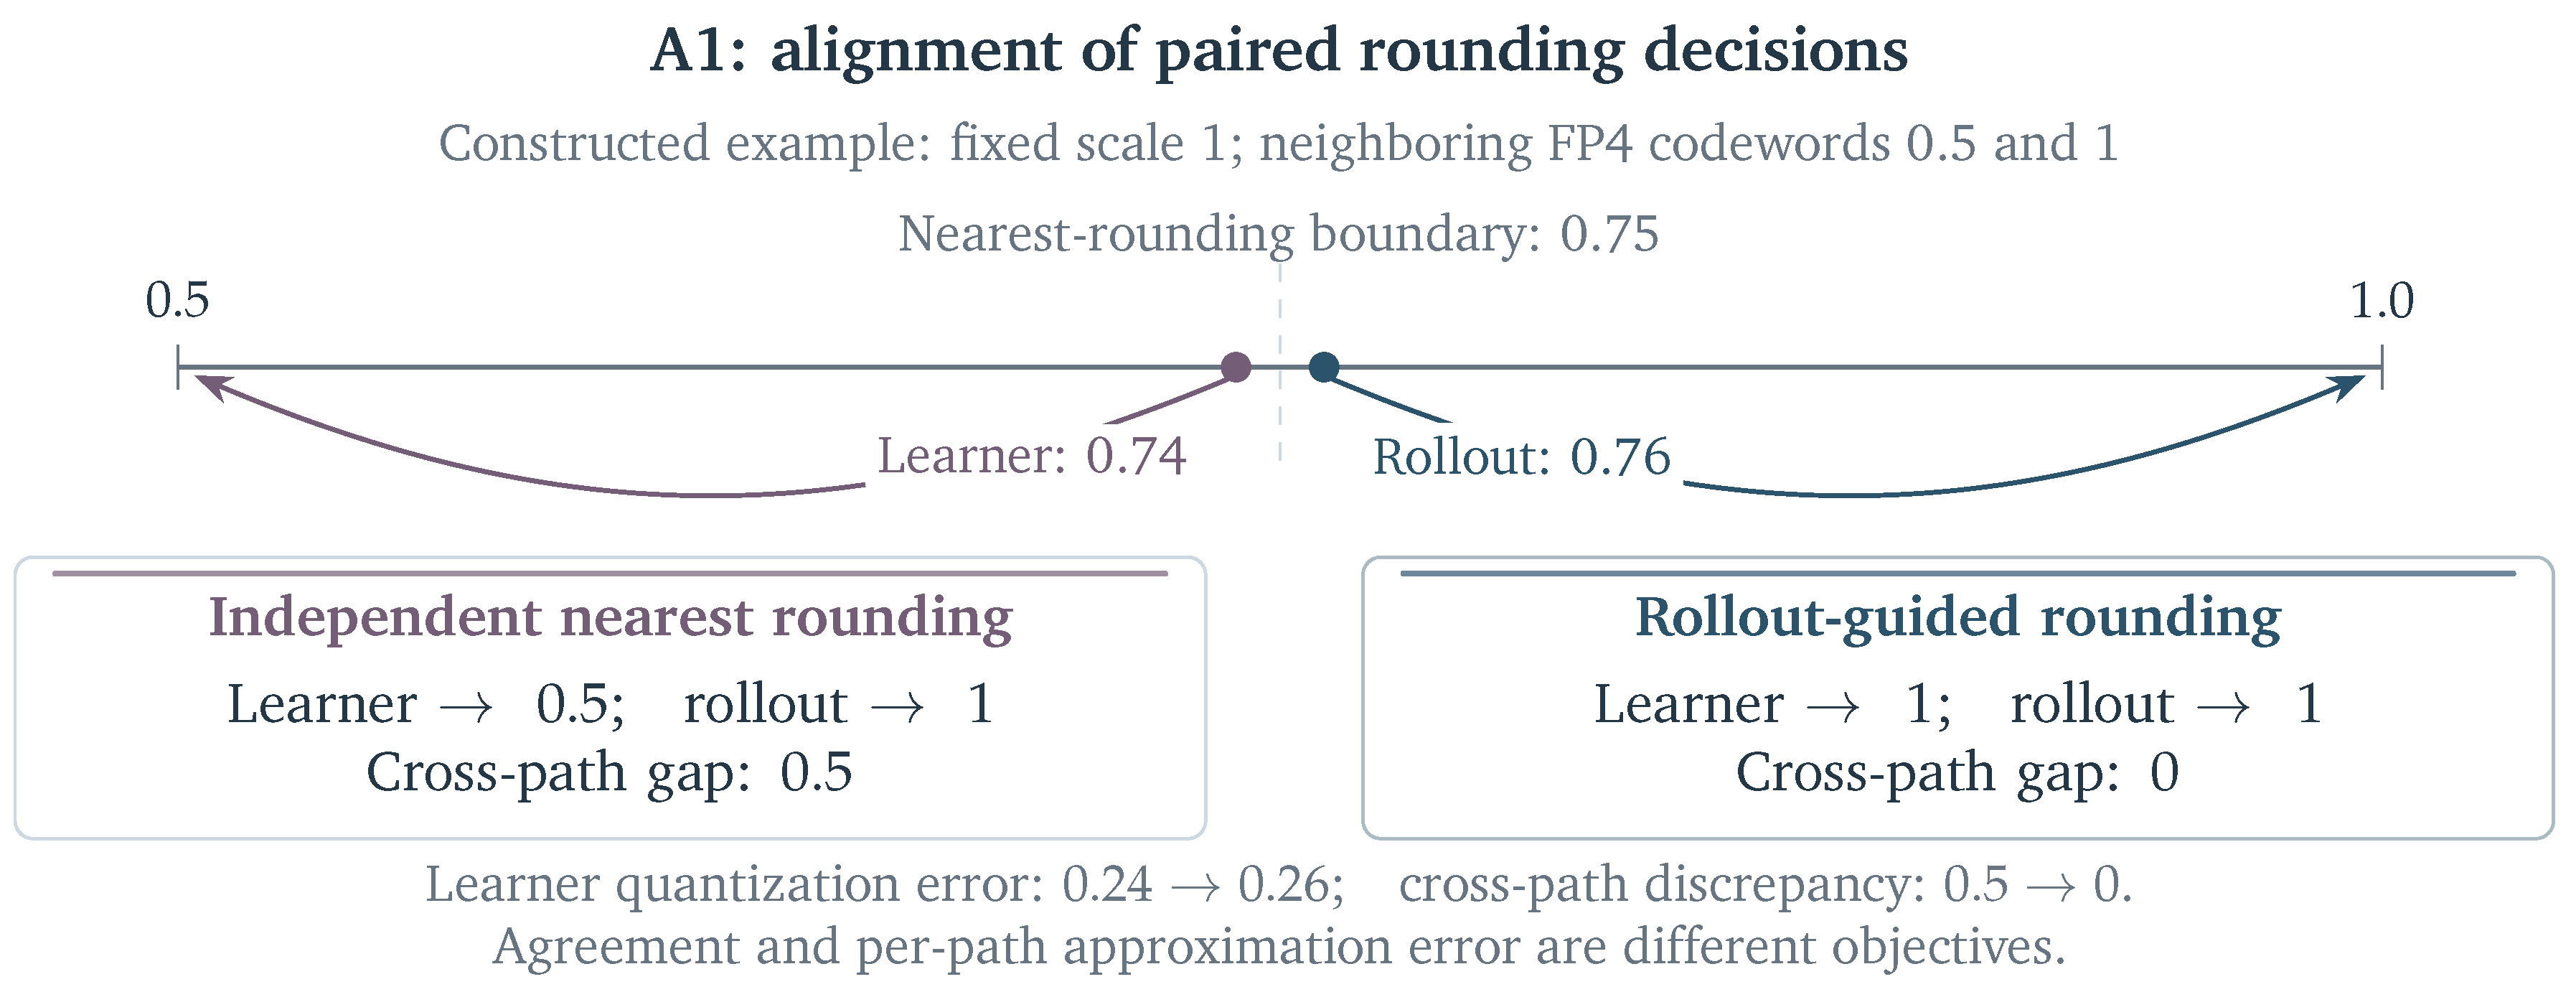
Figure 8.
Update visibility under a fixed-step scalar quantizer (Equation (8)). The larger blue update remains within a cell; the smaller amber update crosses a boundary. Scales determine boundary locations.
Figure 8.
Update visibility under a fixed-step scalar quantizer (Equation (8)). The larger blue update remains within a cell; the smaller amber update crosses a boundary. Scales determine boundary locations.
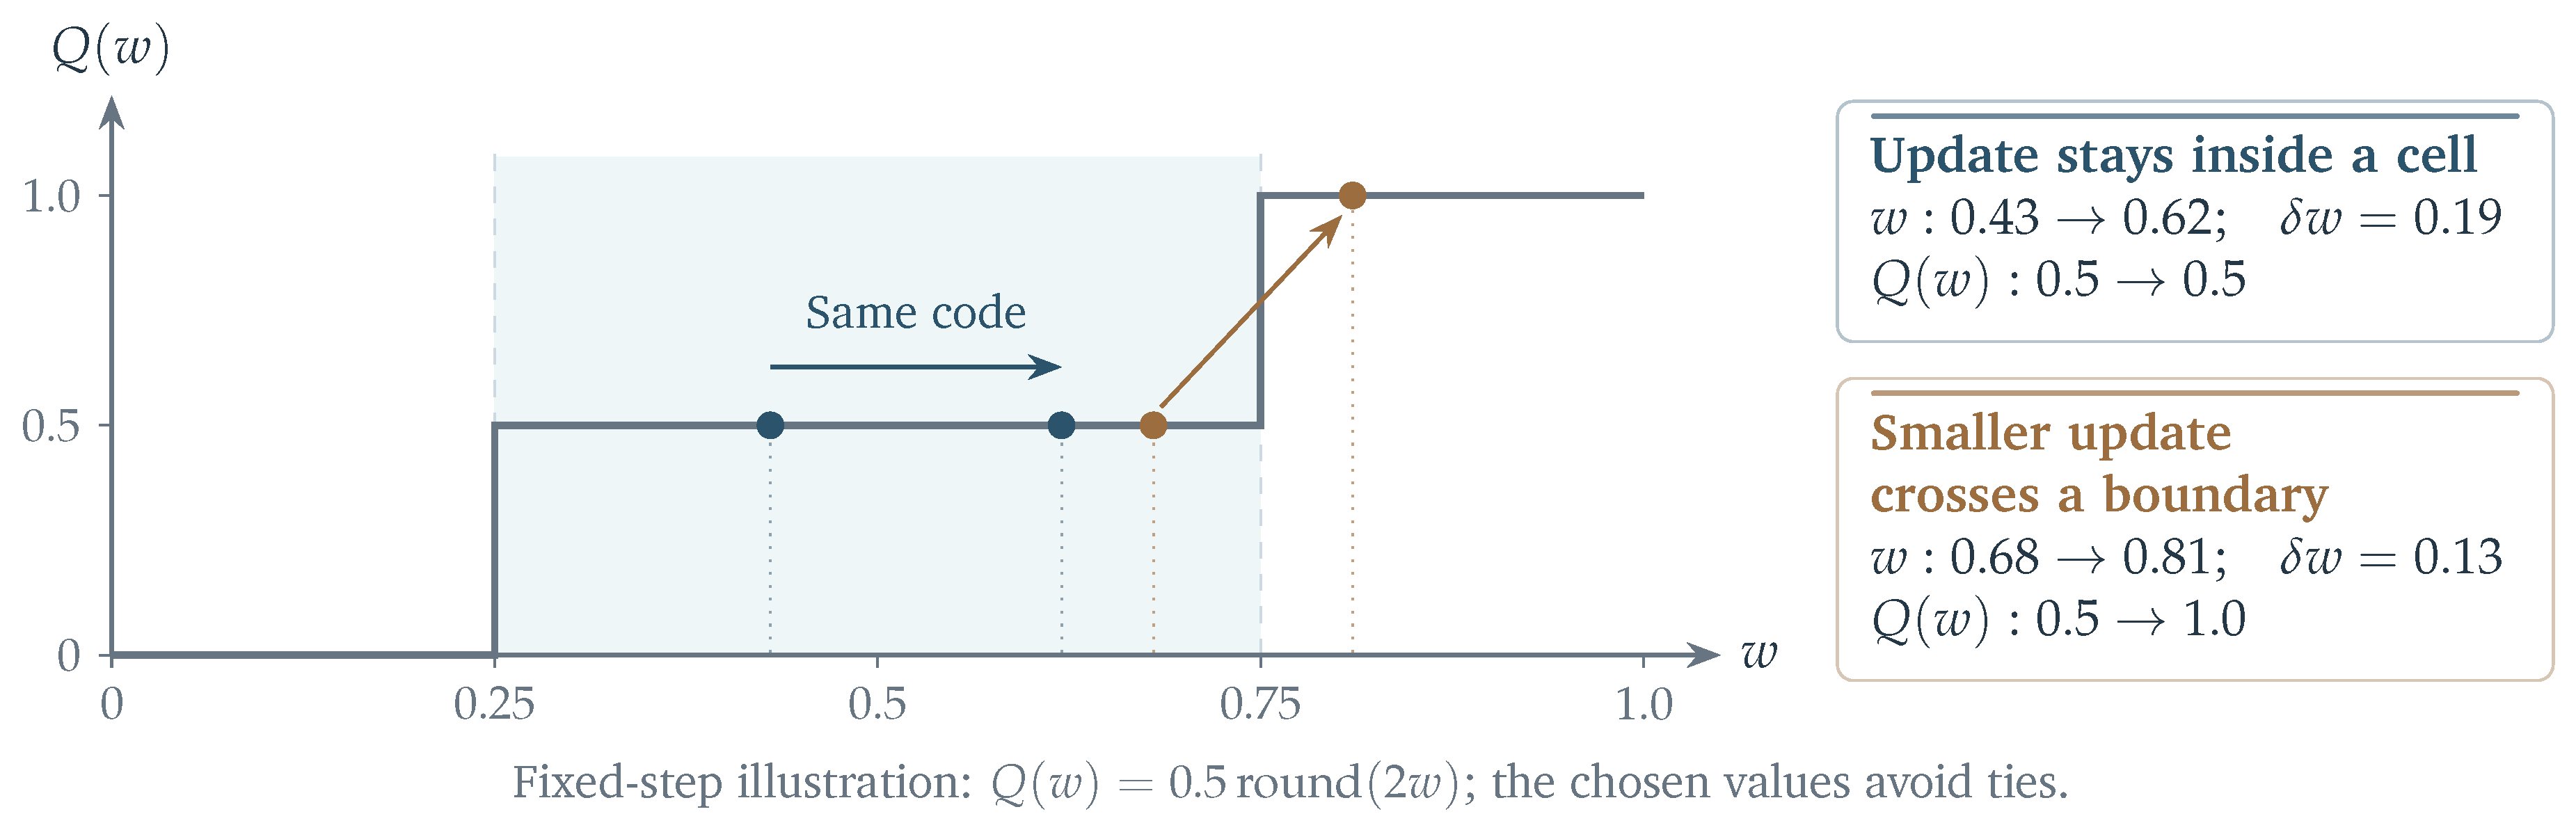
Figure 9.
B1 corrects estimation of a specified quantity; B2 controls update contributions or acceptance. Their information and weighting requirements determine compatible composition.
Figure 9.
B1 corrects estimation of a specified quantity; B2 controls update contributions or acceptance. Their information and weighting requirements determine compatible composition.
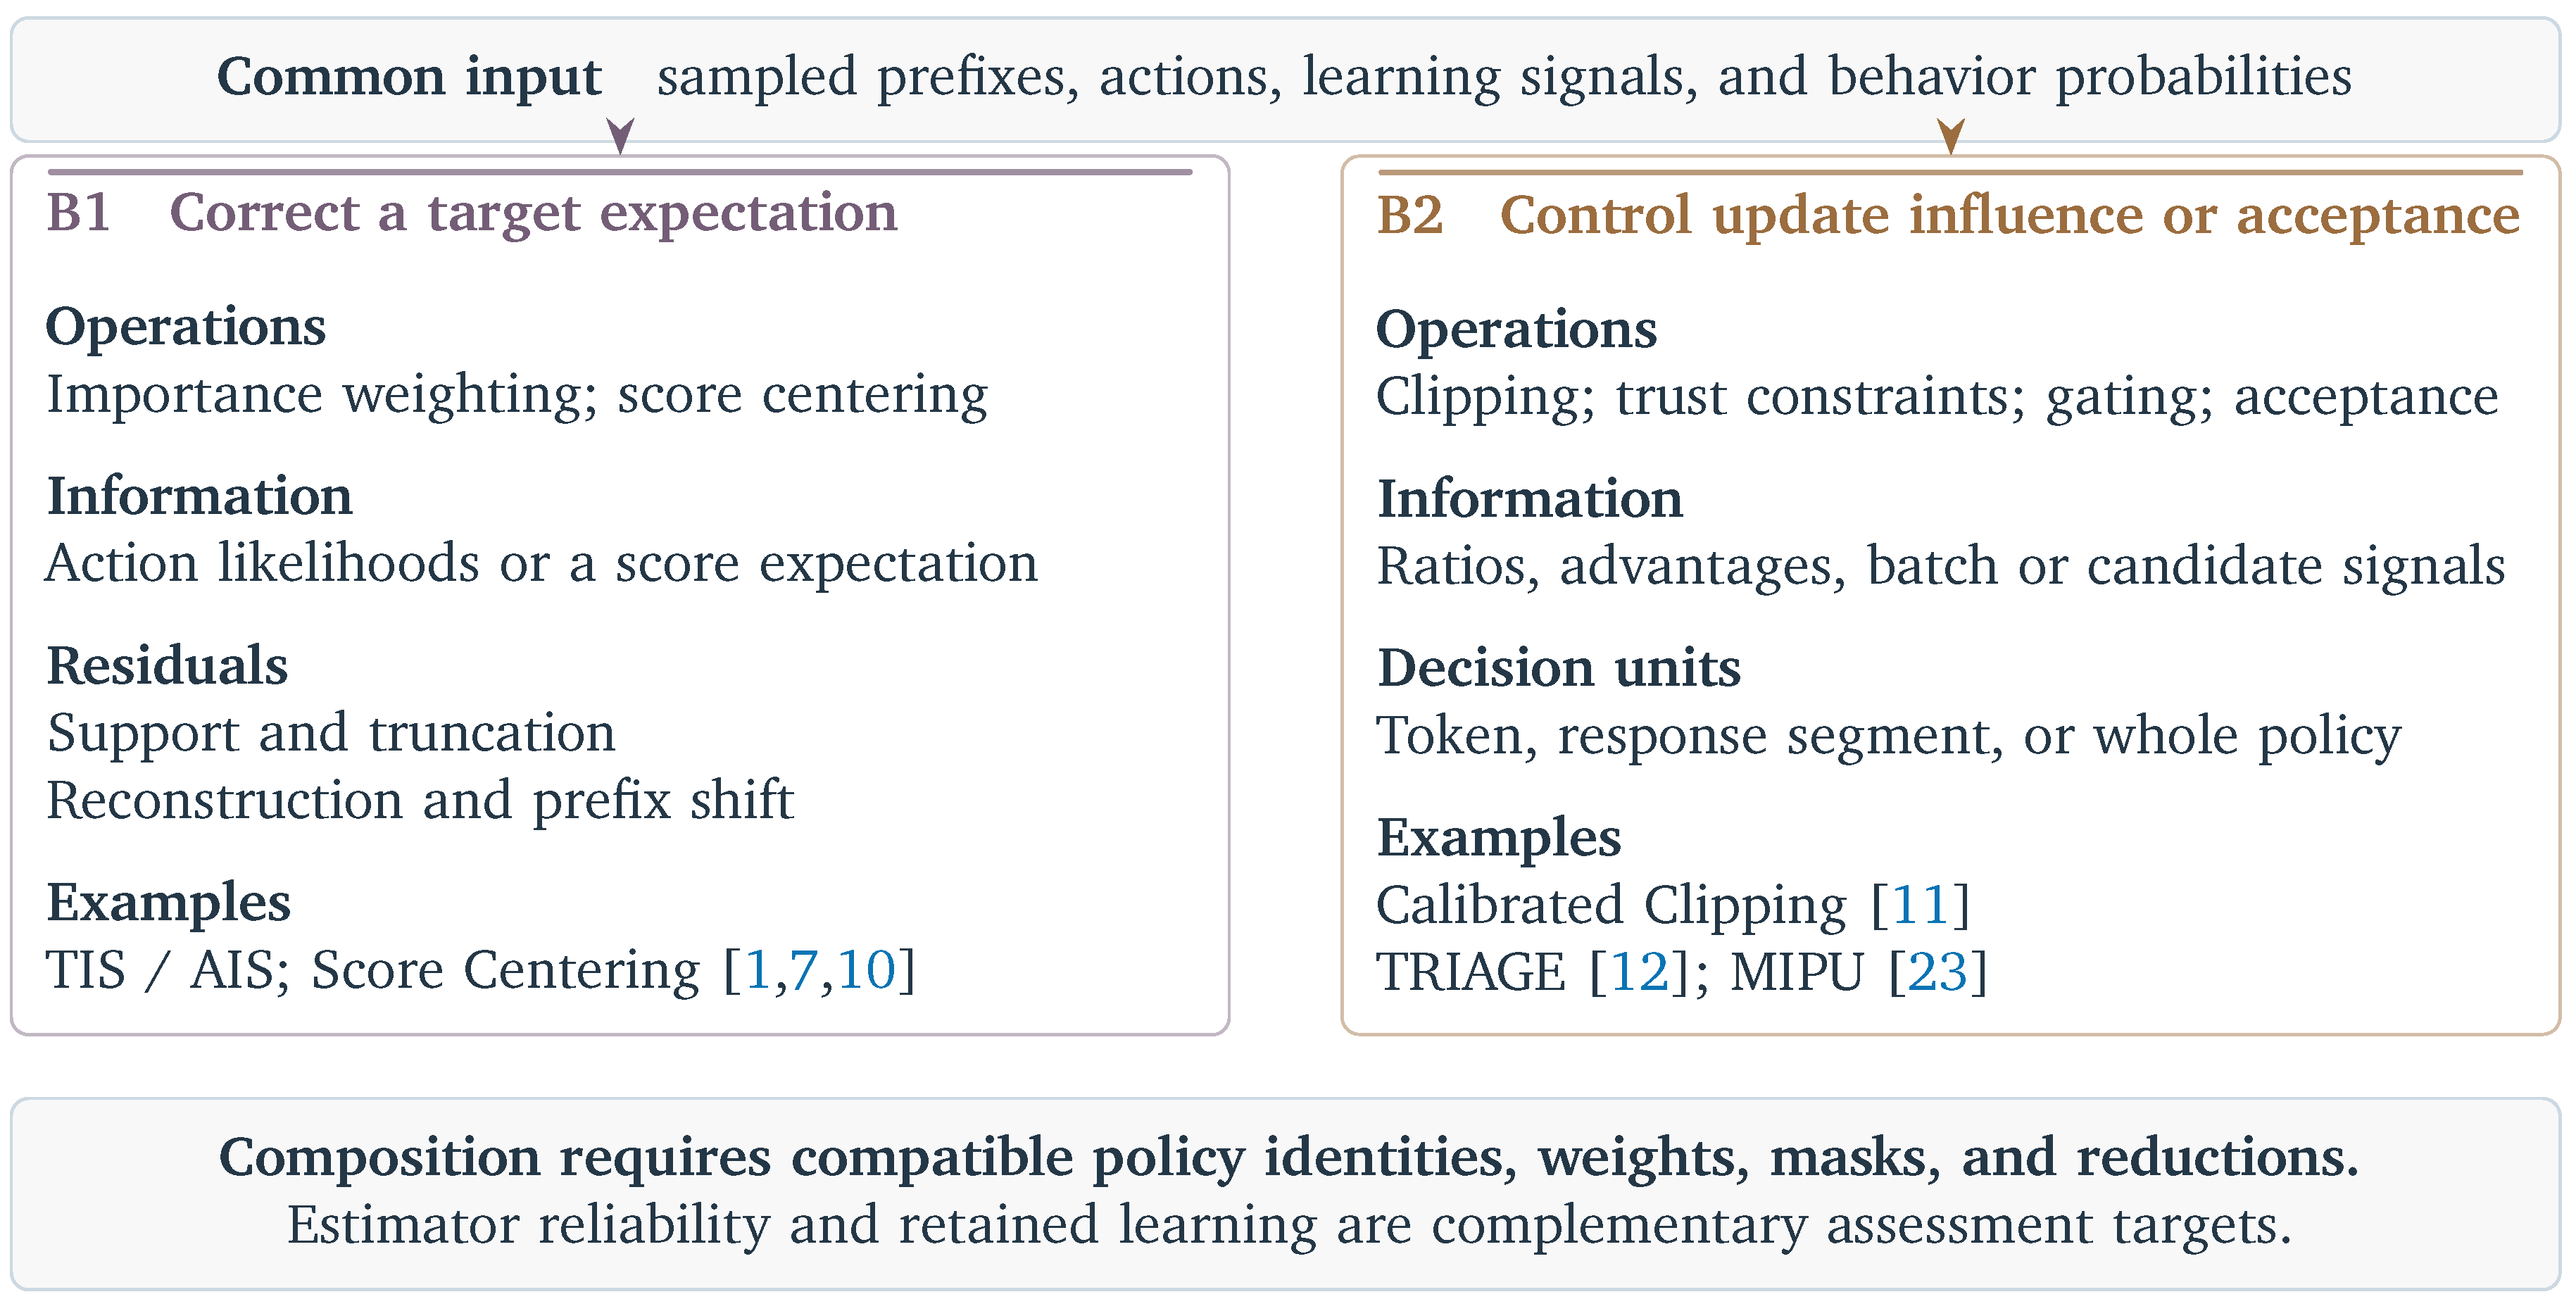
Figure 10.
Within-study comparison graphs for TRACE and TRIAGE [12,13]. Each BF16 reference belongs to its own execution setting; Table 9 records outcomes and checkpoint conditions.
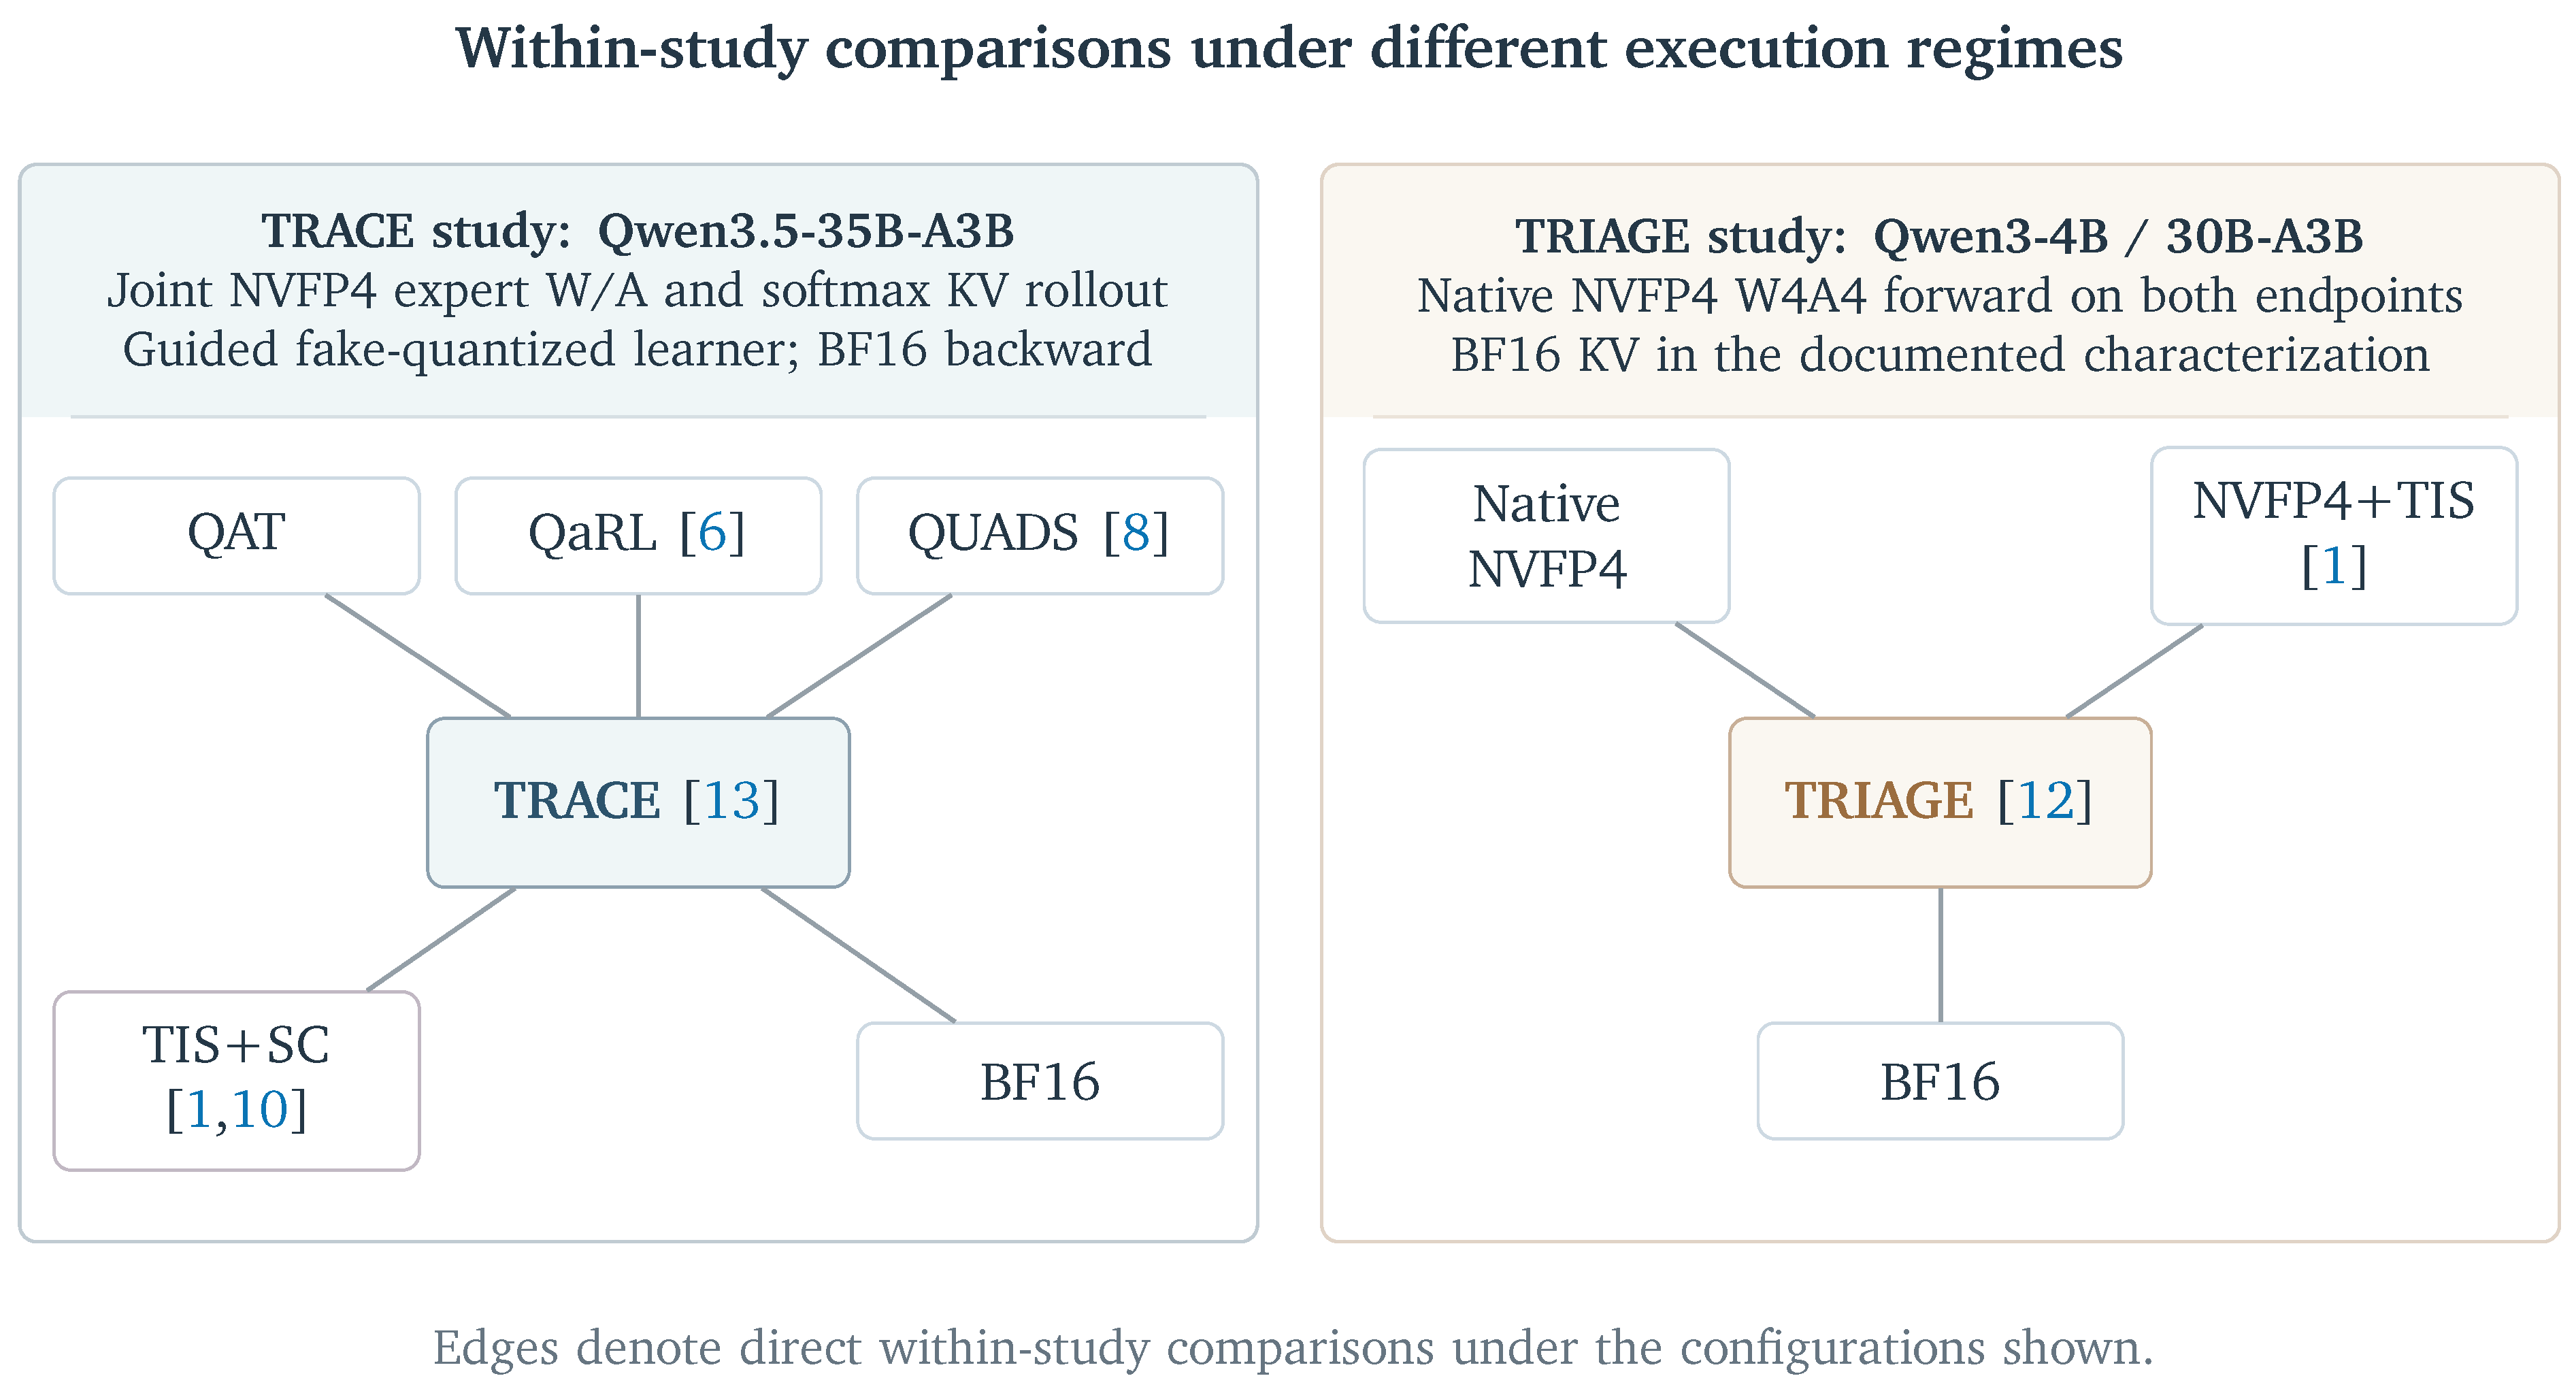
Figure 11.
Constructed serialized timing example with a rollout share. Doubling rollout speed gives ; added work of raises it to , reducing overall speedup from to .
Figure 11.
Constructed serialized timing example with a rollout share. Doubling rollout speed gives ; added work of raises it to , reducing overall speedup from to .
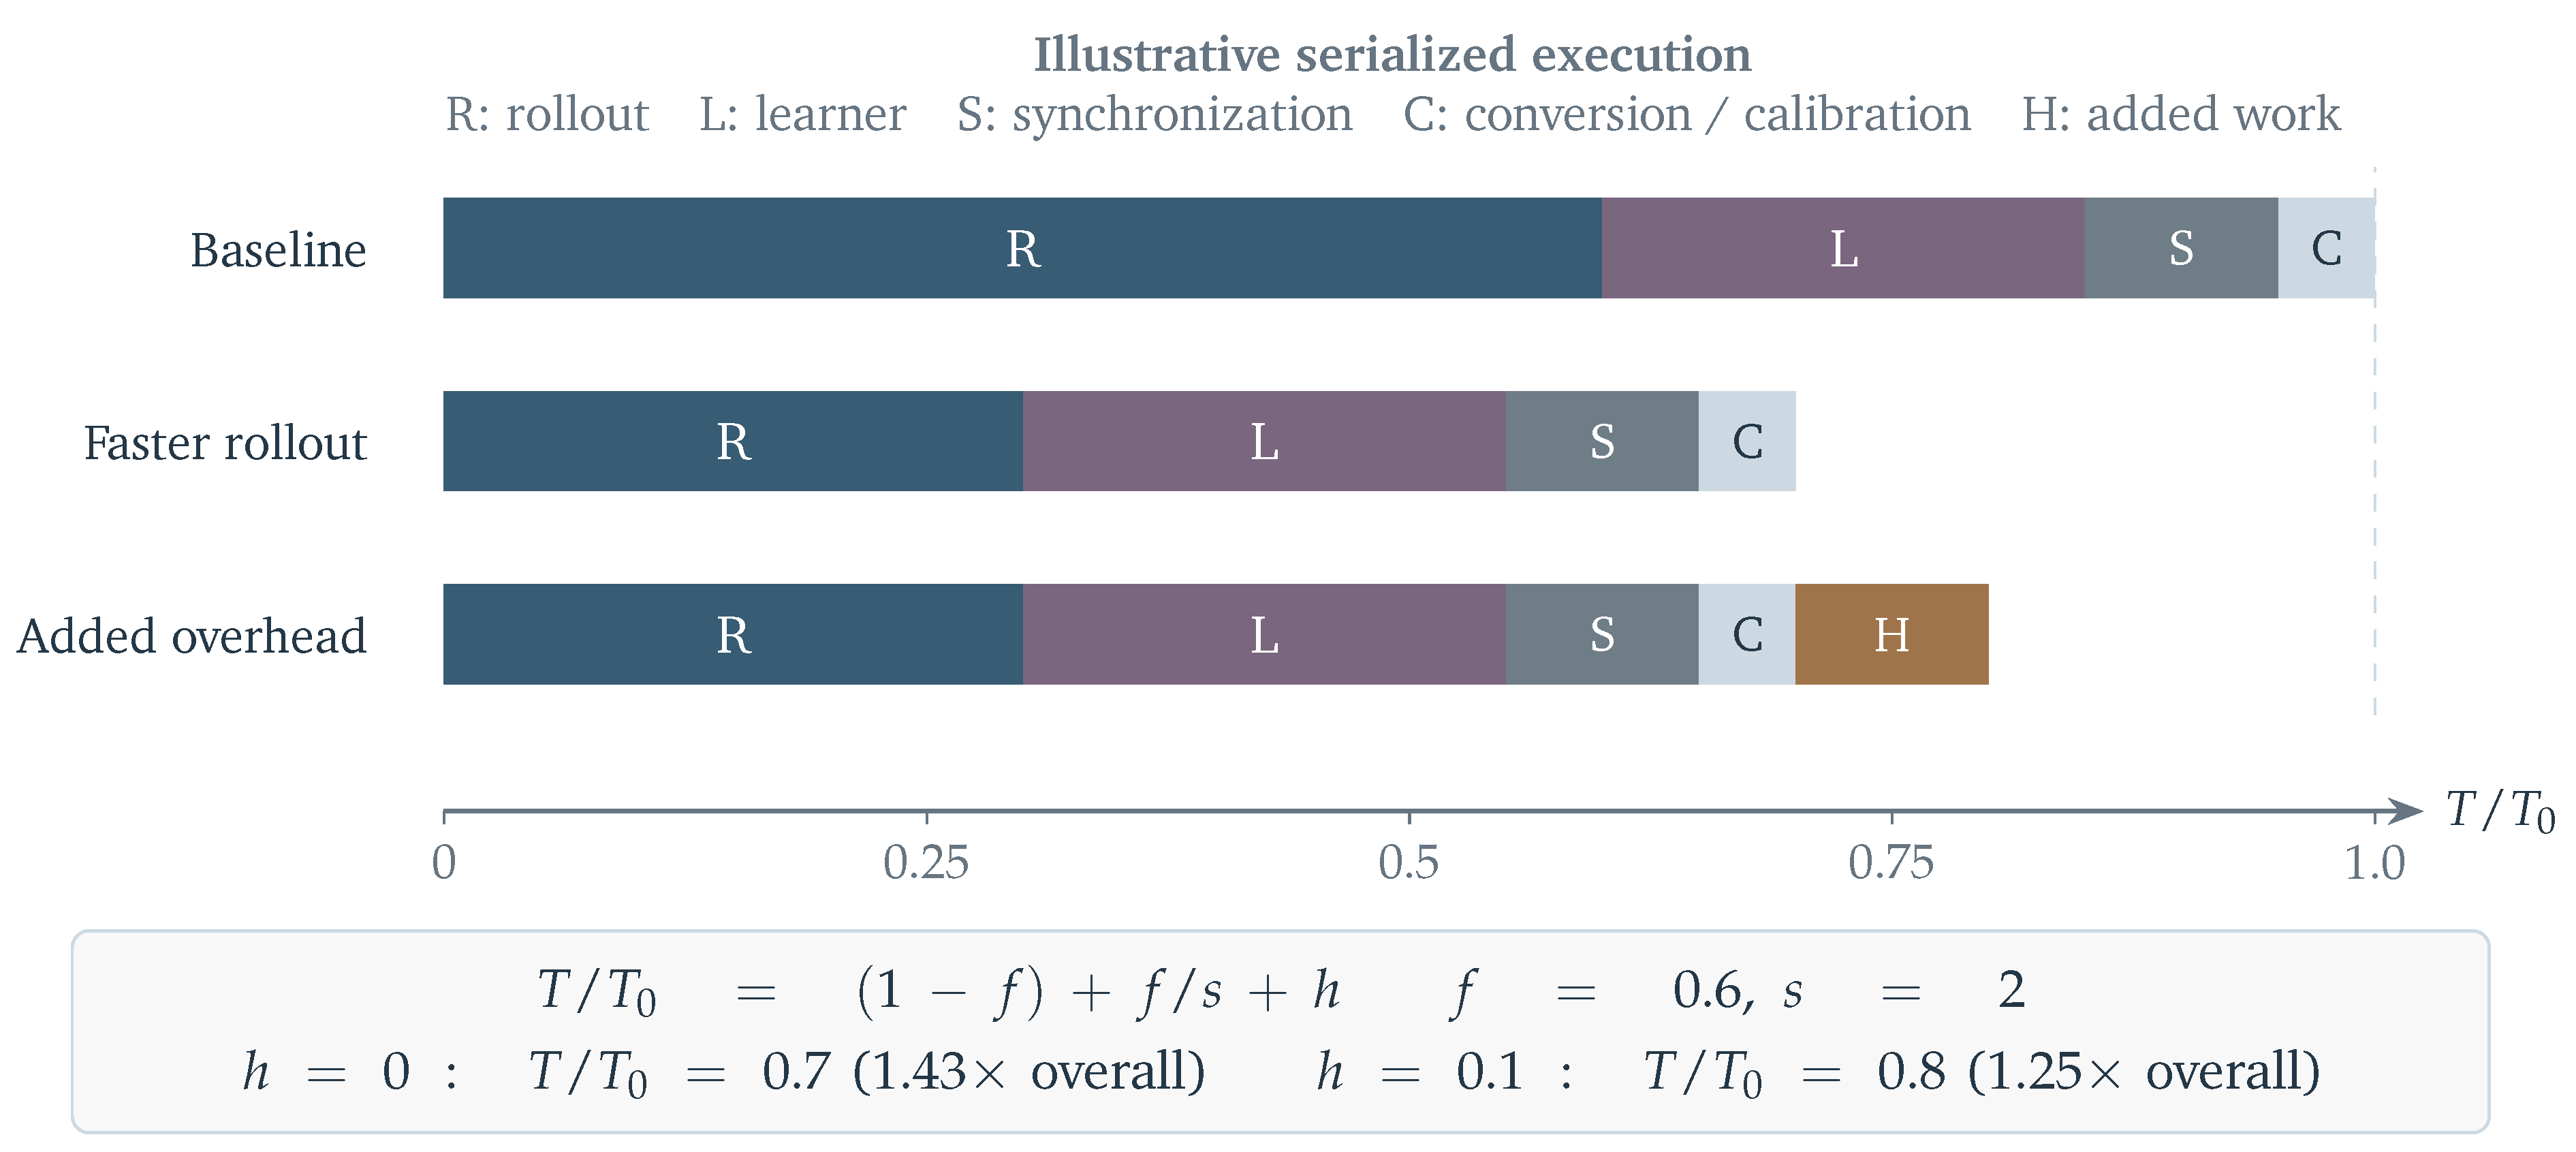
Table 2.
Intervention targets and decision questions. A1 targets cross-path agreement; A2 preserves numerical information and update visibility. B1 targets an expectation; B2 targets an update decision. S is complementary scheduling. Figure 4 maps the studies.
Table 2.
Intervention targets and decision questions. A1 targets cross-path agreement; A2 preserves numerical information and update visibility. B1 targets an expectation; B2 targets an update decision. S is complementary scheduling. Figure 4 maps the studies.
| Class | Decision question | What changes | Key dependency |
|---|---|---|---|
| A1 | Can the two execution paths agree more closely? | Operators, representations, or realized numerical decisions. | Correspondence between computations. |
| A2 | Is useful information preserved at low precision? | Scales, residuals, update resolution, or protected states. | Identification of sensitive information. |
| B1 | How should behavior samples estimate a target gradient? | Importance weights or conditional score expectations. | Target distribution and available behavior information. |
| B2 | Which updates should influence the next policy? | Constraints, contribution weights, or candidate acceptance. | Learning signal and control criterion. |
| S | When and how strongly should learning proceed? | Complementary optimization schedule. | A signal for adaptation over time. |
Table 3.
Complementary levels of mismatch diagnosis. Each level answers a different question; outcomes require evidence connecting them to the preceding mechanisms.
Table 3.
Complementary levels of mismatch diagnosis. Each level answers a different question; outcomes require evidence connecting them to the preceding mechanisms.
| Question | Representative measurements | Interpretation boundary |
|---|---|---|
| Where do computations disagree? | Shared-prefix KL; sampled-action gaps and tails; paired activation error [8,12,13,17]. | Specify checkpoint, prefix, routing, probability convention, and tensor location. |
| How reliable is the estimator? | Raw or capped weight concentration; ESS; conditional score mean; variance amplification [7,10,21]. | Concentration and drift are different effects. A theoretical estimand is not automatically a logged statistic. |
| Which updates change? | Sign-separated clipping; directional mass and segment localization; candidate acceptance [11,12,23]. | Requires the objective, fixed advantages, and the relevant update or synchronization stage. |
| Does learning remain useful? | Reward, held-out quality, entropy, failure time, and total cost. | Training outcomes assess consequences; they do not uniquely identify numerical mismatch. |
Table 4.
Numerical interventions and their residual errors. Dependencies describe the numerical object being matched or protected; resource demands are compared in Table 10.
Table 4.
Numerical interventions and their residual errors. Dependencies describe the numerical object being matched or protected; resource demands are compared in Table 10.
| Strategy | Controlled numerical object | Numerical dependency | Residual source |
|---|---|---|---|
| Precision flow | Corresponding operator precision and granularity | Coordinated numerical configuration | Engine and surrounding-kernel differences. |
| Aligned QAT | Learner representation corresponding to rollout | Matching quantizer semantics | Native versus simulated arithmetic; unmatched activations. |
| Guided rounding | Realized rollout quantization decisions | Stored and matched rollout guidance | Unshared modules and downstream propagation. |
| Fidelity control | Scales, update resolution, residuals, or protected states | Calibration, compensation, or selective execution | Other execution paths and policy staleness. |
Table 5.
B2 mechanisms, signals, and application units. Signal and application granularity can differ.
Table 5.
B2 mechanisms, signals, and application units. Signal and application granularity can differ.
| Control mechanism | Observed signal | Application unit | Components |
|---|---|---|---|
| Clipping or trust boundaries | Proximal/behavior ratios; response likelihood; BF16 reference quantiles. | Token contributions or a response-level surrogate. | QuRL ACR; QaRL TBPO; Calibrated Clipping. |
| Reliability-adaptive caps | Normalized ESS of policy ratios across the batch. | Weight cap and regularization in the objective. | P3O. |
| Divergence constraints or regularization | Probability changes relative to the anchor policy. | Token distributions within the objective. | DPPO; DRPO. |
| Directional gating or repair | Advantage and log-gap signs, with response or segment statistics. | Token contributions and eligible response segments. | ACRL; TRIAGE. |
| Candidate acceptance | Inference-side assessment after synchronization. | Whole candidate policy. | MIPU. |
Table 6.
Studied component combinations, their intervention targets, and the residual effects addressed.
Table 6.
Studied component combinations, their intervention targets, and the residual effects addressed.
| Study | Combined components | Mechanistic connection |
|---|---|---|
| QuRL [5] | Update-aware quantization (A2) and adaptive clipping (B2). | Make parameter changes visible to the sampler and reshape the learner’s update constraint. |
| QaRL [6] | Aligned QAT (A1) and TBPO (B2). | Reduce representational disagreement, then constrain problematic response-level updates. |
| QUADS [8] | Weight QAT (A1) and residual activation compensation (A2). | Weight alignment leaves activation error for a separate numerical component. |
| KV4-RL [17] | Selective cache protection (A2) with retained TIS. | Improve the data-generating path while holding a bounded conditional correction in the recipe. |
| TRACE [13] | Guided QAT (A1), routing replay, and token-ratio correction. | Couple rounding outcomes while separately addressing route choices and residual off-policy effects. |
| Score Centering [10] | Centering composed with TIS or MIS (B1). | Center the corresponding weighted score; reconstruction and regularization determine the remaining bias. |
Table 7.
Representative execution regimes across the intervention families. The selection separates arithmetic, quantization target, and collection context; QAT alone does not specify native low-precision arithmetic.
Table 7.
Representative execution regimes across the intervention families. The selection separates arithmetic, quantization target, and collection context; QAT alone does not specify native low-precision arithmetic.
| Study | Learner computation | Rollout target and arithmetic | Execution context |
|---|---|---|---|
| Jet-RL [3] | FP8 GEMMs under shared precision flow. | FP8 execution coordinated with the learner. | Step-wise weight transfer; vLLM / verl implementation. |
| FP8-RL [4] | Higher-precision learner; v2 also explores end-to-end FP8. | Native W8A8 linear layers; FP8 attention / KV extensions. | Repeated QKV-scale calibration as the policy changes. |
| QaRL [6] | Rollout-aligned fake quantization. | W8A8 or W4A16; additional W4A8 ablation. | Weight/activation study; KV quantization is excluded. |
| HiFloat4 [24] | QAT evaluated through FP4 simulation. | HiFloat4 / MXFP4 with activation-side correction. | Simulated experiments; no measured native-FP4 speedup. |
| ScoreCentering [10] | BF16; reconstructed behavior law for correction. | Quantization stress includes FP4 KV and INT8 W/A with INT4 KV. | Quantization and policy-lag tests are separate. |
| TRACE [13] | Guided fake-quantized forward; BF16 backward. | Native NVFP4 routed-expert W4A4 and softmax KV4; other modules BF16. | Asynchronous collection; routing replay and correction retained. |
| TRIAGE [12] | Native NVFP4 W4A4 forward. | Native W4A4; BF16 KV in the documented characterization. | Synchronous math RL; KV4 is not evaluated. |
| KV4-RL [17] | BF16 learner. | INT4 KV with bounded INT8 protection. | Quota-based partial collection; generation and learning alternate. |
Table 8.
Reading learning trajectories. Definitions illustrate common conventions; the source policy and reduction determine the logged quantity.
Table 8.
Reading learning trajectories. Definitions illustrate common conventions; the source policy and reduction determine the logged quantity.
| Quantity | What it measures | What it does not establish |
|---|---|---|
| Policy entropy H | for a specified next-token policy, subsequently aggregated over prefixes. | A lower value need not indicate better learning. A label such as entropy loss does not establish that entropy regularization is active. |
| Mean reward | over B sampled responses. With strictly binary correctness reward, it is the sampled correctness rate. | It is not the group-normalized advantage, a held-out benchmark score, or an invariant scale across reward functions. |
| Mean absolute gap G | Magnitude of learner–behavior disagreement on valid sampled tokens; Equation (6). | It removes sign and local concentration; it is neither KL divergence nor proof of estimator fidelity or policy quality. |
Table 10.
Information requirements and added resource demands. Costs arise from acquiring, retaining, or evaluating the information used by each intervention.
Table 10.
Information requirements and added resource demands. Costs arise from acquiring, retaining, or evaluating the information used by each intervention.
| Approach | Information or execution dependency | Added resource demand |
|---|---|---|
| TIS / AIS / CIS | Behavior probabilities and learner/proximal probabilities | Per-token probability storage and transfer; probabilities must include sampling transformations. |
| Score Centering | A behavior-weighted score expectation, exact or approximated | Distributional evaluation or reconstruction adds work; approximation trades that work against error. |
| Aligned QAT / shared precision | Matching quantization and conversion rules across endpoints | Precision exceptions, kernels, and weight export form part of the configuration. |
| Guided rounding | Realized rollout-side quantization information | Storage and communication of guidance, with state matching and reconstruction during learning. |
| Calibrated Clipping [11] | Higher-precision reference ratios at calibration points | Reference passes add training computation, amortized across calibration intervals. |
| Batch-adaptive control [21] | Policy-ratio statistics aggregated over the batch | Reduction rules and the sampled batch determine the reliability estimate. |
| Inference-policy acceptance [23] | Assessment of the synchronized candidate | Candidate evaluation and possible rollback add work beyond learner updates. |
| Selective KV precision | Low-bit cache execution with protected positions | Protected positions add work whose share depends on the context workload. |
Disclaimer/Publisher’s Note: The statements, opinions and data contained in all publications are solely those of the individual author(s) and contributor(s) and not of MDPI and/or the editor(s). MDPI and/or the editor(s) disclaim responsibility for any injury to people or property resulting from any ideas, methods, instructions or products referred to in the content. |
© 2026 by the authors. Licensee MDPI, Basel, Switzerland. This article is an open access article distributed under the terms and conditions of the Creative Commons Attribution (CC BY) license (http://creativecommons.org/licenses/by/4.0/).
Copyright: This open access article is published under a Creative Commons CC BY 4.0 license, which permit the free download, distribution, and reuse, provided that the author and preprint are cited in any reuse.