
Submitted:
28 October 2026
Posted:
29 October 2026
You are already at the latest version
Preprints on COVID-19 and SARS-CoV-2
Abstract
Background: Older adults experienced a disproportionate burden of COVID-19 mortality, but national evidence is limited. We described COVID-19 mortality among adults aged ≥65 years (March 2020–December 2022) and vaccination coverage among adults aged ≥60 years (March 2021–December 2022). Methods: We conducted a retrospective national descriptive and ecological study using ONMNE mortality surveillance and aggregated EVAX vaccination data. We calculated mortality, age-standardized, and proportional mortality rates; vaccination coverage; dropout proportions; and no-show rates. Results: Of 29,306 COVID-19 deaths, 20,467 (69.8%) occurred among adults aged ≥65 years; 8,725 (42.6%) were aged ≥80 years and 11,463 (56.0%) were male. Cumulative mortality was 1,809.9 per 100,000, with the highest period-specific rate during Delta predominance (750.1 per 100,000). Coverage among adults aged ≥60 years was 95.4% for at least one dose, 88.3% for primary-schedule completion, and 38.4% for a third dose; cumulative uptake was 215.1 doses per 100. Coverage varied by governorate; no-show rates increased in 2022. Conclusions: Mortality was concentrated among the oldest-old and during Delta predominance. Coverage was high nationally but uneven geographically, and booster uptake and attendance declined. Targeted outreach and equitable access remain priorities.
Keywords:
older adults
; COVID-19
; SARS-CoV-2
; mortality
; vaccination coverage
; vaccine uptake
; vaccine hesitancy
; health disparities
; surveillance
; Tunisia
1. Introduction
The coronavirus disease 2019 (COVID-19) pandemic, caused by severe acute respiratory syndrome coronavirus 2 (SARS-CoV-2), placed unprecedented strain on health systems. By December 2022, COVID-19 had caused more than 6.7 million reported deaths worldwide, and older adults accounted for a substantial majority of them [1,2]. Older age is associated with severe disease, hospitalization, and death, largely because of immunosenescence, multimorbidity, and physiological frailty [3,4].
The rapid development and deployment of COVID-19 vaccines from late 2020 offered a critical tool to mitigate the pandemic. Global strategies guided by the World Health Organization (WHO) Strategic Advisory Group of Experts on Immunization prioritized vulnerable populations, especially older adults, to reduce severe outcomes and mortality [2,5]. People aged ≥60 years continued to account for more than 80% of deaths into 2021 [2,6]. In July 2022, WHO emphasized achieving high coverage with a complete primary series in vulnerable populations, particularly with the emergence of Variants of Concern (VOCs) such as Delta and Omicron [6].
Despite this consensus, disparities in vaccine availability, coverage, and acceptance led to unequal protection across regions and demographic groups [2,7]. Older adults in low- and middle-income countries faced compounded barriers, including limited mobility, rural residence, misinformation, and digital illiteracy [8,9,10].
In Tunisia, the pandemic unfolded in successive waves; by December 2022, more than 1.1 million confirmed cases and 29,306 deaths had been reported nationally [11]. The national vaccination campaign, launched in March 2021 through the EVAX platform, prioritized healthcare workers and adults aged ≥60 years because of limited supply, with progressive extension to the rest of the population [12].
According to Tunisia’s 2024 General Population and Housing Census, published by the National Institute of Statistics (INS) in 2025, the proportion of the population aged ≥60 years increased from 12% in 2014 to 17% in 2024, and the ageing index rose from 49.2% to 73.9% [13].
Given this rapid demographic ageing, characterizing COVID-19 mortality and vaccination in older Tunisians is essential for future emergency preparedness.
We used national surveillance data from March 2020 to December 2022 to: (1) describe the epidemiological profile of COVID-19 deaths among adults aged ≥65 years by person, place, and time; (2) examine variations across SARS-CoV-2 VOC predominance periods and epidemic waves; (3) describe vaccination uptake, coverage, multi-dose dropout, and appointment no-show rates among the target population aged ≥60 years; and (4) assess governorate-level equity and the ecological association between vaccination completion and age-standardized mortality across Tunisia’s 24 governorates.
2. Materials and Methods
2.1. Study Design, Setting, and Population
We conducted a retrospective, national, descriptive surveillance study with an ecological component, using data on reported COVID-19 deaths among individuals aged ≥65 years from 18 March 2020 (first recorded death) to 31 December 2022, and vaccination data among adults aged ≥60 years (the national campaign target population) from 13 March 2021 to 31 December 2022. The study covered all 24 governorates.
Tunisia comprises 24 administrative governorates grouped into six geographic regions: North-East (Tunis, Ariana, Ben Arous, Manouba, Nabeul, Zaghouan, Bizerte), North-West (Beja, Jendouba, Le Kef, Siliana), Centre-East (Sousse, Monastir, Mahdia, Sfax), Centre-West (Kairouan, Kasserine, Sidi Bouzid), South-East (Gabes, Medenine, Tataouine), and South-West (Gafsa, Tozeur, Kebili).
2.2. Case Definitions and Eligibility Criteria
We included all COVID-19 deaths among individuals aged ≥65 years notified to ONMNE between 18 March 2020 and 31 December 2022 that met national surveillance case definitions adapted from WHO, ECDC, and US CDC criteria [14,15]:
- Confirmed COVID-19 death: a decedent with clinical manifestations compatible with COVID-19 and a positive SARS-CoV-2 reverse transcription polymerase chain reaction (RT-PCR) or antigen rapid diagnostic test (Ag-RDT), performed antemortem or post-mortem, without an alternative direct cause of death.
- Probable COVID-19 death: a decedent with compatible clinical manifestations and suggestive thoracic computed tomography findings without virological confirmation, or a clinically certified COVID-19 death where diagnostic modalities were not specified, without an unrelated direct cause of death.
We excluded: (1) individuals who tested positive for SARS-CoV-2 but whose primary underlying cause of death was explicitly non-COVID-19 (e.g., trauma, suicide, or accidents); and (2) non-Tunisian nationals who died and were buried in Tunisia.
2.3. Operational Definitions
2.3.1. Older Adult Population
Consistent with Organisation for Economic Co-operation and Development (OECD) and WHO definitions, older adults were defined as individuals aged ≥65 years [16,17]. We stratified this population into four age groups [18,19]:
- 65–69 years (young-old)
- 70–74 years (middle-old)
- 75–79 years (older-old)
- ≥80 years (oldest-old)
2.3.2. Underlying Medical Conditions
Underlying conditions were defined as chronic diseases that did not directly cause death but coexisted with COVID-19. Multimorbidity was defined as ≥2 chronic conditions [20].
2.3.3. COVID-19 Mortality Indicators
The specific mortality rate (SMR) was the number of COVID-19 deaths among adults aged ≥65 years divided by the population aged ≥65 years, multiplied by 100,000. Age-specific mortality rates (ASpMR) used the corresponding age-group population as the denominator. Sex-specific mortality rates (GSMR) used the male or female population aged ≥65 years. The governorate-specific mortality rate (SGMR) used each governorate’s population aged ≥65 years.
The age-standardized mortality rate (ASMR) was calculated by direct standardization to the national population aged ≥65 years in January 2022, using the 65–69, 70–74, 75–79, and ≥80 years bands. The comparative mortality figure (CMF) was the ASMR of each governorate divided by the lowest governorate ASMR (Jendouba), a dimensionless ratio. Proportional mortality (PM) was the number of COVID-19 deaths in an age group divided by all-cause deaths in the same age group, multiplied by 100. Relative monthly variation (VR%) was the percentage change in deaths from the previous month.
2.3.4. SARS-CoV-2 Variant Predominance Periods
We divided the study period into four variant predominance phases based on national genomic surveillance data [21,22]:
- Wild-type circulation period: March 2020–February 2021
- Alpha VOC predominance period: March–May 2021
- Delta VOC predominance period: June–December 2021
- Omicron VOC predominance period: January–December 2022
2.3.5. Target Population for COVID-19 Vaccination
The national COVID-19 vaccination strategy, published in February 2021, was staggered because of limited vaccine supply and prioritized healthcare workers and adults aged ≥60 years [12,23]. On 20 March 2021, adults aged ≥75 years were targeted, followed by those aged ≥60 years on 19 April 2021. The initial goal was to give at least one dose to 50% of the target population by the end of 2021. EVAX data were available only for two age bands: 60–74 years and ≥75 years. The target population was estimated at 1,676,255 adults aged ≥60 years on 1 January 2022.
2.3.6. Vaccination Status and Dose Regimen
According to the national strategy, a person was considered fully vaccinated if they: (1) had a prior SARS-CoV-2 infection and received one vaccine dose ≥3 months later; (2) received two doses of a two-dose vaccine; or (3) received one dose of a single-dose vaccine [12].
Vaccines available in Tunisia during the study period included Pfizer-BioNTech, Moderna, AstraZeneca, CoronaVac, Sputnik V, and Sinopharm (two-dose regimens), and Janssen and Sputnik Light (single-dose regimens) [23].
2.3.7. Vaccination Indicators
We used WHO monitoring metrics [24,25]. Indicators were calculated monthly and cumulatively for adults aged ≥60 years; the target population denominator was 1,676,255 adults aged ≥60 years [26].
COV-1 was the proportion who received at least one dose; COV-2 the proportion who received at least two doses; COV-3 the proportion who received a third dose; and COV-C the proportion who completed the recommended schedule (one dose after prior infection, one dose of a single-dose vaccine, or two doses of a two-dose vaccine). Dropout was calculated as a positive proportion: [(COV-1 − COV-C)/COV-1] × 100, with analogous formulas for COV-1→COV-2 and COV-2→COV-3. Cumulative uptake was the total number of doses administered per 100 target population. The no-show rate was the proportion of invited individuals who did not attend a scheduled appointment.
2.4. Data Sources
2.4.1. Mortality Data
Individual, anonymized data on reported COVID-19 deaths were obtained from the ONMNE surveillance system for COVID-19 [11]. To improve completeness, ONMNE triangulated eight independent reporting streams: (1) 24 Regional Health Directorates; (2) the Strategic Health Operations Centre of the Ministry of Health; (3) public and private healthcare facilities; (4) the Crisis Cell of the Presidency of the Government; (5) the Directorate of Hygiene and Environmental Protection; (6) municipal burial registries; (7) active contact-tracing and case-follow-up teams at ONMNE; and (8) post-mortem laboratory registries confirming SARS-CoV-2 RT-PCR or Ag-RDT positivity.
Notifications were transmitted to ONMNE within 24 hours of death using a standardized rapid reporting form (Supplementary Annex S2). Variables included demographic characteristics (age, sex, governorate of residence), date and method of diagnosis, date and place of death, hospital ward, underlying conditions, and vaccination status.
Denominators for mortality indicators and all-cause mortality for 2020–2022 were provided by INS based on official population estimates as of 1 January 2022 [26].
2.4.2. Vaccination Data
Vaccination data were extracted from the national EVAX database managed by the Ministry of Health [23]. EVAX provided aggregated monthly figures for doses administered between 13 March 2021 and 31 December 2022 among adults aged ≥60 years, by age band (60–74, ≥75), sex, governorate, vaccine brand, and appointment adherence. Because of personal data protection regulations, individual-level linkage between EVAX and ONMNE records was not possible without a shared unique identifier [23].
2.5. Data Processing and Statistical Analysis
Categorical variables are presented as absolute frequencies and percentages. Continuous variables are expressed as mean ± standard deviation (SD) for normally distributed data or median with interquartile range (IQR; Q1–Q3) for skewed data.
We compared crude SGMR, directly age-standardized ASMR, CMF, COV-1, COV-C, and dropout across the 24 governorates. Ecological associations between governorate-level vaccination indicators and mortality were tested with Spearman rank correlation (rho) and Pearson correlation (r). Temporal correlations between monthly deaths among adults aged ≥65 years and no-show rates were assessed with Pearson correlation across the full period and by calendar year. All tests were two-tailed, and p ≤ 0.05 was considered statistically significant. We did not impute missing data; denominators for each indicator are reported. Analyses were performed in IBM SPSS Statistics 24.0 and independently replicated in Python 3.10 (pandas, geopandas, scipy.stats, numpy).
2.6. Ethical Considerations
Data collection was conducted under the legal mandate of the Ministry of Health and ONMNE for national infectious disease surveillance, in accordance with the Declaration of Helsinki. The use of anonymized surveillance data was authorized by the National Instance of Personal Data Protection (INPDP) of Tunisia on 30 November 2020 (authorization no.20/03-230). All records were de-identified before analysis. Individual informed consent was waived because this was a non-interventional, retrospective analysis of routinely collected surveillance data.
3. Results
3.1. COVID-19 Mortality
3.1.1. Epidemiological Profile of COVID-19 Deaths Among Adults Aged ≥65 Years
From March 2020 to December 2022, 29,306 COVID-19 deaths were reported nationally; 20,467 (69.8%) occurred among adults aged ≥65 years.
Mean age at death was 77.9 ± 8.0 years (range 65–112). The largest age group was ≥80 years (8,725 deaths; 42.6%). There were 11,463 male deaths (56.0%), a male-to-female ratio of 1.27.
Most deaths (18,708; 91.4%) occurred in a healthcare facility, mainly public hospitals (17,006; 90.9%). Among 9,176 hospitalized decedents with ward data, deaths occurred most often in COVID-19 isolation units (3,918; 42.7%), emergency rooms (2,141; 23.3%), and intensive care units (2,020; 22.0%). COVID-19 was confirmed in 17,221 (84.1%) decedents, predominantly by RT-PCR (13,338; 77.5% of confirmed cases). Since the start of the vaccination campaign, 14,340 COVID-19 deaths occurred; vaccination status was known for 1,729 (12.1%), of whom 958 (55.4%) were unvaccinated. Among 771 vaccinated decedents with known dose counts, 454 (59.0%) had received ≥2 doses. Medical history was available for 4,820 (23.6%) decedents; 4,596 (95.4%) had at least one underlying condition, and multimorbidity was reported in 2,392 (52.0%) of those with any condition. The most common conditions were hypertension (2,817; 61.3%), diabetes (2,285; 49.7%), and cardiovascular disease (936; 20.4%).
The overall COVID-19-specific mortality rate among adults aged ≥65 years was 1,809.9 per 100,000 over the study period. Age-specific mortality increased from 808.0 per 100,000 at 65–69 years to 4,373.3 per 100,000 at ≥80 years. Proportional mortality was highest at 70–74 years (14.8%) and lowest at ≥80 years (8.2%) (Table 1).
3.1.2. Spatiotemporal Analysis of COVID-19 Mortality
3.1.2.1. Geographic Distribution of Mortality
Mortality varied across the 24 governorates. Eleven governorates (45.8%) had SGMRs above the national average. The highest SGMRs were in Tataouine (2,827.0 per 100,000), Kasserine (2,703.8), and Kebili (2,703.0) (Figure 1).
After direct age standardization, eight governorates had a CMF at least 1.5 times that of the reference governorate (Jendouba; ASMR 1,351.1 per 100,000). The highest CMFs were in Kasserine (1.92), Tataouine (1.86), Gafsa (1.80), and Kebili (1.80) (Table 2).
3.1.2.2. Temporal Trends in Mortality
The largest annual number of deaths occurred in 2021 (14,400 deaths; 70.4%), with a mortality rate of 1,273.4 per 100,000 adults aged ≥65 years (Table 3).
The epidemic curve showed successive mortality waves. The second wave peaked in January 2021 (1,601 deaths). The third and largest wave occurred during the period of Delta predominance and peaked in July 2021 (3,553 deaths; rate 314.2 per 100,000). Two smaller waves occurred in 2022 (Figure 2). The median time from diagnosis to death was 3 days (IQR 0–10); among patients diagnosed before death (n = 13,572), it was 7 days (IQR 3–13).
3.1.2.3. Mortality by SARS-CoV-2 Variant of Concern Predominance Period
Mortality varied across the four VOC predominance periods (Table 4).
The period of Delta predominance (June–December 2021) accounted for 8,482 deaths (41.4%) and had a cumulative period-specific rate of 750.1 per 100,000. The Omicron period (January–December 2022) had 2,637 deaths (12.9%) and a rate of 233.2 per 100,000. Because periods differed in duration, we also calculated approximate annualized rates: 520.9 per 100,000 per year during wild-type circulation, 1,223.2 during Alpha predominance, 1,285.9 during Delta predominance, and 233.2 during Omicron predominance. Mortality was consistently highest in males and adults aged ≥80 years (Table 4).
- Wild-type circulation period (March 2020–February 2021): 5,890 deaths (28.8%); cumulative rate 520.9 per 100,000. Mortality was highest in Kebili, Tataouine, and Tozeur.
- Alpha predominance period (March–May 2021): 3,458 deaths (16.9%); cumulative rate 305.8 per 100,000. Kasserine, Kebili, and Tataouine had the highest rates.
- Delta predominance period (June–December 2021): 8,482 deaths (41.4%); cumulative rate 750.1 per 100,000. Kasserine, Gafsa, and Tataouine had the highest rates, and July 2021 had the highest monthly death count.
- Omicron predominance period (January–December 2022): 2,637 deaths (12.9%); cumulative rate 233.2 per 100,000. The geographic burden shifted, with Medenine, Tataouine, and Sfax reporting the highest rates.
3.2. COVID-19 Vaccination
3.2.1. Vaccination Indicators by Age and Sex
From March 2021 through December 2022, 3,605,682 COVID-19 vaccine doses were administered to the target population aged ≥60 years (n = 1,676,255), representing 27.1% of the 13,304,152 doses administered nationally and a cumulative uptake of 215.1 doses per 100 target population. Uptake was higher in males (226.5 per 100) than females (203.8 per 100). COV-1 reached 95.41% overall, with a male-to-female coverage ratio of 1.03. COV-C reached 88.33% overall, with a male-to-female ratio of 1.06 (Table 5).
The dropout proportion from COV-1 to COV-C was 7.42% overall and was higher in females (8.49%) than males (6.26%) (male-to-female ratio 0.74).
The dropout proportion from COV-1 to COV-2 was 19.96% overall (males 18.41%, females 21.40%; male-to-female ratio 0.86). Dropout from COV-2 to COV-3 was the highest (49.78%; males 45.24%, females 54.24%; ratio 0.83) (Table 5).
Among age groups, dropout from COV-1 to COV-2 was 20.19% at 60–74 years and 19.27% at ≥75 years. Females had higher dropout in both age groups (Table 6).
3.2.2. Vaccination by Governorate
Kairouan, Kasserine, Siliana, Jendouba, Tataouine, and Sidi Bouzid had the highest dropout proportions from COV-1 to COV-C (Table 7).
Ariana, Monastir, Sfax, Tozeur, Tunis, and Zaghouan had COV-1 above 99% and COV-C above 94% (Table 7).
The lowest COV-1 values were in Tataouine (68.93%), Kairouan (76.72%), Medenine (78.95%), Sidi Bouzid (79.84%), and Kebili (83.33%). These governorates, together with Siliana, had COV-C below 77.6% (Figure 5).
3.2.3. Vaccination Over Time
3.2.3.1. Cumulative Vaccine Uptake
From March to December 2021, vaccine uptake rose rapidly, with a peak of 567,367 new doses in June 2021 (33.85 doses per 100 target population that month). Cumulative uptake rose from 1.48 to 209.03 doses per 100 by December 2021. From January to June 2022, uptake continued to increase more slowly (Figure 6).
From June 2022 onward, monthly doses declined and cumulative uptake plateaued, reaching 215.1 doses per 100 by December 2022 (Figure 6).
3.2.3.2. Appointment No-Show Rate
No-show rates fluctuated among adults aged ≥60 years invited through EVAX from March 2021 to December 2022 (Figure 7).
In March 2021, the no-show rate was 22.38%; it declined to 4.04% by July 2021 and rose to 40.45% by December 2021. It peaked at 71.76% in January 2022 and generally increased during 2022, reaching 90.44% in November, with intermittent decreases in April and May 2022 (Figure 7).
No-show rates were negatively correlated with monthly COVID-19 deaths among adults aged ≥65 years over the full period (Pearson r = −0.631, p = 0.002).
In 2021, the correlation was strong and negative (r = −0.692, p = 0.02): months with more deaths had lower no-show rates (Figure 8).
In 2022, there was no significant correlation (r = −0.049, p = 0.87) (Figure 8).
4. Discussion
In this national descriptive and ecological study, adults aged ≥65 years accounted for 69.8% of reported COVID-19 deaths in Tunisia during 2020–2022. Mortality was highest among adults aged ≥80 years and during the period of Delta predominance. National vaccination coverage was high for at least one dose and primary-schedule completion, but substantial geographic and sex-related differences persisted; booster coverage was lower, and appointment no-show rates increased in 2022.
Adults aged ≥65 years accounted for approximately 70% of COVID-19 deaths, with an overall mortality rate of 1,809.9 per 100,000. Risk was highest among males, the oldest-old, and residents of socioeconomically disadvantaged governorates in central and southern Tunisia.
The deadliest period coincided with Delta predominance, when mortality reached its highest peak. Although national vaccination coverage was high, regional and sex-based disparities and declining adherence, particularly for booster doses, limited its impact.
4.1. Age, Male Sex and Pre-Existing Conditions as Drivers of COVID-19 Mortality
The elevated mortality among Tunisians aged ≥65 years is consistent with global evidence identifying advanced age as the strongest risk factor for severe COVID-19 [2,4,27].
Bonanad et al., in a meta-analysis of 611,583 patients from five national registries, found that age ≥80 years was associated with more than six times the odds of COVID-19 mortality compared with younger patients (OR 6.25, 95% CI 5.38–7.25; p < 0.001) [27].
In our population, age-specific mortality rose steeply from 808.0 per 100,000 at 65–69 years to 4,373.3 per 100,000 at ≥80 years. This pattern is consistent with studies from other low- and middle-income and high-income settings, although absolute rates differ by epidemic timing, health-system capacity, and vaccine access [28,29].
The disproportionate burden in older adults is multifactorial. Ageing compromises innate and adaptive immune responses, increasing vulnerability to severe infection [30]. Immunosenescence, characterized by disrupted innate and adaptive immunity, promotes inflammaging and impairs viral clearance [30,31,32].
Social and behavioural factors also contribute. Close contact with family members, social gatherings, and crowded living conditions facilitate transmission [33]. Social isolation, limited mobility, and difficulty accessing care may delay presentation and worsen outcomes [34].
The male predominance in mortality (male-to-female ratio 1.27) mirrors international observations [35,36,37] and patterns seen during SARS-CoV-1 and MERS-CoV outbreaks [38,39,40]. Experimental work in murine models also supports a biological basis [41].
Several mechanisms may explain male vulnerability: androgen-driven pathways, differential immune responses, higher ACE2 expression, and a greater prevalence of cardiometabolic comorbidities [35,37,41,42]. Low testosterone in older men may increase interleukin-6 expression and inflammation [43,44], and high ACE2 expression in the testes may facilitate viral entry and impair testosterone synthesis [41,43].
Older age, male sex, hypertension, and diabetes are independent predictors of COVID-19 mortality [45,46]. Hypertension approximately doubles mortality risk in large studies [47,48], possibly through endothelial dysfunction, vascular inflammation, and ACE2 upregulation; TLR-4 activation may further increase ACE2 expression and hyperinflammation [49]. Early concerns about RAAS inhibitors were not supported by later evidence [50,51]. Poor glycaemic control increases severity and mortality [52,53,54].
4.2. Subnational Disparities
Mortality was unevenly distributed. The highest crude SGMRs were in Tataouine, Kasserine, Kebili, Gafsa, and Tozeur, and the lowest in Ben Arous, Jendouba, Ariana, Nabeul, and Kairouan. After age standardization, the highest rates persisted in Kasserine, Tataouine, Gafsa, and Kebili, whereas some northern governorates (Ariana, Ben Arous, and Nabeul) moved up because of their older age structure. These patterns suggest that factors beyond age contributed to excess mortality in central and southern governorates, including geographic inequalities in testing and care, lower vaccination coverage, and socioeconomic disadvantage [22,55,56,57,58].
Local outbreaks linked to social gatherings and lower testing capacity early in the pandemic may have amplified transmission and delayed care [33,56]. Environmental and climatic factors may have modulated risk locally, but their contribution requires targeted study in Tunisia [59,60]. Genetic susceptibility (ACE2/TMPRSS2/HLA variants) has been hypothesized but remains unproven at the population level [61,62,63].
4.3. COVID-19 and All-Cause Mortality
National reports documented a rise in all-cause mortality from 2020 to 2021, with COVID-19 becoming the leading cause of death among older adults in 2021; in the 2021 INSP report, PM reached 38.6% at 65–74 years and 24.7% at ≥75 years [64,65]. In our 2020–2022 analysis, PM was highest at 70–74 years (14.8%) and lowest at ≥80 years (8.2%), likely because competing causes of death increase with age. Compared with the United States, Tunisia’s cumulative older-adult mortality was lower overall, but Tunisia experienced a larger peak in 2021 during Delta predominance; differences reflect demography, variant timing, health-system capacity, and vaccination trajectories [66].
4.4. Vaccination Coverage, Dropout and No-Show Trends
Nationally, coverage among adults aged ≥60 years was high (COV-1 95.4%; COV-C 88.3%) and among the stronger performances in low- and middle-income countries, yet marked subnational gaps persisted. Tataouine, Medenine, and Kebili had lower completion rates and high older-adult mortality [23]. Booster uptake fell sharply (COV-3 38.4%; dropout from COV-2 to COV-3 49.8%), and no-show rates rose in 2022, particularly among women and adults aged 60–74 years, reflecting waning perceived risk, vaccine fatigue, and access barriers [7,9,10].
4.5. Vaccination Coverage, Adherence, and Programmatic Implications
Tunisia’s national campaign, launched in March 2021 through EVAX, prioritized healthcare workers and older adults and achieved high headline coverage among adults aged ≥60 years by December 2022. This rapid initial uptake reflects early prioritization, centralized appointment systems, and substantial campaign effort during 2021.
Despite strong national averages, completion and booster coverage varied markedly between governorates. Several southern and central governorates (e.g., Tataouine, Medenine, and Kebili) had low COV-C and high older-adult mortality. Males had higher first-dose and completion coverage than females, while adults aged 60–74 years had higher dropout between doses than those aged ≥75 years. These patterns are consistent with international findings linking socioeconomic disadvantage, lower health-service access, and social determinants to lower vaccine uptake [7,9].
Adherence declined across successive doses. Dropout from COV-1 to COV-2 was about 20% overall, and the largest attrition occurred between COV-2 and COV-3 (about 50%). No-show rates were low during mortality peaks and rose substantially in 2022, exceeding 70–90% in late months. The negative temporal association in 2021 suggests that perceived risk influenced attendance; as mortality fell during Omicron predominance and vaccine fatigue set in, booster demand dropped. These dynamics suggest that high initial uptake alone is insufficient to maintain long-term protection in vulnerable groups [67,68]. A Tunisian test-negative case–control study found high COVID-19 vaccine effectiveness against severe outcomes when the full schedule was completed [69].
Contributing factors are multifactorial and actionable:
- Perceived lower threat during Omicron predominance and decreasing risk salience.
- Vaccine fatigue and safety concerns amplified by misinformation.
- Practical access barriers: limited transport, mobility constraints, caregiving duties, and the digital divide affecting EVAX registration and appointment attendance.
- Subnational service gaps, where fewer fixed sites and less outreach created logistical hurdles.
- Differential vaccine acceptability by product, including higher dropout during periods of product-specific controversy [70].
These drivers particularly affected women and residents in remote governorates.
4.6. Strengths and Limitations
The main strength of this study is its use of comprehensive national surveillance data, which provides a broad overview of the pandemic’s impact on older adults in Tunisia. However, several limitations must be acknowledged. First, this was a retrospective descriptive surveillance study with an ecological component; the governorate- and month-level correlations cannot establish causality or individual-level risk. Second, under-ascertainment of deaths is possible despite multiple reporting streams, and changes in testing, case definitions, and death certification over time may have affected counts. Third, vaccination status was known for only 12.1% of deaths after the campaign began, and the 55.4% unvaccinated proportion applies only to this selected subset, which is vulnerable to ascertainment bias; vaccinated individuals may have been more completely recorded through EVAX. Fourth, underlying conditions were available for only 23.6% of decedents. Fifth, the absence of a unique patient identifier prevented linkage between EVAX and ONMNE records. Sixth, coverage estimates above 100% in some age groups and governorates reflect underestimation of the denominator, population movement, duplicate or late registrations, or vaccination of non-residents, and should not be interpreted as true coverage. Seventh, the target population for vaccination (≥60 years) differs from the mortality population (≥65 years), and EVAX provided only two age bands. Eighth, variant periods were based on population-level genomic surveillance, not individual variant confirmation. Finally, direct standardization used the January 2022 national population as the standard; results may differ with other standards, and small governorate populations produced unstable age-specific rates.
5. Conclusions
COVID-19 mortality in Tunisia during 2020–2022 disproportionately affected adults aged ≥65 years, especially those aged ≥80 years. Mortality varied by governorate and peaked during Delta predominance. Although first-dose coverage and primary-schedule completion were high nationally, coverage varied geographically and by sex, and booster uptake and appointment attendance declined. Targeted outreach, accessible vaccination services, and locally tailored communication may help address these gaps. The ecological design and substantial missingness in vaccination status among decedents preclude individual-level conclusions about vaccine protection or causal relationships between vaccination and mortality.
Supplementary Materials
The following supporting information can be downloaded at the website of this paper posted on Preprints.org: Annex S1, summary of the national SARS-CoV-2 genomic surveillance strategy (in French); Annex S2, rapid declaration form for a COVID-19 death (in French); Annex S3, Pearson correlation method; Annex S4, monthly COVID-19 deaths and cumulative vaccine uptake by mortality wave and VOC predominance period.
Author Contributions
Conceptualization, F.Z., M.S. and N.B.B.A.; methodology, F.Z., S.D., A.H. and H.L.; formal analysis, F.Z.; data curation, F.Z., R.M., C.B., L.B., S.D. and A.Z.; writing—original draft preparation, F.Z.; writing—review and editing, all authors; supervision, M.S. and N.B.B.A. All authors have read and agreed to the published version of the manuscript.
Funding
This research received no external funding.
Institutional Review Board Statement
The study was conducted in accordance with the Declaration of Helsinki and was authorized by the National Instance of Personal Data Protection (INPDP) of Tunisia on 30 November 2020 (authorization no. 20/03-230).
Informed Consent Statement
Individual informed consent was waived because the study was a non-interventional, retrospective analysis of routinely collected, anonymized surveillance data.
Data Availability Statement
The aggregated data presented in this study are available from the corresponding author upon reasonable request and with permission of ONMNE and the Ministry of Health. Individual-level data are not publicly available because of privacy and legal restrictions.
Acknowledgments
The authors thank the regional and local health teams, the ONMNE COVID-19 mortality surveillance team, the EVAX team, and the laboratories of the Institut Pasteur de Tunis, Charles Nicolle Hospital, Fattouma Bourguiba Hospital (Monastir), and Habib Bourguiba Hospital (Sfax) for their contribution to data collection, case investigation, and genomic surveillance.
Conflicts of Interest
The authors declare no conflicts of interest.
Abbreviations
ASMR, age-standardized mortality rate; ASpMR, age-specific mortality rate; CMF, comparative mortality figure; COV-1/2/3/C, coverage with at least one/two/three doses or a complete schedule; EVAX, national COVID-19 vaccination platform; GSMR, sex-specific mortality rate; INS, National Institute of Statistics; IQR, interquartile range; ONMNE, National Observatory of New and Emerging Diseases; PM, proportional mortality; SGMR, governorate-specific mortality rate; SMR, specific mortality rate; VOC, variant of concern.
References
- World Health Organization. WHO Coronavirus (COVID-19) Dashboard. Available online: https://covid19.who.int (accessed on 7 December 2023).
- Wong, M.K.; Brooks, D.J.; Ikejezie, J.; Gacic-Dobo, M.; Dumolard, L.; Nedelec, Y.; Steulet, C.; Kassamali, Z.; Acma, A.; Ajong, B.N.; et al. COVID-19 Mortality and Progress Toward Vaccinating Older Adults — World Health Organization, Worldwide, 2020–2022. MMWR Morb. Mortal. Wkly. Rep. 2023, 72, 113–118. [Google Scholar] [CrossRef] [PubMed]
- Abul, Y.; Leeder, C.; Gravenstein, S. Epidemiology and Clinical Presentation of COVID-19 in Older Adults. Infect. Dis. Clin. N. Am. 2023, 37, 1–26. [Google Scholar] [CrossRef] [PubMed]
- Lebrasseur, A.; Fortin-Bédard, N.; Lettre, J.; Raymond, E.; Bussières, E.-L.; Lapierre, N.; Faieta, J.; Vincent, C.; Duchesne, L.; Ouellet, M.-C.; et al. Impact of the COVID-19 Pandemic on Older Adults: Rapid Review. JMIR Aging 2021, 4, e26474. [Google Scholar] [CrossRef] [PubMed]
- World Health Organization. WHO SAGE Roadmap for Prioritizing Uses of COVID-19 Vaccines in the Context of Limited Supply: An Approach to Inform Planning and Subsequent Recommendations Based upon Epidemiologic Setting and Vaccine Supply Scenarios, 20 October 2020; WHO/2019-nCoV/Vaccines/SAGE/Prioritization/2020.1; World Health Organization: Geneva, Switzerland, 2020; Available online: https://iris.who.int/handle/10665/341445 (accessed on 26 January 2024).
- World Health Organization. WHO SAGE Roadmap on Uses of COVID-19 Vaccines in the Context of Omicron and Substantial Population Immunity; WHO/2019-nCoV/Vaccines/SAGE/Prioritization/2023.1; World Health Organization: Geneva, Switzerland, 2023; Available online: https://iris.who.int/handle/10665/366671 (accessed on 26 January 2024).
- Nafilyan, V.; Dolby, T.; Razieh, C.; Gaughan, C.H.; Morgan, J.; Ayoubkhani, D.; Walker, S.; Khunti, K.; Glickman, M.; Yates, T. Sociodemographic inequality in COVID-19 vaccination coverage among elderly adults in England: a national linked data study. BMJ Open 2021, 11, e053402. [Google Scholar] [CrossRef] [PubMed]
- Amnesty International. Tunisia: Barriers to COVID-19 Vaccines Expose Stark Disparities in Access to Health; Amnesty International: London, UK, 2022; Available online: https://www.amnesty.org/en/latest/news/2022/04/tunisia-barriers-to-covid-19-vaccines-expose-stark-disparities-in-access-to-health/ (accessed on 29 January 2024).
- Boing, A.F.; Boing, A.C.; Barberia, L.; Borges, M.E.; Subramanian, S. Uncovering inequities in Covid-19 vaccine coverage for adults and elderly in Brazil: A multilevel study of 2021–2022 data. Vaccine 2023, 41, 3937–3945. [Google Scholar] [CrossRef] [PubMed]
- Pian, W.; Chi, J.; Ma, F. The causes, impacts and countermeasures of COVID-19 “Infodemic”: A systematic review using narrative synthesis. Inf. Process. Manag. 2021, 58, 102713. [Google Scholar] [CrossRef] [PubMed]
- National Observatory for New and Emerging Diseases; Ministry of Health. COVID-19 in Numbers: Key Figures Updated. Available online: https://www.onmne.tn/category/covid-19/ (accessed on 13 November 2023).
- Ministry of Health. National Strategy of COVID-19 Vaccination in Tunisia; Ministry of Health: Tunis, Tunisia, 2022. [Google Scholar]
- National Institute of Statistics. General Population and Housing Census 2024 Report; National Institute of Statistics: Tunis, Tunisia, 2025; Available online: https://www.ins.tn/enquetes/recensement-general-de-la-population-et-de-lhabitat-2024 (accessed on 13 October 2026).
- National Observatory for New and Emerging Diseases; Ministry of Health. COVID-19: Definitions, Guidelines, and Recommendations; ONMNE: Tunis, Tunisia, 2021. [Google Scholar]
- World Health Organization. WHO COVID-19: Case Definitions; World Health Organization: Geneva, Switzerland, 2020. [Google Scholar]
- OECD. Elderly Population; Organisation for Economic Co-operation and Development: Paris, France, 2014; Available online: https://www.oecd-ilibrary.org/social-issues-migration-health/elderly-population/indicator/english_8d805ea1-en (accessed on 8 March 2024).
- World Health Organization. Definition of an Older or Elderly Person; World Health Organization: Geneva, Switzerland, 2013. [Google Scholar]
- Lee, S.B.; Oh, J.H.; Park, J.H.; Choi, S.P.; Wee, J.H. Differences in youngest-old, middle-old, and oldest-old patients who visit the emergency department. Clin. Exp. Emerg. Med. 2018, 5, 249–255. [Google Scholar] [CrossRef] [PubMed]
- Wu, Q.; Gu, D. Oldest-Old Adults. In Encyclopedia of Gerontology and Population Aging; 2021; pp. 3637–3653. [Google Scholar] [CrossRef]
- Johnston, M.C.; Crilly, M.; Black, C.; Prescott, G.J.; Mercer, S.W. Defining and measuring multimorbidity: a systematic review of systematic reviews. Eur. J. Public Health 2018, 29, 182–189. [Google Scholar] [CrossRef] [PubMed]
- National Observatory for New and Emerging Diseases; Ministry of Health. Summary of the National Genomic Surveillance Strategy for SARS-CoV-2 in Tunisia; ONMNE: Tunis, Tunisia, 2021. [Google Scholar]
- Neffati, A.; Safer, M.; Kalai, W.; Hechaichi, A.; Dhaouadi, S.; Letaief, H.; Aichouch, C.; Bouabid, L.; Darouiche, S.; El Mili, N.; et al. Genomic Surveillance of SARS-CoV-2: Data Analysis and Assessment of Tunisian Strategy from January 2021 to February 2022. Epidemiologia 2024, 5, 80–89. [Google Scholar] [CrossRef] [PubMed]
- EVAX Platform; Ministry of Health. EVAX Platform: COVID-19 Vaccination Data for Individuals Aged 60 and More in Tunisia, March 2021–December 2022. 2023. Available online: https://www.evax.tn/vaccinationOD.html (accessed on 30 August 2023).
- World Health Organization; UNICEF. Monitoring COVID-19 Vaccination: Considerations for the Collection and Use of Vaccination Data: Interim Guidance, 3 March 2021; WHO/2019-nCoV/vaccination/monitoring/2021.1; World Health Organization: Geneva, Switzerland, 2021; Available online: https://apps.who.int/iris/handle/10665/339993 (accessed on 30 August 2023).
- World Health Organization. Monitoring COVID-19 Vaccination: Considerations for the Collection and Use of Vaccination Data. 2023. Available online: https://www.who.int/publications-detail-redirect/monitoring-covid-19-vaccination-interim-guidance (accessed on 2 November 2023).
- National Institute of Statistics. National Population Estimates in Tunisia; INS: Tunis, Tunisia, 2022. [Google Scholar]
- Bonanad, C.; García-Blas, S.; Tarazona-Santabalbina, F.; Sanchis, J.; Bertomeu-González, V.; Fácila, L.; Ariza, A.; Núñez, J.; Cordero, A. The Effect of Age on Mortality in Patients With COVID-19: A Meta-Analysis With 611,583 Subjects. J. Am. Med. Dir. Assoc. 2020, 21, 915–918. [Google Scholar] [CrossRef] [PubMed]
- Alves, V.P.; Casemiro, F.G.; Araujo, B.G.D.; Lima, M.A.D.S.; Oliveira, R.S.D.; Fernandes, F.T.D.S.; Gomes, A.V.C.; Gregori, D. Factors Associated with Mortality among Elderly People in the COVID-19 Pandemic (SARS-CoV-2): A Systematic Review and Meta-Analysis. Int. J. Environ. Res. Public Health 2021, 18, 8008. [Google Scholar] [CrossRef] [PubMed]
- Parra, P.N.B.; Atanasov, V.; Whittle, J.; Meurer, J.; Luo, Q.; Zhang, R.; et al. The Effect of the COVID-19 Pandemic on the Elderly: Population Fatality Rates, COVID Mortality Percentage, and Life Expectancy Loss. Elder. Law J. 2022, 30, 33–80. [Google Scholar] [PubMed]
- Perrotta, F.; Corbi, G.; Mazzeo, G.; Boccia, M.; Aronne, L.; D’Agnano, V.; Komici, K.; Mazzarella, G.; Parrella, R.; Bianco, A. COVID-19 and the elderly: insights into pathogenesis and clinical decision-making. Aging Clin. Exp. Res. 2020, 32, 1599–1608. [Google Scholar] [CrossRef] [PubMed]
- Domingues, R.; Lippi, A.; Setz, C.; Outeiro, T.F.; Krisko, A. SARS-CoV-2, immunosenescence and inflammaging: partners in the COVID-19 crime. Aging 2020, 12, 18778–18789. [Google Scholar] [CrossRef] [PubMed]
- Witkowski, J.M.; Fulop, T.; Bryl, E. Immunosenescence and COVID-19. Mech. Ageing Dev. 2022, 204, 111672. [Google Scholar] [CrossRef] [PubMed]
- Safer, M.; Letaief, H.; Hechaichi, A.; Harizi, C.; Dhaouadi, S.; Bouabid, L.; Darouiche, S.; Gharbi, D.; Elmili, N.; Ben Salah, H.; et al. Identification of transmission chains and clusters associated with COVID-19 in Tunisia. BMC Infect. Dis. 2021, 21. [Google Scholar] [CrossRef] [PubMed]
- Oran, D.P.; Topol, E.J. The Proportion of SARS-CoV-2 Infections That Are Asymptomatic. Ann. Intern. Med. 2021, 174, 655–662. [Google Scholar] [CrossRef] [PubMed]
- Li, G.; Liu, Y.; Jing, X.; Wang, Y.; Miao, M.; Tao, L.; Zhou, Z.; Xie, Y.; Huang, Y.; Lei, J.; et al. Mortality risk of COVID-19 in elderly males with comorbidities: a multi-country study. Aging 2020, 13, 27–60. [Google Scholar] [CrossRef] [PubMed]
- Galbadage, T.; Peterson, B.M.; Awada, J.; Buck, A.S.; Ramirez, D.A.; Wilson, J.; Gunasekera, R.S. Systematic Review and Meta-Analysis of Sex-Specific COVID-19 Clinical Outcomes. Front. Med. 2020, 7. [Google Scholar] [CrossRef] [PubMed]
- Twitchell, D.K.; Christensen, M.B.; Hackett, G.; Morgentaler, A.; Saad, F.; Pastuszak, A.W. Examining Male Predominance of Severe COVID-19 Outcomes: A Systematic Review. Androg. Clin. Res. Ther. 2022, 3. [Google Scholar] [CrossRef] [PubMed]
- Karlberg, J. Do Men Have a Higher Case Fatality Rate of Severe Acute Respiratory Syndrome than Women Do? Am. J. Epidemiol. 2004, 159, 229–231. [Google Scholar] [CrossRef] [PubMed]
- Matsuyama, R.; Nishiura, H.; Kutsuna, S.; Hayakawa, K.; Ohmagari, N. Clinical determinants of the severity of Middle East respiratory syndrome (MERS): a systematic review and meta-analysis. BMC Public Health 2016, 16. [Google Scholar] [CrossRef] [PubMed]
- Zhu, Z.; Lian, X.; Su, X.; Wu, W.; Marraro, G.A.; Zeng, Y. From SARS and MERS to COVID-19: a brief summary and comparison of severe acute respiratory infections caused by three highly pathogenic human coronaviruses. Respir. Res. 2020, 21. [Google Scholar] [CrossRef] [PubMed]
- Channappanavar, R.; Fett, C.; Mack, M.; Ten Eyck, P.P.; Meyerholz, D.K.; Perlman, S. Sex-Based Differences in Susceptibility to Severe Acute Respiratory Syndrome Coronavirus Infection. J. Immunol. 2017, 198, 4046–4053. [Google Scholar] [CrossRef] [PubMed]
- Chappell, M.C. Renin-Angiotensin System and Sex Differences in COVID-19: A Critical Assessment. Circ. Res. 2023, 132, 1320–1337. [Google Scholar] [CrossRef] [PubMed]
- Papadopoulos, V.; Li, L.; Samplaski, M. Why does COVID-19 kill more elderly men than women? Is there a role for testosterone? Andrology 2020, 9, 65–72. [Google Scholar] [CrossRef] [PubMed]
- STÁRKA, L.; DUŠKOVÁ, M. Androgens in SARS-CoV-2 Coronavirus Infections. Physiol. Res. 2021, S145–S151. [Google Scholar] [CrossRef] [PubMed]
- Wu, Z.; McGoogan, J.M. Characteristics of and Important Lessons From the Coronavirus Disease 2019 (COVID-19) Outbreak in China. JAMA 2020, 323, 1239. [Google Scholar] [CrossRef] [PubMed]
- Leung, C. Risk factors for predicting mortality in elderly patients with COVID-19: A review of clinical data in China. Mech. Ageing Dev. 2020, 188, 111255. [Google Scholar] [CrossRef] [PubMed]
- Bepouka, B.; Situakibanza, H.; Sangare, M.; Mandina, M.; Mayasi, N.; Longokolo, M.; Odio, O.; Mangala, D.; Isekusu, F.; Kayembe, J.M.; et al. Mortality associated with COVID-19 and hypertension in sub-Saharan Africa. A systematic review and meta-analysis. J. Clin. Hypertens. 2022, 24, 99–105. [Google Scholar] [CrossRef] [PubMed]
- Al-Qudimat, A.R.; Ameen, A.; Sabir, D.M.; Alkharraz, H.; Elaarag, M.; Althani, A.; Singh, K.; Alhimoney, W.M.; Al-Zoubi, R.M.; Aboumarzouk, O.M. The Association of Hypertension with Increased Mortality Rate During the COVID-19 Pandemic: An Update with Meta-analysis. J. Epidemiol. Glob. Health 2023, 13, 495–503. [Google Scholar] [CrossRef] [PubMed]
- Aboudounya, M.M.; Heads, R.J. COVID-19 and Toll-Like Receptor 4 (TLR4): SARS-CoV-2 May Bind and Activate TLR4 to Increase ACE2 Expression, Facilitating Entry and Causing Hyperinflammation. Mediat. Inflamm. 2021, 2021. [Google Scholar] [CrossRef] [PubMed]
- Ssentongo, A.E.; Ssentongo, P.; Heilbrunn, E.S.; Lekoubou, A.; Du, P.; Liao, D.; et al. Renin-Angiotensin-Aldosterone System Inhibitors and the Risk of Mortality in Patients with Hypertension Hospitalised for COVID-19: Systematic Review and Meta-Analysis. Open Heart 2020, 7, e001353. Available online: https://www.ncbi.nlm.nih.gov/pmc/articles/PMC7646321 (accessed on 16 January 2024). [CrossRef] [PubMed]
- Loader, J.; Lampa, E.; Gustafsson, S.; Cars, T.; Sundström, J. Renin-Angiotensin Aldosterone System Inhibitors in Primary Prevention and COVID-19. J. Am. Heart Assoc. 2021, 10. [Google Scholar] [CrossRef] [PubMed]
- Singh, A.K.; Gupta, R.; Ghosh, A.; Misra, A. Diabetes in COVID-19: Prevalence, pathophysiology, prognosis and practical considerations. Diabetes Metab. Syndr. 2020, 14, 303–310. [Google Scholar] [CrossRef] [PubMed]
- Zhang, P.; Wang, M.; Wang, Y.; Wang, Y.; Li, T.; Zeng, J.; Wang, L.; Li, C.; Gong, Y. Risk factors associated with the progression of COVID-19 in elderly diabetes patients. Diabetes Res. Clin. Pract. 2021, 171, 108550. [Google Scholar] [CrossRef] [PubMed]
- Tzeravini, E.; Stratigakos, E.; Siafarikas, C.; Tentolouris, A.; Tentolouris, N. The Role of Diabetes and Hyperglycemia on COVID-19 Infection Course—A Narrative Review. Front. Clin. Diabetes Healthc. 2022, 3. [Google Scholar] [CrossRef] [PubMed]
- Chouikha, A.; Fares, W.; Laamari, A.; Haddad-Boubaker, S.; Belaiba, Z.; Ghedira, K.; Kammoun Rebai, W.; Ayouni, K.; Khedhiri, M.; Ben Halima, S.; et al. Molecular Epidemiology of SARS-CoV-2 in Tunisia (North Africa) through Several Successive Waves of COVID-19. Viruses 2022, 14, 624. [Google Scholar] [CrossRef] [PubMed]
- Chaari, L.; Golubnitschaja, O. Covid-19 pandemic by the “real-time” monitoring: the Tunisian case and lessons for global epidemics in the context of 3PM strategies. EPMA J. 2020, 11, 133–138. [Google Scholar] [CrossRef] [PubMed]
- Jmaa, M.B.; Ayed, H.B.; Kassis, M.; Hmida, M.B.; Trigui, M.; Maamri, H.; Ketata, N.; Yaich, S.; Trabelsi, J.; Mejdoub, Y.; et al. Epidemiological profile and performance of triage decision-making process of COVID-19 suspected cases in southern Tunisia. Afr. J. Emerg. Med. 2022, 12, 1–6. [Google Scholar] [CrossRef] [PubMed]
- Wells, C.R.; Galvani, A.P. The Global Impact of Disproportionate Vaccination Coverage on COVID-19 Mortality. Lancet Infect. Dis. 2022, 22, 1254–1255. [Google Scholar] [CrossRef] [PubMed]
- Chekir, N.; Ben Salem, Y. What is the relationship between the coronavirus crisis and air pollution in Tunisia? Euro-Mediterr. J. Environ. Integr. 2020, 6. [Google Scholar] [CrossRef] [PubMed]
- Copat, C.; Cristaldi, A.; Fiore, M.; Grasso, A.; Zuccarello, P.; Signorelli, S.S.; Conti, G.O.; Ferrante, M. The role of air pollution (PM and NO2) in COVID-19 spread and lethality: A systematic review. Environ. Res. 2020, 191, 110129. [Google Scholar] [CrossRef] [PubMed]
- Baroudi, T.; Bouhaha, R.; Moran-Moguel, C.; Sanchez-Corona, J.; Ben Maiz, H.; Kammoun Abid, H.; Benammar-Elgaaied, A. Association of the insertion/deletion polymorphism of the angiotensin-converting enzyme gene with type 2 diabetes in two ethnic groups of Jerba Island in Tunisia. J. Renin Angiotensin Aldosterone Syst. 2009, 10, 35–40. [Google Scholar] [CrossRef] [PubMed]
- Migliorini, F.; Torsiello, E.; Spiezia, F.; Oliva, F.; Tingart, M.; Maffulli, N. Association between HLA genotypes and COVID-19 susceptibility, severity and progression: a comprehensive review of the literature. Eur. J. Med. Res. 2021, 26. [Google Scholar] [CrossRef] [PubMed]
- Monticelli, M.; Hay Mele, B.; Benetti, E.; Fallerini, C.; Baldassarri, M.; et al. Protective Role of a TMPRSS2 Variant on Severe COVID-19 Outcome in Young Males and Elderly Women. Genes 2021, 12, 596. [Google Scholar] [CrossRef] [PubMed]
- National Institute of Health, Ministry of Health. National Statistics on Causes of Death in Tunisia 2020. INSP: Tunis, Tunisia, 2021. [Google Scholar]
- National Institute of Health, Ministry of Health. National Statistics on Causes of Death in Tunisia 2021. INSP: Tunis, Tunisia, 2024. [Google Scholar]
- Centers for Disease Control and Prevention. Provisional COVID-19 Deaths by Sex and Age. Available online: https://data.cdc.gov/NCHS/Provisional-COVID-19-Deaths-by-Sex-and-Age/9bhg-hcku/about_data (accessed on 4 April 2024).
- Ferrante, P. The First Year of COVID-19 in Italy: Incidence, Lethality, and Health Policies. J. Public Health Res. 2022, 11. [Google Scholar] [CrossRef] [PubMed]
- Plans-Rubió, P. Percentages of Vaccination Coverage Required to Establish Herd Immunity against SARS-CoV-2. Vaccines 2022, 10, 736. [Google Scholar] [CrossRef] [PubMed]
- Mziou, E.; Hchaichi, A.; Letaief, H.; Dhaouadi, S.; Safer, M.; Talmoudi, K.; et al. Vaccine Effectiveness against COVID-19: A Test Negative Case-Control Study in Tunisia, August 2021. Vaccine 2024, 42, 1738–1744. [Google Scholar] [CrossRef] [PubMed]
- Park, A. Why Countries Around the World Are Suspending Use of AstraZeneca’s COVID-19 Vaccine; TIME: New York, NY, USA, 2021; Available online: https://time.com/5947134/astrazeneca-covid-vaccine-stopped/ (accessed on 29 January 2024).
Figure 1.
Governorate-specific COVID-19 mortality rate (SGMR) per 100,000 adults aged ≥65 years, Tunisia, 2020–2022 (n = 20,467). Governorates are ranked from highest (top) to lowest (bottom) SGMR; the dashed line indicates the national rate (1,809.9 per 100,000).
Figure 1.
Governorate-specific COVID-19 mortality rate (SGMR) per 100,000 adults aged ≥65 years, Tunisia, 2020–2022 (n = 20,467). Governorates are ranked from highest (top) to lowest (bottom) SGMR; the dashed line indicates the national rate (1,809.9 per 100,000).
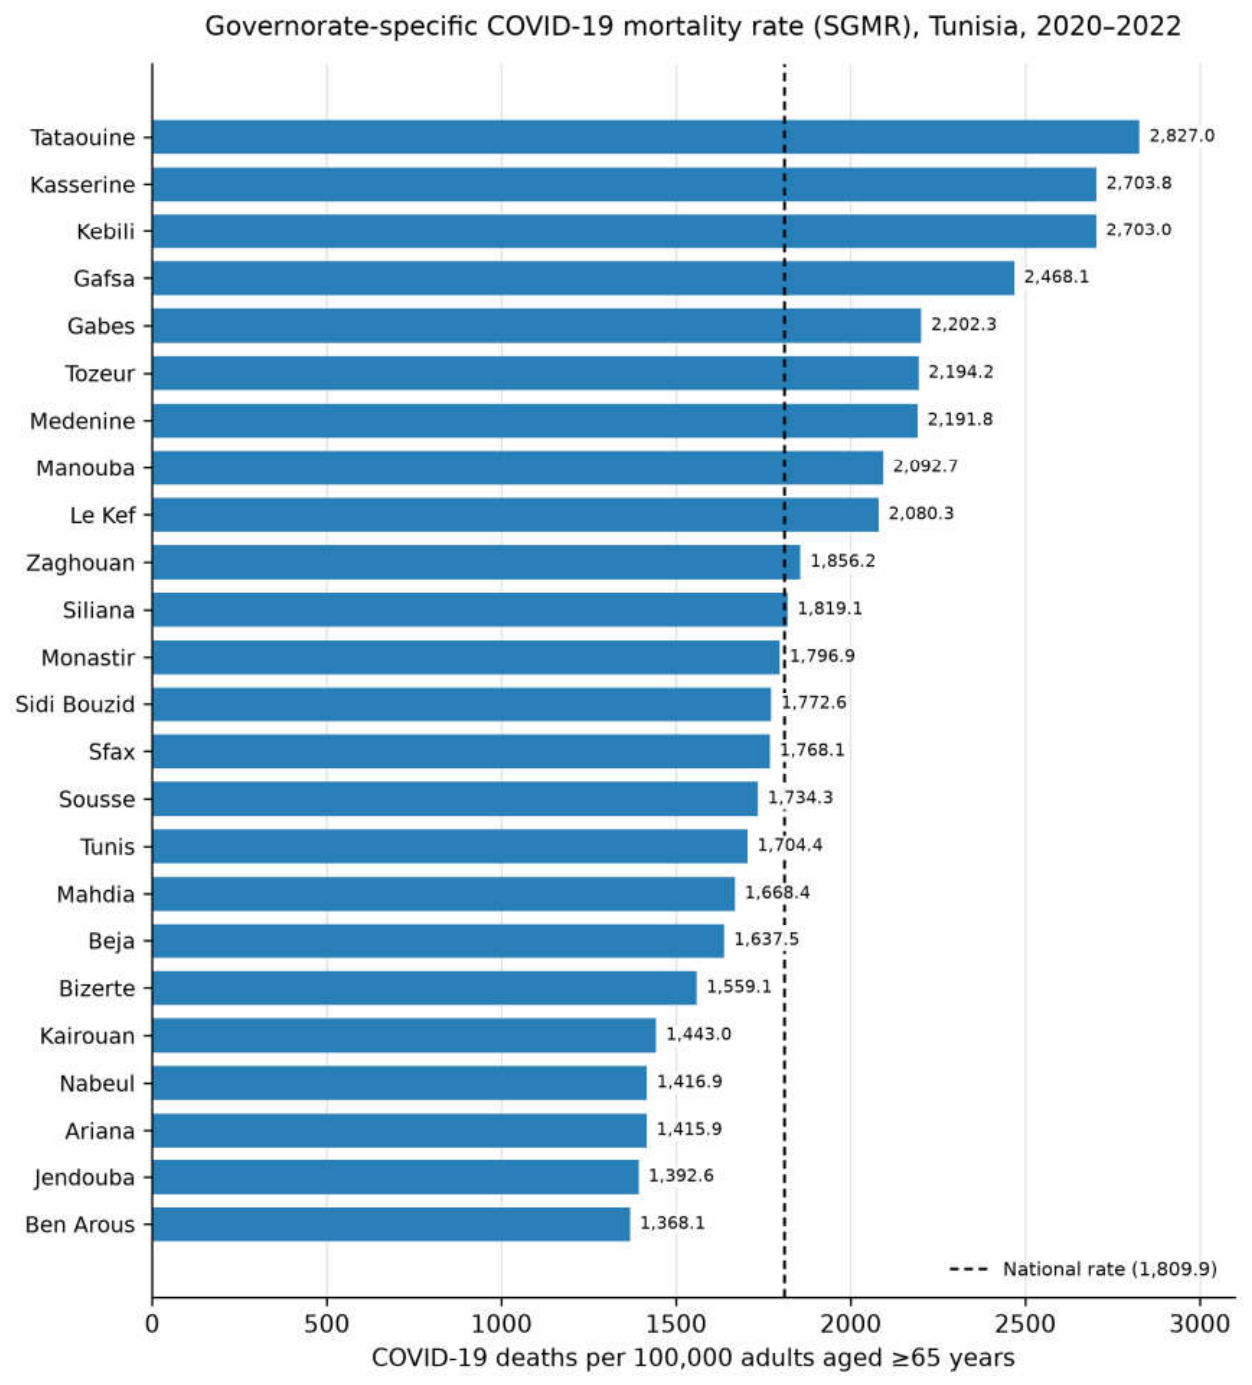
Figure 2.
Monthly epidemic curve of COVID-19 deaths among adults aged ≥65 years, Tunisia, 2020–2022 (n = 20,467).
Figure 2.
Monthly epidemic curve of COVID-19 deaths among adults aged ≥65 years, Tunisia, 2020–2022 (n = 20,467).
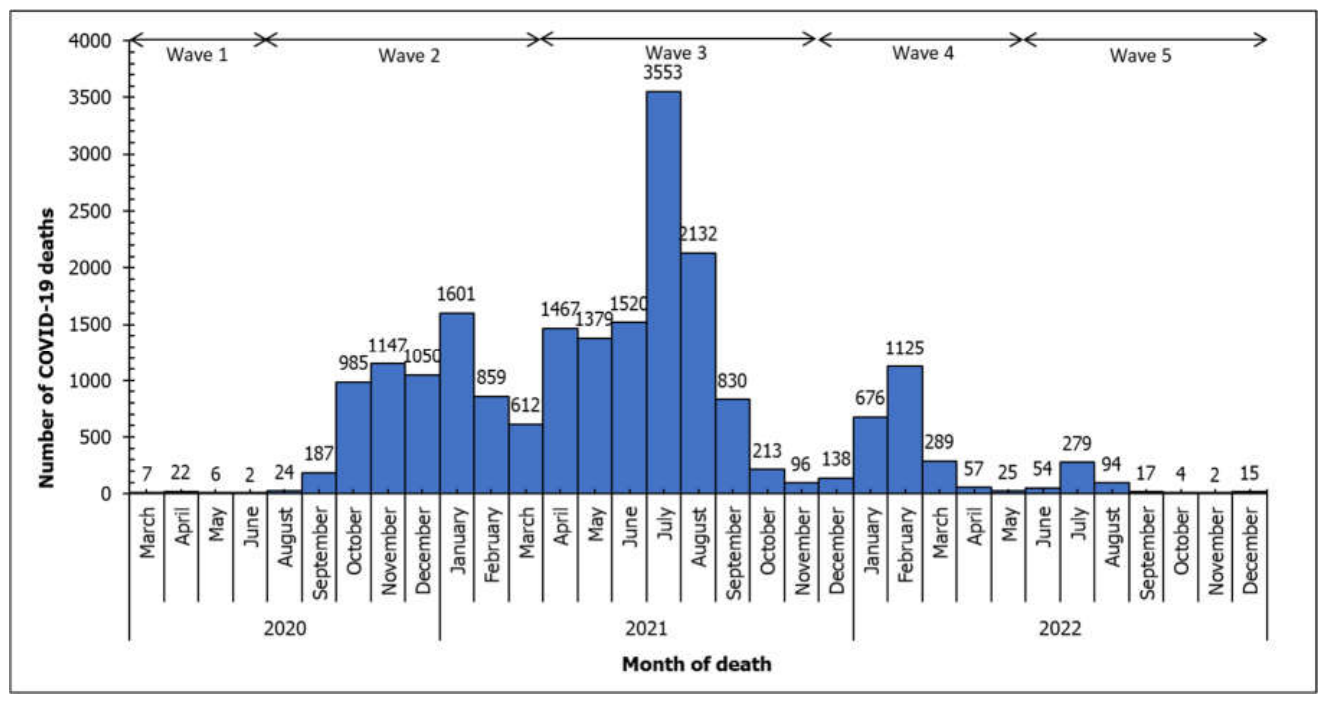
Figure 3.
Spatial distribution of the governorate-specific COVID-19 mortality rate (SGMR) among adults aged ≥65 years during the wild-type, Alpha, Delta, and Omicron predominance periods, Tunisia, 2020–2022.
Figure 3.
Spatial distribution of the governorate-specific COVID-19 mortality rate (SGMR) among adults aged ≥65 years during the wild-type, Alpha, Delta, and Omicron predominance periods, Tunisia, 2020–2022.
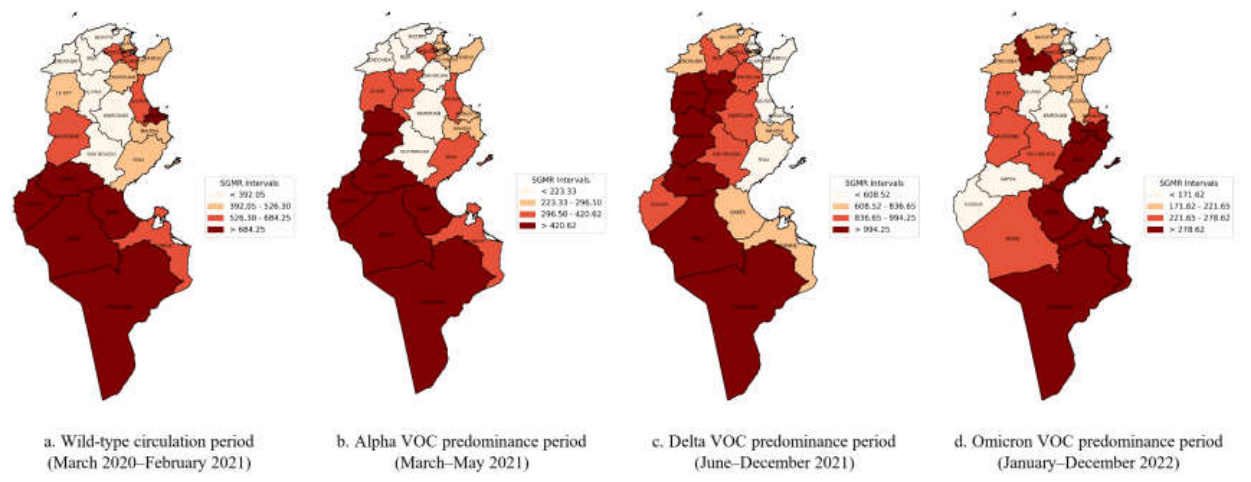
Figure 4.
Spatial distribution of the age-standardized COVID-19 mortality rate (ASMR) among adults aged ≥65 years during the wild-type, Alpha, Delta, and Omicron predominance periods, Tunisia, 2020–2022.
Figure 4.
Spatial distribution of the age-standardized COVID-19 mortality rate (ASMR) among adults aged ≥65 years during the wild-type, Alpha, Delta, and Omicron predominance periods, Tunisia, 2020–2022.
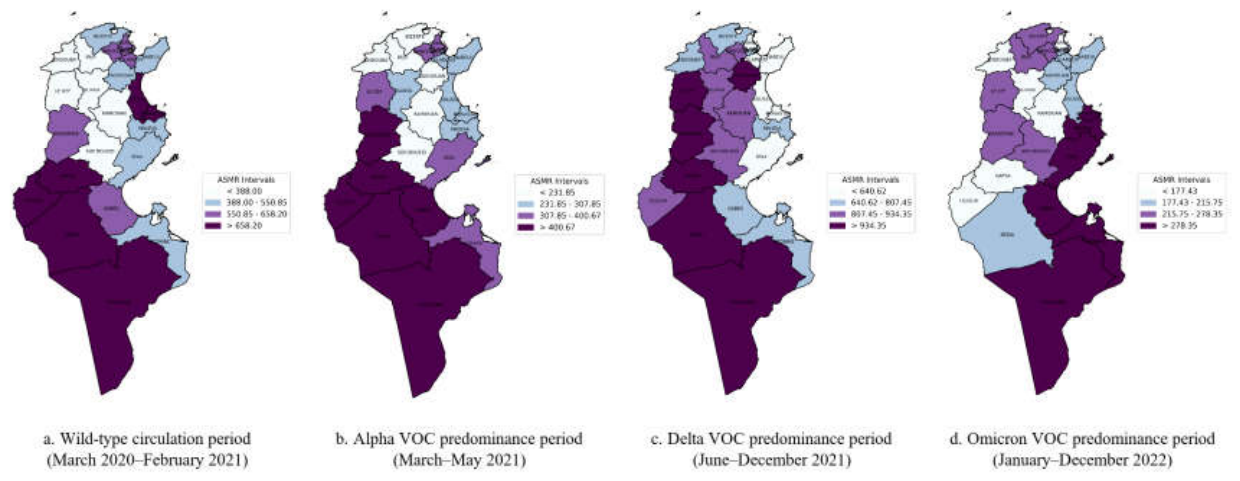
Figure 5.
COVID-19 vaccination coverage by governorate among adults aged ≥60 years, Tunisia, March 2021–December 2022: (a) at least one dose (COV-1) and (b) complete schedule (COV-C).
Figure 5.
COVID-19 vaccination coverage by governorate among adults aged ≥60 years, Tunisia, March 2021–December 2022: (a) at least one dose (COV-1) and (b) complete schedule (COV-C).
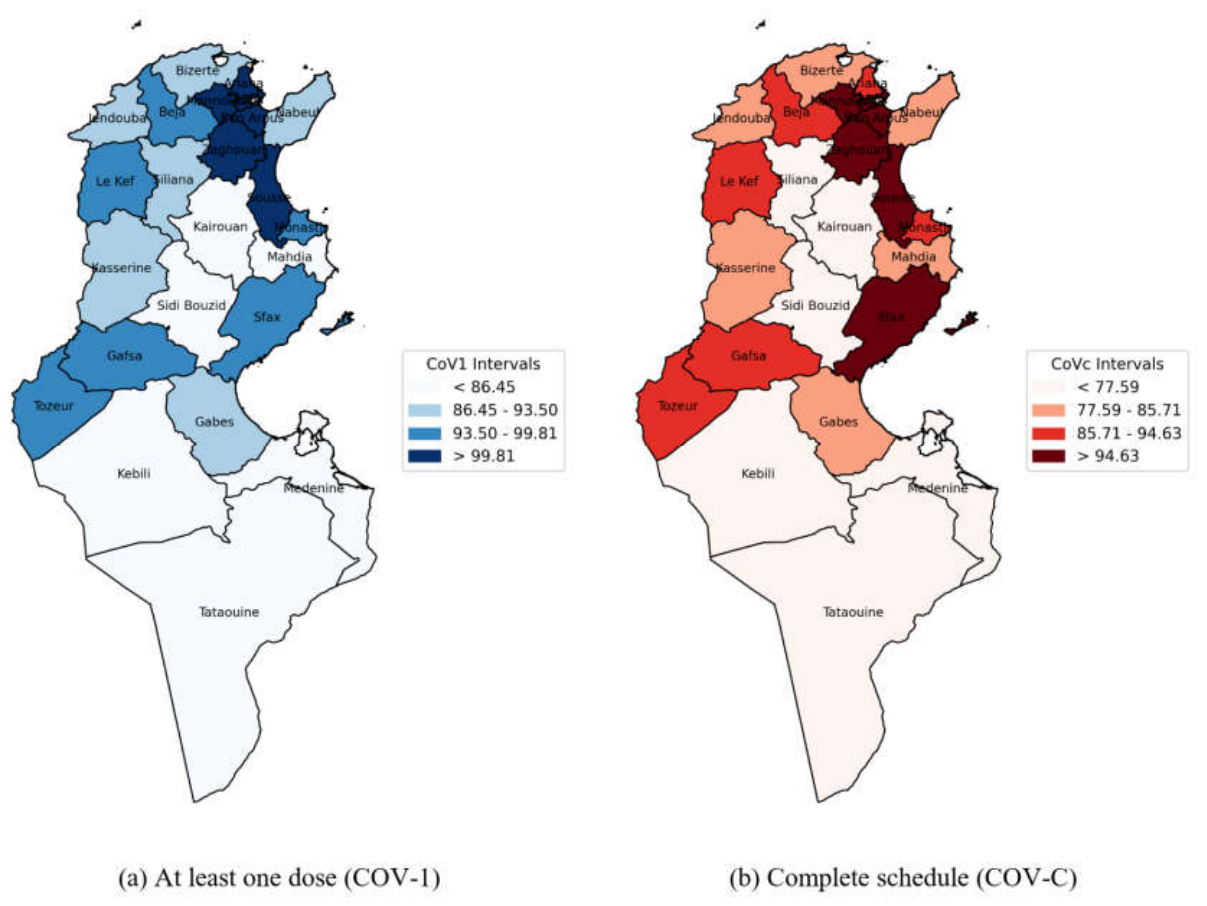
Figure 6.
Monthly new COVID-19 vaccine doses administered to the target population aged ≥60 years, Tunisia, March 2021–December 2022. Bars show monthly doses as extracted from the EVAX time series; after record reconciliation, the validated cumulative total was 3,605,682 doses (215.1 doses per 100) by December 2022.
Figure 6.
Monthly new COVID-19 vaccine doses administered to the target population aged ≥60 years, Tunisia, March 2021–December 2022. Bars show monthly doses as extracted from the EVAX time series; after record reconciliation, the validated cumulative total was 3,605,682 doses (215.1 doses per 100) by December 2022.
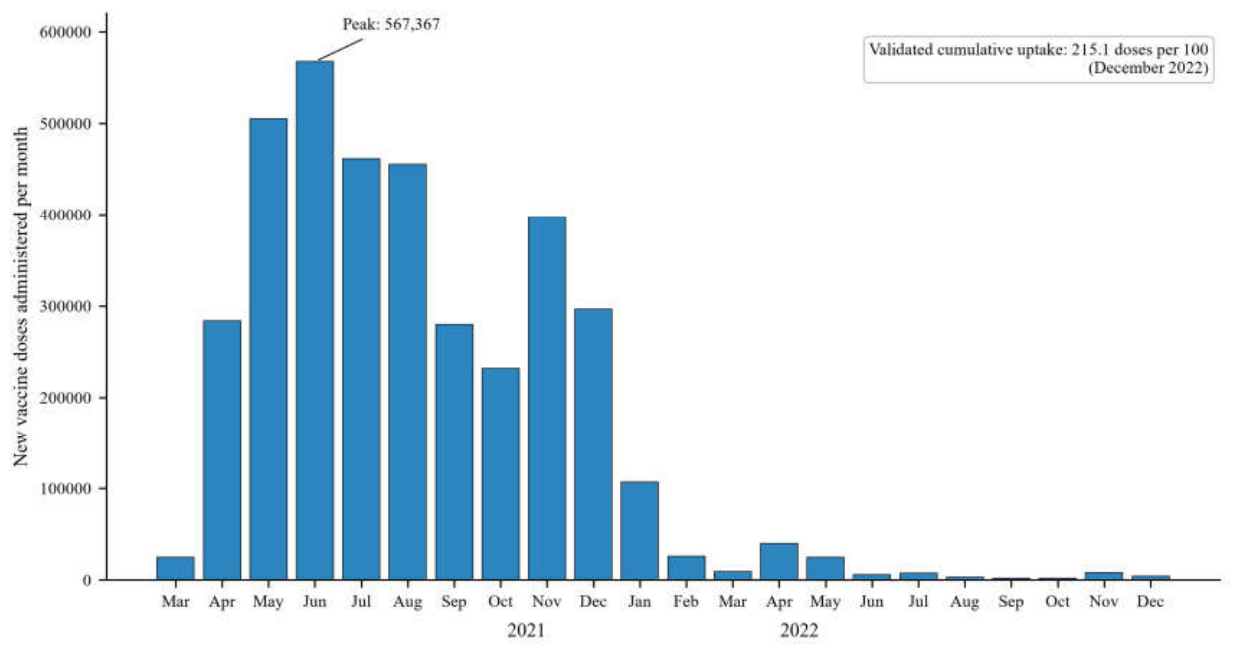
Figure 7.
COVID-19 vaccination campaign attendance and appointment no-show rates per month among adults aged ≥60 years, Tunisia, March 2021–December 2022.
Figure 7.
COVID-19 vaccination campaign attendance and appointment no-show rates per month among adults aged ≥60 years, Tunisia, March 2021–December 2022.
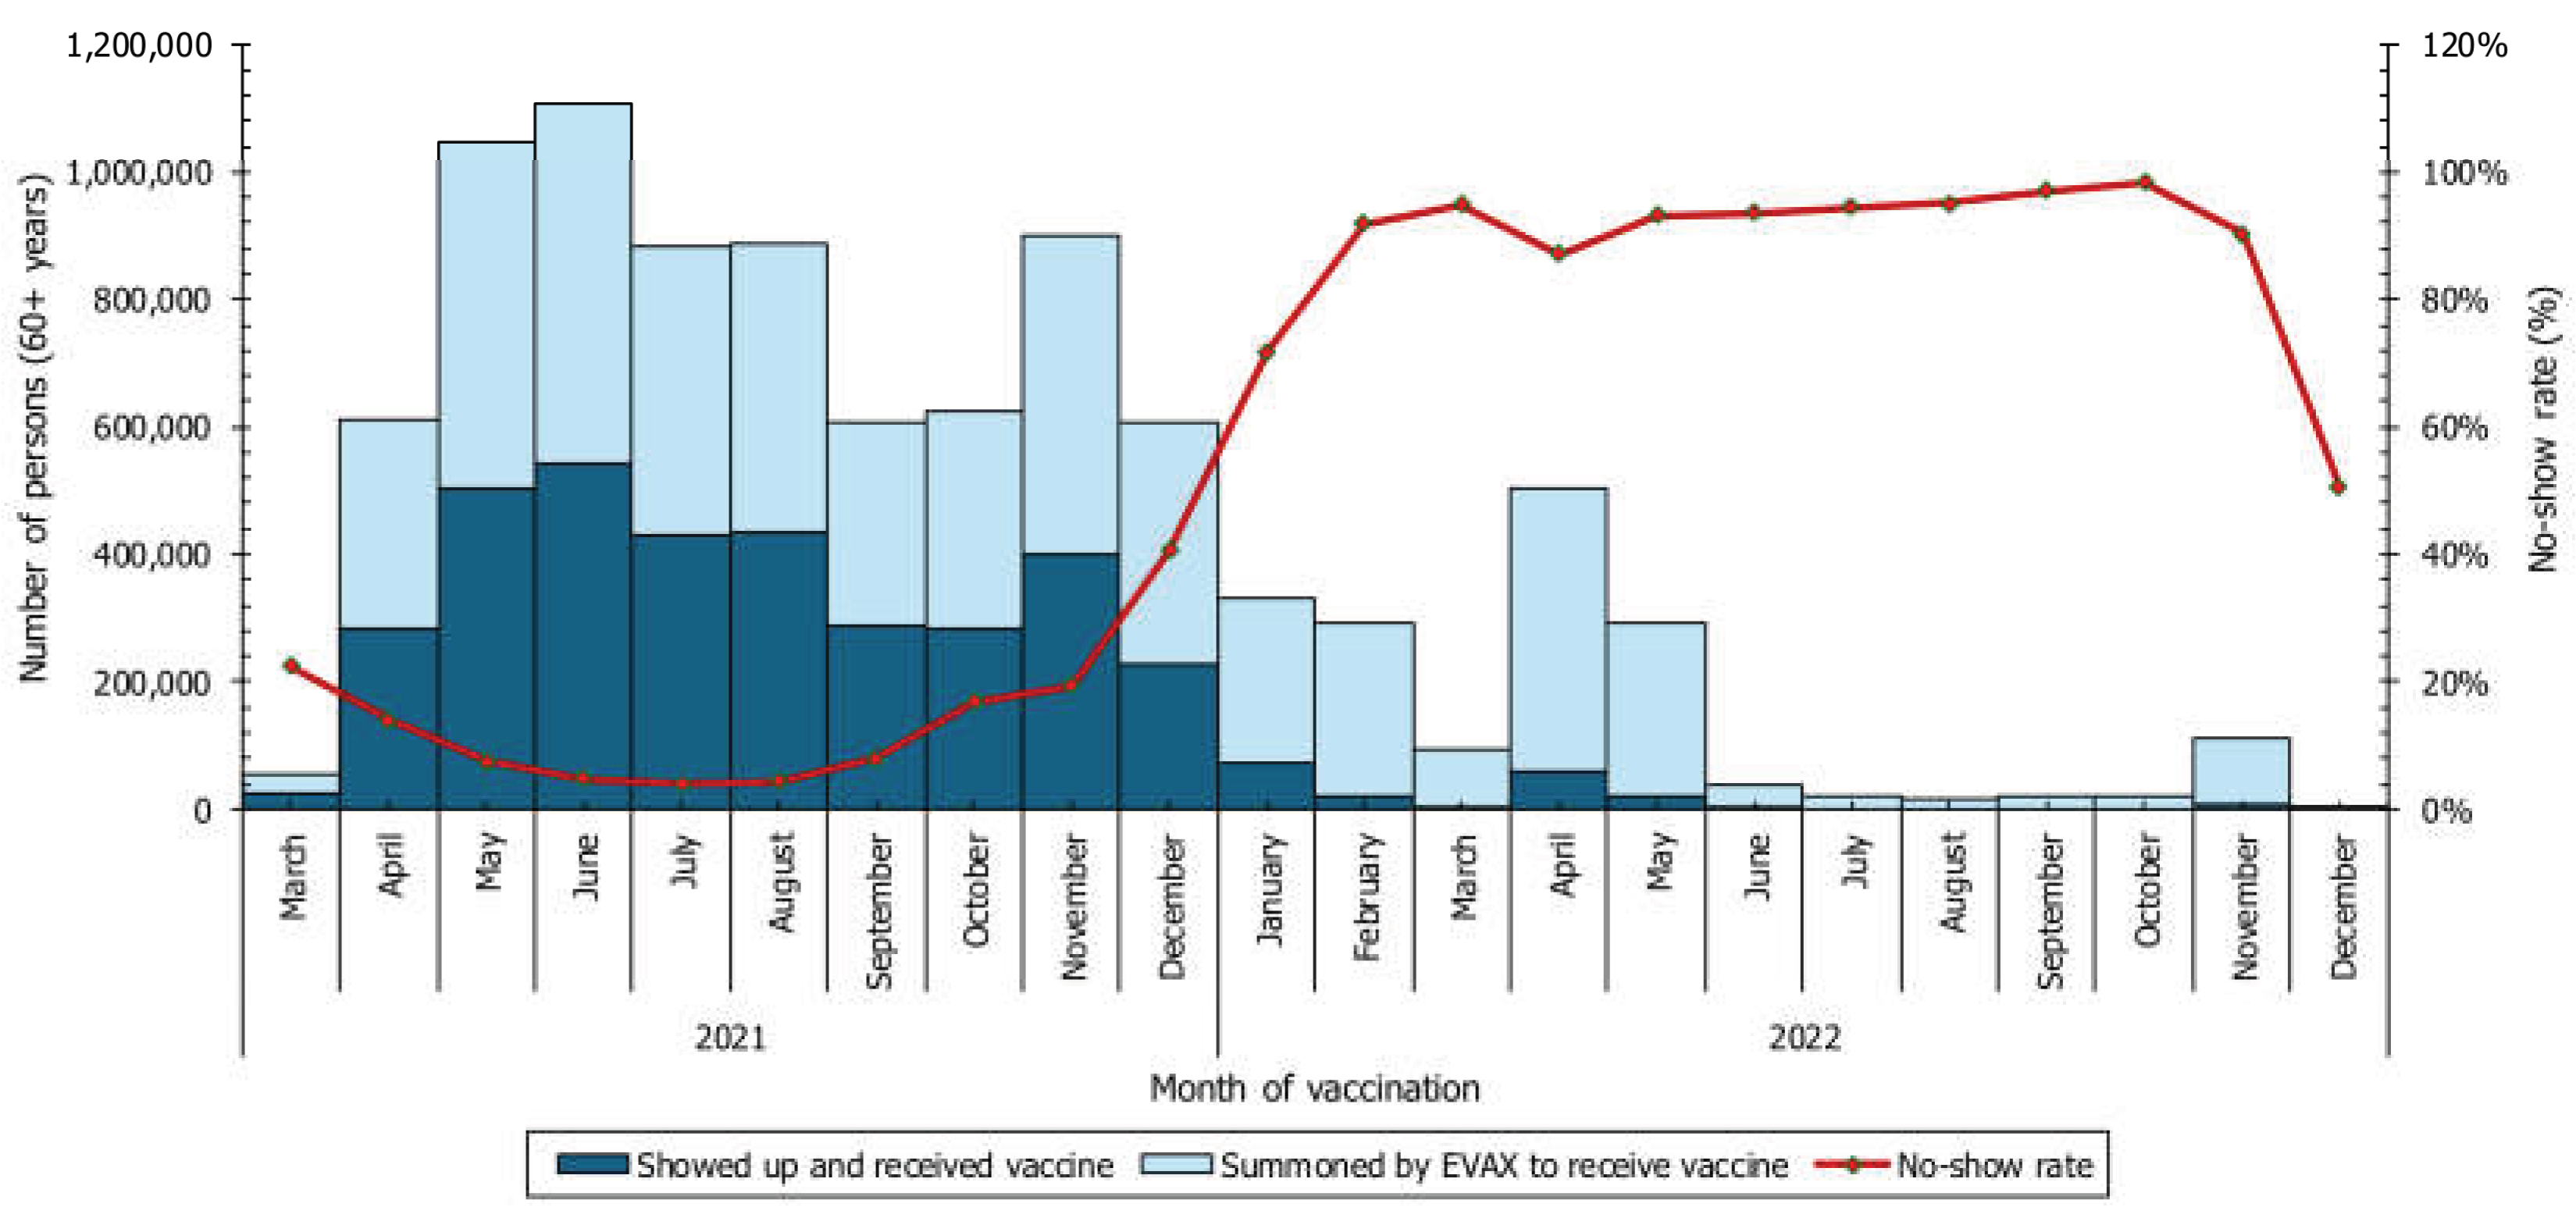
Figure 8.
Monthly COVID-19 deaths among adults aged ≥65 years and vaccination appointment no-show rates among adults aged ≥60 years, Tunisia, March 2021–December 2022.
Figure 8.
Monthly COVID-19 deaths among adults aged ≥65 years and vaccination appointment no-show rates among adults aged ≥60 years, Tunisia, March 2021–December 2022.
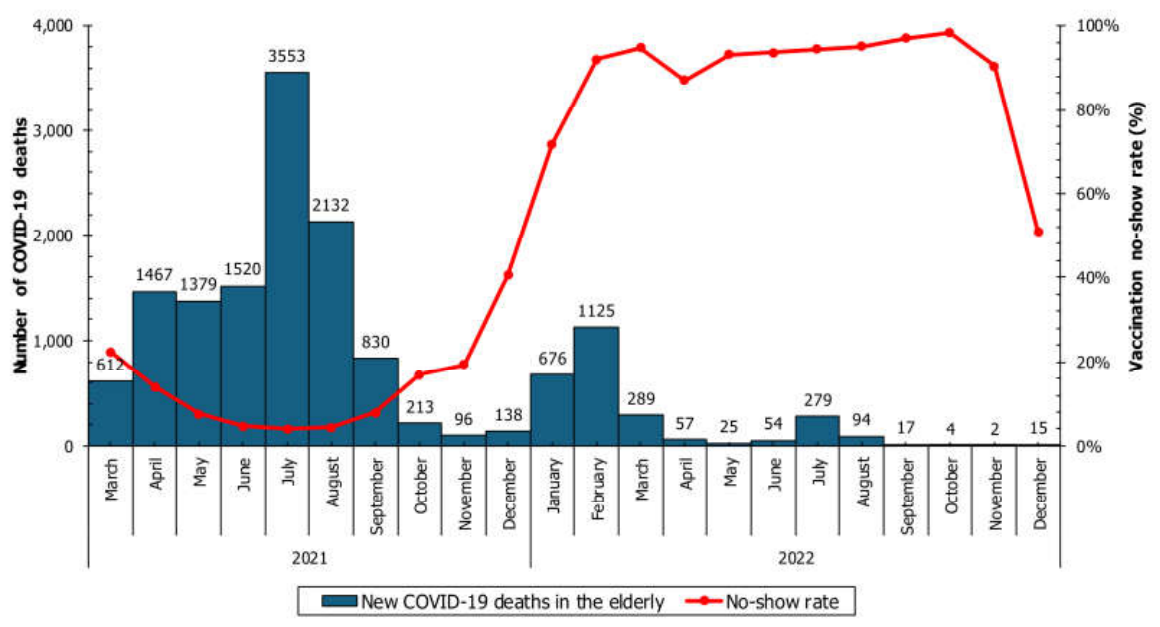

Table 1.
COVID-19 mortality indicators by age group among adults aged ≥65 years, Tunisia, 2020–2022 (n = 20,467).
Table 1.
COVID-19 mortality indicators by age group among adults aged ≥65 years, Tunisia, 2020–2022 (n = 20,467).
| Older Adult Age Groups (years) | Tunisian Population Estimates (January 2022)¹ |
All-Cause Deaths 2020–2022 (n)² |
COVID-19 Deaths 2020–2022 (n) |
ASpMR* Per 100,000 older adults |
PM** (%) |
|---|---|---|---|---|---|
| Young-Old (65-69) |
462,520 | 26,282 | 3,737 | 808.0 | 14.2% |
| Middle-Old (70-74) |
286,816 | 27,801 | 4,116 | 1,435.1 | 14.8% |
| Older-Old (75-79) |
181,991 | 29,044 | 3,889 | 2,136.9 | 13.4% |
| Oldest-Old (80+) |
199,507 | 107,009 | 8,725 | 4,373.3 | 8.2% |
| Older adults (≥65 years) | 1,130,834 | 190,135 | 20,467 | 1,809.9 | 10.8% |
Population estimates and all-cause deaths were reported by the National Institute of Statistics. ASpMR, age-specific mortality rate per 100,000 older adults; PM, proportional mortality (COVID-19 deaths as a percentage of all-cause deaths in the same age group).
Table 2.
COVID-19 mortality indicators per 100,000 adults aged ≥65 years by governorate, Tunisia, 2020–2022 (n = 20,467), ordered from highest to lowest comparative mortality figure (CMF).
Table 2.
COVID-19 mortality indicators per 100,000 adults aged ≥65 years by governorate, Tunisia, 2020–2022 (n = 20,467), ordered from highest to lowest comparative mortality figure (CMF).
| Governorate | Older Adult Population Estimates (January 2022) |
Cumulative COVID-19 death count | SGMR* per 100,000 older adults |
ASMR** per 100,000 older adults |
CMF*** (ratio) |
|---|---|---|---|---|---|
| Kasserine | 38,650 | 1,045 | 2,703.80 | 2,589.9 | 1.92 |
| Tataouine | 15,776 | 446 | 2,827.00 | 2,518.5 | 1.86 |
| Gafsa | 32,211 | 795 | 2,468.10 | 2,429.8 | 1.80 |
| Kebili | 16,537 | 447 | 2,703.00 | 2,432.3 | 1.80 |
| Manouba | 37,272 | 780 | 2,092.70 | 2,172 | 1.61 |
| Tozeur | 9,662 | 212 | 2,194.20 | 2,150.3 | 1.59 |
| Medenine | 53,244 | 1,167 | 2,191.80 | 2,066.9 | 1.53 |
| Gabes | 40,095 | 883 | 2,202.30 | 2,037.6 | 1.51 |
| Le Kef | 32,111 | 668 | 2,080.30 | 1,950.8 | 1.44 |
| Monastir | 46,803 | 841 | 1,796.90 | 1,834.4 | 1.36 |
| Zaghouan | 17,347 | 322 | 1,856.20 | 1,830.5 | 1.35 |
| Tunis | 111,655 | 1,903 | 1,704.40 | 1,804.6 | 1.34 |
| Sousse | 59,679 | 1,035 | 1,734.30 | 1,792.5 | 1.33 |
| Sfax | 99,940 | 1,767 | 1,768.10 | 1,767.6 | 1.31 |
| Siliana | 27,431 | 499 | 1,819.10 | 1,691 | 1.25 |
| Bizerte | 62,406 | 973 | 1,559.10 | 1,647.8 | 1.22 |
| Mahdia | 42,629 | 724 | 1,698.40 | 1,632 | 1.21 |
| Sidi Bouzid | 42,368 | 751 | 1,772.60 | 1,638.8 | 1.21 |
| Beja | 38,778 | 635 | 1,637.50 | 1,623.6 | 1.20 |
| Ariana | 53,394 | 756 | 1,415.90 | 1,592.6 | 1.18 |
| Ben Arous | 58,110 | 795 | 1,368.10 | 1,485.7 | 1.10 |
| Nabeul | 83,989 | 1,190 | 1,416.90 | 1,478.2 | 1.09 |
| Kairouan | 58,976 | 851 | 1,443.00 | 1,391.5 | 1.03 |
| Jendouba (ref) | 51,773 | 721 | 1,392.6 | 1,351.1 | 1.00 **** |
| Tunisia | 1,130,834**** | 20,467 | 1,809.9 | - | - |
SGMR, governorate-specific mortality rate; ASMR, age-standardized mortality rate (direct standardization to the national population aged ≥65 years in January 2022); CMF, comparative mortality figure (ASMR of the governorate divided by the ASMR of Jendouba, the reference governorate); REF, reference ASMR. CMF is dimensionless. The standard population comprised 1,130,834 adults aged ≥65 years (65–69, 462,520; 70–74, 286,816; 75–79, 181,991; ≥80, 199,507).
Table 3.
COVID-19 sex- and age-specific mortality rates among adults aged ≥65 years by year, Tunisia, 2020–2022 (n = 20,467).
Table 3.
COVID-19 sex- and age-specific mortality rates among adults aged ≥65 years by year, Tunisia, 2020–2022 (n = 20,467).
| Mortality rate per 100,000 older adults by age group | ||||||
|---|---|---|---|---|---|---|
| Year | Sex | Young-Old (65-69) | Middle-Old (70-74) | Older-Old (75-79) | Oldest-Old (80+) | Older adults (65+ years) |
| 2020 | Male | 214.5 | 329.7 | 554.5 | 754.2 | 398.3 |
| Female | 82.3 | 174.3 | 237.2 | 580.6 | 212.8 | |
| Total | 146.8 | 248.2 | 382.4 | 673.2 | 303.3 | |
| 2021 | Male | 676.2 | 1185.4 | 1763.0 | 2927.6 | 1400.1 |
| Female | 512.2 | 894.7 | 1270.9 | 3071.7 | 1152.7 | |
| Total | 592.2 | 1033.1 | 1496.2 | 2994.9 | 1273.4 | |
| 2022 | Male | 84.6 | 186.8 | 319.2 | 777.7 | 278.9 |
| Female | 54.0 | 123.7 | 206.8 | 622.5 | 189.6 | |
| Total | 69.0 | 153.8 | 258.3 | 705.2 | 233.2 | |
Table 4.
COVID-19 deaths and mortality indicators among adults aged ≥65 years by SARS-CoV-2 variant predominance period, Tunisia, 2020–2022 (n = 20,467). Rates are cumulative period-specific rates per 100,000 adults aged ≥65 years. Periods differ in duration; approximate annualized rates are reported in the text.
Table 4.
COVID-19 deaths and mortality indicators among adults aged ≥65 years by SARS-CoV-2 variant predominance period, Tunisia, 2020–2022 (n = 20,467). Rates are cumulative period-specific rates per 100,000 adults aged ≥65 years. Periods differ in duration; approximate annualized rates are reported in the text.
| SARS-CoV-2 variant circulation period | COVID-19 deaths among the older adults by sex and age group (number and percentage) | |||||||||||
| Male (M) | Female (F) | Total (M+F) 65+ | ||||||||||
| 65-69 | 70-74 | 75-79 | 80+ | Total Male 65+ | 65-69 | 70-74 | 75-79 | 80+ | Total Female 65+ | |||
| Wild Circulation Period March 2020 - February 2021 | 791 (21.64%) | 755 (20.65%) | 752 (20.58%) | 1355 (37.06%) | 3653 (100%) | 327 (14.62%) | 444 (19.86%) | 473 (21.17%) | 993 (44.35%) | 2237 (100%) | 5890 | |
| Alpha VOC predominance period March - May 2021 | 398 (20.89%) | 441 (23.13%) | 369 (19.36%) | 698 (36.62%) | 1906 (100%) | 281 (18.11%) | 316 (20.36%) | 302 (19.46%) | 653 (42.07%) | 1552 (100%) | 3458 | |
| Delta VOC predominance period June - December 2021 | 821 (18.81%) | 872 (19.96%) | 810 (18.55%) | 1862 (42.68%) | 4365 (100%) | 800 (19.42%) | 847 (20.56%) | 713 (17.32%) | 1757 (42.70%) | 4117 (100%) | 8482 | |
| Omicron VOC predominance period January 2022 onwards | 191 (12.41%) | 255 (16.57%) | 266 (17.30%) | 827 (53.72%) | 1539 (100%) | 128 (11.66%) | 186 (16.94%) | 204 (18.57%) | 580 (52.83%) | 1098 (100%) | 2637 | |
| Our study period: 2020-2022 | 2201 (19.18%) | 2323 (20.27%) | 2197 (19.15%) | 4742 (41.39%) | 11463 (100%) | 1536 (17.05%) | 1793 (19.91%) | 1692 (18.78%) | 3983 (44.26%) | 9004 (100%) | 20467 | |
| SARS-CoV-2 variant circulation period | COVID-19 gender and age specific mortality rates per 100,000 older adults | |||||||||||
| Male (M) | Female (F) | Total (M+F) 65+ | ||||||||||
| 65-69 | 70-74 | 75-79 | 80+ | Total Male 65+ | 65-69 | 70-74 | 75-79 | 80+ | Total Female 65+ | |||
| Wild Circulation Period March 2020 - February 2021 | 350.5 | 553.1 | 902.5 | 1454.3 | 662 | 138.1 | 295.4 | 479.4 | 933.8 | 386.4 | 520.9 | |
| Alpha VOC predominance period March - May 2021 | 176.4 | 323.1 | 442.9 | 749.1 | 345.4 | 118.6 | 210.2 | 306.1 | 614.1 | 268 | 305.8 | |
| Delta VOC predominance period June - December 2021 | 363.8 | 638.9 | 972.1 | 1998.4 | 791 | 337.8 | 563.5 | 722.6 | 1652.3 | 711 | 750.1 | |
| Omicron VOC predominance period January 2022 onwards | 84.6 | 186.8 | 319.2 | 887.6 | 278.9 | 54.0 | 123.7 | 206.8 | 545.5 | 189.6 | 233.2 | |
| Our study period: 2020-2022 | 975.3 | 1701.9 | 2636.7 | 5089.5 | 2077.3 | 648.5 | 1192.8 | 1714.8 | 3745.7 | 1555.1 | 1809.9 | |
Table 5.
COVID-19 vaccination coverage indicators among adults aged ≥60 years by sex, Tunisia, March 2021–December 2022 (n = 1,676,255).
Table 5.
COVID-19 vaccination coverage indicators among adults aged ≥60 years by sex, Tunisia, March 2021–December 2022 (n = 1,676,255).
| Indicator | Overall (%) | Males (%) | Females (%) | Sex ratio (M/F) |
|---|---|---|---|---|
| COV-1 | 95.41% | 96.86% | 93.74% | 1.03 |
| COV-2 | 76.37% | 79.02% | 73.68% | 1.07 |
| COV-3 | 38.35% | 43.28% | 33.72% | 1.28 |
| COV-C* (Complete schedule) | 88.33% | 90.80% | 85.78% | 1.06 |
| Dropout from COV-1 to COV-2 | 19.96% | 18.41% | 21.40% | 0.86 |
| Dropout from COV-2 to COV-3 | 49.78% | 45.24% | 54.24% | 0.83 |
| Dropout from COV-1 to COV-C | 7.42% | 6.26% | 8.49% | 0.74 |
COV-1, coverage with at least one dose; COV-2, coverage with at least two doses; COV-3, coverage with at least three doses; COV-C, coverage with a complete recommended schedule. Dropout is expressed as a positive proportion: [(COV-1 − COV-C)/COV-1] × 100. Sex ratio = male value/female value.
Table 6.
COVID-19 vaccination coverage indicators among adults aged ≥60 years by age group and sex, Tunisia, March 2021–December 2022 (n = 1,676,255).
Table 6.
COVID-19 vaccination coverage indicators among adults aged ≥60 years by age group and sex, Tunisia, March 2021–December 2022 (n = 1,676,255).
| Age group and sex | Received ≥1 dose (n) | Received ≥2 doses (n) | COV-1 | COV-2 | Dropout proportion from COV-1 to COV-2 (%) |
|---|---|---|---|---|---|
| 60 to 74 years old | 1,207,228 | 963,543 | 93.24% | 74.42% | 20.19% |
| Male | 598,164 | 487,447 | 94.65% | 77.13% | 18.51% |
| Female | 607,119 | 474,787 | 91.61% | 71.64% | 21.80% |
| Sex unspecified | 1,945 | 1,309 | - | - | - |
| ≥ 75 years old | 392,156 | 316,583 | 102.79% | 82.98% | 19.27% |
| Male | 184,948 | 151,462 | 104.79% | 85.82% | 18.11% |
| Female | 206,358 | 164,615 | 100.66% | 80.30% | 20.23% |
| Sex unspecified | 850 | 506 | - | - | - |
| All aged: 60 and above | 1,599,384 | 1,280,126 | 95.41% | 76.37% | 19.96% |
| Total Male | 783,112 | 638,909 | 96.86% | 79.02% | 18.41% |
| Total Female | 813,477 | 639,402 | 93.74% | 73.68% | 21.40% |
| Total, sex unspecified | 2,795 | 1,815 | - | - | - |
—: not applicable. COV-1 and COV-2 are defined in the Methods. Values above 100% reflect underestimation of the denominator and are discussed in the Limitations.
Table 7.
COVID-19 vaccination coverage indicators by governorate among adults aged ≥60 years, Tunisia, March 2021–December 2022 (n = 1,676,255).
Table 7.
COVID-19 vaccination coverage indicators by governorate among adults aged ≥60 years, Tunisia, March 2021–December 2022 (n = 1,676,255).
| Governorate | Target population aged ≥60 years | Received ≥1 dose (n) | Completed schedule (n) | COV-1 | COV-C | Dropout from COV-1 to COV-C (%) |
|---|---|---|---|---|---|---|
| Ben Arous | 93,270 | 103,429 | 98,442 | 110.89%† | 105.54%† | 4.82% |
| Sousse | 91,405 | 93,552 | 89,306 | 102.35%† | 97.70% | 4.54% |
| Tunis | 169,687 | 174,162 | 164,635 | 102.64%† | 97.02% | 5.47% |
| Manouba | 58,597 | 61,073 | 55,626 | 104.23%† | 94.93% | 8.92% |
| Zaghouan | 25,536 | 26,324 | 24,240 | 103.08%† | 94.92% | 7.92% |
| Sfax | 145,859 | 145,576 | 138,265 | 99.81% | 94.79% | 5.02% |
| Ariana | 85,385 | 85,239 | 80,753 | 99.83% | 94.58% | 5.26% |
| Tozeur | 14,369 | 14,289 | 13,543 | 99.44% | 94.25% | 5.22% |
| Monastir | 70,214 | 69,774 | 66,041 | 99.37% | 94.06% | 5.35% |
| Gafsa | 47,885 | 47,403 | 44,586 | 98.99% | 93.11% | 5.94% |
| Beja | 55,125 | 51,895 | 47,449 | 94.14% | 86.08% | 8.57% |
| Le Kef | 46,666 | 43,687 | 40,055 | 93.62% | 85.83% | 8.31% |
| Bizerte | 93,217 | 87,038 | 79,787 | 93.37% | 85.59% | 8.33% |
| Nabeul | 124,061 | 113,442 | 104,280 | 91.44% | 84.06% | 8.08% |
| Jendouba | 74,339 | 67,355 | 59,839 | 90.61% | 80.50% | 11.16% |
| Gabes | 56,920 | 49,805 | 45,656 | 87.50% | 80.21% | 8.33% |
| Kasserine | 57,378 | 52,600 | 45,916 | 91.67% | 80.02% | 12.71% |
| Mahdia | 62,440 | 53,665 | 48,786 | 85.95% | 78.13% | 9.09% |
| Kebili | 23,018 | 19,180 | 17,492 | 83.33% | 75.99% | 8.80% |
| Siliana | 39,126 | 33,892 | 29,584 | 86.62% | 75.61% | 12.71% |
| Medenine | 73,902 | 58,347 | 54,674 | 78.95% | 73.98% | 6.30% |
| Sidi Bouzid | 61,161 | 48,832 | 44,019 | 79.84% | 71.97% | 9.86% |
| Kairouan | 85,288 | 65,434 | 56,048 | 76.72% | 65.72% | 14.34% |
| Tataouine | 21,407 | 14,756 | 13,284 | 68.93% | 62.06% | 9.98% |
| Tunisia (national) | 1,676,255 | 1,599,384 | 1,480,636 | 95.41% | 88.33% | 7.42% |
Target population: INS estimates of the population aged ≥60 years in January 2022. COV-1, coverage with at least one dose; COV-C, coverage with a complete schedule. The 24 governorate rows sum to 1,580,749 first doses (94.30%) and 1,462,306 completed schedules (87.24%); the difference from the national totals (1,599,384 and 1,480,636; 95.41% and 88.33%) corresponds to records without a valid governorate code (18,635 and 18,330 records, respectively). Values above 100% reflect denominator underestimation and should not be interpreted as true coverage. † Observed coverage above 100%; see Limitations.
Disclaimer/Publisher’s Note: The statements, opinions and data contained in all publications are solely those of the individual author(s) and contributor(s) and not of MDPI and/or the editor(s). MDPI and/or the editor(s) disclaim responsibility for any injury to people or property resulting from any ideas, methods, instructions or products referred to in the content. |
© 2026 by the authors. Licensee MDPI, Basel, Switzerland. This article is an open access article distributed under the terms and conditions of the Creative Commons Attribution (CC BY) license (http://creativecommons.org/licenses/by/4.0/).
Copyright: This open access article is published under a Creative Commons CC BY 4.0 license, which permit the free download, distribution, and reuse, provided that the author and preprint are cited in any reuse.