

Submitted:
27 October 2026
Posted:
28 October 2026
You are already at the latest version
Abstract
Background: Upper respiratory infections (URIs) are the most frequent illnesses of childhood, yet mortality-anchored child-health monitoring excludes high-frequency, low-fatality conditions. No dedicated pediatric assessment of the global URI burden exists for the Global Burden of Disease Study (GBD) 2023. We quantified URI incidence and mortality at ages 0–19 years, 1990–2023. Methods: We extracted deaths and incident episodes for the GBD cause “upper respiratory infections” from the GBD 2023 Results Tool for the under-5 aggregate plus the 5–9-, 10–14-, and 15–19-year bands, 21 regions, and five Socio-demographic Index (SDI) quintiles, 1990–2023. Crude rates used back-calculated populations; trends used estimated annual percentage change (EAPC). URI was positioned against diarrhoeal diseases, asthma, lower respiratory infections (LRI), and tuberculosis. Results: In 2023, URIs caused 5.616 billion incident episodes (95% uncertainty interval [UI] 4.133–7.330 billion) at ages 0–19 years—210,275 per 100,000, about 2.1 episodes per child per year—against 16,382 deaths (1,781–57,834), a case-fatality proxy of 0.00029%. URIs outnumbered LRI episodes 69.3-fold, while LRI deaths exceeded URI deaths 43.4-fold. Since 1990, incident episodes rose 9.8% in number while the rate declined only 7.3% (EAPC −0.27% per year, one-eleventh of the LRI pace); deaths fell 39.6% (rate EAPC −1.90%). Under-5 children accounted for 34.5% of episodes (three per child per year) and 85.7% of deaths. Incidence rates were nearly flat across SDI quintiles (183,913–255,578 per 100,000), whereas mortality fell 66-fold from low to high SDI (1.724 vs 0.026 per 100,000); the low-SDI quintile carried 89.2% of deaths. Conclusions: The world’s most common pediatric infection is also its least monitored: incidence has stalled for three decades, while a small but real mortality toll concentrates in under-5 children in low-SDI settings. URI merits inclusion in child-health monitoring as a morbidity and antibiotic-stewardship indicator and improved cause-of-death certification where fatal respiratory illness is coded to the upper airway.
Keywords:
upper respiratory infections
; common cold
; Global Burden of Disease
; GBD 2023
; children
; adolescents
; incidence
; mortality
; health inequality
1. Introduction
1.1. Background and Motivation
1.1.1. The Most Frequent Illness of Childhood
Upper respiratory infections (URIs) the common cold and its clinical neighbours (acute rhinitis, nasopharyngitis, pharyngitis, sinusitis, acute otitis media) are the archetypal illnesses of childhood [1,2]. Community cohorts such as the Tecumseh studies recorded six to eight acute respiratory illnesses per year in young children, mostly confined to the upper airway [3,4], with rhinoviruses the largest share [1,5]. Episodes are self-limiting [6], with no vaccine or specific antiviral [1,5]; yet URIs drive otitis media and bacterial sinusitis, asthma exacerbations, school absence, and caregiver work loss [1,2,6]. Because each episode is mild, URI is treated as background noise an assumption this paper examines at global scale.
1.1.2. The Visibility Paradox in Child-Health Monitoring
Global child-health monitoring is mortality-anchored: the WHO/UNICEF Global Action Plan for Pneumonia and Diarrhoea targeted preventable under-five deaths [7], and Sustainable Development Goal target 3.2 defines its endpoint at under-five mortality [8]. Lower respiratory infections (LRI) and diarrhoeal diseases therefore occupy dedicated indicators; URI appears in none, leaving the largest-volume pediatric illness, and the antibiotic consumption it drives, invisible to the systems that allocate resources [9,10].
1.1.3. The Economic and Stewardship Burden of a “Trivial” Disease
The aggregate weight of URI is not trivial: non-influenza viral respiratory infection dominated by URI, which was estimated to cost the United States roughly US$40 billion annually [9], and URIs are the leading driver of inappropriate antibiotic use [10] and a recognized contributor to antimicrobial resistance [11] a stewardship problem only population-level quantification can size.
1.2. Research Gap
1.2.1. What Existing GBD-Based Analyses Do Not Provide
The GBD 2023 capstone analyses report URI as one of hundreds of causes, without pediatric disaggregation or interpretation [13,14]; pediatric respiratory analyses on recent GBD rounds have focused on LRI, the lethal pole of the spectrum [15,16]. Non-GBD URI literature is rich on mechanism, silent on global distribution [2,3,4,9,10,12]. No dedicated analysis on any GBD round has characterized the global URI burden across ages 0–19 years; without such a baseline, no target, indicator, or investment case for the world’s most common pediatric infection can be formulated.
1.3. Objectives and Contributions
We estimated URI incidence and mortality at ages 0–19 years, 1990–2023, computed by the authors from raw GBD 2023 Results Tool downloads [17], combining the official under-five aggregate with the 5–9-, 10–14-, and 15–19-year bands. Contributions: the first dedicated four-band pediatric URI profile (21 GBD regions, five Socio-demographic Index [SDI] quintiles, sex-stratified); positioning against LRI, diarrhoeal diseases, asthma, and tuberculosis; a stalled incidence decline (−0.27% per year, one-eleventh of the same-caliber LRI pace) against faster mortality decline (−1.90%); and the equity anatomy, a near-flat incidence gradient against a 66-fold mortality gradient, with 85.7% of deaths under age 5 and 89.2% in low-SDI countries.
2. Methods
2.1. Study Design and Data Sources
2.1.1. GBD 2023 Analytical Framework
This is a secondary analysis of the Global Burden of Disease (GBD) Study 2023, coordinated by the Institute for Health Metrics and Evaluation (IHME) [13,14,17,19], covering 204 countries and territories in 21 regions and five Socio-demographic Index (SDI) quintiles [14]. Causes of death are modeled with the Cause of Death Ensemble model (CODEm), nonfatal outcomes with DisMod-MR 2.1, and garbage codes are systematically redistributed [13,20]. Uncertainty intervals (UIs) are the 2.5th and 97.5th posterior-draw percentiles [14].
2.1.2. Direct Download and Author Aggregation of Estimates for Ages 0–19 Years
All pediatric estimates derive from raw GBD Results Tool downloads [17] (16–18 August 2026; reproducible queries): deaths and incident episodes (numbers with 95% UIs) for the official under-5 aggregate and the 5–9-, 10–14-, and 15–19-year groups, both sexes and sex-stratified, globally, for five SDI quintiles and 21 regions, 1990–2023. Comparator extractions (same round [17]) covered diarrhoeal diseases and tuberculosis; LRI comparators come from the authors’ same-round pediatric aggregation of the same data source [17]. The asthma comparator is a GBD 2021 prevalent-case anchor [21] (Section 2.3.1). No estimate was transcribed from any published article.
2.1.3. Age-Band Caliber, Population Denominators, and Crude Rates
The Results Tool publishes no single-year ages (no “1 year” row exists); the under-five segment is therefore the official GBD aggregate row “<5 years”, and the 0–19-year total sums four non-overlapping rows: <5 years + 5–9 + 10–14 + 15–19 years.
URI rows report numbers without rate rows for all required slices. Crude 0–19-year rates were computed on back-calculated populations (population = number ÷ rate × 100,000, summed across bands; crude rate = Σ(number) ÷ Σ(population) × 100,000). The back-calculated 2023 global 0–19-year population (2,670,651,217) cross-validated exactly against an independent same-round back-calculation. Rate UIs are converted from count UIs and omit denominator uncertainty.
2.1.4. Comparison with Previous GBD Rounds
Because each GBD round re-estimates the entire series, cross-round differences cannot be attributed to temporal change; no previous-round estimate enters any table, figure, or trend here, with one labeled exception: the asthma comparator (Section 2.3.1), [21]. Prior-round and non-GBD literature [3,4,9,16] is discussed for pattern, not numerical comparison.
2.2. Case Definition
URIs were defined per the GBD cause hierarchy as acute upper-respiratory-tract infections mapped from ICD-10 J00–J06, and a cause distinct from LRI [13,14]. URI is predominantly nonfatal in GBD; its modeled deaths arise partly from garbage-code redistribution and carry exceptional uncertainty (Section 2.5 and Section 4.6). We analyze the all-pathogen envelope (GBD publishes no pathogen decomposition for URI).
2.3. Metrics and Comparative Framework
2.3.1. Measures and the Disease-Spectrum Comparator Set
We report deaths and incident episodes, each as a number and a crude rate per 100,000 with 95% UIs; per-child episode frequency is the crude incidence rate divided by 100,000. DALY-based measures are omitted: URI YLDs are negligible relative to incidence volume, and death-component uncertainty dominates any synthesis (Section 4.6). Same-population (0–19-year, 2023) comparators position URI in the pediatric infectious-disease landscape: diarrhoeal diseases (incident episodes), asthma (prevalent cases, an explicitly labeled caliber difference), LRI (incident episodes, authors’ same-round aggregation), and tuberculosis (incident episodes); deaths are tabulated for URI, LRI, diarrhoeal diseases, and tuberculosis. Cross-cause ratios and a case-fatality proxy (deaths ÷ incident episodes) use point estimates with component UIs.
2.4. Temporal Trend Analysis
2.4.1. Estimated Annual Percentage Change, 1990–2023
Trends were quantified as estimated annual percentage change (EAPC) from log-linear regression of the crude rate on calendar year; EAPC = 100 × (e^β − 1), with 95% confidence intervals (CIs) reflecting regression precision only. EAPCs were computed globally, by SDI quintile, and for the 21 regions, benchmarked against same-caliber pediatric LRI EAPCs on the identical framework [16,17]. Endpoint changes (1990→2023) are also reported.
2.4.2. The 2019–2023 Pandemic Window: A Deliberate Non-Result
GBD 2023 URI estimates carry essentially no pandemic-window signal of non-pharmaceutical-intervention (NPI) suppression or rebound, consistent with demography- and smoothing-driven modeling (Section 4.6). By design, not omission, no pandemic-window change is reported as a result; year-on-year values are in Supplementary Table S3.
2.4.3. Ecological Covariate Analyses
Region- and quintile-level 2023 estimates were linked to the World Bank universal health coverage (UHC) service-coverage index (2021), GDP per capita, and the Gini index, aggregated from a 215-country table as population-weighted means. Associations used Spearman rank correlations and log-linear regressions. A climate-sensitivity analysis in 66 island and small coastal countries (non-landlocked, area <100,000 km², population >50,000; 13 regions) correlated temperature, humidity, latitude, and precipitation against regional URI rates with Benjamini–Hochberg false-discovery-rate (FDR) control; because outcomes vary only across regions, the region-level recomputation (n = 13) is primary. An illustrative best-quartile counterfactual used Monte Carlo uncertainty propagation. Country-level URI estimates are unavailable in this extraction; all covariate analyses are region-level (Section 4.6).
2.5. Uncertainty Aggregation and Honesty Conventions
The Results Tool reports UIs per row but not for author-computed sums; summed UIs were approximated by direct addition of component bounds (a conservative convention, wider than root-sum-of-squares pooling). Because the 2023 URI death UI spans 1,781–57,834 (width 342% of the point estimate), every mortality-based ranking, ratio, or gradient is stated on point estimates with component UIs displayed (Section 4.6).
2.6. Statistical Analysis, Ethics, and Reporting
Derived quantities were computed in Python 3.11; no new GBD model runs were performed. The study is descriptive: hypothesis testing was confined to the pre-specified ecological analyses, using two-sided α = 0.05 with Benjamini–Hochberg FDR control for the climate-sensitivity family (Section 2.4.3). Reporting follows GATHER [22] (checklist in Supplementary Material). All estimates are publicly accessible through the GBD Results Tool [17]; author-aggregated datasets and code are available from the corresponding author on reasonable request (see Availability of data and materials). This secondary analysis of de-identified, aggregate, publicly available estimates was exempt from institutional review board approval.
3. Results
3.1. Global Burden at Ages 0–19 Years in 2023 and Long-Term Change (Figure 1)
In 2023, upper respiratory infections (URIs) caused an estimated 5.616 billion incident episodes (95% uncertainty interval [UI] 4.133–7.330 billion) worldwide, a crude incidence rate of 210,275 per 100,000 (154,766–274,482), approximately 2.1 episodes per child per year [17] against 16,382 deaths (1,781–57,834), a crude mortality rate of 0.61 per 100,000 (0.07–2.17). The mortality estimate carries a 32-fold UI range (342% of the point estimate), inherited by every mortality statement below (Section 2.5 and Section 4.6).
Between 1990 and 2023, incident episodes rose 9.8% in number (5.113 billion [3.818–6.604] to 5.616 billion) while the crude incidence rate declined only 7.3% (226,747 to 210,275 per 100,000)—population growth nearly cancelling a modest per-child improvement (year-by-year values in Table S1). Deaths fell 39.6% (27,135 [5,037–67,085] to 16,382) and the crude death rate 49.0% (1.20 [0.22–2.98] to 0.61).
3.2. Positioning Within the Pediatric Disease Spectrum (Table 1; Figure 2)
URI dominates the 2023 pediatric infectious-disease landscape on incidence and recedes on mortality (Table 1; Figure 2). With 5,616 million episodes, URI exceeded diarrhoeal diseases (2,125 million [1,563–2,762]) roughly 2.6-fold, the prevalent asthma caseload (150.8 million; prevalence caliber) 37.2-fold, lower respiratory infections (81.05 million episodes) 69.3-fold, and tuberculosis (1.67 million [1.33–2.00]) 3,372-fold, outnumbering the other four tabulated causes combined roughly 2.4-fold. On mortality the ordering inverted: LRI caused 711,713 deaths, diarrhoeal diseases 379,958, and tuberculosis 87,764 (Table 1), each far above URI’s 16,382; the implied URI case-fatality proxy was 0.00029%.
3.3. Age and Sex Pattern: Incidence Peaks Early, Deaths Concentrate in the Under-Fives (Supplementary Figure S1)
The 2023 age distribution was graded in both measures (Supplementary Figure S1; Table S4). Children under 5 years generated 1.939 billion episodes (1.556–2.379 billion; 34.5% of the 0–19-year total) at 301,461 per 100,000 and approximately 3.0 episodes per child per year—followed by 1.514 billion (27.0%; ≈2.2 per child) at ages 5–9, 1.150 billion (20.5%; ≈1.7) at 10–14, and 1.013 billion (18.0%; ≈1.6) at 15–19 years; the under-5 rate was 1.9 times the 15–19-year rate. Mortality was far more concentrated: the under-5 aggregate accounted for 14,045 deaths (1,527–49,594)—85.7% of all 0–19-year URI deaths, against 1,287 (7.9%) at ages 5–9, 685 (4.2%) at 10–14, and 364 (2.2%) at 15–19 years, a near two-order-of-magnitude collapse across childhood.
Sex differences were minimal: 2.913 billion episodes in boys versus 2.703 billion in girls (2023 incidence rate ratio ≈1.02; band ratios 1.006–1.022, largest under age 5) and balanced deaths (8,156 versus 8,227; band mortality-rate ratios 0.92–1.13, the 1.13 at ages 15–19 years), with symmetric temporal change (incidence-rate declines 7.9% [boys] and 6.6% [girls], 1990–2023; death-rate declines 50.4% and 47.5%); subsequent stratifications pool sexes.
3.4. The Socio-Demographic Index Gradient: Same Disease, Different Fate (Table 2; Figure 3)
Incidence was nearly development-blind while mortality was steeply graded (Table 2; Figure 3). Crude 2023 incidence rates spanned a narrow band across quintiles—183,913 per 100,000 (low-middle SDI) to 255,578 (high SDI). Mortality moved in the opposite direction: 1.724 per 100,000 (low SDI) versus 0.026 (high SDI), a 66-fold gradient on a near-flat exposure base (Supplementary Table S5). The low-SDI quintile alone carried 14,617 deaths (723–53,905; 89.2% of the global total), and four Sub-Saharan African regions: Western (8,088), Eastern (5,186), Central (1,530), Southern (119)—held 91.1%. Improvement was slowest where mortality remains highest: death-rate EAPCs ran from −2.10% per year (low SDI) to −9.47 (high-middle) and −9.03 (high).
3.5. Long-Term Rate Trends, 1990–2023: The Stalled Incidence Decline (Supplementary Figure S2)
The global crude incidence rate declined at an EAPC of −0.27% per year (95% CI −0.30 to −0.23) over 1990–2023—one-eleventh of the same-caliber LRI incidence decline (−2.99% per year) on the identical framework [17]—while mortality improved faster at −1.90% per year (−2.00 to −1.81), about half the LRI mortality pace (−3.89). Per-child URI frequency in 2023 (≈2.1 episodes) essentially matched 1990 (≈2.3). Regional incidence EAPCs clustered near zero while mortality EAPCs were universally negative but heterogeneous by two orders of magnitude (East Asia −12.11; Central Asia −0.45) (Supplementary Figure S2; Table S2): stalled incidence is global, not compositional.
3.6. Ecological Covariates: Health-System Capacity Tracks the Mortality Gradient, Climate Does Not
Across 21 GBD regions and five SDI quintiles (Supplementary Table S6–S7), the 2023 crude mortality rate correlated inversely with universal health coverage (UHC) service coverage (Spearman ρ = −0.51, p = 0.017) and GDP per capita (ρ = −0.64, p = 0.002), but not with the Gini index (ρ = 0.17, p = 0.45). In log-linear models, UHC alone explained 21% of cross-regional log-mortality variance, GDP per capita 44%, jointly 50%; the low-to-high-SDI UHC span (41 vs 86) predicts a ≈14-fold mortality difference, about one-fifth of the observed 66-fold gradient. Incidence rose weakly with UHC (ρ = +0.42) and GDP per capita, consistent with ascertainment. In 66 island and small coastal countries (13 regions), no climate association survived region-level recomputation (all FDR q ≥ 0.87); nominal country-level correlations (q = 0.024) reflected region-assigned outcomes.
4. Discussion
4.1. Principal Findings
This first dedicated pediatric assessment of URI on GBD 2023 yields four findings. First, extreme scale asymmetry: 5.616 billion episodes (95% UI 4.133–7.330 billion) in 2023 about 2.1 per child per year, against 16,382 deaths (case-fatality proxy 0.00029%). Second, stalled incidence: −0.27% per year over 1990–2023, one-eleventh of the same-caliber LRI pace, leaving per-child exposure essentially unchanged for three decades. Third, concentrated residual mortality: 85.7% of deaths under age 5, 89.2% in the low-SDI quintile, a 66-fold low-versus-high-SDI gradient. Fourth, fate is divorced from exposure (Section 3.6). All mortality statements inherit the URI death estimate’s exceptional uncertainty (UI width 342%), itself a finding about measurement.
4.2. Why the Most Common Disease Is the Least Monitored
URI’s invisibility is structural: monitoring was built to count deaths averted [7,8], and a disease killing 16,382 children a year—two orders of magnitude below LRI cannot compete for a mortality indicator. Yet this conflates lethality with importance: URI dominates primary-care visits, school absence, and antibiotic consumption, as the leading indication for inappropriate pediatric prescribing and an unmonitored driver of resistance [10,11]. A morbidity-and-stewardship indicator (episodes per child per year; prescriptions per episode) is computable from existing data streams; what was missing is the burden quantification.
4.3. The Stalled Incidence Decline, in Context
LRI incidence fell at −2.99% per year because the field deploys incidence-reducing instruments (vaccines, nutrition, cleaner household air) [15,18]; URI has none: no vaccine against the common-cold agents exists or is near [1,5], supported prevention (hand hygiene, possibly zinc) is modest [2], and transmission is sustained by childhood’s social density [3,4]. Flat-to-rising rates in East and Southeast Asia and Oceania plausibly track day-care enrollment, urban mixing, and ascertainment. The stalled incidence thus measures how much pediatric illness the current prevention paradigm leaves untouched by design; the system’s task is to manage 5.6 billion annual episodes without collateral damage—above all, without antibiotics.
4.4. Mortality Without a Killer Disease: Reading 16,382 Deaths Honestly
URI is clinically non-lethal, so a modeled toll of 16,382 deaths requires explanation rather than celebration. First, provenance: URI deaths in GBD arise substantially from garbage-code redistribution of deaths certified to ill-defined or implausibly mild respiratory categories [13,20], so the point estimate measures classification behavior as much as biology; its 342%-wide UI (1,781–57,834) marks this quantity among the least certain in the cause-of-death envelope. Second, the concentration signals are internally coherent: 85.7% under age 5, where severe upper-airway presentations are real if rare, and 89.2% in low-SDI settings, where care arrives late and certification is weakest. Third, the mortality EAPC ladder (−9.47% to −2.10% per year, high-middle to low SDI) suggests converging certification and care where income rises and persistent data poverty at the bottom. We report the gradient as a signal to investigate, not a toll to target, bounding every mortality claim with its interval.
4.5. Equity Implications and a Plausible Control Agenda
The flat incidence gradient is itself an equity finding: exposure is essentially universal—high-SDI children record the highest episode rates (255,578 per 100,000), plausibly reflecting day-care attendance and reporting completeness. What development determines is what happens around the episode: an antibiotic prescription [10], a school absence, a correctly certified severe event, or a death; the 66-fold mortality gradient on a flat exposure base places the inequality entirely in the response system. Covariate results (Section 3.6) support this: mortality tracked UHC coverage and GDP per capita; incidence rose weakly with them; no climate signal survives regional recomputation. As an illustrative bound, equalizing regional mortality to the best-quartile rate (0.017 per 100,000) would avert ≈15,900 of the 16,382 deaths (97%; Monte Carlo UI 3,300–35,100)—a statement about concentration, not an attainable target. Remedies differ by margin. On morbidity, which is everywhere: antibiotic stewardship with prescription-per-episode metrics [10,11], evidence-based symptomatic care, and explicit deprescribing of antibiotics, antihistamine–decongestant combinations, and codeine-class antitussives [2,12]. On the mortality residuum: severe-illness recognition and referral in low-SDI settings, and investment in cause-of-death data quality so the 32-fold uncertainty range narrows toward a number policy can act on.
4.6. Limitations
Several limitations qualify these findings. First, caliber: URI rows provide numbers without rates for all required slices, crude rates rest on back-calculated populations (cross-validated exactly against an independent same-round back-calculation); rate UIs omit denominator uncertainty, and summed UIs use conservative direct addition. Second, the asthma anchor is a GBD 2021 prevalent-case count, excluded from ratio computations; all cross-cause ratios are point-estimate constructs. Third, and most consequential, mortality: URI deaths are heavily model-driven via garbage-code redistribution (2023 UI 1,781–57,834; width 342%); every ranking, share, and gradient built on deaths is a point-estimate statement within those intervals. Fourth, GBD publishes no single-year ages, so infancy-specific patterns cannot be resolved. Fifth, the pandemic window carries no usable signal and we decline to report it as a result (global incidence +0.32%, 2019→2020, versus same-round 0–19-year LRI deaths −27.0%, 2019–2021; Supplementary Table S3); these estimates cannot support claims about NPI suppression of URI transmission. Sixth, URI incidence is modeled from sparse morbidity data through DisMod-MR 2.1 [14]; estimates suit orders of magnitude, gradients, and long-run trends, not annual movements, and the analysis is descriptive and ecological. Finally, covariate analyses rest on region-level estimates (21 regions; 13 in the island analysis), leaving the climate test underpowered.
5. Conclusions
This first dedicated, age-disaggregated assessment of the global URI burden at ages 0–19 years, 1990–2023, finds 5.616 billion incident episodes (95% UI 4.133–7.330 billion), about 2.1 per child per year, against 16,382 deaths (1,781–57,834). The pattern is a double asymmetry: incidence has stalled for three decades (−0.27% per year, one-eleventh of the LRI pace) because no incidence-reducing instrument exists for the common cold, while the small mortality residuum concentrates where systems are weakest (85.7% of deaths under age 5; 89.2% in low-SDI countries; a 66-fold gradient on flat exposure). URI should enter child-health surveillance as a morbidity and antibiotic-stewardship indicator; practice should prioritize antibiotic-sparing symptomatic care and severe-illness triage where residual deaths occur; and investment in cause-of-death certification would convert an estimate too uncertain to act on into one that can be tracked against the next GBD round.
Supplementary Materials
The following supporting information can be downloaded at the website of this paper posted on Preprints.org.
Author Contributions
(1) Conception and design: SC and DL; (2) Administrative support: SC; (3) Provision of study materials or patients: None (secondary analysis of public aggregate data); (4) Collection and assembly of data: DL, HC, SS and XW; (5) Data analysis and interpretation: SC, DL and SS; (6) Manuscript writing: SC and DL; (7) Final approval of manuscript: All authors.
Funding
Beijing Science and Technology Nova Program Interdisciplinary Project (20230484439) and Beijing High-Level Public Health Technical Talents Project (2023-02-33).
Ethics approval and consent to participate
This study is a secondary analysis of de-identified, aggregate, publicly available estimates from the Global Burden of Disease (GBD) Study 2023, coordinated by the Institute for Health Metrics and Evaluation (IHME). No individual-level or identifiable data were accessed. In accordance with institutional policy for research on publicly available aggregate data, this study was exempt from institutional review board approval. No participant consent was required.
Consent for publication
Not applicable.
Availability of data and materials
All estimates analyzed in this study are publicly accessible through the IHME GBD Results Tool (https://vizhub.healthdata.org/gbd-results/), Global Burden of Disease (GBD) Study 2023 round, using the fully specified, reproducible queries described in Section 2.1.2 (cause: upper respiratory infections; comparators: lower respiratory infections, diarrhoeal diseases, tuberculosis; measures: deaths, incidence; numbers with 95% uncertainty intervals). The author-aggregated derived datasets (0–19-year totals, SDI and regional stratifications, EAPC tables, pandemic-window year-on-year changes, back-calculated population denominators, ecological covariate tables) and the Python analysis code reproducing every derived quantity are available from the corresponding author on reasonable request.
Acknowledgments
We thank the Institute for Health Metrics and Evaluation (IHME), University of Washington, for making the GBD 2023 estimates publicly available through the GBD Results Tool, and the Global Burden of Disease Collaborator Network, whose primary data collection and modeling underpin all estimates analyzed here.
Use of Artificial Intelligence
AI tools were used for language polishing and code drafting.
Conflicts of Interest
The authors declare no competing interests.
Abbreviations
AMR, antimicrobial resistance; CI, confidence interval; CODEm, Cause of Death Ensemble model; DALY, disability-adjusted life-year; EAPC, estimated annual percentage change; FDR, false discovery rate; GAPPD, Global Action Plan for Pneumonia and Diarrhoea; GATHER, Guidelines for Accurate and Transparent Health Estimates Reporting; GBD, Global Burden of Disease; GDP, gross domestic product; ICD-10, International Classification of Diseases, Tenth Revision; IHME, Institute for Health Metrics and Evaluation; LRI, lower respiratory infection; NPI, non-pharmaceutical intervention; RTI, respiratory tract infection; SDI, Socio-demographic Index; SDG, Sustainable Development Goal; UHC, universal health coverage; UI, uncertainty interval; UNICEF, United Nations Children’s Fund; URI, upper respiratory infection; WHO, World Health Organization; YLD, years lived with disability; YLL, years of life lost.
References
- Heikkinen, T.; Järvinen, A. The common cold. Lancet 2003, 361(9351), 51–59. [Google Scholar] [CrossRef]
- Allan, G.M.; Arroll, B. Prevention and treatment of the common cold: making sense of the evidence. CMAJ 2014, 186(3), 190–199. [Google Scholar] [CrossRef]
- Monto, A.S.; Sullivan, K.M. Acute respiratory illness in the community: frequency of illness and the agents involved. Epidemiol. Infect. 1993, 110(1), 145–160. [Google Scholar] [CrossRef]
- Monto, A.S. Studies of the community and family: acute respiratory illness and infection. Epidemiol. Rev. 1994, 16, 351–373. [Google Scholar] [CrossRef]
- Eccles, R. Understanding the symptoms of the common cold and influenza. Lancet Infect. Dis. 2005, 5(11), 718–725. [Google Scholar] [CrossRef]
- Thompson, M.; Vodicka, T.A.; Blair, P.S.; Buckley, D.I.; Heneghan, C.; Hay, A.D. Duration of symptoms of respiratory tract infections in children: systematic review. BMJ 2013, 347, f7027. [Google Scholar] [CrossRef]
- World Health Organization; United Nations Children’s Fund. Ending preventable child deaths from pneumonia and diarrhoea by 2025: the integrated Global Action Plan for Pneumonia and Diarrhoea (GAPPD); WHO/UNICEF: Geneva, 2013; Available online: https://www.who.int/publications/i/item/9789241505239.
- United Nations. Transforming our world: the 2030 Agenda for Sustainable Development (A/RES/70/1); United Nations: New York, 2015; Available online: https://sdgs.un.org/2030agenda.
- Fendrick, A.M.; Monto, A.S.; Nightengale, B.; Sarnes, M. The economic burden of non-influenza-related viral respiratory tract infection in the United States. Arch. Intern Med. 2003, 163(4), 487–494. [Google Scholar] [CrossRef]
- Gonzales, R.; Malone, D.C.; Maselli, J.H.; Sande, M.A. Excessive antibiotic use for acute respiratory infections in the United States. Clin. Infect. Dis. 2001, 33(6), 757–762. [Google Scholar] [CrossRef]
- Llor, C.; Bjerrum, L. Antimicrobial resistance: risk associated with antibiotic overuse and initiatives to reduce the problem. Ther. Adv. Drug Saf. 2014, 5(6), 229–241. [Google Scholar] [CrossRef]
- Smith, S.M.; Schroeder, K.; Fahey, T. Over-the-counter (OTC) medications for acute cough in children and adults in community settings. Cochrane Database Syst. Rev. 2014, (11), CD001831. [Google Scholar] [CrossRef]
- GBD 2023 Causes of Death Collaborators. Global burden of 292 causes of death in 204 countries and territories and 660 subnational locations, 1990–2023: a systematic analysis for the Global Burden of Disease Study 2023. Lancet 2025, 406(10513), 1811–1872. [CrossRef]
- GBD 2023 Disease and Injury and Risk Factor Collaborators. Burden of 375 diseases and injuries, risk-attributable burden of 88 risk factors, and healthy life expectancy in 204 countries and territories, including 660 subnational locations, 1990–2023: a systematic analysis for the Global Burden of Disease Study 2023. Lancet 2025, 406(10513), 1873–1922. [Google Scholar] [CrossRef]
- GBD 2023 Lower Respiratory Infections and Antimicrobial Resistance Collaborators. Global burden of lower respiratory infections and aetiologies, 1990–2023: a systematic analysis for the Global Burden of Disease Study 2023. Lancet Infect. Dis. 2026, 26(4), 343–361. [CrossRef]
- Lu, W.; Guo, X.; Ren, Y.; Wang, L.; Xu, T.; Xu, Y.; et al. Time trends in the burden of non-COVID-19 lower respiratory tract infections among children aged 0 to 14 years. Front Cell Infect. Microbiol. 2025, 15, 1582159. [Google Scholar] [CrossRef]
- Institute for Health Metrics and Evaluation (IHME). GBD Results Tool. Seattle, WA: IHME, University of Washington. Available online: https://vizhub.healthdata.org/gbd-results (accessed on 16–18 August 2026).
- GBD 2021 Lower Respiratory Infections and Antimicrobial Resistance Collaborators. Global, regional, and national incidence and mortality burden of non-COVID-19 lower respiratory infections and aetiologies, 1990–2021: a systematic analysis from the Global Burden of Disease Study 2021. Lancet Infect. Dis. 2024, 24(9), 974–1002. [CrossRef]
- GBD 2023 Demographics Collaborators. Global age-sex-specific all-cause mortality and life expectancy estimates for 204 countries and territories and 660 subnational locations, 1950–2023: a demographic analysis for the Global Burden of Disease Study 2023. Lancet 2025, 406(10513), 1731–1810. [Google Scholar] [CrossRef]
- Naghavi, M.; Makela, S.; Foreman, K.; O’Brien, J.; Pourmalek, F.; Lozano, R. Algorithms for enhancing public health utility of national causes-of-death data. Popul Health Metr. 2010, 8, 9. [Google Scholar] [CrossRef]
- GBD 2021 Diseases and Injuries Collaborators. Global incidence, prevalence, years lived with disability (YLDs), disability-adjusted life-years (DALYs), and healthy life expectancy (HALE) for 371 diseases and injuries in 204 countries and territories and 811 subnational locations, 1990–2021: a systematic analysis for the Global Burden of Disease Study 2021. Lancet 2024, 403(10440), 2133–2161. [Google Scholar] [CrossRef]
- Stevens, G.A.; Alkema, L.; Black, R.E.; Boerma, J.T.; Collins, G.S.; Ezzati, M.; et al. Guidelines for Accurate and Transparent Health Estimates Reporting: the GATHER statement. Lancet 2016, 388(10062), e19–e23. [Google Scholar] [CrossRef]
Figure 1.
Global URI burden at ages 0–19 years, 1990–2023. (A) Incident episodes (billions, left axis) and crude incidence rate per 100,000 (right axis), 1990–2023; shaded bands are 95% uncertainty intervals (UIs) summed across age bands (conservative direct-sum convention, Section 2.5). (B) Deaths (thousands, left axis) and crude mortality rate per 100,000 (right axis), with 95% UIs; note the exceptional width of the mortality interval. (C) Endpoint comparison, 1990 versus 2023: episodes +9.8% (number) and −7.3% (rate); deaths −39.6% (number) and −49.0% (rate). Data: GBD 2023 Results (IHME) [17]. Notes. Ages 0–19 are the official GBD under-5 aggregate plus the 5–9, 10–14, and 15–19-year groups. Rates are crude, computed on back-calculated populations (Section 2.1.3).
Figure 1.
Global URI burden at ages 0–19 years, 1990–2023. (A) Incident episodes (billions, left axis) and crude incidence rate per 100,000 (right axis), 1990–2023; shaded bands are 95% uncertainty intervals (UIs) summed across age bands (conservative direct-sum convention, Section 2.5). (B) Deaths (thousands, left axis) and crude mortality rate per 100,000 (right axis), with 95% UIs; note the exceptional width of the mortality interval. (C) Endpoint comparison, 1990 versus 2023: episodes +9.8% (number) and −7.3% (rate); deaths −39.6% (number) and −49.0% (rate). Data: GBD 2023 Results (IHME) [17]. Notes. Ages 0–19 are the official GBD under-5 aggregate plus the 5–9, 10–14, and 15–19-year groups. Rates are crude, computed on back-calculated populations (Section 2.1.3).
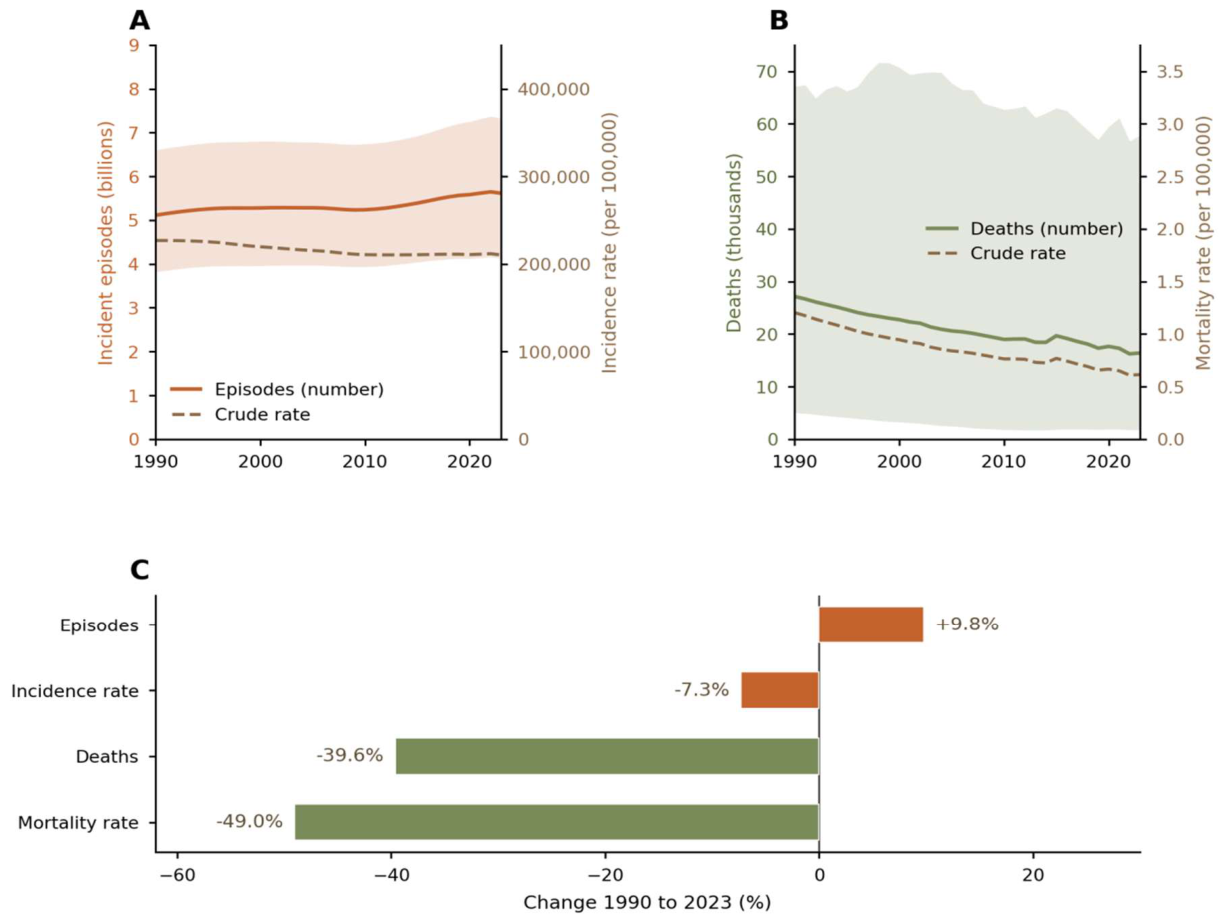
Figure 2.
The pediatric disease spectrum at ages 0–19 years in 2023: incidence versus mortality positioning. (A) Incident episodes (millions, log scale) for URI, diarrhoeal diseases, asthma (prevalent cases, GBD 2021 anchor, hatched), LRI, and tuberculosis; horizontal ticks are 95% uncertainty intervals where available. (B) Deaths (thousands, log scale) for LRI, diarrhoeal diseases, tuberculosis, and URI. (C) Dumbbell plot linking each cause’s incidence rank to its mortality rank, highlighting URI’s extreme divergence (incidence rank 1; mortality rank below LRI, diarrhoeal diseases, and tuberculosis) and the URI/LRI cross-ratios (69.3× incidence; 43.4× mortality, opposite directions). Data: GBD 2023 Results (IHME) [17]; asthma anchor GBD 2021 [21]. Notes. Asthma is plotted in prevalence caliber and excluded from ratio computations in panel C. URI mortality intervals are exceptionally wide (Section 2.5); panel B displays point estimates with intervals.
Figure 2.
The pediatric disease spectrum at ages 0–19 years in 2023: incidence versus mortality positioning. (A) Incident episodes (millions, log scale) for URI, diarrhoeal diseases, asthma (prevalent cases, GBD 2021 anchor, hatched), LRI, and tuberculosis; horizontal ticks are 95% uncertainty intervals where available. (B) Deaths (thousands, log scale) for LRI, diarrhoeal diseases, tuberculosis, and URI. (C) Dumbbell plot linking each cause’s incidence rank to its mortality rank, highlighting URI’s extreme divergence (incidence rank 1; mortality rank below LRI, diarrhoeal diseases, and tuberculosis) and the URI/LRI cross-ratios (69.3× incidence; 43.4× mortality, opposite directions). Data: GBD 2023 Results (IHME) [17]; asthma anchor GBD 2021 [21]. Notes. Asthma is plotted in prevalence caliber and excluded from ratio computations in panel C. URI mortality intervals are exceptionally wide (Section 2.5); panel B displays point estimates with intervals.
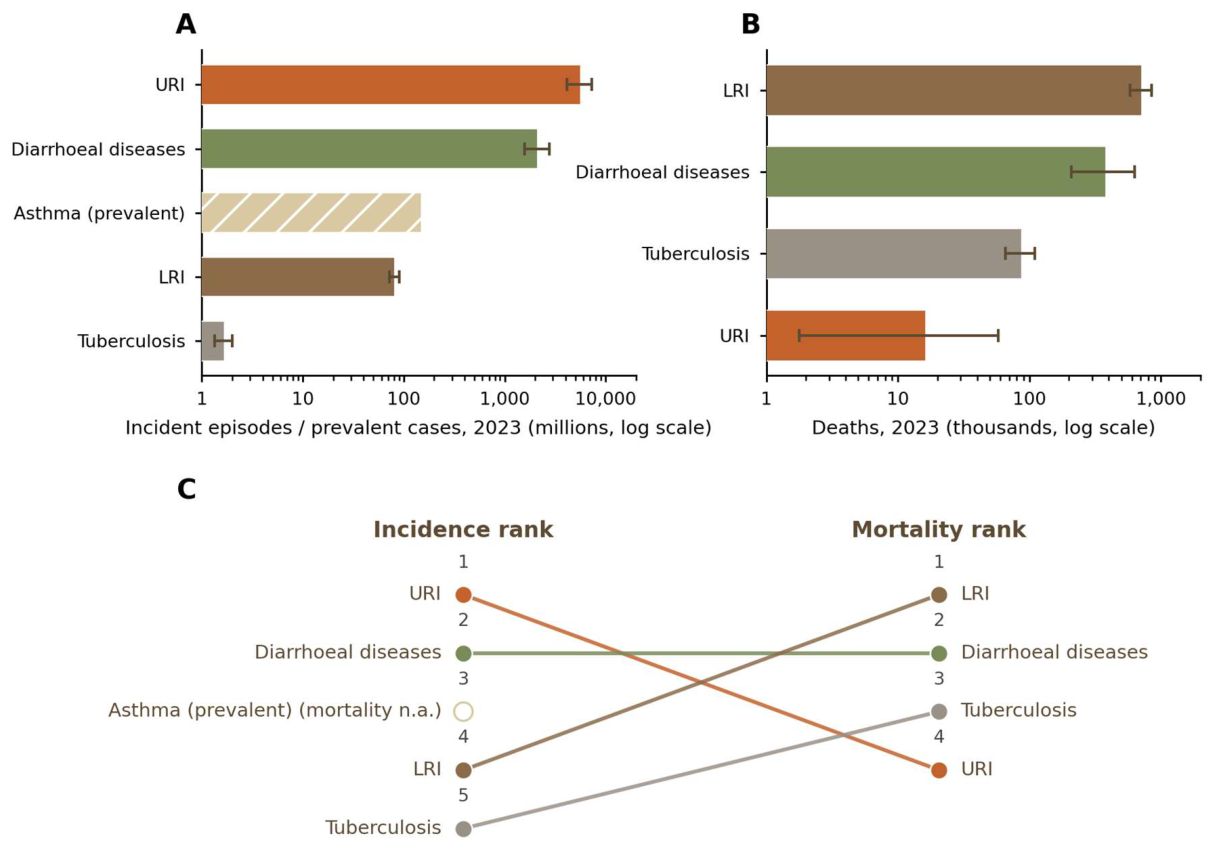
Figure 3.
Socio-demographic Index (SDI) gradient of the URI burden at ages 0–19 years, 2023: same disease, different fate. (A) Crude incidence rate per 100,000 by SDI quintile (near-flat: 183 913–255 578), with 95% uncertainty intervals converted from count UIs. (B) Crude mortality rate per 100,000 by SDI quintile (log scale): 1.724 (low) versus 0.026 (high), a 66-fold gradient. (C) Share of global 0–19-year URI deaths in 2023 by SDI quintile (low SDI 89.2%), and the four Sub-Saharan African regions’ combined share (91.1%). (D) Mortality-rate EAPC 1990–2023 by SDI quintile (−2.10%/yr low to −9.47%/yr high-middle), showing fastest improvement where mortality is already lowest. Data: GBD 2023 Results (IHME) [17]. Notes. Rates are crude, computed on back-calculated populations. Mortality point estimates carry the global 342%-width uncertainty interval (Section 2.5); gradient and shares are stated on point estimates with component UIs displayed.
Figure 3.
Socio-demographic Index (SDI) gradient of the URI burden at ages 0–19 years, 2023: same disease, different fate. (A) Crude incidence rate per 100,000 by SDI quintile (near-flat: 183 913–255 578), with 95% uncertainty intervals converted from count UIs. (B) Crude mortality rate per 100,000 by SDI quintile (log scale): 1.724 (low) versus 0.026 (high), a 66-fold gradient. (C) Share of global 0–19-year URI deaths in 2023 by SDI quintile (low SDI 89.2%), and the four Sub-Saharan African regions’ combined share (91.1%). (D) Mortality-rate EAPC 1990–2023 by SDI quintile (−2.10%/yr low to −9.47%/yr high-middle), showing fastest improvement where mortality is already lowest. Data: GBD 2023 Results (IHME) [17]. Notes. Rates are crude, computed on back-calculated populations. Mortality point estimates carry the global 342%-width uncertainty interval (Section 2.5); gradient and shares are stated on point estimates with component UIs displayed.
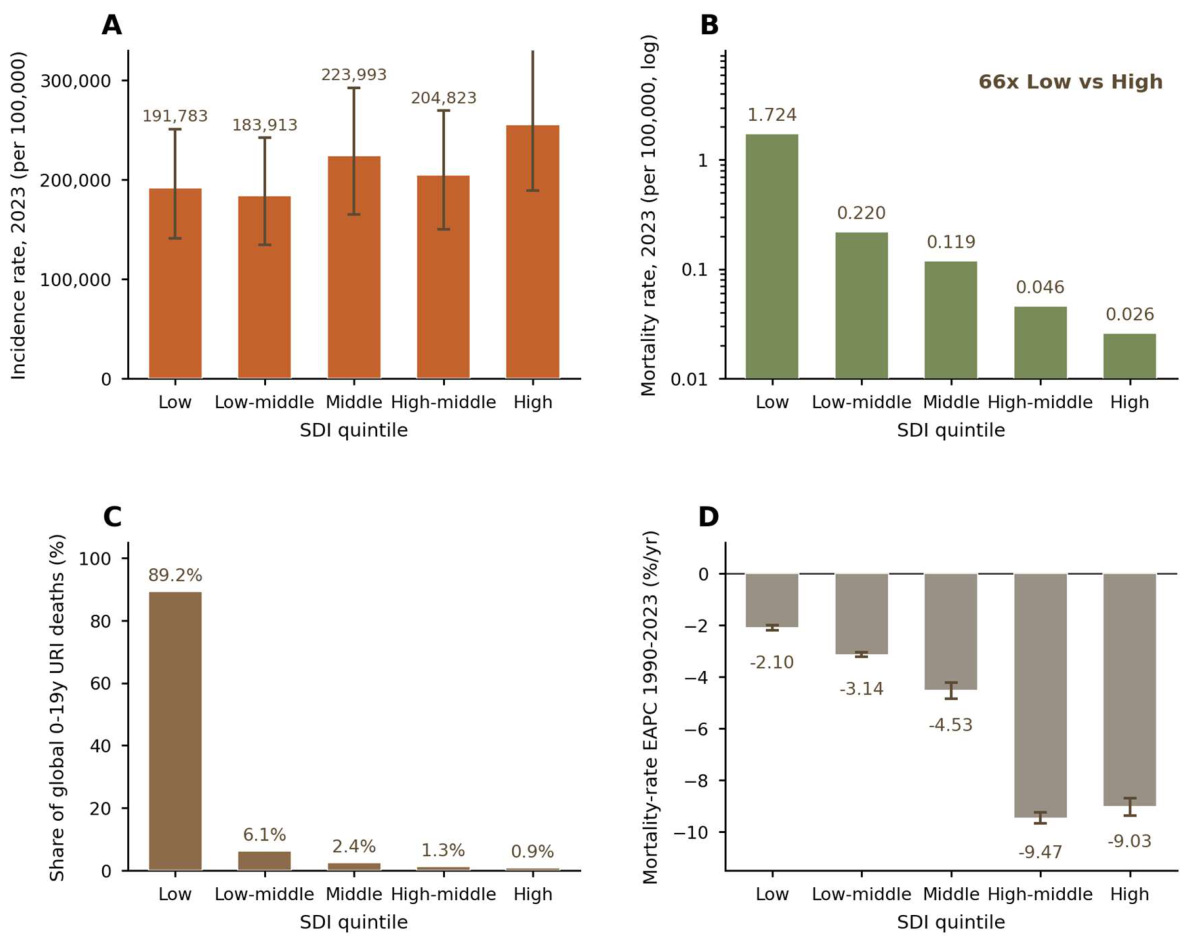

Table 1.
Position of upper respiratory infections (URI) within the pediatric (0–19-year) disease spectrum, Global Burden of Disease Study 2023, year 2023.
Table 1.
Position of upper respiratory infections (URI) within the pediatric (0–19-year) disease spectrum, Global Burden of Disease Study 2023, year 2023.
| Cause | Measure caliber | Episodes / cases 2023, millions (95% UI) | Deaths 2023 (95% UI) | URI-relative ratio |
| URI | Incident episodes | 5,616 (4,133–7,330) | 16,382 (1,781–57,834) | — |
| Diarrhoeal diseases | Incident episodes | 2,125 (1,563–2,762) | 379,958 (209,000–629,000) | URI episodes 2.6×; deaths 23.2× URI |
| Asthma | Prevalent cases | 150.8 (not available) | not analyzed | URI episodes 37.2× asthma cases |
| Lower respiratory infections | Incident episodes | 81.05 (72.33–89.77) | 711,713 (580,000–844,000) | URI/LRI incidence 69.3×; LRI/URI deaths 43.4× |
| Tuberculosis | Incident episodes | 1.67 (1.33–2.00) | 87,764 (66,000–110,000) | URI episodes 3,372×; deaths 5.4× URI |
Data source: authors’ aggregation of GBD 2023 Results Tool extractions [17]; asthma anchor from GBD 2021 [21] (prevalence caliber, not comparable to episode counts). LRI values are the authors’ same-round pediatric aggregation of the same data source. URI-relative ratios computed on point estimates; URI mortality UIs are exceptionally wide (Section 2.5), so mortality ratios are indicative only. Asthma deaths are not tabulated because its comparator role is morbidity volume. UI, uncertainty interval.
Table 2.
Upper respiratory infection burden at ages 0–19 years by Socio-demographic Index (SDI) quintile, 2023, with 1990–2023 rate trends.
Table 2.
Upper respiratory infection burden at ages 0–19 years by Socio-demographic Index (SDI) quintile, 2023, with 1990–2023 rate trends.
| SDI quintile | Incident episodes 2023, billions (95% UI) | Incidence rate per 100,000 | Deaths 2023 (95% UI) | Mortality rate per 100,000 | Share of global deaths | Incidence EAPC %/yr (95% CI) | Mortality EAPC %/yr (95% CI) |
| Low | 1.626 (1.197–2.128) | 191,783 | 14,617 (723–53,905) | 1.724 | 89.2% | −0.35 (−0.42 to −0.28) | −2.10 (−2.21 to −1.99) |
| Low-middle | 0.839 (0.612–1.104) | 183,913 | 1,003 (241–2,818) | 0.220 | 6.1% | −0.31 (−0.37 to −0.24) | −3.14 (−3.24 to −3.05) |
| Middle | 0.751 (0.552–0.980) | 223,993 | 398 (244–653) | 0.119 | 2.4% | −0.03 (−0.07 to +0.02) | −4.53 (−4.85 to −4.22) |
| High-middle | 0.952 (0.696–1.252) | 204,823 | 212 (122–376) | 0.046 | 1.3% | −0.23 (−0.26 to −0.19) | −9.47 (−9.68 to −9.25) |
| High | 1.444 (1.068–1.886) | 255,578 | 147 (114–207) | 0.026 | 0.9% | −0.02 (−0.03 to −0.01) | −9.03 (−9.37 to −8.70) |
Data source: authors’ aggregation of GBD 2023 Results Tool extractions [17]. Counts are 0–19-year sums of the official <5-year aggregate and the 5–9-, 10–14-, and 15–19-year groups (both sexes); summed UIs are direct sums of component bounds (conservative). Rates are crude, computed on back-calculated populations (Section 2.1.3). Shares of global deaths are computed on point estimates; residuals from 100% reflect rounding, and the low-SDI share carries the full width of the global mortality uncertainty (Section 2.5). EAPC, estimated annual percentage change from log-linear regression of the crude rate on calendar year, 1990–2023; CI, confidence interval (regression precision only). Low-to-high mortality gradient: 66-fold (1.724 vs 0.026 per 100,000).
Disclaimer/Publisher’s Note: The statements, opinions and data contained in all publications are solely those of the individual author(s) and contributor(s) and not of MDPI and/or the editor(s). MDPI and/or the editor(s) disclaim responsibility for any injury to people or property resulting from any ideas, methods, instructions or products referred to in the content. |
© 2026 by the authors. Licensee MDPI, Basel, Switzerland. This article is an open access article distributed under the terms and conditions of the Creative Commons Attribution (CC BY) license.
Copyright: This open access article is published under a Creative Commons CC BY 4.0 license, which permit the free download, distribution, and reuse, provided that the author and preprint are cited in any reuse.