

Submitted:
27 October 2026
Posted:
28 October 2026
You are already at the latest version
Abstract
Aims Maternal infection during pregnancy is associated with offspring autism spectrum disorder (ASD) in individual-level studies (pooled OR 1.13–1.32; hospitalisation-grade 1.30–1.81), but negative-control and sibling designs attribute most of it to familial confounding (2.4 million Swedish children: pregnancy HR 1.16; pre-pregnancy control HR 1.25; sibling HR 0.94). Whether any country-level coupling exists has never been tested.Methods We conducted an ecological bounding analysis of the Global Burden of Disease Study 2023 (GBD 2023; 204 countries and territories, 1990–2023). Exposure: incident maternal sepsis and other maternal infections per 1,000 live births; outcome: ASD years-lived-with-disability (YLD) rate at ages 5–9 years. Distributed lags aligned exposure to birth cohorts (k=0–9; primary 7); country-and-year fixed effects and first differences were co-primary, with Driscoll–Kraay baseline inference and cluster- and bootstrap-robust variants. Bidirectional negative controls were judged by equivalence testing (TOST; δ=0.02 fixed before result inspection), future-exposure tests (t+3, t+5), and minimum-detectable-effect bounds.Results The within-country association was weakly negative (FE β=−0.0137; 95% CI −0.0234 to −0.0040 under Driscoll–Kraay; −0.0507 to +0.0233 under country clustering) and structurally non-causal: a flat lag profile with no birth-cohort peak at k≈7; future exposure associated at the same sign and two-thirds magnitude (−0.009/−0.008 at t+3/t+5); the main estimate sat below the negative-control background band's lower edge (band |β|≈0.02–0.05); and the association was zero where diagnostic capacity was high and stable (top HAQ tertile +0.0007), driven by middle-HAQ transition countries (−0.071). The conservative bound excludes positive elasticities above +0.023 (exposure doubling → +2.3% ASD YLDs); the individual-literature-implied elasticity (0.005–0.015) lies within it.Conclusions Country-level data bound but cannot adjudicate the maternal infection–autism question. Maternal sepsis reduction is justified by maternal and neonatal outcomes, not measurable ASD benefit, and GBD ASD maps should be read as diagnostic-capacity maps. Bidirectional negative controls with fixed equivalence margins and future-exposure tests offer a portable standard for reporting ecological nulls.
Keywords:
autism spectrum disorder
; ecological study
; maternal sepsis
; negative controls
Introduction
Maternal immune activation is causal-chain evidence in animals: mid-gestation interleukin-17a engagement produces autism-like phenotypes in mouse offspring (Choi et al., 2016), with window-dependent effects (Knuesel et al., 2014). Human studies show a dose-like gradient in autism spectrum disorder (ASD) risk. Pooled estimates for any maternal infection are modest—OR 1.13 (Jiang et al., 2016) and 1.32 (Tioleco et al., 2021, whose 12–17% population-attributable-fraction claim we flag for later contrast)—rising for hospitalisation-grade infection (OR 1.30, Jiang et al., 2016; HR 1.79, or 1.81 for severe infection, Al-Haddad et al., 2019) and highest in subgroups: first-trimester viral infection (aHR 2.98, Atladóttir et al., 2010), recurrent mid-pregnancy fever (OR 3.12, Hornig et al., 2018), and urinary tract infection (HR 1.89, Al-Haddad et al., 2019). The more severe and systemic the maternal infection—the closer to a sepsis phenotype—the stronger the reported signal. This dose plausibility licenses the Global Burden of Disease (GBD) hospitalisation-grade cause “maternal sepsis and other maternal infections” as the exposure.
The same literature’s own control designs reverse the causal reading. In 2.4 million Swedish children, hospitalisation-treated infection during pregnancy was associated with later autism (HR 1.16, 95% CI 1.09–1.23), but infection in the pre-pregnancy negative-control window carried a larger estimate (HR 1.25, 1.14–1.36), and sibling comparison was null (HR 0.94, 0.82–1.08)—most of the association is familial confounding (Brynge et al., 2022). The pattern replicates across pregnancy-exposure literatures: paternal antidepressant negative controls return positive associations (Sujan et al., 2017), and meta-analytic paternal estimates for offspring attention-deficit/hyperactivity disorder mirror maternal ones (RR 1.46; Chan et al., 2026). The quantitative consequence, fixed in our analysis plan: even a wholly causal hazard ratio of ≈1.2 at a 2–5% exposure share implies a population elasticity of only ≈0.005–0.015—any country-level test is a bounding exercise by construction.
No ecological, cross-national, or GBD analysis has linked maternal infection burden to child autism (searches to 23 August 2026). The nearest neighbours sit on two disconnected sides—GBD descriptive burden studies of maternal sepsis and other maternal infections (Chen et al., 2021; Hu et al., 2025; Wang et al., 2025) on the exposure side, GBD autism epidemiology (Santomauro et al., 2025; Hai et al., 2026) on the outcome—and have never been connected. Cross-national autism gradients are dominated by diagnostic capacity (≈14-fold range, Japan ≈640 versus Bangladesh ≈47 per 100,000), so any ecological test must model ascertainment explicitly. GBD 2023 now provides harmonised estimates of both quantities for 204 countries and territories over 1990–2023 (GBD 2023 Disease and Injury and Risk Factor Collaborators, 2025).
We therefore (i) estimate the within-country elasticity of child ASD years lived with disability (YLDs) to per-1,000-live-births maternal infection burden under birth-cohort-aligned lags; (ii) stress-test any association against bidirectional negative controls, pre-specified equivalence margins, and future-exposure tests; and (iii) bound the admissible ecological elasticity against the individual-literature-implied band, decomposing the residual association by diagnostic capacity. To our knowledge, this is the first ecological analysis linking national maternal sepsis and infection burden to child autism disability, the first to evaluate any maternal-infection–neurodevelopment hypothesis with bidirectional negative controls, future-exposure tests, and pre-specified equivalence margins, and the first to report detectability bounds for such a design (searches to 23 August 2026).
Methods
Design and Data Sources
This secondary analysis of the Global Burden of Disease Study 2023 (GBD 2023 Disease and Injury and Risk Factor Collaborators, 2025) uses a balanced 204-country × 34-year panel (6,936 country-years, no missing cells). All GBD values are modelled estimates (DisMod-MR, CODEm, ST-GPR), not observed counts. The outcome is the autism spectrum disorder (ASD; cause 575) years-lived-with-disability (YLD) rate, both sexes, ages 5–9 years; ASD burden is entirely YLD (Santomauro et al., 2025). All analyses are conducted at the country × year aggregate level; no individual-level causal interpretation is drawn or implied; the design is intended to bound population-level co-movement, not to adjudicate causality. Ethics review was exempted (public aggregate data); the GATHER checklist is in supplement S9.
Exposure: the Per-Live-Birth Caliber
The primary exposure is incident maternal sepsis and other maternal infections (MSMI; cause 368) per 1,000 live births — incident cases divided by live births ×1,000, an MMR-style caliber approximating the probability of in-utero exposure. Live births (mothers aged 10–54 years) are from GBD 2023 demographics (GBD 2023 Demographics Collaborators, 2025). A parallel reference specification uses the age-standardised incidence rate (ASR; pilot caliber). The calibers diverge structurally over 1990–2023 — live births fell faster than maternal infections; cross-caliber ρ≈0.81. Natural-log transform throughout; no zero cells (minimum 3.18 per 1,000 live births).
Outcome and Birth-Cohort-Aligned Lags
The 5–9-year YLD stock at year t comprises the birth cohorts of t−5 to t−9; in-utero exposure centres at ≈t−7.5. Symptoms emerge within the first two years of life (Ozonoff et al., 2010), diagnosis is stable from age 2 (Lord et al., 2006), and the median diagnostic age is ≈49 months (Maenner et al., 2023). We fit distributed lags k ∈ {0, 3, 5, 7, 9}: primary k=7 (n=5,508 = 204 × 27 outcome years, 1997–2023); k=0/3/5 reference; k=9 extension (n=5,100). The pre-specified causal shape: if a birth-cohort channel exists, the lag profile should peak near k≈7; a flat or reversed gradient falsifies that shape.
Statistical Models: Fixed Effects and First Differences as Co-Primary
We estimate ln(ASD YLD){c,t} = β·ln(exposure){c,t−k} + γ·SDI_{c,t} + δ·HAQ_{c,t} + country fixed effects + year fixed effects. Country fixed effects (FE) and first differences (FD) are co-primary: FD eliminates the residual autocorrelation dominating the levels specification (lag-1 autocorrelation 0.932 versus 0.005). Country-specific linear trends are the third shape; all three must concur in sign and magnitude before any point-estimate language is used. Under the log-log reading, β is an elasticity. The between estimator is reported separately, tagged descriptive with no causal standing.
Inference
Baseline inference is Driscoll–Kraay HAC estimation (Bartlett kernel, bandwidth 3; 2–6 sweep sensitivity), absorbing cross-sectional dependence from ST-GPR regional borrowing (Driscoll & Kraay, 1998); robustness layers are country-clustered variance estimation (204 clusters), two-way clustering, and wild cluster bootstrap (B=999) (Cameron et al., 2008). A pre-specified rule governs divergence: year fixed effects force residual cross-country sums to zero, so Driscoll–Kraay and cluster standard errors diverge mechanically (here ≈1:4). Bounding statements always use the wider (cluster) bound; non-zero point-estimate statements require cross-framework concordance — with only Driscoll–Kraay significant, the estimate is “weakly negative, significance framework-dependent”. Diagnostics (supplement S4): variance inflation factor 1.02; residual autocorrelation/Durbin–Watson; bandwidth sweep; near-plateau exposure series (<5% variation) in 49 countries, concentrating identification in ≈155; effective sample size n_eff ≈ 193 (AR(1) design effect 28.6).
Negative Controls and Pre-Specified Equivalence Testing
Exposure-side controls, maternal haemorrhage (cause 367) and hypertensive disorders of pregnancy (cause 369), share the obstetric-care structure without an infectious aetiology (Lipsitch et al., 2010); caliber caveat: both are ASR-only (counts not extracted), a different denominator from the per-1,000-live-births main exposure. Outcome-side controls are age-standardised YLD rates for road injuries (cause 689) and falls (cause 697); both were re-estimated on the matched per-1,000-live-births calibre, reported in Results and supplement S2. Future-exposure tests — the ecological analogue of pre-pregnancy negative-control windows (Flanders et al., 2011; Brynge et al., 2022) — regress outcome_t on exposure at t+3 and t+5; these associations must be strictly zero. Equivalence uses two one-sided tests (TOST; Schuirmann, 1987), margin δ=0.02 fixed before inspection of the confirmatory results reported here: an exposure doubling within ±2% outcome change is negligible against the +35% ascertainment expansion and GBD revisions. Pass criteria (supplement S10): (i) the 90% CI wholly inside [−0.02, +0.02]; (ii) auxiliary — |β|<0.05, 95% CI covering 0; (iii) future-exposure estimates indistinguishable from zero. Pre-specified interpretation: family-level failure quantifies the resolution ceiling — not a dirty design, not a true signal.
Detectability Analysis
Individual-level evidence implies an ecological elasticity f × (HR−1): exposure share f = 2–5% of pregnancies and HR≈1.2 give ≈0.004–0.010; the OR 1.32 upper edge gives 0.006–0.016; reported band 0.005–0.015. Minimum detectable effects (80% power, two-sided α=0.05; 2.80×SE) are computed under both frameworks; bounding statements use the conservative cluster 95% CI upper bound, the Driscoll–Kraay bound alongside.
Covariates
The Socio-Demographic Index (SDI) is the GBD 2023 vintage (GHDx version stamp Y2025M10D12; anchor Global 2019 = 0.6606); the GBD 2021 vintage is a sensitivity. The Healthcare Access and Quality Index (HAQ) proxies ascertainment capacity — GBD 2019 vintage, the latest official round (GBD 2019 Healthcare Access and Quality Collaborators, 2022); only 1990 and 2019 are observed, 1991–2018 linearly interpolated, 2020–2023 carried forward (11.8% of rows, haq_cf=1). Alternative ascertainment proxies — physician density and vaccine coverage — were evaluated and not adopted: neither offers an official harmonised country series matching the panel span.
Multiplicity and Reproducibility
The confirmatory family (m=11: five lag-specific main effects, two exposure-side and two outcome-side controls, two future-exposure tests; Driscoll–Kraay inference) uses Benjamini–Hochberg FDR control at 5% (Benjamini & Hochberg, 1995). A one-click rebuild (run_v2.py, ≈100 s) regenerates every value, with embedded anchor assertions (data anchors, pilot continuity β=−0.0258, panel balance).
Results
Descriptives: Two Calibers, Two Directions
Across 6,936 country-years, incident maternal sepsis and other maternal infections per 1,000 live births span 3.2 to 372.8, quartiles 51.2, 78.8 (median), 124.5. The two exposure calibers move in opposite directions (Figure 1b): the age-standardised incidence rate fell from 468.6 to 344.7 per 100,000 (−26%), whereas incidence per 1,000 live births rose from 94.7 to 108.7 (+15%): live births fell faster than maternal infections. The outcome, the ASD YLD rate at ages 5–9 years, rose from 140.5 to 190.3 per 100,000 (+35%), predominantly ascertainment-driven. Anchors for 2023: 125.9 million live births, 9.94 million MSMI cases, a global mean of 79.0 per 1,000 live births.
Between and Within: Two Estimands, Two Questions
The between estimator — a regression of 204 country means adjusted for country-mean SDI and HAQ, with HC3 standard errors — yields β=+0.097 [+0.052, +0.143], P<0.001, and the 2013 cross-section gives Spearman ρ=+0.32, consistent with the pilot’s ρ=+0.46 (Figure 1a). We report this gradient as descriptive background with no causal standing: the double-high extreme is occupied by low-fertility, high-ascertainment countries (Japan, Republic of Korea, Singapore), whose small live-birth denominators inflate the per-1,000-live-births ratio, while South Asia sits low on both axes — a fertility-denominator and ascertainment structure, not dose-response evidence; country fixed effects absorb it entirely (below). The within estimand (country and year fixed effects, and first differences) is the confirmatory one.
Main Estimate: Weakly Negative, Significance Framework-Dependent
In the primary specification (exposure per 1,000 live births, k=7; n=5,508 country-years), the fixed-effects elasticity is β=−0.0137 (Table 1): Driscoll–Kraay SE 0.0049, 95% CI [−0.0234, −0.0040], P=0.006; country-cluster SE 0.0189, 95% CI [−0.0507, +0.0233], P=0.468; two-way clustering [−0.0494, +0.0220], P=0.452; wild cluster bootstrap P=0.492. The first-differences co-primary gives β=−0.0087 (Driscoll–Kraay 95% CI [−0.0139, −0.0035], P=0.001; cluster [−0.0206, +0.0031], P=0.150; two-way P=0.110; bootstrap P=0.404), and the country-trend specification −0.0093 (Driscoll–Kraay P=0.033; cluster P=0.224). All three shapes concur on a small negative point estimate, but significance splits by inference framework (cluster SE ≈4× Driscoll–Kraay). on the parallel ASR calibre the country-trend shape reverses sign (ASR main estimate −0.0141 → +0.0104; Driscoll–Kraay 95% CI +0.0017 to +0.0191) — T3 verdict: pass on per 1,000 live births; fail (sign reversal) on ASR. Bounding statements use the wider cluster bound, and the point estimate is reported as weakly negative, significance framework-dependent — never as significantly negative (Figure 2a).
Figure 1.
The panel, the exposure calibers, and the lag structure. (a) Cross-country scatter of the 2013 cross-section aligned to birth cohorts (k = 7): x-axis, incident MSMI per 1,000 live births in 2006 (log scale); y-axis, ASD YLD rate per 100,000 at ages 5–9 years in 2013 (log scale); one point per country (n = 204), shaded by SDI (GBD 2023 vintage, 2013). Annotated values: the between-country slope from the 204-country means regression adjusted for SDI and HAQ (+0.097 [95% CI +0.052, +0.143], HC3 standard errors) and the 2013 cross-section Spearman ρ (+0.32). Both are descriptive background with no causal interpretation: the positive between gradient reflects high-ascertainment countries with developing demographic structures and is absorbed entirely by country fixed effects; it is not dose-response evidence. (b) Diverging trends of the two exposure calibers and the outcome, 1990–2023, unweighted country means indexed to 1990 = 100. Incident MSMI per 1,000 live births rose from 94.7 to 108.7 (+15%) because live births fell faster than maternal infections, while the parallel ASR caliber fell from 468.6 to 344.7 per 100,000 (−26%); the ASD YLD rate at ages 5–9 rose from 140.5 to 190.3 per 100,000 (+35%), predominantly ascertainment-driven. The calibers remain correlated (cross-sectional log-log ρ ≈ 0.81) but carry different structural information. (c) Lag profile of the within-country elasticity (log–log β) across distributed lags k = 0, 3, 5, 7, 9: FE with DK 95% CI (circles, numeric labels), FD co-primary (squares), and the ASR-caliber FE profile (dashed, reference). The vertical marker flags the pre-specified primary lag k = 7, the centre of the in-utero window for the 5–9-year outcome stock (birth cohorts t−5 to t−9, centre ≈ t−7.5). The profile is flat (−0.013 to −0.016 across all k) with no peak near k ≈ 7 — the pre-specified causal shape of a birth-cohort channel is absent — and the ASR profile attenuates towards zero as lags lengthen, the opposite of a causal-alignment signature. n = 6,936 (k = 0) to 5,100 (k = 9); all specifications adjust for SDI and HAQ.
Figure 1.
The panel, the exposure calibers, and the lag structure. (a) Cross-country scatter of the 2013 cross-section aligned to birth cohorts (k = 7): x-axis, incident MSMI per 1,000 live births in 2006 (log scale); y-axis, ASD YLD rate per 100,000 at ages 5–9 years in 2013 (log scale); one point per country (n = 204), shaded by SDI (GBD 2023 vintage, 2013). Annotated values: the between-country slope from the 204-country means regression adjusted for SDI and HAQ (+0.097 [95% CI +0.052, +0.143], HC3 standard errors) and the 2013 cross-section Spearman ρ (+0.32). Both are descriptive background with no causal interpretation: the positive between gradient reflects high-ascertainment countries with developing demographic structures and is absorbed entirely by country fixed effects; it is not dose-response evidence. (b) Diverging trends of the two exposure calibers and the outcome, 1990–2023, unweighted country means indexed to 1990 = 100. Incident MSMI per 1,000 live births rose from 94.7 to 108.7 (+15%) because live births fell faster than maternal infections, while the parallel ASR caliber fell from 468.6 to 344.7 per 100,000 (−26%); the ASD YLD rate at ages 5–9 rose from 140.5 to 190.3 per 100,000 (+35%), predominantly ascertainment-driven. The calibers remain correlated (cross-sectional log-log ρ ≈ 0.81) but carry different structural information. (c) Lag profile of the within-country elasticity (log–log β) across distributed lags k = 0, 3, 5, 7, 9: FE with DK 95% CI (circles, numeric labels), FD co-primary (squares), and the ASR-caliber FE profile (dashed, reference). The vertical marker flags the pre-specified primary lag k = 7, the centre of the in-utero window for the 5–9-year outcome stock (birth cohorts t−5 to t−9, centre ≈ t−7.5). The profile is flat (−0.013 to −0.016 across all k) with no peak near k ≈ 7 — the pre-specified causal shape of a birth-cohort channel is absent — and the ASR profile attenuates towards zero as lags lengthen, the opposite of a causal-alignment signature. n = 6,936 (k = 0) to 5,100 (k = 9); all specifications adjust for SDI and HAQ.
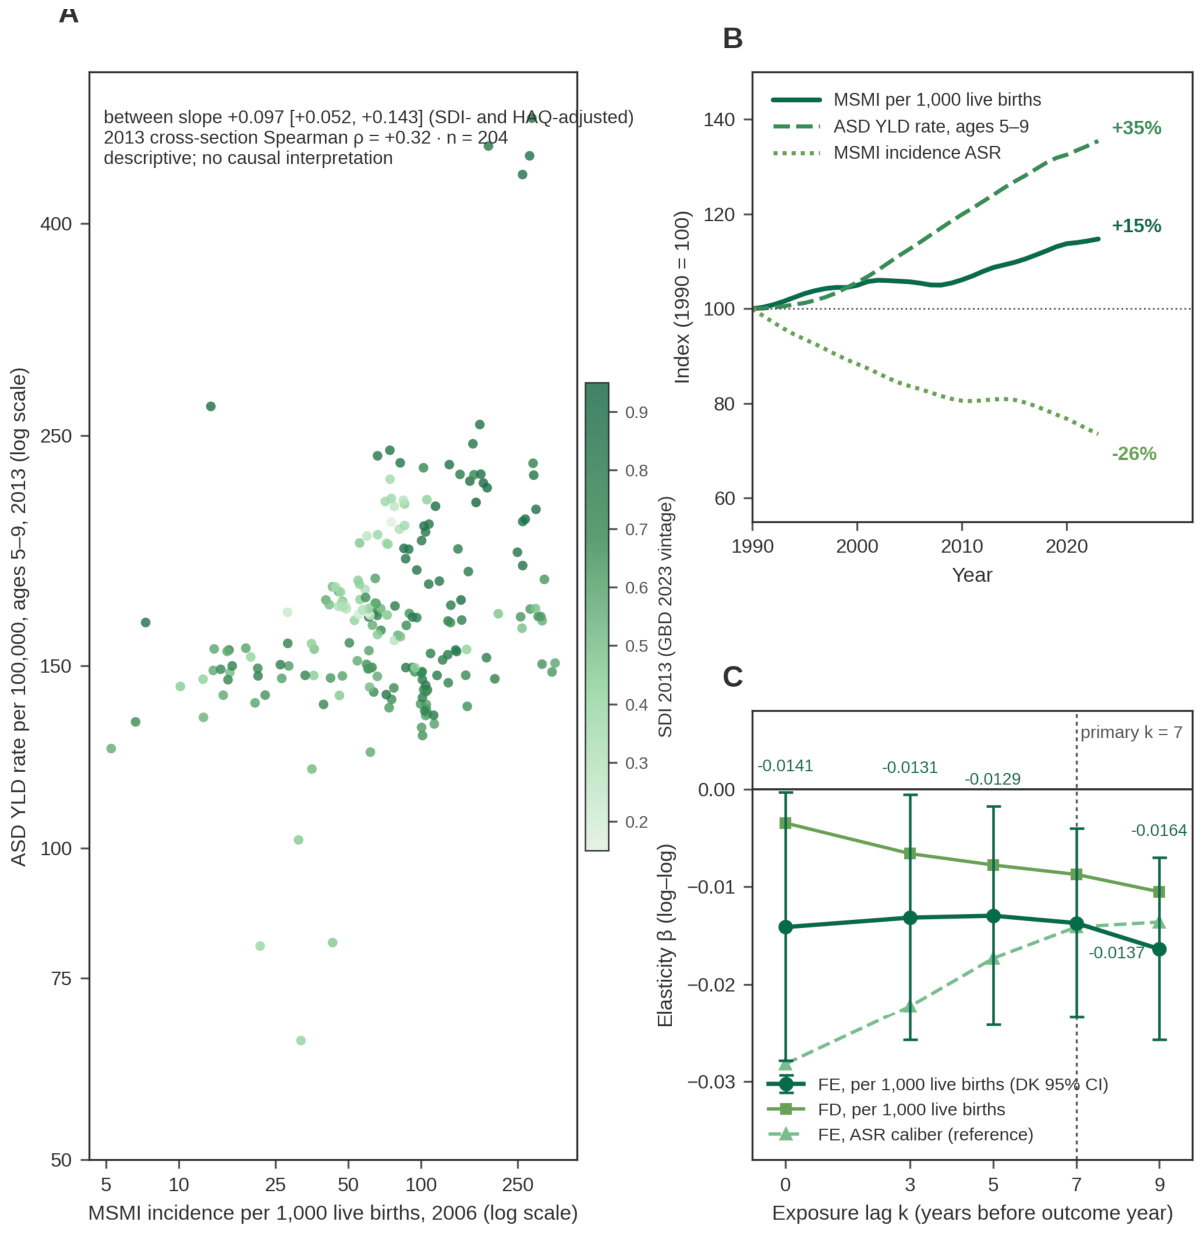
Figure 2.
Coefficient forest: main estimates, negative controls, and future-exposure tests against the equivalence and background bands. Rows show point estimates (log–log elasticity β) with three interval layers: DK 90% CI (thick), DK 95% CI (medium), and country-cluster 95% CI (thin, capped). Main rows (per-1,000-live-births exposure, k = 7; n = 5,508): FE −0.0137 (highlighted diamond), FD −0.0087, FE + country-specific trends −0.0093. Exposure-side negative controls (ASR caliber, incidence counts not extracted — a different denominator structure): maternal haemorrhage (cause 367) +0.0421; hypertensive disorders of pregnancy (369) +0.0232. Outcome-side negative controls (YLD ASR): road injuries (689) −0.0459; falls (697) −0.0268. Matched-calibre (per-1,000-live-births) re-estimates at k = 7 (supplementary file outnc_sepsis_per1000lb_recalc_20261013.csv): road injuries +0.105 and falls +0.018, both failing the TOST at δ = 0.02 (values listed in Table 2 and supplement S2; not plotted in panel a). Future-exposure tests (outcome_t against exposure at t+3, t+5): −0.0092 and −0.0078 in the main caliber; ASR-caliber rows (−0.0253, −0.0227) shown in grey as reference. Reference-interval markers: the solid pale-green band is the pre-specified TOST equivalence margin ±0.02 (δ fixed before result inspection: an exposure doubling within ±2% outcome change); the hatched bands are the empirical negative-control background structure |β| ≈ 0.02–0.05 observed on long-lag smoothed GBD series. The main estimate (−0.0137) sits below the background band's lower edge and cannot be distinguished from the band structure; all four classic negative controls fail the TOST at δ = 0.02 under both inference frameworks (Table 2), which the analysis plan defines as the design’s resolution ceiling — not as evidence of a clean null or of a hidden signal. Future exposure associates at the same sign and roughly two-thirds the magnitude of the k = 7 estimate, identifying persistent country attributes rather than an exposure-to-outcome channel. (b) Detectability and bounding: minimum detectable effects against the individual-literature-implied elasticity band. The x-axis is the ecological elasticity (log–log β; β × 100% ≈ the ASD YLD change per exposure doubling). The shaded green band is the implied ecological elasticity from individual-level evidence (0.005–0.015: exposure share 2–5% of pregnancies × HR ≈ 1.2, extended to the OR 1.32 edge). Tick marks: minimum detectable effects at 80% power (two-sided α = 0.05; 2.80 × SE) — FE 0.014 under DK, FD 0.007 under DK, FE 0.053 under country clustering, and the ASR-caliber FE-DK reference 0.008. Dashed verticals: the pre-specified 95% CI upper bounds for the main specification — DK −0.004 and conservative cluster +0.023. Verdict zones: β > +0.023 is excluded under both inference frameworks; the region between −0.004 and +0.023 is excluded under DK only and remains unresolved under the conservative cluster framework — the implied band lies here; negative elasticities are unresolved under either framework’s upper bound. The design’s information content is the upper bound: positive national coupling beyond an exposure doubling yielding +2.3% ASD YLDs is excluded, while the implied band and the null are simultaneously compatible with our confidence intervals — the design bounds but cannot adjudicate the individual-level dispute (HR ≈ 1.2 wholly causal versus wholly familial confounding). (c–d) Ascertainment stratification. (c) HAQ-tertile decomposition (FE, k = 7, per 1,000 live births, DK 95% CI; 68 countries per tertile): T1 (low) −0.0076 [−0.0329, +0.0176]; T2 (middle) −0.0710 [−0.0932, −0.0487]; T3 (high) +0.0007 [−0.0115, +0.0129]. The entire negative association is generated by middle-HAQ transition countries, where maternal infection falls while autism ascertainment expands; where diagnostic capacity is high and stable (T3), the association is exactly zero. (d) Age gradient of the same specification across ASD outcome age groups: under 5 years −0.0249; 5–9 years −0.0137; 10–14 years −0.0017; 15–19 years +0.0080 — monotone attenuation to zero beyond the diagnostic-accumulation ages. Both panels violate the causal expectation (strongest signal in the birth-cohort-aligned 5–9 window) and indicate a deterministic ascertainment-bias structure, not biological protection. HAQ is GBD 2019 vintage (1990 and 2019 observed; intermediate years interpolated; 2020–2023 carried forward, 11.8% of panel rows).
Figure 2.
Coefficient forest: main estimates, negative controls, and future-exposure tests against the equivalence and background bands. Rows show point estimates (log–log elasticity β) with three interval layers: DK 90% CI (thick), DK 95% CI (medium), and country-cluster 95% CI (thin, capped). Main rows (per-1,000-live-births exposure, k = 7; n = 5,508): FE −0.0137 (highlighted diamond), FD −0.0087, FE + country-specific trends −0.0093. Exposure-side negative controls (ASR caliber, incidence counts not extracted — a different denominator structure): maternal haemorrhage (cause 367) +0.0421; hypertensive disorders of pregnancy (369) +0.0232. Outcome-side negative controls (YLD ASR): road injuries (689) −0.0459; falls (697) −0.0268. Matched-calibre (per-1,000-live-births) re-estimates at k = 7 (supplementary file outnc_sepsis_per1000lb_recalc_20261013.csv): road injuries +0.105 and falls +0.018, both failing the TOST at δ = 0.02 (values listed in Table 2 and supplement S2; not plotted in panel a). Future-exposure tests (outcome_t against exposure at t+3, t+5): −0.0092 and −0.0078 in the main caliber; ASR-caliber rows (−0.0253, −0.0227) shown in grey as reference. Reference-interval markers: the solid pale-green band is the pre-specified TOST equivalence margin ±0.02 (δ fixed before result inspection: an exposure doubling within ±2% outcome change); the hatched bands are the empirical negative-control background structure |β| ≈ 0.02–0.05 observed on long-lag smoothed GBD series. The main estimate (−0.0137) sits below the background band's lower edge and cannot be distinguished from the band structure; all four classic negative controls fail the TOST at δ = 0.02 under both inference frameworks (Table 2), which the analysis plan defines as the design’s resolution ceiling — not as evidence of a clean null or of a hidden signal. Future exposure associates at the same sign and roughly two-thirds the magnitude of the k = 7 estimate, identifying persistent country attributes rather than an exposure-to-outcome channel. (b) Detectability and bounding: minimum detectable effects against the individual-literature-implied elasticity band. The x-axis is the ecological elasticity (log–log β; β × 100% ≈ the ASD YLD change per exposure doubling). The shaded green band is the implied ecological elasticity from individual-level evidence (0.005–0.015: exposure share 2–5% of pregnancies × HR ≈ 1.2, extended to the OR 1.32 edge). Tick marks: minimum detectable effects at 80% power (two-sided α = 0.05; 2.80 × SE) — FE 0.014 under DK, FD 0.007 under DK, FE 0.053 under country clustering, and the ASR-caliber FE-DK reference 0.008. Dashed verticals: the pre-specified 95% CI upper bounds for the main specification — DK −0.004 and conservative cluster +0.023. Verdict zones: β > +0.023 is excluded under both inference frameworks; the region between −0.004 and +0.023 is excluded under DK only and remains unresolved under the conservative cluster framework — the implied band lies here; negative elasticities are unresolved under either framework’s upper bound. The design’s information content is the upper bound: positive national coupling beyond an exposure doubling yielding +2.3% ASD YLDs is excluded, while the implied band and the null are simultaneously compatible with our confidence intervals — the design bounds but cannot adjudicate the individual-level dispute (HR ≈ 1.2 wholly causal versus wholly familial confounding). (c–d) Ascertainment stratification. (c) HAQ-tertile decomposition (FE, k = 7, per 1,000 live births, DK 95% CI; 68 countries per tertile): T1 (low) −0.0076 [−0.0329, +0.0176]; T2 (middle) −0.0710 [−0.0932, −0.0487]; T3 (high) +0.0007 [−0.0115, +0.0129]. The entire negative association is generated by middle-HAQ transition countries, where maternal infection falls while autism ascertainment expands; where diagnostic capacity is high and stable (T3), the association is exactly zero. (d) Age gradient of the same specification across ASD outcome age groups: under 5 years −0.0249; 5–9 years −0.0137; 10–14 years −0.0017; 15–19 years +0.0080 — monotone attenuation to zero beyond the diagnostic-accumulation ages. Both panels violate the causal expectation (strongest signal in the birth-cohort-aligned 5–9 window) and indicate a deterministic ascertainment-bias structure, not biological protection. HAQ is GBD 2019 vintage (1990 and 2019 observed; intermediate years interpolated; 2020–2023 carried forward, 11.8% of panel rows).
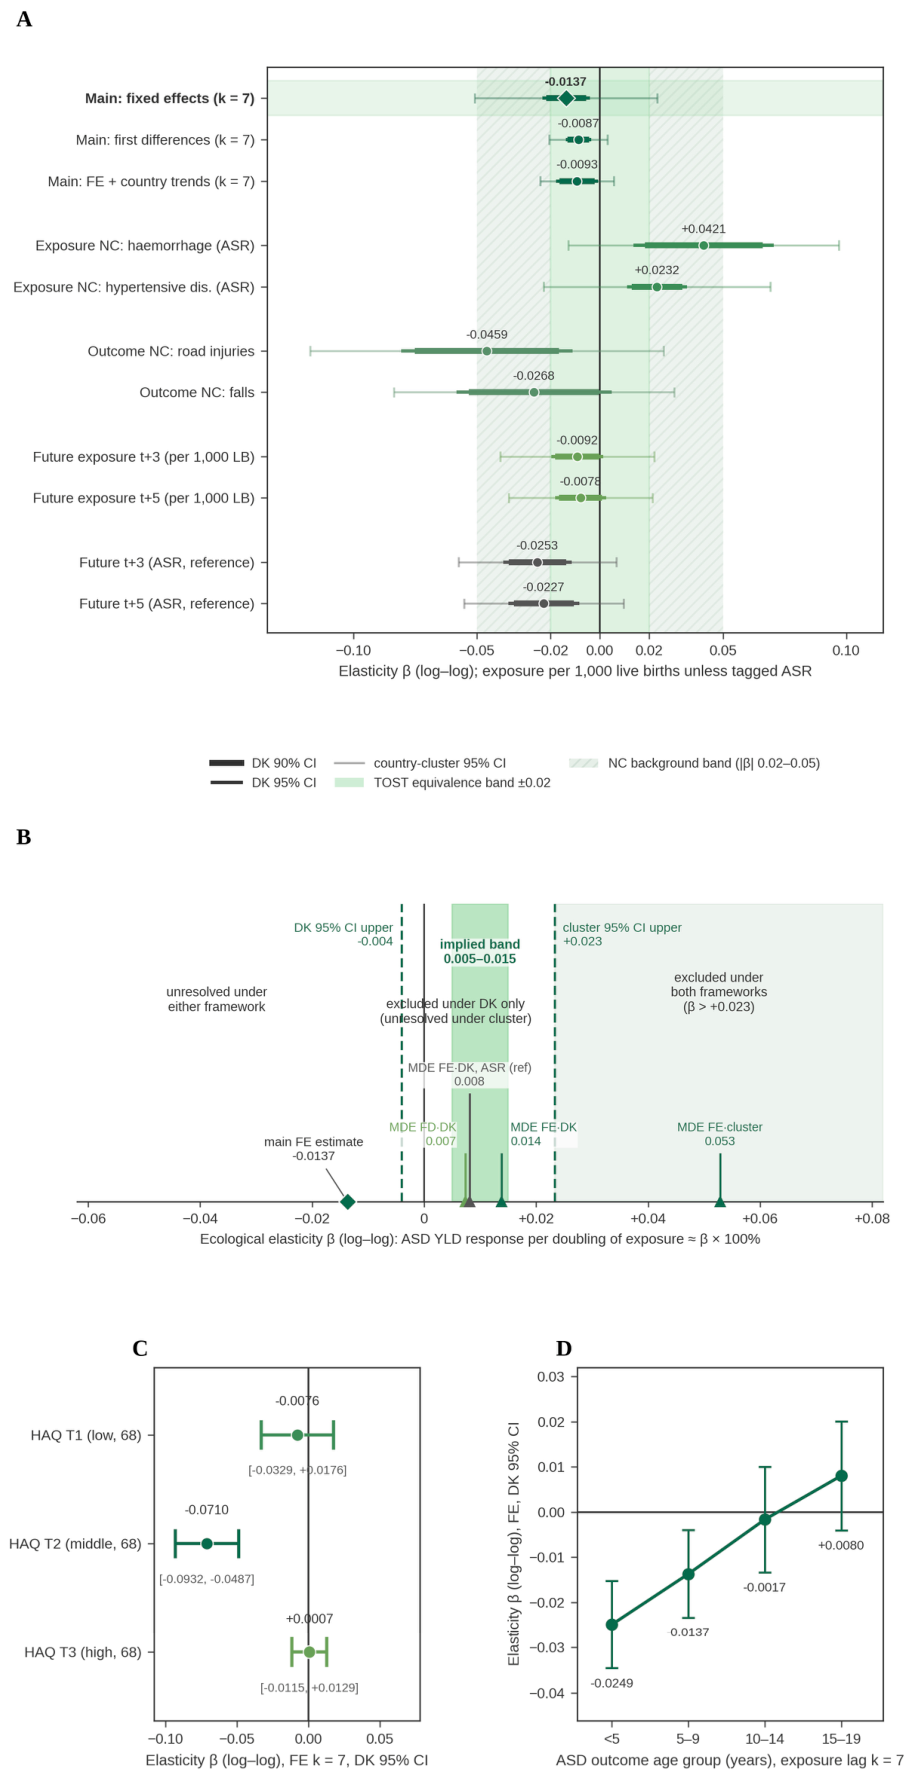

Table 1.
Within-country elasticity of child ASD YLDs to maternal infection burden per 1,000 live births at lag k = 7: co-primary specifications under four inference frameworks. on the parallel ASR calibre the FE + country-trends row reverses sign (−0.0141 → +0.0104, 95% CI +0.0017 to +0.0191) — pass on per 1,000 live births; fail (sign reversal) on ASR.
Table 1.
Within-country elasticity of child ASD YLDs to maternal infection burden per 1,000 live births at lag k = 7: co-primary specifications under four inference frameworks. on the parallel ASR calibre the FE + country-trends row reverses sign (−0.0141 → +0.0104, 95% CI +0.0017 to +0.0191) — pass on per 1,000 live births; fail (sign reversal) on ASR.
| Specification | β | DK(3) SE | DK(3) 95% CI | DK(3) P | DK(4) P | Cluster SE | Cluster 95% CI | Cluster P | Two-way P | Wild-boot P | n |
| Fixed effects (FE) | −0.0137 | 0.0049 | [−0.0234, −0.0040] | 0.006 | 0.006 | 0.0189 | [−0.0507, +0.0233] | 0.468 | 0.452 | 0.492 | 5,508 |
| First differences (FD) | −0.0087 | 0.0026 | [−0.0139, −0.0035] | 0.001 | — | 0.0061 | [−0.0206, +0.0031] | 0.150 | 0.110 | 0.404 | 5,304 |
| FE + country-specific trends | −0.0093 | 0.0043 | [−0.0178, −0.0008] | 0.033 | — | 0.0076 | [−0.0242, +0.0057] | 0.224 | — | — | 5,508 |
Table 2.
Negative-control and future-exposure tests with pre-specified equivalence adjudication (δ = 0.02; FE, k = 7 alignment). the future-exposure test passes on per 1,000 live births; decisive fail on ASR (1.8× main) — both ASR future estimates (−0.0253, −0.0227) lie outside the ±0.02 band at 1.8×/1.6× the ASR main estimate (−0.0141).
Table 2.
Negative-control and future-exposure tests with pre-specified equivalence adjudication (δ = 0.02; FE, k = 7 alignment). the future-exposure test passes on per 1,000 live births; decisive fail on ASR (1.8× main) — both ASR future estimates (−0.0253, −0.0227) lie outside the ±0.02 band at 1.8×/1.6× the ASR main estimate (−0.0141).
| Test | β | DK 90% CI | TOST (DK) | Cluster 90% CI | TOST (cluster) | Auxiliary (|β| < 0.05, 95% CI covers 0) | Verdict |
| Exposure-side: maternal haemorrhage (367) → ASD (ASR caliber) | +0.0421 | [+0.018, +0.066] | Fail | [−0.004, +0.088] | Fail (too wide) | DK fail / cluster pass | Fail |
| Exposure-side: hypertensive disorders of pregnancy (369) → ASD (ASR caliber) | +0.0232 | [+0.013, +0.033] | Fail | [−0.015, +0.062] | Fail (too wide) | DK fail / cluster pass | Fail |
| Outcome-side: MSMI → road injuries (689) YLDs (ASR caliber) | −0.0459 | [−0.075, −0.017] | Fail | [−0.106, +0.014] | Fail (too wide) | DK fail / cluster pass | Fail |
| Outcome-side: MSMI → falls (697) YLDs (ASR caliber) | −0.0268 | [−0.053, 0.000] | Fail | [−0.075, +0.021] | Fail (too wide) | Pass under both | Fail (TOST) |
| Outcome-side: MSMI → road injuries (689) YLDs (per 1,000 live births; matched-calibre recalc 2026-10-13) | +0.105 | [+0.088, +0.122] | Fail | [+0.041, +0.169] | Fail | Fail under both | Fail |
| Outcome-side: MSMI → falls (697) YLDs (per 1,000 live births; matched-calibre recalc 2026-10-13) | +0.018 | [+0.002, +0.034] | Fail | [−0.041, +0.077] | Fail (too wide) | Pass under both | Fail (TOST) |
| Future exposure t+3 → ASD_t (per 1,000 live births) | −0.0092 | [−0.018, 0.000] | Pass (borderline) | [−0.035, +0.017] | Fail (too wide) | Pass under both | Pass on per 1,000 live births (DK only); decisive fail on ASR (1.8× main) |
| Future exposure t+5 → ASD_t (per 1,000 live births) | −0.0078 | [−0.017, +0.001] | Pass | [−0.032, +0.017] | Fail (too wide) | Pass under both | Pass on per 1,000 live births (DK only); decisive fail on ASR (1.6× main) |
| Future exposure t+3 → ASD_t (ASR caliber; reference) | −0.0253 | [−0.037, −0.014] | Fail | [−0.052, +0.002] | Fail | — | Decisive fail on ASR (outside ±0.02; 1.8× the ASR main estimate −0.0141) |
| Future exposure t+5 → ASD_t (ASR caliber; reference) | −0.0227 | [−0.035, −0.011] | Fail | [−0.050, +0.004] | Fail | — | Decisive fail on ASR (outside ±0.02; 1.6× the ASR main estimate −0.0141) |
Lag Profile: Flat, no Birth-Cohort Peak
Fixed-effects estimates across k=0, 3, 5, 7, and 9 are −0.0141, −0.0131, −0.0129, −0.0137, and −0.0164 (Figure 1c): no structure, and specifically no peak near k≈7 that a birth-cohort channel predicts; the most displaced lag (k=9, −0.0164) is the most negative, which no in-utero mechanism predicts. The first-differences profile is a shallow monotone drift (−0.0035 at k=0 to −0.0105 at k=9). In the parallel ASR specification, the profile attenuates towards zero as lags lengthen (−0.028 at k=0 to −0.014 at k=9) — the opposite of a causal-alignment signature: moving exposure into the in-utero window should strengthen, not dilute, the estimate. The country-trend shape diverges in sign in the ASR caliber (positive at all five lags, up to +0.014 at k=3), a detrending artefact of two smooth counter-moving series (supplement S1). The absent k≈7 peak is a falsification of the pre-specified causal shape: the data carry no temporal structure consistent with an in-utero exposure to age-5–9 outcome channel.
Negative Controls and Equivalence Testing: The Background Band
All four classic negative controls fail the pre-specified equivalence test at δ=0.02 under both inference frameworks (Table 2; Figure 2a). The exposure-side controls — ASR caliber, as declared in Methods — are positively associated: maternal haemorrhage β=+0.0421 (Driscoll–Kraay 90% CI [+0.018, +0.066]) and hypertensive disorders of pregnancy +0.0232 ([+0.013, +0.033]); both intervals exclude zero on the positive side. The outcome-side controls are negative: road injuries −0.0459 ([−0.075, −0.017]) and falls −0.0268 ([−0.053, 0.000]). These two outcome-side rows are read on the age-standardised outcome calibre; the companion methodological manuscript identified the resulting denominator mismatch with the per-1,000-live-births exposure, and matched-calibre re-estimation on per 1,000 live births (full grid archived as outnc_sepsis_per1000lb_recalc_20261013.csv in the supplementary materials) reverses the road-injuries control to +0.105 at k=7 (Driscoll–Kraay 95% CI [+0.085, +0.125]; country-cluster 95% CI [+0.029, +0.181], P=0.007) and moves falls to +0.018 ([−0.001, +0.037]; cluster P=0.616); both matched-calibre rows still fail the pre-specified equivalence test at δ=0.02 (Table 2). Under country clustering, every control interval is too wide to declare equivalence. The structure behind these failures: long-lag, smoothed maternal and injury series generate associations of |β|≈0.02–0.05 with mixed sign — the main estimate (−0.0137) is smaller in magnitude than every negative-control estimate on either outcome calibre (the matched-calibre road control reaches +0.105, 7.7-fold the main estimate with reversed sign) and sits below the background band's lower edge. Multiplicity corroborates: three of the six family members passing Benjamini–Hochberg at 5% are negative controls (hypertensive disorders q=0.002; haemorrhage q=0.014; road injuries q=0.022), so significance does not separate the main effect from the control family. The positive obstetric point estimates may carry a weak genuine care-quality channel; we report them without rationalisation. Per the analysis plan, the family’s failure quantifies the design’s resolution ceiling — not evidence of a clean null, nor hidden evidence of a true signal.
Future-Exposure Tests: The Highest-Discrimination Check
Exposure at t+3 yields β=−0.0092 (n=6,324; Driscoll–Kraay 90% CI [−0.018, 0.000]; equivalence pass, borderline), and exposure at t+5 yields −0.0078 (n=5,916; [−0.017, +0.001]; equivalence pass) (Figure 2a). Both carry the same sign as the k=7 main estimate at one-half to two-thirds of its magnitude; in the parallel ASR specification, the future associations (−0.0253 and −0.0227) even exceed the contemporaneous-lag estimate (−0.014). both ASR future associations lie outside the ±0.02 equivalence band (t+3: −0.0253, 95% CI −0.0392 to −0.0115; t+5: −0.0227, −0.0372 to −0.0083), at 1.8× and 1.6× the ASR main estimate (−0.0141) — T1 verdict: pass on per 1,000 live births; decisive fail on ASR (1.8× main). By the logic of pre-pregnancy negative-control windows, associations that run backwards in time at the same magnitude as forward ones identify persistent country attributes and smoothed-trend structure, not an exposure-to-outcome channel. Cluster 90% intervals for both future tests ([−0.035, +0.017] and [−0.032, +0.017]) are too wide to declare equivalence; the Driscoll–Kraay passes are recorded but do not rescue a causal reading.
Detectability: Minimum Detectable Effects Against the Implied Elasticity Band
The individual-level literature implies an ecological elasticity band of 0.005–0.015 (Methods). Minimum detectable effects at 80% power (Figure 2b): fixed effects 0.014 (touching the band’s upper edge) and first differences 0.007 (inside the band) under Driscoll–Kraay; 0.053 and 0.017 under country clustering — the conservative framework detects only couplings several-fold the implied band; the parallel ASR Driscoll–Kraay value is 0.008, also inside the band. The conservative cluster 95% CI upper bound is +0.023: positive national coupling beyond an exposure doubling yielding +2.3% ASD YLDs is excluded. The Driscoll–Kraay upper bound is −0.004: under that framework alone, any positive elasticity is excluded. The implied band sits inside the cluster interval and above the Driscoll–Kraay one, so the design is observationally equivalent to both poles of the individual-literature dispute. Its information content is the upper bound, not a verdict; consistent with that bounding role, no fixed-effects estimate in either caliber, and no first-differences estimate in the primary per-1,000-live-births caliber, returns a positive point estimate at any lag (range −0.028 to −0.003). The country-trend shape departs from this pattern in the ASR caliber (+0.009 to +0.014 across k=0–9; Driscoll–Kraay-significant at all five lags, cluster-significant at k=3 and k=5) and at k=0 in the primary caliber (+0.004, non-significant), with two near-zero positive ASR first-differences rows (≤ +0.002): detrending a smoothly declining exposure against a smoothly rising, ascertainment-driven outcome manufactures such curvature associations — which is precisely why the pre-specified rule withholds point-estimate language unless all three shapes concur (supplement S1).
Ascertainment Stratification and Robustness
Across HAQ tertiles (FE, Driscoll–Kraay inference; Figure 2c): T1 (low, 68 countries) β=−0.0076 [−0.0329, +0.0176], P=0.553; T2 (middle) −0.0710 [−0.0932, −0.0487], P<0.001; T3 (high) +0.0007 [−0.0115, +0.0129], P=0.911. The entire negative association is generated by middle-HAQ transition countries, where maternal infection falls while autism ascertainment expands; where diagnostic capacity is high and stable, the association is statistically indistinguishable from zero. This is direct evidence of a deterministic bias structure, not biological protection. The age gradient is concordant (Figure 2d): under 5 years −0.0249; 5–9 years −0.0137; 10–14 years −0.0017; 15–19 years +0.0080 — monotone attenuation to zero beyond the diagnostic-accumulation ages, again violating causal expectations. Covariate absorption confirms the channel: dropping HAQ moves the estimate to −0.0225 and dropping SDI to −0.0280 — development and ascertainment proxies genuinely confound the association. The robustness battery (Driscoll–Kraay) is uniformly negative (supplement S3–S5): SDI 2021 vintage −0.0196; outcome years ≤2019 only (no carried-forward HAQ) −0.0130; excluding the top SDI quintile −0.0189; excluding the 49 near-plateau exposure countries −0.0165 [−0.0266, −0.0064]. The ≤2019 restriction removes every pandemic-era outcome year (a de facto pandemic-exclusion check); the primary exposure window (1990–2016) predates the pandemic. Leave-one-country-out over 204 countries spans β ∈ [−0.0223, −0.0067]; the largest influences are Taiwan (Province of China), France, Canada, Nepal, and Japan, with no single-country driver. The Driscoll–Kraay bandwidth sweep (L=2–6) is immaterial (P=0.003–0.006). The information ceiling of the panel — n_eff ≈ 193 effective observations and ≈155 identifying countries — bounds all of the above.
Discussion
Principal Findings
Four findings summarise this 204-country, 34-year ecological panel. First, no fixed-effects estimate in either exposure caliber and no first-differences estimate in the primary caliber returns a positive point estimate across lags k=0–9 (FE/FD range −0.028 to −0.003); the only positive point estimates in the specification grid sit in the country-trend shape (up to +0.014, ASR caliber — reversing the sign of the ASR main estimate at the primary lag, −0.0141 → +0.0104; +0.004 at k=0, primary caliber) and two near-zero ASR first-differences rows (≤ +0.002) — detrending artefacts on smooth counter-moving series, disclosed in full in supplement S1. Second, the primary within-country estimate (primary caliber, k=7) is weakly negative (FE β=−0.0137; FD β=−0.0087), with significance that depends on the inference framework (Driscoll–Kraay P=0.006 versus cluster P=0.468). Third, the association carries no causal temporal structure: a flat lag profile with no birth-cohort peak at k≈7, same-sign future-exposure associations at one-half to two-thirds magnitude on the primary caliber (1.8×/1.6× the main estimate on the ASR calibre — decisive fail), a main estimate smaller in magnitude than every negative-control estimate and sitting below the background band's lower edge (band |β|≈0.02–0.05), and an estimate indistinguishable from zero where diagnostic capacity is high and stable (top HAQ tertile +0.0007). Fourth, the design’s information content is a bound: conservative inference excludes positive ecological elasticities above +0.023, and its resolution ceiling is |β|≈0.02–0.05.
The Tension with the Individual-Level Literature: Observational Equivalence
Pooled individual-level estimates—any maternal infection OR 1.13–1.32 (Jiang et al., 2016; Tioleco et al., 2021); hospitalisation-grade infection OR 1.30 (Jiang et al., 2016) to HR 1.81 (Al-Haddad et al., 2019)—map, at realistic exposure shares of 2–5% of pregnancies, to an implied ecological elasticity band of 0.005–0.015. That band sits inside our conservative cluster interval [−0.0507, +0.0233] and above only the Driscoll–Kraay one. Our bound is therefore simultaneously compatible with “HR≈1.2 wholly causal” and with the familial-confounding reading of the Swedish family designs (Brynge et al., 2022), a pattern paternal negative controls replicate (Sujan et al., 2017); the ecological layer cannot adjudicate the dispute. Two cross-level echoes: the between-country gradient (β=+0.097; descriptive, no causal interpretation) replays the unadjusted register association and is absorbed by country fixed effects—an ecological analogue of the sibling-comparison attenuation—and the clinical arithmetic (even a wholly causal reading of the register association — HR≈1.2 at a 2–5% exposure share — implies a population-attributable fraction of ≈0.4–1%; the strongest estimate, HR 1.81, would imply 1.6–3.9%) means no measurable ASD dividend from maternal-infection reduction was to be expected at this resolution; the 12–17% figure flagged from Tioleco and colleagues rests on the high prevalence of any maternal infection, not this hospitalisation-grade share. Finally, the failed-equivalence control family is itself informative: smoothed GBD series at long lags carry |β|≈0.02–0.05 of mixed-sign background structure, for which future ecological studies on such series must budget.
Implication 1: The Value of Reducing Maternal Sepsis Lives Elsewhere
Maternal sepsis and other maternal infections remain leading, preventable causes of maternal and neonatal harm (Bonet et al., 2020; Yu et al., 2025). Their reduction is justified by maternal survival and neonatal outcomes; no measurable ASD benefit should be expected from it. Clinically, our bound reinforces the counselling stance the Swedish family designs already imply: a history of infection in pregnancy should not be read as causal attribution for a child’s autism—the population-attributable burden is of the order of 1%—and family-based designs with negative controls should be the default filter when reading this literature.
Implication 2: GBD Autism Maps Are, First, Diagnostic-Capacity Maps
Three observations triangulate: the ≈14-fold cross-national prevalence gradient, far beyond plausible exposure-driven variation; the positive between-country association (β=+0.097; descriptive, no causal interpretation) that fixed effects absorb entirely; and the HAQ-tertile decomposition, in which the whole negative within association is generated by middle-tertile transition countries (−0.0710)—maternal infection falling while autism ascertainment expands—while the top tertile returns +0.0007. National ASD YLD levels and trends therefore index diagnostic-system capacity and its expansion far more than any exposure gradient. Two consequences follow: ecological studies of autism on GBD must include an ascertainment proxy and treat residual structure as bias until proven otherwise, and rising-burden narratives for autism (Santomauro et al., 2025) should be read through the ascertainment lens before any aetiological one.
Implication 3: A Reporting Standard for Ecological Nulls
The portable elements are five: bidirectional negative controls—exposure-side and outcome-side—judged against equivalence margins fixed before result inspection rather than “no significant association” rhetoric; future-exposure tests as the ecological analogue of pre-pregnancy negative-control windows (Flanders et al., 2011; Brynge et al., 2022); an explicit minimum-detectable-effect versus implied-elasticity comparison, so every null reports what it could have detected; dual-inference reporting (Driscoll–Kraay alongside cluster and bootstrap) under a pre-specified conservative-bounding rule; and the “bounding, not adjudication” claim ceiling. The apparatus generalises to other exposure–neurodevelopment hypotheses on GBD panels, where smoothed series make background structure the rule.
Limitations
Ten limitations qualify this analysis. (i) Ecological fallacy: aggregation submerges subgroup effects—gestational-week-specific and severe-infection subgroups in particular—and all statements are strictly at the country × year level (Robinson, 1950; Greenland & Robins, 1994; Morgenstern, 1995). (ii) Modelled, smoothed inputs: all GBD values are DisMod-MR/ST-GPR estimates, not counts. (iii) Inference divergence: the estimate is significant under Driscoll–Kraay but not under cluster, two-way cluster, or bootstrap inference (mechanism declared in Methods). (iv) Negative-control caliber mismatch: the haemorrhage and hypertensive-disorders controls are age-standardised rates only (incidence counts not extracted), a different denominator from the per-1,000-live-births main exposure; additional exposure-side controls (non-infectious obstetric causes) are a planned extension. (v) Draws not propagated: this is a point-estimate analysis; GBD estimation uncertainty is not carried into standard errors, so every interval understates total uncertainty. (vi) Vintage seams: HAQ is GBD 2019 vintage (interpolation and 2020–2023 carry-forward declared in Methods); the SDI vintage shifts the point estimate (−0.0196 versus −0.0137). (vii) Identification concentration: effective identification concentrates in ≈155 countries (Methods). (viii) Fertility is not separately modelled: it is absorbed by SDI’s under-25 fertility component and by the exposure’s live-birth denominator. (ix) Ascertainment drift only crudely proxied: HAQ is a coarse instrument, a single primary lag (k=7) cannot fit high- and low-ascertainment diagnostic calendars, and the middle-HAQ engine marks residual ascertainment confounding as the ceiling. (x) Exposure phenotype dilution: GBD’s maternal sepsis and other maternal infections cause is dominated by the latter, diluting the true sepsis subgroup; the hospitalisation-grade framing is approximate. Equivalence verdicts are sensitive to the fixed margin δ=0.02; per the analysis plan, no alternative margins are headlined.
Conclusion
Across 204 countries and 34 years, maternal sepsis and other maternal infection burden per 1,000 live births is not positively coupled to child autism disability in any fixed-effects or first-differences specification of the primary exposure caliber. The weak negative within-country association (−0.014) has a flat lag profile, same-sign future-exposure counterparts, a magnitude below every negative-control estimate, and is statistically indistinguishable from zero where diagnostic capacity is high and stable. Conservative inference excludes positive elasticities above +0.023 (doubling → +2.3% ASD YLDs). This is a bound, not an adjudication: the individual-level question stands where Brynge and colleagues left it. Reducing maternal sepsis is warranted by maternal and neonatal outcomes; GBD autism maps should be read as diagnostic-capacity maps; and the negative-control, equivalence-testing, future-exposure apparatus is a portable standard for reporting ecological nulls.
Supplementary Materials
The following supporting information can be downloaded at the website of this paper posted on Preprints.org.
Acknowledgments
We thank the Institute for Health Metrics and Evaluation and the Global Burden of Disease Collaborator Network for public access to the GBD 2023 estimates.
Financial support
Beijing Science and Technology Nova Program Interdisciplinary Project (20230484439) and the Beijing High-Level Public Health Technical Talents Project (2023-02-33).
Competing interests
The authors declare that they have no competing interests.
Ethics approval and consent to participate
Not applicable. The work re-analyses public, de-identified, country-level modelled estimates from the Global Burden of Disease Study 2023; no individual-level or identifiable data were used.
Ethical standards
Not applicable. This study is a secondary analysis of publicly available, de-identified, aggregate-level estimates from the Global Burden of Disease Study 2023 and was exempt from institutional ethics review; no human or animal experimentation was performed by the authors.
Consent for publication
Not applicable.
Availability of data and materials
The GBD 2023 estimates analysed in this study are publicly available from the Institute for Health Metrics and Evaluation through the GBD Results Tool (https://vizhub.healthdata.org/gbd-results/). The Socio-Demographic Index series is the official GBD 2023 file distributed via the Global Health Data Exchange (version stamp Y2025M10D12), and the Healthcare Access and Quality Index series is the official GBD 2019 file (the latest official round). All derived datasets underlying the reported values—the balanced country-year panel, model results across both exposure calibers, lags, estimators, and inference modes, equivalence-testing tables, minimum-detectable-effect tables, sensitivity and diagnostics tables, and leave-one-country-out results—are provided as CSV files in the supplementary materials.
Code availability
The analysis script (run_v2.py, provided in the supplementary materials as code/run_v2.py) that regenerates every reported value from the extracted GBD 2023 data in a one-click rebuild (approximately 100 seconds), with embedded anchor assertions (global ASD prevalence ages 5–9 years in 2023; SDI Global 2019 = 0.6606; 2023 live births; 2023 maternal sepsis and other maternal infections cases; HAQ anchors for Norway and Afghanistan; pilot continuity; panel balance), is provided in the supplementary materials.
Analysis-plan discipline statement
The design, primary lag (k=7), per-1,000-live-births exposure caliber, inference hierarchy, equivalence margin (δ=0.02), and negative-control pass criteria were fixed in three internal consultation memoranda dated 23 August 2026, before inspection of the confirmatory results reported here; the memoranda are archived with the supplementary materials (S10). No external registration exists, and none is claimed.
Authors’ contributions
SC conceived and designed the study, performed the analysis, curated the data, and wrote the manuscript. SC is the principal investigator who conceived the study and leads its overall conduct.
Reporting checklist
This study adheres to the Guidelines for Accurate and Transparent Health Estimates Reporting (GATHER); the completed checklist is provided in the supplementary materials (S9).
Use of artificial intelligence
AI tools were used for language polishing and code drafting.
References
- Al-Haddad BJS, Jacobsson B, Chabra S, Modzelewska D, Olson EM, Bernier R, Enquobahrie DA, Hagberg H, Östling S, Rajagopal L, Adams Waldorf KM, Sengpiel V (2019) Long-term risk of neuropsychiatric disease after exposure to infection in utero. JAMA Psychiatry 76, 594-602. [CrossRef]
- Atladóttir HÓ, Thorsen P, Østergaard L, Schendel DE, Lemcke S, Abdallah M, Parner ET (2010) Maternal infection requiring hospitalization during pregnancy and autism spectrum disorders. Journal of Autism and Developmental Disorders 40, 1423-1430. [CrossRef]
- Benjamini Y, Hochberg Y (1995) Controlling the false discovery rate: a practical and powerful approach to multiple testing. Journal of the Royal Statistical Society Series B: Statistical Methodology 57, 289-300. [CrossRef]
- Bonet M, Brizuela V, Abalos E, et al.; WHO Global Maternal Sepsis Study (GLOSS) Research Group (2020) Frequency and management of maternal infection in health facilities in 52 countries (GLOSS): a 1-week inception cohort study. Lancet Global Health 8, e661-e671. [CrossRef]
- Brynge M, Sjöqvist H, Gardner RM, Lee BK, Dalman C, Karlsson H (2022) Maternal infection during pregnancy and likelihood of autism and intellectual disability in children in Sweden: a negative control and sibling comparison cohort study. Lancet Psychiatry 9, 782-791. [CrossRef]
- Cameron AC, Gelbach JB, Miller DL (2008) Bootstrap-based improvements for inference with clustered errors. Review of Economics and Statistics 90, 414-427. [CrossRef]
- Chan JKN, Zhong AHF, Lam JYH, Wong CSM, Solmi M, Correll CU, Chang WC (2026) Maternal and paternal antidepressant use before and during pregnancy and offspring risk of neurodevelopmental disorders: a systematic review and meta-analysis. Lancet Psychiatry 13, 472-484. [CrossRef]
- Chen L, Wang Q, Gao Y, Zhang J, Cheng S, Chen H, Zeng Z, Wang Z (2021) The global burden and trends of maternal sepsis and other maternal infections in 204 countries and territories from 1990 to 2019. BMC Infectious Diseases 21, 1074. [CrossRef]
- Choi GB, Yim YS, Wong H, Kim S, Kim H, Kim SV, Hoeffer CA, Littman DR, Huh JR (2016) The maternal interleukin-17a pathway in mice promotes autism-like phenotypes in offspring. Science 351, 933-939. [CrossRef]
- Driscoll JC, Kraay AC (1998) Consistent covariance matrix estimation with spatially dependent panel data. Review of Economics and Statistics 80, 549-560. [CrossRef]
- Flanders WD, Klein M, Darrow LA, Strickland MJ, Sarnat SE, Sarnat JA, Waller LA, Winquist A, Tolbert PE (2011) A method for detection of residual confounding in time-series and other observational studies. Epidemiology 22, 59-67. [CrossRef]
- GBD 2019 Healthcare Access and Quality Collaborators (2022) Assessing performance of the Healthcare Access and Quality Index, overall and by select age groups, for 204 countries and territories, 1990–2019: a systematic analysis from the Global Burden of Disease Study 2019. Lancet Global Health 10, e1715-e1743. [CrossRef]
- GBD 2023 Demographics Collaborators (2025) Global age-sex-specific all-cause mortality and life expectancy estimates for 204 countries and territories and 660 subnational locations, 1950–2023: a demographic analysis for the Global Burden of Disease Study 2023. Lancet 406, 1731-1810. [CrossRef]
- GBD 2023 Disease and Injury and Risk Factor Collaborators (2025) Burden of 375 diseases and injuries, risk-attributable burden of 88 risk factors, and healthy life expectancy in 204 countries and territories, including 660 subnational locations, 1990–2023: a systematic analysis for the Global Burden of Disease Study 2023. Lancet 406, 1873-1922. [CrossRef]
- Greenland S, Robins J (1994) Invited commentary: ecologic studies—biases, misconceptions, and counterexamples. American Journal of Epidemiology 139, 747-760. [CrossRef]
- Hai Y, Yang Y, Zou M, Ye P, Wang J, Feng L, Gong X, Zhang T, Tian M, Sun C, Wu L (2026) Global and regional insights: unravelling the epidemiological factors and burden of autism spectrum disorders with a focus on China from 1990 to 2021. BMJ Paediatrics Open 10, e004048. [CrossRef]
- Hornig M, Bresnahan MA, Che X, Schultz AF, Ukaigwe JE, Eddy ML, Hirtz D, Gunnes N, Lie KK, Magnus P, Mjaaland S, Reichborn-Kjennerud T, Schjølberg S, Øyen AS, Levin B, Susser E, Stoltenberg C, Lipkin WI (2018) Prenatal fever and autism risk. Molecular Psychiatry 23, 759-766. [CrossRef]
- Hu Q, Wang L, Chen Q, Wang Z (2025) The global, regional, and national burdens of maternal sepsis and other maternal infections and trends from 1990 to 2021 and future trend predictions: results from the Global Burden of Disease Study 2021. BMC Pregnancy and Childbirth 25, 285. [CrossRef]
- Jiang HY, Xu LL, Shao L, Xia RM, Yu ZH, Ling ZX, Yang F, Deng M, Ruan B (2016) Maternal infection during pregnancy and risk of autism spectrum disorders: a systematic review and meta-analysis. Brain, Behavior, and Immunity 58, 165-172. [CrossRef]
- Knuesel I, Chicha L, Britschgi M, Schobel SA, Bodmer M, Hellings JA, Toovey S, Prinssen EP (2014) Maternal immune activation and abnormal brain development across CNS disorders. Nature Reviews Neurology 10, 643-660. [CrossRef]
- Lipsitch M, Tchetgen Tchetgen E, Cohen T (2010) Negative controls: a tool for detecting confounding and bias in observational studies. Epidemiology 21, 383-388. [CrossRef]
- Lord C, Risi S, DiLavore PS, Shulman C, Thurm A, Pickles A (2006) Autism from 2 to 9 years of age. Archives of General Psychiatry 63, 694-701. [CrossRef]
- Maenner MJ, Warren Z, Williams AR, Amoakohene E, Bakian AV, Bilder DA, Durkin MS, Fitzgerald RT, Furnier SM, Hughes MM, Ladd-Acosta CM, McArthur D, Pas ET, Salinas A, Vehorn A, Williams S, Esler A, Grzybowski A, Hall-Lande J, Nguyen RH, Pierce K, Zahorodny W, Hudson A, Hallas L, Mancilla KC, Patrick M, Shenouda J, Sidwell K, DiRienzo M, Gutierrez J, Spivey MH, Lopez M, Pettygrove S, Schwenk YD, Washington A, Shaw KA (2023) Prevalence and characteristics of autism spectrum disorder among children aged 8 years — Autism and Developmental Disabilities Monitoring Network, 11 sites, United States, 2020. MMWR Surveillance Summaries 72, 1-14. [CrossRef]
- Morgenstern H (1995) Ecologic studies in epidemiology: concepts, principles, and methods. Annual Review of Public Health 16, 61-81. [CrossRef]
- Ozonoff S, Iosif AM, Baguio F, Cook IC, Hill MM, Hutman T, Rogers SJ, Rozga A, Sangha S, Sigman M, Steinfeld MB, Young GS (2010) A prospective study of the emergence of early behavioral signs of autism. Journal of the American Academy of Child and Adolescent Psychiatry 49, 256-266.e2. [CrossRef]
- Robinson WS (1950) Ecological correlations and the behavior of individuals. American Sociological Review 15, 351-357. [CrossRef]
- Santomauro DF, Erskine HE, Mantilla Herrera AM, et al.; GBD 2021 Autism Spectrum Disorder Collaborators (2025) The global epidemiology and health burden of the autism spectrum: findings from the Global Burden of Disease Study 2021. Lancet Psychiatry 12, 111-121. [CrossRef]
- Schuirmann DJ (1987) A comparison of the Two One-Sided Tests Procedure and the Power Approach for assessing the equivalence of average bioavailability. Journal of Pharmacokinetics and Biopharmaceutics 15, 657-680. [CrossRef]
- Sujan AC, Rickert ME, Öberg AS, Quinn PD, Hernández-Díaz S, Almqvist C, Lichtenstein P, Larsson H, D’Onofrio BM (2017) Associations of maternal antidepressant use during the first trimester of pregnancy with preterm birth, small for gestational age, autism spectrum disorder, and attention-deficit/hyperactivity disorder in offspring. JAMA 317, 1553-1562. [CrossRef]
- Tioleco N, Silberman AE, Stratigos K, Banerjee-Basu S, Spann MN, Whitaker AH, Turner JB (2021) Prenatal maternal infection and risk for autism in offspring: a meta-analysis. Autism Research 14, 1296-1316. [CrossRef]
- Wang S, Chen S, Chen M, Xu W, Wu Z, Hu X, Li C, Xiao Z, Ma B, Cheng L (2025) Global, regional and national burden of infections among pregnant women, 1990–2021: a prospective cohort study. BMJ Open 15, e096746. [CrossRef]
- Yu C, Lv H, Fang W, Zhang X, Huang L (2025) Global incidence of maternal sepsis: a systematic review and meta-analysis. Journal of Gynecology Obstetrics and Human Reproduction 54, 102940. [CrossRef]
Disclaimer/Publisher’s Note: The statements, opinions and data contained in all publications are solely those of the individual author(s) and contributor(s) and not of MDPI and/or the editor(s). MDPI and/or the editor(s) disclaim responsibility for any injury to people or property resulting from any ideas, methods, instructions or products referred to in the content. |
© 2026 by the authors. Licensee MDPI, Basel, Switzerland. This article is an open access article distributed under the terms and conditions of the Creative Commons Attribution (CC BY) license (http://creativecommons.org/licenses/by/4.0/).
Copyright: This open access article is published under a Creative Commons CC BY 4.0 license, which permit the free download, distribution, and reuse, provided that the author and preprint are cited in any reuse.