

Submitted:
27 October 2026
Posted:
28 October 2026
You are already at the latest version
Abstract
Thalassaemias, sickle cell disease, and glucose-6-phosphate dehydrogenase (G6PD) deficiency share an evolutionary origin in malaria selection pressure, yet their pediatric trajectories may have diverged under unequal control programs. We jointly analyzed the 0–19-year burden of all three in the Global Burden of Disease Study (GBD) 2023. We extracted deaths, prevalence, and incidence (with 95% uncertainty intervals [UIs]) for the three causes from the GBD 2023 Results Tool—globally, by Socio-demographic Index (SDI) quintile and region—at seven key years (1990–2023), aggregated pediatric age bands into a 0–19-year total, computed key-year estimated annual percentage changes (EAPCs), and examined the 2019–2023 pandemic window. In 2023 the three diseases together caused 39,391 deaths (95% UI 24,456–54,325) at ages 0–19 years—equivalent to 45% of pediatric tuberculosis deaths—with sickle cell disorders contributing 74.6%. Their fates diverged: thalassaemia deaths fell 41.7% since 1990 (mortality-rate EAPC −2.11% per year), whereas sickle cell deaths rose 30.9% (EAPC +0.27%, non-significant). G6PD deficiency affected 168.7 million children (about one in 15) but caused only 1,554 deaths. Sub-Saharan Africa carried 91.8% of pediatric sickle cell deaths, and the low-versus-high-SDI mortality gradient was 66-fold for sickle cell disease versus 8-fold for the other two. The 2019–2023 pandemic window showed no global care-disruption signal. Three malaria-belt diseases met three fates—controlled, stagnating, and silently prevalent. Sickle cell disease, the largest pediatric killer of the three, has been left behind by the intervention architecture that succeeded against thalassaemias; closing the newborn-screening and hydroxyurea gap in sub-Saharan Africa is the defining equity task.
Keywords:
hemoglobinopathies
; thalassemia
; sickle cell disease
; glucose-6-phosphate dehydrogenase deficiency
; global burden of disease
; GBD 2023
; child mortality
; health inequality
; malaria
; newborn screening
1. Introduction
1.1. The Malaria-Belt Legacy: One Selective Pressure, Three Diseases
The thalassaemias, sickle cell disorders, and glucose-6-phosphate dehydrogenase (G6PD) deficiency—the most consequential inherited red-cell disorders of childhood—are evolutionary responses to the same selective pressure: endemic Plasmodium falciparum malaria [1,2]. Haldane’s “malaria hypothesis” and Allison’s sickle-cell-trait experiments established heterozygote advantage against lethal malaria [3,4]; G6PD deficiency, the most common human enzyme defect, shows the same congruence with historical malaria endemicity [5,6,7]. These disorders are the living genetic map of the malaria belt and, through migration, a growing clinical presence far beyond it [8,9].
1.2. Three Diseases, Three Intervention Stories
Despite shared origins, the three diseases offer sharply different intervention templates. Thalassaemia control—carrier screening, antenatal diagnosis, transfusion with iron chelation, curative haematopoietic stem-cell transplantation—has transformed survival where organized programs exist [10,11]. For sickle cell disease the tools are likewise established—newborn screening with penicillin prophylaxis, pneumococcal vaccination, hydroxyurea—but delivery remains concentrated in high-income settings [12,13]; the REACH trial showed hydroxyurea feasible and safe in sub-Saharan Africa [14], yet scale-up has lagged. G6PD deficiency is a third archetype: a vast, mostly asymptomatic carrier population with episodic clinical significance—neonatal jaundice, favism, drug-induced haemolysis—calling for screening and drug-safety policy rather than disease-modifying treatment [6,15].
1.3. Research Gap
Existing global analyses examined these disorders separately, at all ages, or on superseded GBD rounds [5,16,17,18]: thalassaemia-specific global analyses exist on GBD 2019, with joinpoint and age-period-cohort modelling [19], and on GBD 2021 at all ages [20], but neither isolated the pediatric population nor placed the three hemoglobinopathies side by side. None has, to our knowledge, placed the three hemoglobinopathies side by side for the pediatric population (ages 0–19 years) on GBD 2023, tested whether divergent control programs produced divergent pediatric trajectories, or examined the pandemic window for a care-disruption signal.
1.4. Objectives and Contributions
We jointly assessed the global, regional, and Socio-demographic Index (SDI)-stratified burden of the three disorders at ages 0–19 years, 1990–2023, from the GBD 2023 Results Tool [21]. We quantify the 2023 pediatric burden and position combined mortality against same-round pediatric tuberculosis, childhood cancer, and lower respiratory infection (LRI) deaths; characterize the 33-year divergence through key-year estimated annual percentage changes (EAPCs); map regional fingerprints, SDI gradients, and climatic covariates; test the 2019–2023 pandemic window; and document the migration legacy in high-income regions.
2. Methods
2.1. Study Design and Data Sources
This is a secondary analysis of the Global Burden of Disease (GBD) Study 2023, coordinated by the Institute for Health Metrics and Evaluation (IHME) [21,22,23]. GBD 2023 estimates burden for 375 diseases and injuries across 204 countries and territories, 21 GBD regions, and five SDI quintiles; causes of death are modelled with the Cause of Death Ensemble model (CODEm) and non-fatal outcomes with DisMod-MR 2.1, with 95% uncertainty intervals (UIs) from posterior draws [22,23]. In the GBD cause hierarchy, “hemoglobinopathies and hemolytic anemias” is a Level-3 aggregate whose Level-4 child causes include the thalassaemias, sickle cell disorders, G6PD deficiency, and other hemoglobinopathies, with child-cause mortality scaled within the parent envelope [16,22]. We analyze the three named child causes, excluding “other hemoglobinopathies”.
2.2. Author Extraction and the 0–19-Year Caliber
All pediatric estimates derive from raw GBD Results Tool CSV downloads [21] (deaths, prevalence, and incidence as numbers and rates with 95% UIs, both sexes, plus a sex-stratified thalassaemia extraction), covering the global level, five SDI quintiles, and 21 GBD regions for the official <5-year aggregate and the 5–9-, 10–14-, 15–19-, and 20–24-year bands at seven key years (1990–2023); a complementary extraction provided thalassaemia 0–19-year prevalence for 204 countries in 2023. The 0–19-year total sums four non-overlapping rows (<5, 5–9, 10–14, 15–19 years); no estimate was transcribed from any published article.
2.3. Rate Definitions and Population Denominators
All rates are crude band-specific rates per 100,000. Because incidence is congenital, every incident case falls in the <5-year band; incidence rates therefore use the under-5 population (517 million globally in 2023). Population denominators were back-calculated from number/rate pairs (population = number ÷ rate × 100,000) and cross-validated against an independent series from a same-round LRI extraction (maximum relative error ~1×10⁻¹²); the 20–24-year band, used only for age morphology (Section 3.2), uses interpolated key-year denominators.
2.4. Aggregation of Uncertainty Intervals
The GBD Results Tool publishes UIs per row but not for author-computed sums. For 0–19-year totals we pooled band UI half-widths, (upper − lower)/2, by root-sum-of-squares (RSS) under an independence assumption; pooled intervals are thus narrower than official joint-draw intervals (labelled “RSS-UI”).
2.5. Trend Analysis: Key-Year EAPC and the Pandemic Window
Long-term trends were quantified with the estimated annual percentage change (EAPC) from a log-linear regression of the crude rate on calendar year, EAPC = 100 × (e^β − 1), with 95% confidence intervals (CIs) from the slope’s standard error [24]. Incidence-rate EAPCs use the 0–19-year population denominator for thalassaemias and sickle cell disorders; for G6PD deficiency, whose incidence falls entirely in the <5-year band, the under-5 population denominator. Point-in-time incidence rates (Table 1) use the under-5 population as stated in Section 2.3. EAPCs rest on the seven key-year points, not a continuous annual series, and are not directly comparable with full-year EAPCs from prior GBD rounds [17]. The pandemic window was analyzed as two-segment net changes in deaths (2019→2021, 2021→2023) on point estimates, interpreted descriptively given three observation years and small counts.
2.6. Stratification, Sex, and Comparator Causes
Estimates were stratified by age band, the 21 GBD regions, and the five SDI quintiles [22,23]. Sex ratios were computed for thalassaemias from the sex-stratified extraction; the G6PD extraction was Both-sex-only, so its X-linked male predominance is anchored externally [17] (Section 3.5). Same-round author-aggregated 0–19-year deaths for tuberculosis, childhood malignant neoplasms, and lower respiratory infections served as comparators [21]. As an ecological corroboration (Section 3.9), 2023 regional rates were related to population-weighted covariates (mean temperature, relative humidity, absolute latitude, precipitation, urbanization, Gini index) aggregated from a 215-country table to the 21 GBD regions (Spearman correlations, Benjamini–Hochberg-adjusted); country-level testing was feasible only for thalassaemia prevalence.
2.7. Statistical Analysis, Ethics, and Reporting
All derived quantities were computed in Python 3.11 from the downloaded CSVs; no new GBD model runs were performed. Reporting follows the Guidelines for Accurate and Transparent Health Estimates Reporting (GATHER) [25] (completed checklist in Supplementary Material).
3. Results
3.1. Global Burden at Ages 0–19 Years in 2023 and the 33-Year Divergence (Table 1; Figure 1)
In 2023 the three hemoglobinopathies together caused 39,391 deaths (95% RSS-UI 24,456–54,325) at ages 0–19 years worldwide (crude rate 1.55 per 100,000; Table 1). The composition was strikingly asymmetric: sickle cell disorders accounted for 29,392 deaths (14,753–44,030)—74.6% of the total—alongside 6.35 million prevalent cases and 538,125 incident births; thalassaemias caused 8,445 deaths (5,532–11,358), with 970,158 prevalent cases and 113,519 incident births. G6PD deficiency dwarfed both in prevalence—168.7 million affected children, one in 15, and 8.47 million incident births—yet caused only 1,554 deaths (1,045–2,063).
Between 1990 and 2023 the diseases diverged (Table 1; Figure 1). Thalassaemia deaths fell 41.7% (mortality-rate EAPC −2.11% per year, 95% CI −2.19 to −2.03); incident births fell 30.7% and prevalent cases 8.9%. Sickle cell disorders moved the opposite way: deaths rose 30.9% (EAPC +0.27%, −0.06 to +0.60, non-significant), the prevalent caseload grew 74.9% to 6.35 million, and incident births rose 42.6%. G6PD deficiency tracked population growth (prevalent cases +48.6% to 168.7 million; incident births +17.0%), while deaths fell 14.8% (EAPC −1.20%). The combined toll was unchanged across 33 years (38,775 deaths in 1990; 39,391 in 2023) even as under-5 all-cause mortality fell by more than half: the problem has not shrunk—it has been re-sorted into an increasingly African, increasingly sickle-cell problem.
3.2. Age Morphology: Three Different Intervention Windows (Figure 2)
The age distribution of mortality separated the diseases into distinct clinical windows (Figure 2). In 2023, under-5 children carried 63.9% of 0–19-year thalassaemia deaths and 50.8% of sickle cell deaths—windows amenable to newborn screening. G6PD deficiency showed the inverted pattern of a trigger-mediated disorder: only 31.7% of its 0–19-year deaths occurred under 5, while 51.7% of 0–24-year deaths fell at ages 15–24 years, the ages of self-administered drugs, dietary exposures, and unmonitored hemolytic triggers.
3.3. Regional Fingerprints: The Living Map of Malaria Selection (Figure 3)
Each disease kept the geographic signature of its evolutionary origin (Figure 3). Sickle cell disorders remained overwhelmingly a sub-Saharan African (SSA) disease: the four SSA regions carried 91.8% of global 0–19-year sickle cell deaths and 77.4% of prevalent cases in 2023. The highest crude mortality rates occurred in Western (8.18 per 100,000; 95% UI 3.59–12.76) and Central SSA (4.77; lower UI bound 0, signalling model instability). Prevalence rates in Western and Central SSA (1,356.8 and 1,031.0 per 100,000) imply that ~1.0–1.4% of children there live with sickle cell disease; outside SSA, the Caribbean stood out (183.1 per 100,000)—the transatlantic-diaspora legacy.
Thalassaemias showed the complementary Mediterranean–Asian pattern: the highest prevalence rates were in East Asia (107.0 per 100,000), Southeast Asia (91.9), Oceania (47.4), and North Africa and the Middle East (28.1); East, Southeast, and South Asia accounted for 72.7% of pediatric prevalent cases and 44.7% of deaths. The highest thalassaemia mortality rate occurred not in Asia but in Western SSA (0.83 per 100,000)—suggesting under-diagnosis and attribution mixing in African cause-of-death data.
G6PD deficiency traced the entire malaria belt, with prevalence reaching 13,697 per 100,000 (13.7% of children) in Central SSA and 7,690 in South Asia; the belt as a whole (SSA, North Africa and Middle East, South and Southeast Asia, Oceania) accounted for 81.3% of global pediatric G6PD prevalence and 93.3% of deaths.
3.4. Socio-Demographic Index Gradient (Figure 4a–b)
Mortality risk for the same genotype was set by the birthplace health system (Figure 4a–b). In 2023 the 0–19-year crude sickle cell mortality rate was 2.44 per 100,000 in low-SDI versus 0.037 in high-SDI countries—a 66-fold gradient—against far shallower gradients for thalassaemias (0.557 versus 0.069; 8-fold) and G6PD deficiency (0.119 versus 0.015; 8-fold). Low-SDI countries carried 19,492 sickle cell deaths (10,760–28,224), about two-thirds of the global pediatric total, while high-SDI countries recorded 199 (180–219) against 121,656 prevalent cases. The 66-fold gradient, against 8-fold for the companion disorders, isolates what differs for sickle cell disease: the near-absence of newborn screening and hydroxyurea where the birth cohort is largest.
3.5. Sex Differences
For thalassaemias, males carried a higher burden (2023 male-to-female ratio of 0–19-year deaths 1.43, down from 1.53 in 1990; prevalence ratio 1.37)—consistent with male neonatal vulnerability but far from an X-linked magnitude. For G6PD deficiency, the Both-sex-only extraction precluded re-computing the X-linked male predominance; we anchor to Yu and colleagues’ GBD 2021 analysis, where male prevalence exceeded female across age groups [17].
3.6. The Pandemic Window: No Global Care-Disruption Signal
The pandemic-era window (2019→2021→2023) tested whether COVID-19 disrupted transfusion- and clinic-dependent hemoglobinopathy care; globally, it did not. Thalassaemia deaths did not rebound: they fell 1.9% in 2019–2021 and accelerated to −5.0% in 2021–2023 (net −6.8%). Sickle cell deaths rose just 1.1% from 2019 to 2021—within the flat long-term trajectory—and fell 2.7% by 2023. G6PD deaths were essentially unchanged (net −0.4%). Regional point estimates contained small-count noise (e.g., Southern Latin America sickle cell +142.5% on a tiny base)—local perturbations, not a global signal.
3.7. Position Within the Pediatric Mortality Spectrum (Table 2)
In the same GBD round, the three hemoglobinopathies’ combined 39,391 deaths (24,456–54,325) equalled 45% of the 87,764 pediatric tuberculosis deaths and 27% of the 148,436 childhood cancer deaths (Table 2). Sickle cell disorders alone (29,392 deaths) amounted to roughly one-third of pediatric tuberculosis mortality—yet remain far less visible on the pediatric agenda.
3.8. The Migration Legacy: Malaria-Belt Diseases in High-Income Clinics (Figure 4c–d)
Migration has transplanted the malaria belt’s genetic legacy into health systems that never experienced endemic malaria (Figure 4c–d). In 2023, high-income North America hosted 23,553 prevalent 0–19-year sickle cell cases and Western Europe 14,131; G6PD deficiency affected 3.85 million children in high-income North America, 1.97 million in Western Europe, and 115,730 in Australasia—the one high-income region where pediatric G6PD prevalence grew since 1990 (+89.3%). In the 204-country ranking of 0–19-year thalassaemia prevalence, Italy ranked 31st (3,738 cases), the United States 51st, five other non-endemic high-income countries (France, Australia, the United Kingdom, Canada, Germany) placed 77th–98th, and China carried the largest caseload (324,083 cases). Because GBD models high-income prevalence as flat or declining, the migration narrative rests on stock size and country ranks—not on claims of growing high-income burden.
3.9. Ecological Corroboration (Supplementary Table S7–S9)
A region-level ecological test (n = 21; population-weighted covariates from 215 countries) corroborated the malaria-belt reading. Sickle cell mortality rose with mean temperature (ρ = 0.56; Benjamini–Hochberg q = 0.04) and fell with absolute latitude (ρ = −0.53; q = 0.04); G6PD prevalence carried the same climatic signature (latitude ρ = −0.59, q = 0.03; temperature ρ = 0.54, q = 0.04), whereas thalassaemia prevalence showed none (q = 0.18). Neither humidity nor precipitation tracked any outcome. Concentration metrics separated the diseases: sickle cell was the most concentrated (four regions holding 93.8% of prevalent cases; case-versus-population Gini 0.70), G6PD the most evenly spread (Gini 0.24; regional rate range 22-fold), thalassaemias intermediate (Gini 0.41). Across 27 non-endemic high-income destination countries, thalassaemia caseloads scaled with population size, not urbanization (ρ = −0.13, p = 0.52) or inequality (ρ = 0.09, p = 0.69). An island-nation subset was not estimable: 66 island states collapse into 13 GBD regions at regional resolution.
3.10. Joinpoint Trend Decomposition and Socio-Demographic Inequality Indices
As a post-hoc robustness complement to the key-year EAPC (Section 2.5), we fitted segmented log-linear joinpoint models to the seven-point global 0–19-year rate series (grid search over zero or one joinpoint at observed interior years; BIC selection; two joinpoints are not identifiable with seven points), and we quantified cross-quintile inequality with the slope index of inequality (SII) and concentration index (CII) on population-weighted SDI ridit scores (five SDI quintiles, ecological units; 1,000-replicate bootstrap 95% CIs; Supplementary Table S10–S11).
Joinpoint analysis confirmed the three divergent fates (Supplementary Table S10). Thalassaemia mortality fell throughout (AAPC −2.11% per year, 95% CI −2.19 to −2.03) with no BIC-selected joinpoint—a single declining segment across 1990–2023; thalassaemia prevalence likewise showed no joinpoint (AAPC −0.72%, −0.85 to −0.59). Sickle cell mortality first rose (APC +1.45%, 0.60 to 2.31; 1990–2000) before plateauing (−0.10%, −0.43 to 0.23; 2000–2023; AAPC +0.37%, 0.14 to 0.59), and its prevalence kept rising (AAPC +1.17%, 1.09 to 1.26). G6PD deficiency mortality was flat through 2000 (+0.24%, −0.18 to 0.66) then declined (−1.64%, −1.81 to −1.48; AAPC −1.08%, −1.19 to −0.97).
Inequality indices quantified the 66-fold gradient (Supplementary Table S11). In 2023 the sickle cell mortality SII was −3.56 per 100,000 (−3.74 to −0.31) with CII −0.487 (−0.671 to −0.153), little changed from 1990 (SII −3.79 [−4.50 to −0.32]; CII −0.568 [−0.691 to −0.178]) — the absolute slope persisted while relative concentration remained severe. Sickle prevalence inequality widened in absolute terms (SII −497.8 to −656.5 per 100,000). G6PD prevalence showed the largest absolute gradient (2023 SII −6877.4 per 100,000, −7895.1 to −1070.3; CII −0.164 [−0.198 to −0.029]). Thalassaemia mortality concentration deepened (CII −0.170 [−0.230 to 0.003] in 1990 to −0.329 [−0.432 to −0.085] in 2023) even as its absolute slope held near −0.7 per 100,000, reflecting the migration-era redistribution of surviving patients.
3.11. Drivers of DALY Change, 1990–2023: Three-Factor Decomposition
To attribute the divergent trajectories to their demographic and epidemiological drivers, we decomposed the 1990–2023 change in 0–19-year DALYs into population growth, population ageing (within-0–19 age-structure shift), and epidemiological change (age-specific DALY rates) using the Das Gupta three-factor decomposition (factor effects averaged over all sequential-substitution orderings; Supplementary Table S12). Globally, sickle cell DALYs rose by 670,147 (from 1,860,458 to 2,530,606): population growth contributed +57.7% of the net change and epidemiological change +56.7%, while the shifting age structure offset −14.4% — i.e., rising DALYs reflect both more children and rising age-specific burden. In Western sub-Saharan Africa the increase (+745,087 DALYs) was driven entirely by population growth (188.3% of the net change) and was partially offset by falling age-specific rates (−79.8%). Conversely, sickle cell DALYs fell in South Asia (−212,944; epidemiological improvement 129.6% of the decline, offset by population growth −36.4%) and in high-SDI countries (−21,324; epidemiological change 74.6%). Thalassaemia DALYs fell globally by 457,203 (from 1,133,650 to 676,447); this decline was more than fully explained by improving age-specific rates (118.5%) and population ageing (17.4%), against a −35.8% push from population growth. A migration-cohort extension was initially deferred for lack of migrant-flow data; it was subsequently completed with UN DESA migrant-stock data (Section 3.12). G6PD deficiency could not be decomposed because no DALY extraction is available for that cause.
3.12. Migration-Cohort Importation of Thalassaemias: Origin×Destination Analysis
To move beyond the ecological proxy of Section 3.8 (Figure 4c–d), we combined the United Nations Department of Economic and Social Affairs (UN DESA) International Migrant Stock 2024 (POP/DB/MIG/Stock/Rev.2024; destination×origin matrix, 9,348 country-to-country pairs linking 231 destination and 230 origin countries or areas) with the GBD 2023 country-level thalassaemia prevalence rate at ages 0–19 years in each origin country. For every destination we estimated the imported prevalent-case stock as the sum, over origins, of the 2024 migrant stock multiplied by the origin-country prevalence rate, and the migrant stock originating from high-prevalence origins (origin rate above the global 0–19-year rate of 38.12 per 100,000; 15 origin countries, led by Cambodia, the Lao People’s Democratic Republic, Thailand, Maldives and Myanmar). Globally, this origin-attributed calculation yields an imported stock of approximately 84,600 thalassaemia prevalent cases, and 36.65 million migrants (13.0% of the attributed stock) originate from the 15 high-prevalence countries.
The largest estimated imported stocks are in the United States (≈13,300 cases; 52.4 million migrants, 11.1% from high-prevalence origins), Thailand (≈5,300; 85.1% of its 3.2 million migrants from high-prevalence origins), Saudi Arabia (≈5,000; 20.1%), Bangladesh (≈3,100; 75.9%), India (≈3,000; 57.9%), Hong Kong SAR (≈2,800; 90.6%), Australia (≈2,700; 18.9%), Germany (≈2,600; 2.3%), Canada (≈2,500; 15.3%) and the United Arab Emirates (≈2,200; 16.9%) (Supplementary Table S13). The migration-cohort estimates contrast sharply with the destination-based ecological proxy: across the 27 high-income destinations in the Figure 4c–d ecological analysis, no correlation was detected at n = 27 between the destination’s own GBD thalassaemia prevalence and the imported-case estimate per 100,000 destination population (Spearman ρ = 0.281, p = 0.15; ρ = 0.305, p = 0.19 after excluding micro-states below one million population); power is insufficient to exclude moderate correlations (95% CI approximately −0.11 to 0.60), so endogenous prevalence cannot be confirmed or ruled out as a surrogate for the migration-driven importation burden.
These estimates should be read as order-of-magnitude approximations, with two biases acting in opposite directions. First, origin-coverage truncation makes the origin-attributed total a lower bound relative to the listed origins: UN DESA lists only a destination-specific subset of origins individually, so estimates are a lower bound where the residual “Others” category is large, and 27 small origin territories without a GBD 2023 location (≈0.12% of the attributed stock) were omitted. Second, the age-structure mismatch acts in the opposite (upward) direction and is not quantified here: the all-ages migrant stock was combined with a 0–19-year prevalence rate, ignoring migrant age structure and post-migration births and survival, and because thalassaemia prevalence is concentrated in children (for reference, the GBD 2023 global all-ages crude prevalence rate of 16.0 per 100,000 is about 0.42 times the 0–19-year rate of 38.12 per 100,000), applying a pediatric rate to all-ages migrants overstates the per-capita risk; a formal adult/all-ages-prevalence sensitivity analysis would require a country-level all-ages extraction that is not part of this data package. Full per-destination results are provided in migration_import_destination.csv.
4. Discussion
4.1. Principal Findings: Three Fates of One Inheritance
Three disorders born of the same malaria selection pressure met three different fates over 33 years. The thalassaemias have been progressively controlled: pediatric deaths fell 41.7% (mortality-rate EAPC −2.11% per year), with incident births down 30.7%. Sickle cell disease has stagnated: deaths rose 30.9%, the mortality trend is statistically flat (p = 0.17), and the living caseload grew 74.9% to 6.35 million. G6PD deficiency expanded silently to 168.7 million affected children—one in 15 worldwide—while causing only 1,554 deaths. The fingerprints remain those of the malaria belt—91.8% of pediatric sickle cell deaths occur in sub-Saharan Africa and 13.7% of Central sub-Saharan African children carry G6PD deficiency—while the 66-fold low-versus-high-SDI mortality gradient shows that birthplace health systems, not genotypes, now decide who dies.
4.2. Why the Thalassaemias Succeeded
The thalassaemia trajectory demonstrates that a severe inherited blood disorder can be controlled at population scale. Three components explain the decline [10,11,26]: carrier screening and antenatal diagnosis reduced incident births by 30.7%; transfusion with iron chelation extended survival; haematopoietic stem-cell transplantation offered cure in higher-resource settings. Cyprus, Greece, Italy, and Sardinia proved near-elimination of new β-thalassaemia major births achievable [10,11]; our regional EAPCs (East Asia −5.3% per year) suggest the model has diffused eastward. This is the existence proof the sickle cell field lacks: the architecture—screen at birth or before, prevent complications early, escalate disease-modifying therapy—is directly portable.
4.3. Why Sickle Cell Disease Is Being Left Behind
Against this template, sickle cell disease stands out as the pediatric failure. Every element of the control architecture exists: newborn screening with penicillin prophylaxis and pneumococcal vaccination [12,13], hydroxyurea—safe, effective, and feasible in African settings [14]—and, in high-income settings, curative options up to gene therapy [12]. Yet pediatric sickle cell deaths rose 30.9% since 1990, and 91.8% occur in sub-Saharan Africa, where most affected children are born unscreened and many die before diagnosis [13,16]. Demography compounds the gap: the birth cohort grows fastest where incidence is highest (+42.6% since 1990), so even a flat mortality rate produces rising deaths. Despite a 2008 UN General Assembly resolution and a 2006 World Health Assembly report [27,28], sickle cell disease still has no funded global control program comparable to those for HIV, tuberculosis, or malaria [29].
Two caveats qualify this reading. First, the cause-specific pediatric sickle cell mortality UI is wide (2023: 14,753–44,030; some regional lower bounds reach zero), reflecting thin African cause-of-death data; every absolute statement about sickle cell deaths should carry this interval. Second, GBD counts only deaths attributed to sickle cell disease as the underlying cause; the GBD 2021 analysis estimated total mortality of individuals with sickle cell disease at nearly 11 times the cause-specific figure [16]. Our numbers are therefore a conservative floor.
4.4. G6PD Deficiency: The Silent Majority
G6PD deficiency completes the triptych with the opposite problem: not uncontrolled mortality but unrecognized prevalence—168.7 million children (one in 15) carry the deficiency, yet the attributed death toll is 1,554. GBD attributes to G6PD deficiency only deaths for which it is the underlying cause—neonatal jaundice, kernicterus, and sepsis-precipitated hemolysis are largely counted elsewhere, so the ≈108,600:1 prevalence-to-death ratio is partly an artefact of attribution rules [22]; the Both-sex-only extraction likewise could not re-verify the X-linked male predominance established in GBD 2021 [17].
The G6PD finding is nonetheless actionable. Its mortality concentrates at ages 15–24 years (51.7% of 0–24-year deaths)—the ages of self-medication, fava-bean exposure, and unsupervised drug use. The intervention set follows: point-of-care G6PD testing before primaquine radical cure of vivax malaria and before rasburicase [6,15]; neonatal jaundice protocols in high-prevalence regions; and integration into pharmacovigilance. With 3.85 million affected children in high-income North America and an 89.3% rise in Australasia, this is no longer a tropical concern alone.
4.5. The Pandemic Window: A Negative Result That Redirects the Narrative
COVID-19-era disruption—interrupted blood supplies, suspended clinics, deferred transfusions—could plausibly have reversed hemoglobinopathy mortality trends; globally it did not: thalassaemia deaths fell faster after 2021 (−5.0% in 2021–2023) than during 2019–2021 (−1.9%), sickle cell deaths moved +1.1% then −2.7%, and G6PD deaths were flat. Pediatric sickle cell stagnation is therefore structural, predating 2020 by decades, and cannot be excused by the pandemic; the result also tempers claims of global transfusion-system collapse [30], at least at regional GBD resolution. Two qualifications apply: pandemic-era estimates are partly modelled and 2020 and 2022 were not extracted, so a transient shock could be smoothed away; and mortality is a lagging endpoint—disrupted transfusion may register first as morbidity. The result constrains, but does not refute, sub-regional disruption.
4.6. The Migration Legacy and the Case for Universal Screening
The 204-country ranking makes the migration point concretely: seven non-endemic high-income countries (led by Italy, 31st, and the United States, 51st) hold pediatric thalassaemia caseloads within the global top half, and high-income North America hosts 23,553 children with sickle cell disease and 3.85 million with G6PD deficiency. Universal—not ancestry-targeted—newborn screening, already standard in the United States and much of Western Europe [12,31], is the logical response, and the destination-country test sharpens it: transplanted caseloads scale with destination population size, with no urbanization or inequality gradient. Within the belt, the climate signature survives for sickle cell mortality and G6PD prevalence but not thalassaemia prevalence—three decades of screening may have partly decoupled thalassaemia burden from its climatic origin.
4.7. Comparison with Previous Studies
Our sickle cell estimates are directionally consistent with the GBD 2021 analysis [16], which reported rising all-age cause-specific deaths (34,400 in 2021) and a much larger total-mortality construct; differences in round, age caliber, and years preclude numeric comparison. The G6PD prevalence scale aligns with the GBD 2021 analysis of Yu et al. [17] (443 million all ages in 2021) and geostatistical birth-prevalence maps [5], and the pediatric sickle cell caseload sits within Piel and colleagues’ demographic-model uncertainty ranges [18,32]. The thalassaemia mortality decline we quantify mirrors the control experience consolidated in current clinical reviews of the β-thalassaemias [33], and the stakes of the sickle cell delivery gap have only risen with the advent of CRISPR-Cas9 gene editing, now clinically proven in both sickle cell disease and β-thalassaemia [34]. To our knowledge this is the first joint three-disease pediatric analysis on GBD 2023, the first pandemic-window test for these causes, and the first same-round positioning of their combined mortality against tuberculosis, cancer, and LRI.
4.8. Limitations
Nine limitations qualify these results. First, the main extraction is regional; country-level evidence exists only for thalassaemia 2023 prevalence, so no national sickle cell or G6PD statements are made. Second, EAPCs rest on seven key-year points and are not comparable with full-year EAPCs from prior rounds. Third, G6PD estimates carry three caveats: the cause attributes few deaths (neonatal jaundice and kernicterus are assigned elsewhere), all incidence falls in the under-5 birth cohort, and the Both-sex-only extraction prevented re-computing the X-linked pattern [17]. Fourth, sickle cell mortality UIs are very wide (upper bound 1.5 times the point estimate) because African cause-of-death data are sparse; we report intervals throughout. Fifth, the three causes are modelled independently in GBD despite clinical co-occurrence, so the combined 39,391-death figure is an approximation. Sixth, the pandemic window comprises only 2019, 2021, and 2023; regional small-count changes must not be over-interpreted. Seventh, sex ratios were computable only for thalassaemias, and the sex-stratified extraction differed from the main file by ~11% in 1990 deaths. Eighth, 20–24-year denominators were interpolated and unavailable by SDI, confining SDI analysis to ages 0–19 years. Ninth, the ecological tests are region-level correlations (n = 21) on population-weighted country aggregates, subject to ecological fallacy and multiplicity, and the destination-country analysis used a total-population denominator proxy.
4.9. Policy Implications
The three-fates framing yields three distinct agendas. For thalassaemias, diffusion: extend the proven screening–prevention–transfusion architecture to South Asia and African settings where unexplained thalassaemia-attributed mortality hints at missed diagnosis. For sickle cell disease, construction: universal newborn screening with penicillin prophylaxis, hydroxyurea scale-up on the REACH evidence base [14], and inclusion in child-survival monitoring commensurate with a burden equal to one-third of pediatric tuberculosis, as set out in the recent Lancet Haematology Commission on sickle cell disease [35]; with 18.9% of 0–24-year sickle cell deaths at ages 15–19 years, transition-of-care services deserve explicit design. For G6PD deficiency, recognition: routine testing before hemolysis-triggering drugs, neonatal jaundice protocols, and pharmacovigilance for a carrier population of 168.7 million children. Common to all three is measurement: these disorders are monitored less precisely than far smaller pediatric causes; better cause-of-death surveillance and sex-stratified reporting are prerequisites for holding any control program to account.
5. Conclusion
This author-aggregated Global Burden of Disease Study 2023 analysis provides the first joint pediatric assessment of the three malaria-belt hemoglobinopathies at ages 0–19 years, 1990–2023. In 2023 they together caused 39,391 deaths (95% UI 24,456–54,325)—45% of pediatric tuberculosis and 27% of childhood cancer mortality—while 176 million children lived with one of the three conditions. Their trajectories diverged decisively: thalassaemia deaths fell 41.7% under a functioning control architecture; sickle cell deaths rose 30.9%, 91.8% of them in sub-Saharan Africa at a 66-fold low-versus-high-SDI gradient; and G6PD deficiency expanded to one child in 15 with almost no attributed mortality. Closing the newborn-screening and hydroxyurea gap for sickle cell disease in sub-Saharan Africa is the outstanding pediatric equity task; the thalassaemia record proves it can be done.
Supplementary Materials
The following supporting information can be downloaded at the website of this paper posted on Preprints.org, Supplementary Data S1 (zip archive). Unmodified raw CSV extractions from the GBD 2023 Results Tool underpinning every estimate in this study: (i) the main three-disease regional file (thalassaemias, sickle cell disorders, G6PD deficiency; 27 locations × five age bands × both sexes × seven key years × deaths/prevalence/incidence); (ii) the sex-stratified thalassaemia extraction; (iii) the 204-country thalassaemia 0–19-year prevalence cross-section for 2023; and (iv) comparator-cause extractions (tuberculosis, childhood malignant neoplasms, lower respiratory infections) at the 0–19-year caliber. Author-derived analysis tables (Supplementary Table S1–S9, back-calculated population denominators) are in the derived/ folder of the archive (see its README for the S-number↔CSV mapping); typeset versions are provided separately as Supplementary_Tables_S1-S13.docx. Supplementary Table S1. Global key-year series, 1990–2023: deaths, prevalence, and incidence (numbers and crude rates per 100,000 with 95% uncertainty intervals) for the three diseases at ages 0–19 years at all seven key years, with back-calculated population denominators. Supplementary Table S2. Complete key-year EAPC table (1990–2023) for all measures, diseases, and locations (global, five SDI quintiles, 21 GBD regions), with p values and the note that EAPCs rest on seven key-year points and are not comparable with full-annual-series EAPCs from prior GBD rounds. Supplementary Table S3. Full 21-region 2023 cross-section at ages 0–19 years (numbers, rates, 95% UIs) for deaths, prevalence, and incidence for each disease, including regional shares of the global totals and malaria-belt aggregates. Supplementary Table S4. Pandemic-window tables: global and regional deaths in 2019, 2021, and 2023 with two-segment net changes (2019→2021, 2021→2023, 2019→2023) for each disease, including all small-count regional point estimates discussed in Section 3.6. Supplementary Table S5. Sex-stratified thalassaemia table (global, 1990/2019/2021/2023): deaths, prevalence, and incidence by sex with male-to-female ratios, and the note on the ~11% batch difference between the sex-stratified and main extractions. Supplementary Table S6. Country-level thalassaemia 0–19-year prevalence ranking for 204 countries, 2023 (numbers with 95% UIs), with non-endemic high-income receiving countries (the 27 destination countries of Supplementary Table S9) flagged. Supplementary Table S7. Comparator-cause aggregation table (Section 3.7): 0–19-year deaths with 95% UIs for the three hemoglobinopathies (individual and combined), tuberculosis, childhood malignant neoplasms, and lower respiratory infections, GBD 2023, with share-of-LRI calculations. Supplementary Table S8. Ecological covariate tables (Section 3.9): 2023 regional 0–19-year prevalence and death rates for the three diseases joined with population-weighted climate and development covariates (mean temperature, relative humidity, absolute latitude, precipitation, urbanization, Gini index) aggregated from 215 countries to the 21 GBD regions, and the full Spearman correlation matrix with Benjamini–Hochberg-adjusted q values. Supplementary Table S9. Distribution-breadth metrics (top-1/top-4 regional shares, rate coefficient of variation, case-versus-population Gini across the 21 regions) and the destination-country thalassaemia analysis: 27 non-endemic high-income receiving countries with 0–19-year prevalent cases, prevalence proxy per 100,000 total population, urbanization, and Gini index, with Spearman results (Section 3.9). Supplementary Table S10. Joinpoint regression of global 0–19-year rates, 1990–2023: segment-specific annual percent change (APC) and average APC (AAPC) with 95% confidence intervals (Section 3.10). Supplementary Table S11. Slope index of inequality (SII) and concentration index (CII) of 0–19-year death and prevalence rates per 100,000 across the five SDI quintiles, 1990 and 2023, with 1,000-replicate bootstrap 95% confidence intervals (Section 3.10). Supplementary Table S12. Das Gupta three-factor decomposition of the change in 0–19-year DALYs between 1990 and 2023 into population growth, population ageing, and epidemiological change (Section 3.11). Supplementary Table S13. Migration-cohort importation of thalassaemias, 2024: destination countries ranked by estimated imported prevalent-case stock (UN DESA International Migrant Stock 2024 × GBD 2023 origin prevalence), with the high-income-destination ecological correlation (Section 3.12).
Funding
This work was supported by the Beijing Science and Technology Nova Program Interdisciplinary Project (20230484439) and the Beijing High-Level Public Health Technical Talents Project (2023-02-33).
Ethics approval and consent to participate
This study is a secondary analysis of de-identified, aggregate, publicly available estimates from the Global Burden of Disease (GBD) Study 2023, coordinated by the Institute for Health Metrics and Evaluation (IHME). No individual-level or identifiable data were accessed. In accordance with institutional policy for research on publicly available aggregate data, this study was exempt from institutional review board approval. No participant consent was required.
Consent for publication
Not applicable.
Availability of data and materials
All estimates analyzed in this study were downloaded by the authors from the GBD Results Tool (https://vizhub.healthdata.org/gbd-results/), GBD 2023 round, using fully specified, reproducible queries (causes: thalassaemias, sickle cell disorders, G6PD deficiency; measures: deaths, prevalence, incidence; number and rate with 95% uncertainty intervals). The unmodified raw CSV extractions, together with the author-aggregated derived datasets (0–19-year totals, key-year EAPC tables, regional and SDI stratifications, pandemic-window changes, back-calculated population denominators, and comparator-cause aggregations), are provided as Supplementary Data S1. Python analysis code is included in the supplementary materials (Supplementary Data S1 archive, code/; 04_Supplementary/code/).
Competing interests
The authors declare no competing interests.
Authors’ contributions
Conceptualization: SC; Data curation: DL; Formal analysis: DL; Funding acquisition: SC; Investigation: DL, SC; Methodology: DL, SC; Software: DL; Supervision: SC; Validation: DL, SC; Visualization: DL; Writing—original draft: DL; Writing—review and editing: DL, SC. All authors read and approved the final manuscript. SC is the principal investigator who conceived the study and leads its overall conduct.
Use of artificial intelligence
AI tools were used for language polishing and code drafting.
Acknowledgments
We thank the Institute for Health Metrics and Evaluation (IHME), University of Washington, for making the GBD 2023 estimates publicly available through the GBD Results Tool, and the Global Burden of Disease Collaborator Network, whose primary data collection and modeling underpin all estimates analyzed here.
GATHER statement
This study adheres to the Guidelines for Accurate and Transparent Health Estimates Reporting (GATHER); the completed checklist is provided as Supplementary Material.
GATHER checklist
Provided as Supplementary Material.
Data availability
All estimates are publicly accessible through the GBD Results Tool (https://vizhub.healthdata.org/gbd-results); author-aggregated datasets and analysis code are included in the Supplementary Materials (Supplementary Data S1 archive, including code/; 04_Supplementary/code/).
Conflicts of interest
The authors declare no conflicts of interest.
Ethics statement
This study is a secondary analysis of de-identified, aggregate, publicly available estimates from the Global Burden of Disease Study 2023; institutional review board approval and participant consent were not required (see Ethics approval and consent to participate).
Abbreviations
| Abbreviation | Definition |
| CI | confidence interval |
| CODEm | Cause of Death Ensemble model |
| DALY | disability-adjusted life-year |
| EAPC | estimated annual percentage change |
| G6PD | glucose-6-phosphate dehydrogenase |
| GATHER | Guidelines for Accurate and Transparent Health Estimates Reporting |
| GBD | Global Burden of Disease (Study) |
| HNA | high-income North America |
| IHME | Institute for Health Metrics and Evaluation |
| LRI | lower respiratory infection |
| M | million |
| RSS | root-sum-of-squares |
| RSS-UI | uncertainty interval pooled by root-sum-of-squares |
| SCD | sickle cell disease |
| SDI | Socio-demographic Index |
| SSA | sub-Saharan Africa |
| TB | tuberculosis |
| UI | uncertainty interval |
| UN | United Nations |
| WHO | World Health Organization |
| YLD | years lived with disability |
| YLL | years of life lost |
References
- Williams, T.N.; Obaro, S.K. Sickle cell disease and malaria morbidity: a tale with two tails. Trends Parasitol. 2011, 27(7), 315–320. [Google Scholar] [CrossRef]
- Hedrick, P.W. Population genetics of malaria resistance in humans. Heredity (Edinb) 2011, 107(4), 283–304. [Google Scholar] [CrossRef]
- Haldane, J.B.S. The rate of mutation of human genes. Hereditas 1949, 35 (Suppl 1), 267–273. [Google Scholar] [CrossRef]
- Allison, A.C. Protection afforded by sickle-cell trait against subtertian malarial infection. Br. Med. J. 1954, 1(4857), 290–294. [Google Scholar] [CrossRef]
- Howes, R.E.; Piel, F.B.; Patil, A.P.; Nyangiri, O.A.; Gething, P.W.; Dewi, M.; et al. G6PD deficiency prevalence and estimates of affected populations in malaria endemic countries: a geostatistical model-based map. PLoS Med. 2012, 9(11), e1001339. [Google Scholar] [CrossRef]
- Luzzatto, L.; Ally, M.; Notaro, R. Glucose-6-phosphate dehydrogenase deficiency. Blood 2020, 136(11), 1225–1240. [Google Scholar] [CrossRef]
- Cappellini, M.D.; Fiorelli, G. Glucose-6-phosphate dehydrogenase deficiency. Lancet 2008, 371(9606), 64–74. [Google Scholar] [CrossRef]
- Modell, B.; Darlison, M. Global epidemiology of haemoglobin disorders and derived service indicators. Bull. World Health Organ. 2008, 86(6), 480–487. [Google Scholar] [CrossRef]
- Weatherall, D.J.; Clegg, J.B. Inherited haemoglobin disorders: an increasing global health problem. Bull. World Health Organ. 2001, 79(8), 704–712. [Google Scholar]
- Taher, A.T.; Weatherall, D.J.; Cappellini, M.D. Thalassaemia. Lancet 2018, 391(10116), 155–167. [Google Scholar] [CrossRef]
- Cao, A.; Galanello, R. Effect of consanguinity on screening for thalassemia. N Engl. J. Med. 2002, 347(15), 1200–1202. [Google Scholar] [CrossRef]
- Kato, G.J.; Piel, F.B.; Reid, C.D.; Gaston, M.H.; Ohene-Frempong, K.; Krishnamurti, L.; et al. Sickle cell disease. Nat. Rev. Dis. Primers 2018, 4, 18010. [Google Scholar] [CrossRef]
- Grosse, S.D.; Odame, I.; Atrash, H.K.; Amendah, D.D.; Piel, F.B.; Williams, T.N. Sickle cell disease in Africa: a neglected cause of early childhood mortality. Am. J. Prev. Med. 2011, 41((6) Suppl 4, S398–S405. [Google Scholar] [CrossRef]
- Tshilolo, L.; Tomlinson, G.; Williams, T.N.; Santos, B.; Olupot-Olupot, P.; Lane, A.; et al. Hydroxyurea for children with sickle cell anemia in sub-Saharan Africa. N Engl. J. Med. 2019, 380(2), 121–131. [Google Scholar] [CrossRef]
- Domingo, G.J.; Satyagraha, A.W.; Anvikar, A.; Baird, K.; Bancone, G.; Bansil, P.; et al. G6PD testing in support of treatment and elimination of malaria: recommendations for evaluation of G6PD tests. Malar. J. 2013, 12, 391. [Google Scholar] [CrossRef]
- GBD 2021 Sickle Cell Disease Collaborators. Global, regional, and national prevalence and mortality burden of sickle cell disease, 2000–2021: a systematic analysis from the Global Burden of Disease Study 2021. Lancet Haematol. 2023, 10(8), e585–e599. [Google Scholar] [CrossRef]
- Yu, Z.; Xiong, Q.; Wang, Z.; Li, L.; Niu, T. Global, regional, and national burden of glucose-6-phosphate dehydrogenase (G6PD) deficiency from 1990 to 2021: a systematic analysis of the global burden of disease study 2021. Front Genet. 2025, 16, 1593728. [Google Scholar] [CrossRef]
- Piel, F.B.; Patil, A.P.; Howes, R.E.; Nyangiri, O.A.; Gething, P.W.; Dewi, M.; et al. Global epidemiology of sickle haemoglobin in neonates: a contemporary geostatistical model-based map and population estimates. Lancet 2013, 381(9861), 142–151. [Google Scholar] [CrossRef]
- Wang, R.; Ma, X.H.; Qin, Z.Z.; Hu, X.X.; Mo, Z.Y.; Zhao, Y.Y.; et al. Global, regional, and national burden of thalassemia during 1990–2019: a systematic analysis of the Global Burden of Disease Study 2019. Pediatr. Blood Cancer 2024, 71(9), e31177. [Google Scholar] [CrossRef]
- Tuo, Y.; Li, Y.; Li, Y.; Ma, J.; Yang, X.; Wu, S.; et al. Global, regional, and national burden of thalassemia, 1990–2021: a systematic analysis for the Global Burden of Disease Study 2021. EClinicalMedicine 2024, 72, 102619. [Google Scholar] [CrossRef]
- Institute for Health Metrics and Evaluation (IHME). GBD Results Tool. Seattle, WA: IHME, University of Washington. Available online: https://vizhub.healthdata.org/gbd-results (accessed on 16–18 August 2026).
- GBD 2023 Disease and Injury and Risk Factor Collaborators. Burden of 375 diseases and injuries, risk-attributable burden of 88 risk factors, and healthy life expectancy in 204 countries and territories, including 660 subnational locations, 1990–2023: a systematic analysis for the Global Burden of Disease Study 2023. Lancet 2025, 406(10513), 1873–1922. [Google Scholar] [CrossRef]
- GBD 2023 Causes of Death Collaborators. Global burden of 292 causes of death in 204 countries and territories and 660 subnational locations, 1990–2023: a systematic analysis for the Global Burden of Disease Study 2023. Lancet 2025, 406(10513), 1811–1872. [CrossRef]
- Kim, H.J.; Fay, M.P.; Feuer, E.J.; Midthune, D.N. Permutation tests for joinpoint regression with applications to cancer rates. Stat. Med. 2000, 19(3), 335–351. [Google Scholar] [CrossRef]
- Stevens, G.A.; Alkema, L.; Black, R.E.; Boerma, J.T.; Collins, G.S.; Ezzati, M.; et al. Guidelines for Accurate and Transparent Health Estimates Reporting: the GATHER statement. Lancet 2016, 388(10062), e19–e23. [Google Scholar] [CrossRef]
- Origa, R. β-Thalassemia. Genet Med. 2017, 19(6), 609–619. [Google Scholar] [CrossRef]
- United Nations General Assembly. Recognition of sickle-cell anaemia as a public health problem: resolution A/RES/63/237 (adopted 22 December 2008); United Nations: New York, 2009; Available online: https://digitallibrary.un.org/record/642028.
- World Health Organization. 2006. Sickle-cell anaemia: report by the Secretariat (document A59/9). World Health Organization: Geneva. Available online: https://apps.who.int/gb/ebwha/pdf_files/WHA59/A59_9-en.pdf.
- United Nations. Transforming our world: the 2030 Agenda for Sustainable Development (A/RES/70/1); United Nations: New York, 2015; Available online: https://sdgs.un.org/2030agenda.
- Stanworth, S.J.; New, H.V.; Apelseth, T.O.; Brunskill, S.; Cardigan, R.; Doree, C.; et al. Effects of the COVID-19 pandemic on supply and use of blood for transfusion. Lancet Haematol. 2020, 7(10), e756–e764. [Google Scholar] [CrossRef]
- Therrell, B.L.; Padilla, C.D.; Loeber, J.G.; Kneisser, I.; Saadallah, A.; Borrajo, G.J.C.; et al. Current status of newborn screening worldwide: 2015. Semin Perinatol. 2015, 39(3), 171–187. [Google Scholar] [CrossRef]
- Piel, F.B.; Tatem, A.J.; Huang, Z.; Gupta, S.; Williams, T.N.; Weatherall, D.J. Global migration and the changing distribution of sickle haemoglobin: a quantitative study of temporal trends between 1960 and 2000. Lancet Glob. Health 2014, 2(2), e80–e89. [Google Scholar] [CrossRef]
- Taher, A.T.; Musallam, K.M.; Cappellini, M.D. β-Thalassemias. N Engl. J. Med. 2021, 384(8), 727–743. [Google Scholar] [CrossRef]
- Frangoul, H.; Altshuler, D.; Cappellini, M.D.; Chen, Y.S.; Domm, J.; Eustace, B.K.; et al. CRISPR-Cas9 gene editing for sickle cell disease and β-thalassemia. N Engl. J. Med. 2021, 384(3), 252–260. [Google Scholar] [CrossRef]
- Piel, F.B.; Rees, D.C.; DeBaun, M.R.; Nnodu, O.; Ranque, B.; Thompson, A.A.; et al. Defining global strategies to improve outcomes in sickle cell disease: a Lancet Haematology Commission. Lancet Haematol. 2023, 10(8), e633–e686. [Google Scholar] [CrossRef]
Figure 1.
Three divergent fates of the malaria-belt hemoglobinopathies at ages 0–19 years, 1990–2023. (a) Crude death rate per 100,000 (log scale) at seven key years for the three diseases, globally; key-year estimated annual percentage change (EAPC) with 95% confidence interval annotated. (b) Crude prevalence rate per 100,000 (log scale) at seven key years; EAPC annotated. (c) Deaths (number) in 1990 and 2023 with 95% uncertainty-interval (UI) whiskers; endpoint percentage change annotated. (d) Prevalent cases (number) in 1990 and 2023 with 95% UIs. Data: GBD 2023 Results (IHME); authors’ aggregation. Notes. EAPCs rest on the seven key-year points only. Aggregate 95% UIs pool band half-widths by root-sum-of-squares. Sickle cell mortality UIs are wide (2023: 14,753–44,030); all statements about sickle cell deaths should be read with these intervals.
Figure 1.
Three divergent fates of the malaria-belt hemoglobinopathies at ages 0–19 years, 1990–2023. (a) Crude death rate per 100,000 (log scale) at seven key years for the three diseases, globally; key-year estimated annual percentage change (EAPC) with 95% confidence interval annotated. (b) Crude prevalence rate per 100,000 (log scale) at seven key years; EAPC annotated. (c) Deaths (number) in 1990 and 2023 with 95% uncertainty-interval (UI) whiskers; endpoint percentage change annotated. (d) Prevalent cases (number) in 1990 and 2023 with 95% UIs. Data: GBD 2023 Results (IHME); authors’ aggregation. Notes. EAPCs rest on the seven key-year points only. Aggregate 95% UIs pool band half-widths by root-sum-of-squares. Sickle cell mortality UIs are wide (2023: 14,753–44,030); all statements about sickle cell deaths should be read with these intervals.
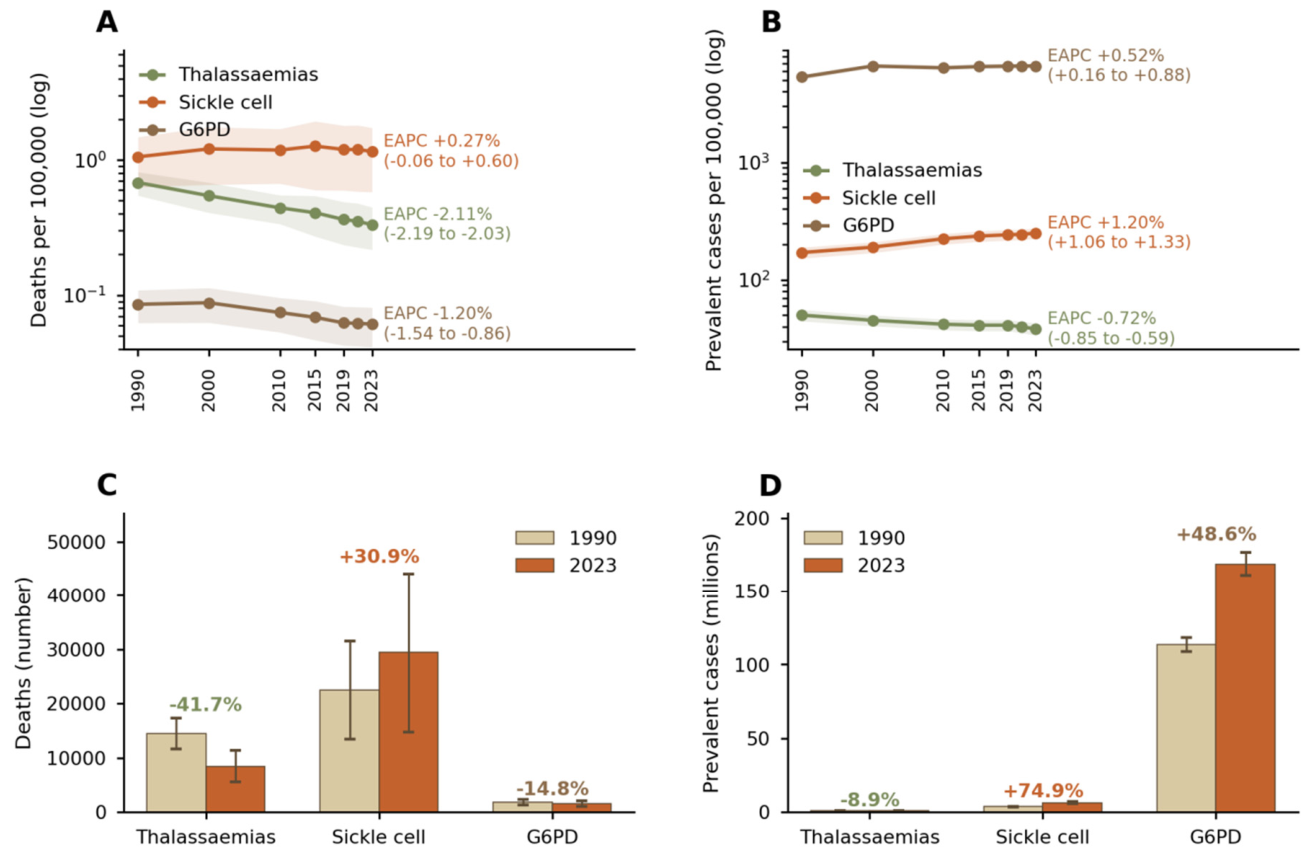
Figure 2.
Age morphology of the three hemoglobinopathies, ages 0–24 years, 1990 versus 2023. (a) 100% stacked composition of deaths by age band (<5, 5–9, 10–14, 15–19, 20–24 years) for each disease, 2023; under-5 shares of 0–19-year deaths annotated. (b) Corresponding composition for 1990. (c) 100% stacked composition of prevalent cases by age band, 2023. (d) Deaths by age band (number, log scale), 2023, with 95% UI whiskers. Data: GBD 2023 Results (IHME); authors’ aggregation. Notes. The 20–24-year band is morphological context; its denominators were interpolated across key years. G6PD deficiency shows the high-prevalence/low-mortality profile (prevalence-to-death ratio ≈108,600:1, 2023).
Figure 2.
Age morphology of the three hemoglobinopathies, ages 0–24 years, 1990 versus 2023. (a) 100% stacked composition of deaths by age band (<5, 5–9, 10–14, 15–19, 20–24 years) for each disease, 2023; under-5 shares of 0–19-year deaths annotated. (b) Corresponding composition for 1990. (c) 100% stacked composition of prevalent cases by age band, 2023. (d) Deaths by age band (number, log scale), 2023, with 95% UI whiskers. Data: GBD 2023 Results (IHME); authors’ aggregation. Notes. The 20–24-year band is morphological context; its denominators were interpolated across key years. G6PD deficiency shows the high-prevalence/low-mortality profile (prevalence-to-death ratio ≈108,600:1, 2023).
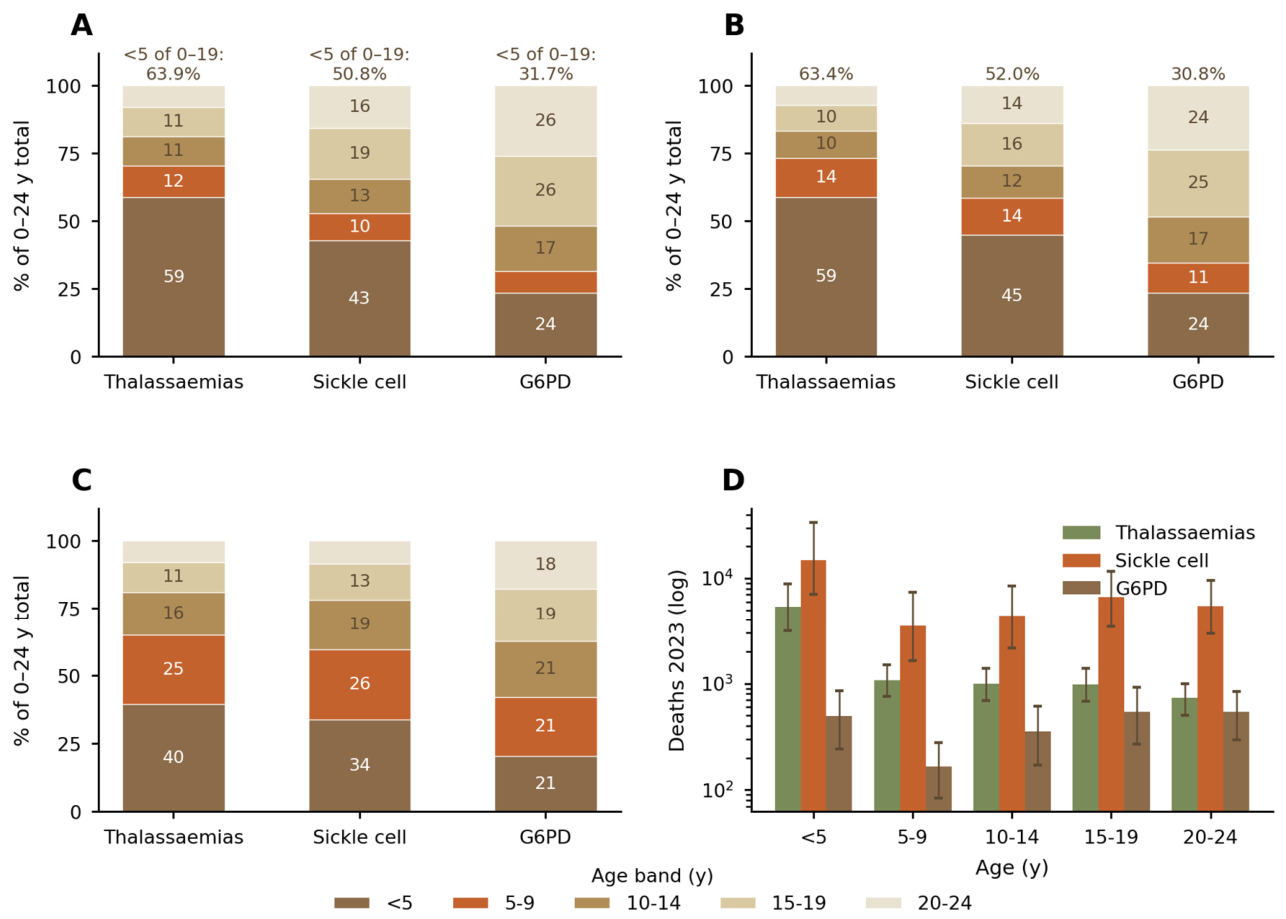
Figure 3.
Regional fingerprints of the three hemoglobinopathies at ages 0–19 years, 2023. (a) Heatmap of crude prevalence rates per 100,000 (log colour scale) across the 21 GBD regions (rows, ordered by malaria-belt membership) × three diseases (columns). (b) Crude death rates per 100,000 (log scale) by region; error bars are 95% UIs; zero lower bounds mark model instability. (c) Share of the global 0–19-year totals carried by the four sub-Saharan African regions. Data: GBD 2023 Results (IHME); authors’ aggregation. Notes. Extraction is regional; no country-level estimates are shown for sickle cell disorders or G6PD deficiency. The Western sub-Saharan African thalassaemia mortality rate (0.83 per 100,000, highest globally) is interpreted as probable under-diagnosis/attribution mixing, not a true severity gradient.
Figure 3.
Regional fingerprints of the three hemoglobinopathies at ages 0–19 years, 2023. (a) Heatmap of crude prevalence rates per 100,000 (log colour scale) across the 21 GBD regions (rows, ordered by malaria-belt membership) × three diseases (columns). (b) Crude death rates per 100,000 (log scale) by region; error bars are 95% UIs; zero lower bounds mark model instability. (c) Share of the global 0–19-year totals carried by the four sub-Saharan African regions. Data: GBD 2023 Results (IHME); authors’ aggregation. Notes. Extraction is regional; no country-level estimates are shown for sickle cell disorders or G6PD deficiency. The Western sub-Saharan African thalassaemia mortality rate (0.83 per 100,000, highest globally) is interpreted as probable under-diagnosis/attribution mixing, not a true severity gradient.
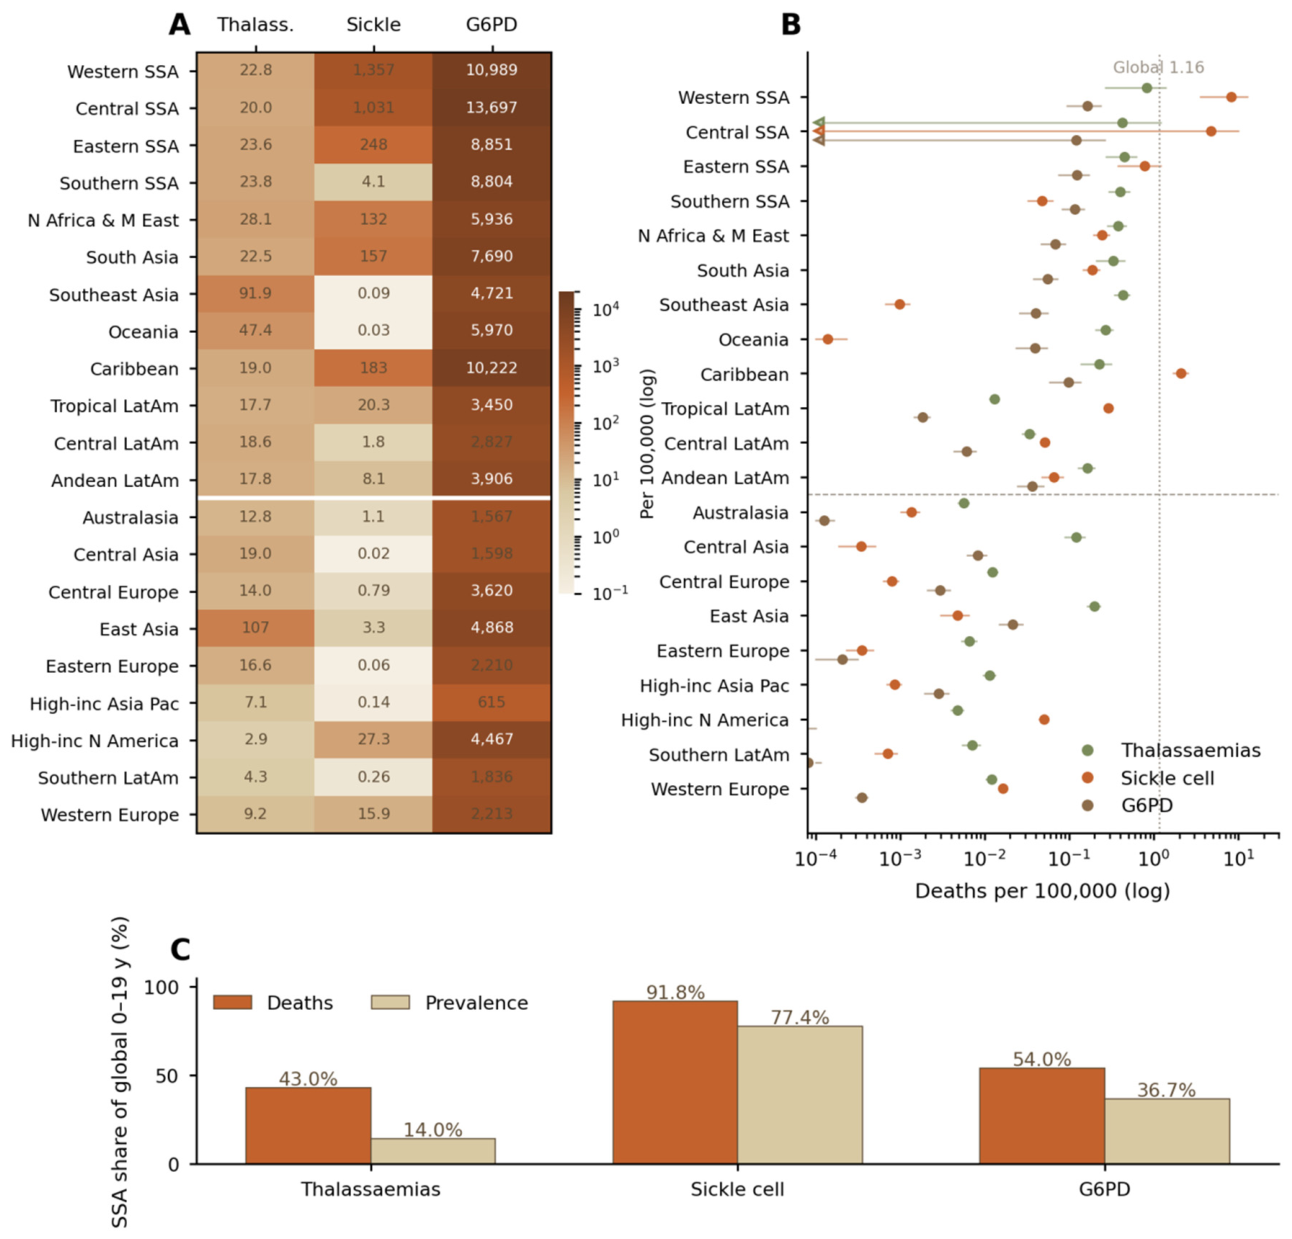
Figure 4.
Socio-demographic Index (SDI) gradients of the three hemoglobinopathies at ages 0–19 years, 2023. (a) Crude death rate per 100,000 (log scale) across the five SDI quintiles; low-versus-high-SDI ratios annotated (sickle cell 66-fold; thalassaemias 8-fold; G6PD 8-fold); ribbons are 95% UIs. (b) Deaths (number) by SDI quintile for each disease, 2023, with 95% UI whiskers. Data: GBD 2023 Results (IHME); authors’ aggregation. Notes. Rates are crude 0–19-year rates; SDI-level 20–24-year denominators were unavailable, so no 0–24-year SDI analysis is presented. (c–d) The migration legacy: prevalent pediatric hemoglobinopathy stocks in high-income settings, 2023. (c) Prevalent 0–19-year cases of each disease in high-income North America, Western Europe, and Australasia, 1990 versus 2023 (log scale); percentage change annotated (Australasia G6PD +89.3% highlighted). (d) Lollipop ranking of 0–19-year thalassaemia prevalent cases across 204 countries, top 30 shown, non-endemic high-income countries highlighted. Data: GBD 2023 Results (IHME); authors’ aggregation; country-level data available for thalassaemias only (2023). Notes. High-income prevalence is modelled as flat or declining; panel A conveys stock size, not growth claims (except Australasia G6PD, +89.3%).
Figure 4.
Socio-demographic Index (SDI) gradients of the three hemoglobinopathies at ages 0–19 years, 2023. (a) Crude death rate per 100,000 (log scale) across the five SDI quintiles; low-versus-high-SDI ratios annotated (sickle cell 66-fold; thalassaemias 8-fold; G6PD 8-fold); ribbons are 95% UIs. (b) Deaths (number) by SDI quintile for each disease, 2023, with 95% UI whiskers. Data: GBD 2023 Results (IHME); authors’ aggregation. Notes. Rates are crude 0–19-year rates; SDI-level 20–24-year denominators were unavailable, so no 0–24-year SDI analysis is presented. (c–d) The migration legacy: prevalent pediatric hemoglobinopathy stocks in high-income settings, 2023. (c) Prevalent 0–19-year cases of each disease in high-income North America, Western Europe, and Australasia, 1990 versus 2023 (log scale); percentage change annotated (Australasia G6PD +89.3% highlighted). (d) Lollipop ranking of 0–19-year thalassaemia prevalent cases across 204 countries, top 30 shown, non-endemic high-income countries highlighted. Data: GBD 2023 Results (IHME); authors’ aggregation; country-level data available for thalassaemias only (2023). Notes. High-income prevalence is modelled as flat or declining; panel A conveys stock size, not growth claims (except Australasia G6PD, +89.3%).
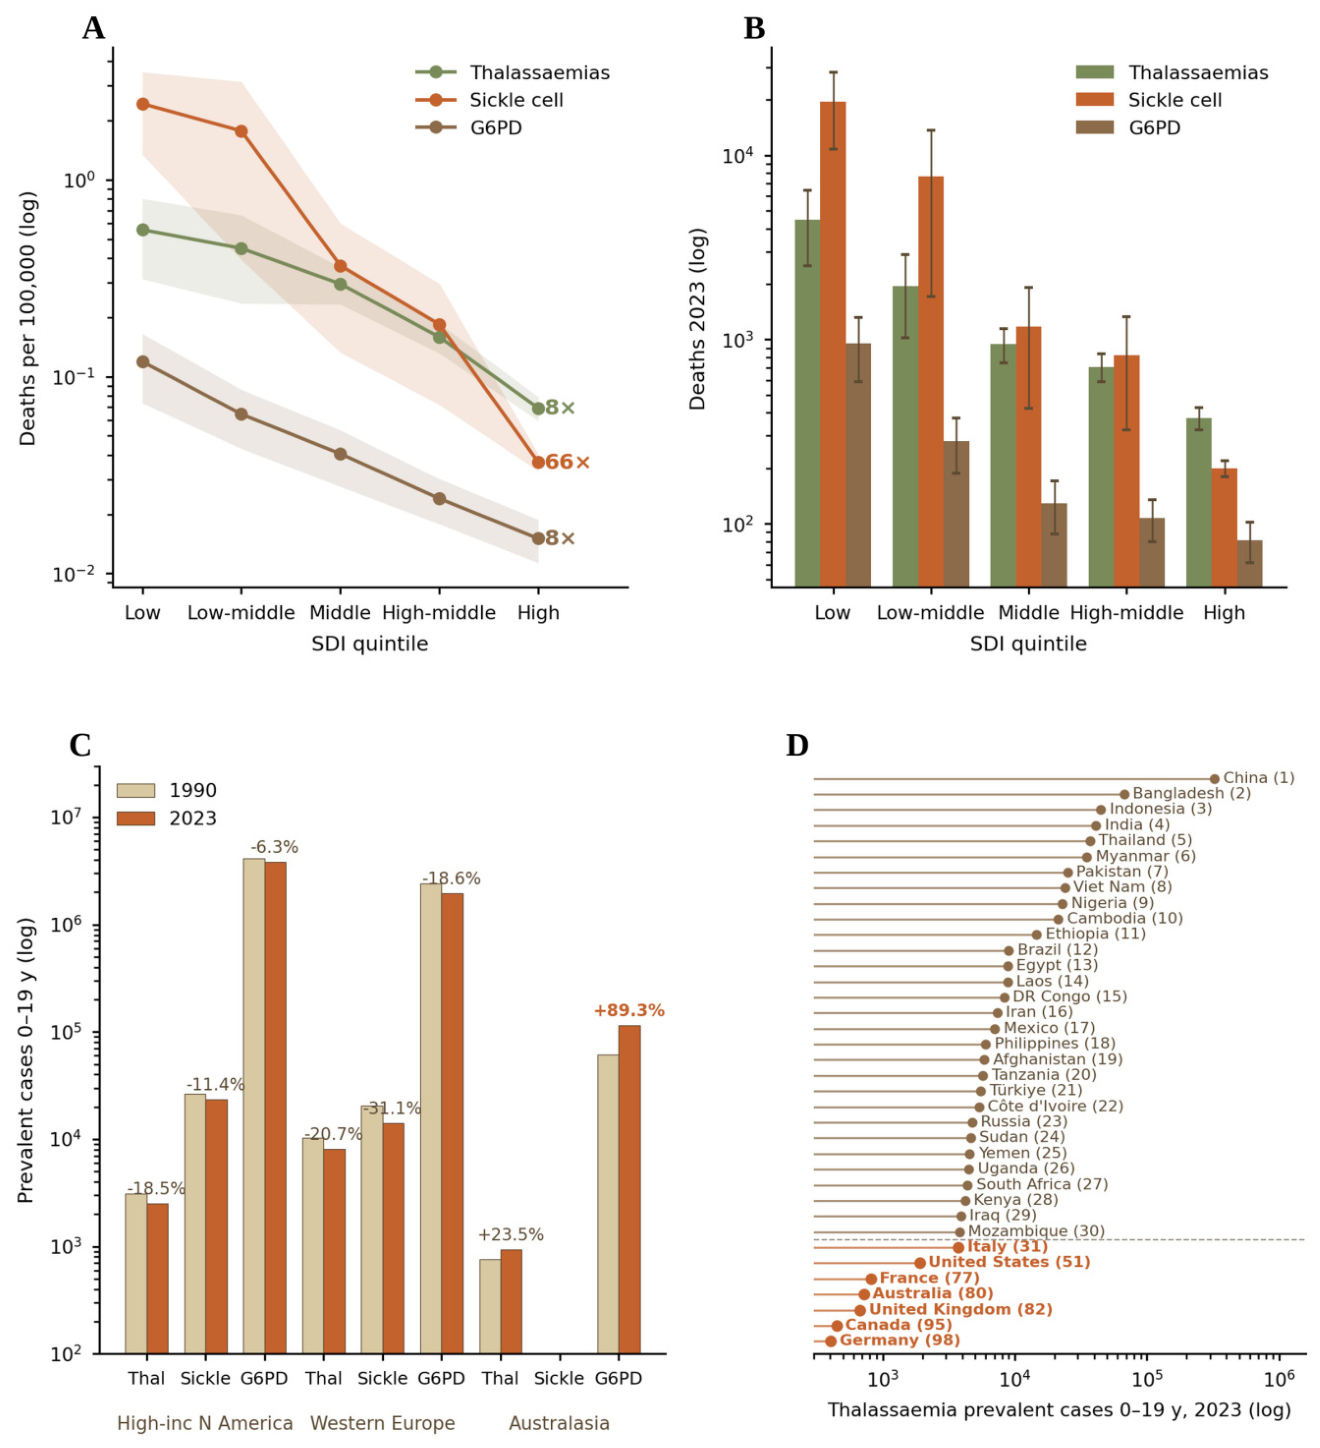

Table 1.
Global burden of the three hemoglobinopathies at ages 0–19 years in 2023, with change since 1990 and key-year estimated annual percentage change (EAPC) of crude rates, 1990–2023.
Table 1.
Global burden of the three hemoglobinopathies at ages 0–19 years in 2023, with change since 1990 and key-year estimated annual percentage change (EAPC) of crude rates, 1990–2023.
| Disease | Measure | 2023 number (95% UI) | 2023 crude rate per 100,000 (95% UI) | 1990 number | Number %Δ 1990→2023 | Rate %Δ 1990→2023 | EAPC of rate, %/yr (95% CI) |
| G6PD deficiency | Prevalence | 168,697,800 (160.8M–176.6M) | 6,628.5 (6,318.8–6,938.3) | 113,540,857 | +48.6 | +24.4 | +0.52 (+0.16 to +0.88) |
| Incidence (births, <5 y) | 8,468,670 (7.60M–9.34M) | 1,636.7 (1,468.8–1,804.6) | 7,238,594 | +17.0 | +11.0 | +0.10 (−0.35 to +0.54) | |
| Deaths | 1,554 (1,045–2,063) | 0.061 (0.041–0.081) | 1,824 | −14.8 | −28.7 | −1.20 (−1.54 to −0.86) | |
| Sickle cell disorders | Prevalence | 6,354,114 (5.69M–7.02M) | 249.7 (223.6–275.8) | 3,633,029 | +74.9 | +46.5 | +1.20 (+1.06 to +1.33) |
| Incidence (births, <5 y) | 538,125 (436,391–639,860) | 104.0 (<5 y) | 377,389 | +42.6 | +19.4 | +0.54 (+0.26 to +0.82) | |
| Deaths | 29,392 (14,753–44,030) | 1.155 (0.580–1.730) | 22,462 | +30.9 | +9.6 | +0.27 (−0.06 to +0.60; p = 0.17) | |
| Thalassaemias | Prevalence | 970,158 (854,924–1,085,392) | 38.1 (33.6–42.6) | 1,064,630 | −8.9 | −23.7 | −0.72 (−0.85 to −0.59) |
| Incidence (births, <5 y) | 113,519 (83,817–143,221) | 21.9 (<5 y) | 163,737 | −30.7 | −41.9 | −1.36 (−1.80 to −0.91) | |
| Deaths | 8,445 (5,532–11,358) | 0.332 (0.217–0.446) | 14,489 | −41.7 | −51.2 | −2.11 (−2.19 to −2.03) | |
| Three diseases combined | Deaths | 39,391 (24,456–54,325) | 1.55 | 38,775 | +1.6 | — | — |
Data source: authors’ aggregation of official CSVs from the GBD 2023 Results Tool; 0–19-year totals are sums of the official <5-year aggregate and the 5–9, 10–14 and 15–19-year groups (both sexes). Aggregate 95% uncertainty intervals (UIs) pool group half-widths by root-sum-of-squares (RSS) under an independence approximation and are slightly narrower than official joint-distribution intervals. Rates are crude (per 100,000 of the relevant age-band population); because all incidence is congenital, the printed 2023 incidence point rates use the under-5 population (517 million globally in 2023). The incidence Rate %Δ and EAPC columns follow Section 2.5: for G6PD deficiency they use the same under-5 denominator as the printed rate (1,474.7 per 100,000 in 1990 → 1,636.7 in 2023, i.e., +11.0%), whereas for sickle cell disorders and thalassaemias they use the 0–19-year denominator, under which the 1990 → 2023 incidence rates are 17.7 → 21.1 (95% UI 17.1–25.1) per 100,000 for sickle cell disorders (i.e., +19.4%) and 7.7 → 4.5 (3.3–5.6) per 100,000 for thalassaemias (i.e., −41.9%); the full key-year series and EAPC inputs are in Supplementary Data S1 (T1_global_0-19_keyyears.csv and T2_eapc_global_keyyears.csv). EAPCs are log-linear regressions on the seven key-year points (1990, 2000, 2010, 2015, 2019, 2021, 2023), not a continuous annual series; they are not directly comparable with full-year EAPCs from prior GBD rounds. M, million.
Table 2.
Position of the three hemoglobinopathies in the spectrum of major pediatric causes of death at ages 0–19 years, GBD 2023.
Table 2.
Position of the three hemoglobinopathies in the spectrum of major pediatric causes of death at ages 0–19 years, GBD 2023.
| Cause | Deaths 2023 (95% UI) | Share of LRI deaths | Relative positioning |
| Hemoglobinopathies, three diseases combined | 39,391 (24,456–54,325) | 5.5% | ≈45% of pediatric TB; ≈27% of childhood cancers |
| — Sickle cell disorders | 29,392 (14,753–44,030) | 4.1% | ≈one-third of pediatric TB |
| — Thalassaemias | 8,445 (5,532–11,358) | 1.2% | — |
| — G6PD deficiency | 1,554 (1,045–2,063) | 0.2% | — |
| Tuberculosis (0–19 y) | 87,764 (65,765–109,764) | 12.3% | — |
| Childhood cancers (malignant, 0–19 y) | 148,436 (139,201–157,671) | 20.9% | — |
| Lower respiratory infections (0–19 y) | 711,713 (579,607–843,819) | 100% | — |
Data source: GBD 2023 Results Tool; all values are authors’ aggregations at the 0–19-year caliber (official <5-year aggregate + 5–9/10–14/15–19-year bands, both sexes); combined hemoglobinopathy UIs pooled by root-sum-of-squares. Sickle cell mortality UIs are wide and cause-specific; GBD’s “total sickle cell disease mortality” construct (including excess deaths assigned to other causes) is substantially larger and is discussed in Section 4.7. LRI, lower respiratory infections; TB, tuberculosis; UI, uncertainty interval.
Disclaimer/Publisher’s Note: The statements, opinions and data contained in all publications are solely those of the individual author(s) and contributor(s) and not of MDPI and/or the editor(s). MDPI and/or the editor(s) disclaim responsibility for any injury to people or property resulting from any ideas, methods, instructions or products referred to in the content. |
© 2026 by the authors. Licensee MDPI, Basel, Switzerland. This article is an open access article distributed under the terms and conditions of the Creative Commons Attribution (CC BY) license.
Copyright: This open access article is published under a Creative Commons CC BY 4.0 license, which permit the free download, distribution, and reuse, provided that the author and preprint are cited in any reuse.