

Submitted:
27 October 2026
Posted:
28 October 2026
You are already at the latest version
Preprints on COVID-19 and SARS-CoV-2
Abstract
Background: Lower respiratory infections (LRIs) remain the leading infectious cause of child death, yet global frameworks focus on under-5s and the 5–19-year burden lacks systematic quantification. We analyzed the 0–19-year LRI burden in the Global Burden of Disease Study (GBD) 2023.Methods: We extracted deaths, DALYs, YLDs, incidence and prevalence for 204 countries, 1990–2023, from the GBD 2023 Results Tool for the official <5-year aggregate plus three older pediatric bands. We computed trends, Socio-demographic Index (SDI) gradients and pandemic-window changes; defined a national episode-fatality ratio proxy (EFR; deaths per 1,000 incident episodes); extrapolated trends to 2030; tested whether school-age mortality divergence tracks pediatric tuberculosis burden; and decomposed deaths into the 26 etiologic fractions.Results: In 2023, LRIs caused 711,713 deaths (95% UI 579,607–843,819), 62.49 million DALYs and 81.05 million incident episodes at ages 0–19 years. The EFR varied 75.6-fold across countries—three times the 25.9-fold national range of incidence—tracked income and, independently, inequality, and widened between low- and high-SDI settings over 1990–2023; incidence and fatality were positively correlated across countries (r = 0.66), and a best-quartile counterfactual implied 80.1% of deaths avertable (upper bound). The global EFR rose silently by 30.4% between 2010 and 2019. Improvement was age-asymmetric: in crude-rate terms, mortality fell 69.1% under 5 years but 39.4% at ages 5–19 years; the 5–19-year share of deaths rose from 6.7% to 14.4%, reaching 16.5% by 2030. Divergence was widest where under-5 progress was fastest and did not track pediatric tuberculosis burden. Streptococcus pneumoniae caused 32.0% of 2023 deaths (47.8% in 1990); influenza and RSV deaths collapsed into 2021 and rebounded fastest thereafter, remaining below 2019. Low-SDI countries carried 61.7% of deaths at 22 times the high-SDI rate. Post-2021 patterns were directional only.Conclusions: Fatality inequality—wider than, and positively correlated with, exposure inequality—now defines the divide, and progress has concentrated under age 5, leaving school-age children and adolescents behind. We propose the EFR as a monitorable indicator, with layered responses: surveillance extension to ages 5–19 years, clinical targeting of high-risk groups, and case-management strengthening in high-burden regions—without routine adolescent vaccine expansion, which current data do not support.
Keywords:
lower respiratory infections
; pneumonia
; Global Burden of Disease
; GBD 2023
; child mortality
; adolescents
; episode-fatality ratio
; health inequality
; COVID-19
1. Introduction
1.1. Background and Motivation
1.1.1. Lower Respiratory Infections as the Leading Infectious Killer of Children
Lower respiratory infections (LRIs)—predominantly pneumonia and bronchiolitis—remain the foremost infectious cause of death in childhood [1,2]. Our aggregation of Global Burden of Disease (GBD) Study 2023 estimates indicates that in 2023 LRIs caused approximately 712 thousand deaths and 62.5 million disability-adjusted life-years (DALYs) at ages 0–19 years, alongside over 81 million incident episodes [3,4].
1.1.2. A Global Success Story Built Around Children Under Five
Global under-5 deaths fell from ~1.90 million in 1990 to 610 thousand in 2023 (−67.7%) [3,4]. This progress is bound to a policy architecture explicitly targeting the youngest children: the WHO/UNICEF Global Action Plan for the Prevention and Control of Pneumonia and Diarrhoea (GAPPD) framed its goals around ending preventable under-five deaths [5], and Sustainable Development Goal target 3.2 defines its endpoint at under-five mortality [6]. Vaccine scale-up, improved nutrition, and expanded access to care have been central to these gains [1,5].
1.1.3. School-Age Children and Adolescents: The Evidence Gap
A rarely examined consequence follows: 5–19-year-olds receive limited attention in current LRI monitoring and control frameworks, and their burden is seldom quantified as a distinct segment [5,6]; hospital-based estimates exist for ages 5–19 years [7], and a GBD 2023 analysis of six severe infectious causes has since quantified adolescent (10–19-year) mortality, LRI included, at the global and SDI level [8]; but population-level LRI mortality across the full 0–19-year span—four pediatric bands at country level—remains unquantified. The omission is not trivial: school-age children and adolescents carry a clinically real LRI burden (concentrated in identifiable high-risk groups) and are roughly twice as numerous as under-fives. Whether the age divergence in improvement widened during and after the COVID-19 pandemic has not been systematically examined across the four pediatric bands at the GBD level.
1.2. Research Gap
1.2.1. What Existing GBD-Based Analyses Do Not Provide
The GBD 2023 LRI capstone analysis provides an authoritative all-ages, pathogen-oriented account of LRI burden, but its pediatric reporting is anchored on the under-five aggregate, older children being absorbed into broad 5–14-year and all-ages bands [1]. The capstone’s second axis—antimicrobial-resistance (AMR) attribution—is likewise reported across all ages rather than for pediatric age bands; we do not re-estimate AMR-attributable burden, our focus instead being the pathogen × age-band × sex structure of the 0–19-year burden and the episode-fatality (double-margin) analyses developed below. A recent Frontiers analysis covered ages 0–14 years (no 15–19-year group) on the superseded GBD 2021 round and terminates in 2021, before the 2021–2023 rebound window [9]. An all-ages, risk-factor-oriented broadband analysis on GBD 2023—reported by WHO region in 0–4, 5–14, 15–49, 50–69, and ≥70-year bands—is available as a preprint [10]; it likewise does not isolate the 0–19-year span or the school-age and adolescent bands. GBD 2023, which explicitly models the COVID-19 period, has not yet been used to characterize the pediatric LRI burden across the full 0–19-year span with fine-grained school-age and adolescent bands.
1.3. Objectives and Contributions
This study provides comprehensive estimates of the LRI burden at ages 0–19 years from 1990 to 2023. All estimates were computed by the authors from raw GBD 2023 Results Tool downloads [4]; the 0–19-year series combines the official under-five aggregate and the three older bands, cross-validated against published wide-age-band values (≤0.16%) [1,3]. Five contributions follow.
First, we formalize the fatality margin of the cross-national divide as a named, reusable indicator—the episode-fatality ratio proxy (EFR; deaths per 1,000 incident episodes)—and quantify its structure: the EFR varies 75.6-fold across countries, three times the 25.9-fold national range of incidence, carries an income-independent inequality penalty, and has widened between the poorest and richest settings since 1990; because the two margins are positively correlated (r = 0.66), the same countries are disadvantaged on both. We bound the implied avertable deaths by counterfactual [3,4,11].
Second, to our knowledge this is the first systematic analysis to combine the 0–19-year LRI burden on GBD 2023 estimates—disaggregated into four pediatric age bands (<5, 5–9, 10–14, and 15–19 years) and six measures (deaths, DALYs, YLDs, derived YLLs, incidence, prevalence) across 204 countries and territories, 21 GBD regions, and five Socio-demographic Index (SDI) quintiles, with sex stratification [3,4]—with the national episode-fatality analyses and the 26-fraction etiologic decomposition (narrower antecedents on GBD 2023 or GBD 2021 are delineated in Section 1.1.3 and Section 1.2.1, and 4.8). The design quantifies the shift of pediatric LRI mortality toward school-age children and adolescents, whose share of deaths doubled (6.7% to 14.4%) between 1990 and 2023.
Third, we subject the two leading explanations for the 5–19-year divergence—asymmetric reach of under-5 interventions versus adolescent-specific mechanisms such as HIV/tuberculosis—to an ecological discriminating test against same-round GBD 2023 pediatric tuberculosis burden, and translate current trends into falsifiable predictions, including an extrapolation of the 5–19-year share to 2030 and beyond [3,4].
Fourth, we examine the post-2021 rebound window (2021–2023) across childhood age bands and SDI quintiles—which analyses terminating in 2021 could not capture—using descriptive two-segment net changes [3,4].
Fifth, we decompose the 0–19-year deaths into the 26 GBD 2023 etiologic fractions, quantifying the 2023 pathogen spectrum, its diversification since 1990, and its pathogen-specific anatomy across the pandemic window [1,4].
Together, these contributions provide an age-disaggregated, pandemic-aware assessment to inform extending pneumonia control frameworks—historically centered on under-fives—to the school-age and adolescent populations progress has left behind.
2. Methods
2.1. Study Design and Data Sources
2.1.1. GBD 2023 Analytical Framework
This study is a secondary analysis of the Global Burden of Disease (GBD) Study 2023, coordinated by the Institute for Health Metrics and Evaluation (IHME) [3,4,12]. GBD 2023 estimates disease and injury burden for 204 countries and territories, aggregated into 21 GBD regions and five Socio-demographic Index (SDI) quintiles [3]. Causes of death are modeled with the Cause of Death Ensemble model (CODEm), nonfatal outcomes with DisMod-MR 2.1, and garbage codes (including unspecified pneumonia) systematically redistributed [1,3]. Estimates derive from posterior draws; 95% uncertainty intervals (UIs) are the 2.5th and 97.5th draw percentiles [3]. The LRI cause in GBD is an all-pathogen envelope with etiologic fractions estimated separately on a population-attributable-fraction basis [1]; we analyze the envelope and, for deaths, its decomposition into the 26 mutually exclusive fractions, which sum to 100% of the envelope by construction (Section 3.14). The etiology interface publishes deaths only, so all etiologic analyses are mortality-based.
2.1.2. Direct Download and Author Aggregation of Estimates for Ages 0–19 Years
All pediatric estimates were derived from raw data downloaded by the authors from the GBD Results Tool [4] on 16–18 August 2026, using reproducible queries (Box 1) covering deaths, DALYs, YLDs, incidence and prevalence (numbers and rates per 100,000, with 95% UIs) for the official <5-year aggregate and the three older age groups, both sexes and sex-stratified, at the global level, the five SDI quintiles, 21 GBD regions and 204 countries and territories, 1990–2023. Complementary extractions covered pathogen-attributed LRI deaths for the 26 etiologic fractions (Section 3.14); the 20–24-year band, used only to test whether the age divergence extends beyond age 19 (Section 4.2; Supplementary Table S11); 0–19-year COVID-19 deaths, 2020–2023 (Section 4.4); and 0–19-year tuberculosis deaths, the same-round anchor for Section 3.13. No estimate was transcribed from any previously published article.
Box 1. GBD 2023 Results Tool query specification (all extractions run 16–18 August 2026;
https://vizhub.healthdata.org/gbd-results).
| Field | Specification |
| Cause | Lower respiratory infections (all-pathogen envelope); separate extractions for tuberculosis and COVID-19 (Section 3.13 and Section 4.4) |
| Measures | Deaths, DALYs, YLDs, incidence and prevalence, each as number and rate per 100,000 with 95% UIs (YLLs are not published for LRI and were derived as DALYs − YLDs; Section 2.3.1) |
| Age groups | Official “<5 years” aggregate; 5–9, 10–14 and 15–19 years; supplementary <1 and 2–4 years; 20–24 years (extension analysis); all-ages and age-standardized (context) |
| Locations | Global; five SDI quintiles; 21 GBD regions; 204 countries and territories |
| Years | 1990–2023 (COVID-19 extractions: 2020–2023) |
| Sex | Both; male; female |
| Etiology interface | Pathogen-attributed LRI deaths for the 26 etiologic fractions, ages 0–19 years, global and seven super-regions, 1990–2023 |
2.1.3. Age-Band Caliber and the Absent Single-Year Age Groups
The GBD 2023 Results Tool does not publish single-year age groups; in particular, no “1 year” row exists, so the under-five segment cannot be reconstructed by summing the <1-year and 2–4-year rows, which underestimate the official aggregate by 12–13% (the residual approximating the unpublished 1-year-old group). We therefore adopted the following caliber: the under-five segment is the official GBD aggregate row “<5 years”, and the 0–19-year total sums four non-overlapping rows—<5 years + 5–9 + 10–14 + 15–19 years; the <1 and 2–4-year rows serve supplementary within-band description only.
Extraction accuracy was verified against published GBD 2023 values: author-tabulated 2023 totals under this caliber matched the official capstone wide age bands to within ≤0.16% [1] (full cross-validation table in the Supplementary Materials).
2.1.4. Comparison with Previous GBD Rounds
Because each GBD round re-estimates the entire time series with updated data and methods, cross-round numerical differences cannot be attributed to true temporal change; no estimate from any previous GBD round enters any table, figure, or trend reported here, with one labeled exception: the susceptibility axis of the age-tropism map (Section 2.7.5 and Section 3.14), which splices GBD 2021 etiology incidence with GBD 2023 etiology deaths and is presented as model-based positioning, not trend evidence. Prior-round pediatric LRI analyses [9] are discussed only for scope and pattern.
2.2. Case Definition
LRIs were defined per the GBD cause hierarchy as diseases of the lower airways—including pneumonia and bronchiolitis—mapped from ICD-10 codes [1,3]. The GBD models LRI mortality as an all-pathogen envelope, with etiologic fractions estimated separately; we analyze the envelope and, for deaths, its etiologic decomposition (Section 3.14).
2.3. Metrics and Measures
2.3.1. Measures
Six measures are reported—deaths, DALYs, YLDs, YLLs, incidence, and prevalence—each as a number and a rate per 100,000 with 95% UIs. All but YLLs were downloaded directly from the GBD Results Tool [4]; because the Results Tool publishes no LRI-specific YLL row, YLLs were derived as DALYs minus YLDs (at pediatric ages YLDs constitute <0.2% of DALYs, so DALYs ≈ YLLs). Derived YLL UIs were synthesized from DALY and YLD half-widths by root-sum-of-squares (Section 2.5.4), conservative because the draws are positively correlated; derived YLLs agreed with official wide-band anchors within 0.04%.
2.3.2. Rate Definitions
Three rate definitions are used and labeled at each table. Official GBD age-specific rates for the four pediatric bands are the primary basis of rate comparisons. 0–19-year crude rates were computed by the authors: band populations were back-calculated from the official number and rate rows (population = number ÷ rate × 100,000) and summed, and crude rates equal Σ(number) ÷ Σ(population); rate UIs are converted from count UIs and omit denominator uncertainty. Official “Age-standardized” rows characterize the whole population and appear only as labeled background, never as pediatric trends.
2.4. Stratification
Estimates were stratified by the four pediatric age bands, sex, SDI quintile, the 21 GBD regions, and the 204 countries and territories [3]; the composite “5–19 years” segment is the author-computed sum of the three older bands.
2.5. Temporal Trend Analysis
2.5.1. Estimated Annual Percentage Change, 1990–2023
Long-term trends were quantified using the estimated annual percentage change (EAPC) from a log-linear regression of the rate on calendar year; EAPC = 100 × (e^β − 1) [13], with 95% confidence intervals (CIs) from the slope’s standard error (t distribution), reflecting regression precision only. EAPCs were computed on 0–19-year crude rates and band-specific rates; endpoint percentage changes are reported separately.
2.5.2. The 2019–2023 Pandemic Window
The pandemic-era window was analyzed differently by design: a five-point EAPC would average directionally opposite movements into one slope, so we do not report five-point EAPCs in the main text. Pandemic-window patterns are instead described using year-on-year percentage changes and two-segment net changes (2019→2021 and 2021→2023), each with Monte Carlo–propagated UIs (Section 2.5.3). These analyses are explicitly descriptive: because the propagated UIs generally include zero, they are interpreted as directional patterns only.
2.5.3. Monte Carlo Propagation of Uncertainty for Percentage Changes
UIs for percentage changes between two years were propagated by Monte Carlo simulation (20,000 draws per estimate), modeling each published value as normally distributed with standard deviation (upper − lower)/3.92 and truncating at zero. Because adjacent-year draws are positively correlated, the independence assumption widens the propagated intervals relative to a draw-level computation; reported change UIs are conservative.
2.5.4. Aggregation of Uncertainty Intervals Across Age Bands and Sexes
The GBD Results Tool reports UIs for each published row but not for author-computed sums; for sums across age bands and sexes, UIs were approximated by converting each row’s UI to a half-width, (upper − lower)/2, and combining half-widths by root-sum-of-squares assuming independence. Because posterior draws sharing location and models are positively correlated, pooled UIs are somewhat narrower than an official joint-distribution aggregation.
2.5.5. Extrapolation to 2030
To convert observed trend divergence into falsifiable expectations, we extrapolated the 1990–2023 log-linear mortality-rate trends for the under-5 aggregate and the composite 5–19-year segment to 2030, the SDG endpoint year. Projected death counts multiply extrapolated rates by back-calculated populations (Section 2.3.2) projected at their 2000–2023 compound growth rates (0.51% and 0.48% per year). Uncertainty was propagated by Monte Carlo simulation (100,000 draws) combining the 2023 rate UI with the slope’s standard error. The extrapolation assumes constant trends and continued population growth—an illustrative baseline, not a forecast.
2.6. Statistical Analysis, Ethics, and Reporting
Aggregation and all derived quantities were computed in Python 3.11 from the downloaded CSV files; no new GBD model runs were performed. Reporting follows the Guidelines for Accurate and Transparent Health Estimates Reporting (GATHER) [14]; the completed checklist is provided as Supplementary Material. All underlying estimates are publicly accessible through the GBD Results Tool [4]; raw and author-aggregated CSV files are provided as Supplementary Data, and analysis code is available on reasonable request.
2.7. Ecological and Model-Derived Analyses
2.7.1. Country Covariates and the National Episode-Fatality Ratio Proxy (EFR)
An author-compiled country covariate table (215 countries and territories) was assembled from public sources: gross domestic product (GDP) per capita, the Gini index, urbanization rate, and the World Bank income classification [11]; geographic and climatic indicators (latitude, land area, landlocked status, coastline, elevation, temperature, humidity, precipitation); ambient PM2.5; and ethnic, linguistic, and religious fragmentation indices (reference years vary; Supplementary Data); and vital-registration completeness (World Development Indicators indicator SP.REG.DTHS.ZS, latest available year since 2010) [11]. Because LRI is an acute, short-duration illness whose GBD point-prevalence approximates a ~7-day episode (Section 2.7.2), we defined the national episode-fatality ratio proxy (EFR) as deaths per 1,000 incident episodes at ages 0–19 years in 2023—an ecological analogue of case fatality—with a prevalence-based variant (deaths per 100,000 prevalent cases) as a robustness check, and we propose it as a monitorable indicator of case-management performance. Analyses were restricted to the 159 countries with at least 5,000 incident 0–19-year episodes. Associations with log-transformed GDP per capita used Spearman rank correlation and ordinary least-squares regression of the log-transformed EFR on log GDP per capita with the Gini index in levels. A counterfactual applied the best-quartile fatality threshold to all included countries to bound potentially avertable deaths. Sensitivity analyses excluded countries below 1 million population. We decomposed the cross-national variance of the log crude death rate into the log-incidence-rate and log-EFR variances and their covariance (an exact identity), reporting each share with bootstrap 95% intervals (10,000 resamples) and outlier-exclusion variants; a registration-completeness sensitivity refit the income–inequality model with completeness as an additional covariate. Income-expected EFRs from a log–log regression on GDP per capita yielded residual-based outlier rankings of countries performing better or worse than income peers (Supplementary Table S9).
2.7.2. Model-Derived Structural Indicators
The YLL:YLD ratio at ages 0–19 years (five SDI quintiles and global, 1990–2023) was computed as a structural indicator of the fatal-versus-non-fatal composition of the burden; because YLLs and YLDs are internally co-modelled, the ratio is model-derived, not observed. A pre-specified incidence–prevalence divergence analysis was not pursued: for an acute infection the prevalent-to-incident ratio is a model-implied, essentially invariant episode-duration index (globally 0.0204 in 2023, ≈7.4 days). SDI-stratified pandemic-window endpoint changes were computed as point estimates under the descriptive convention of Section 2.5.2.
2.7.3. Island and Compact Coastal Subset
To isolate climatic gradients from continental confounders, an a priori subset of island and compact coastal nations was defined as non-landlocked countries with land area below 100,000 km² and population above 50,000; 66 of 75 candidates matched GBD 2023 country rows. Spearman and partial correlations controlling log GDP per capita related crude 0–19-year death, DALY, incidence, and prevalence rates to 14 socioeconomic, geographic, and climatic predictors, with Benjamini–Hochberg false-discovery-rate adjustment across the 4-outcome × 14-predictor matrix. Adjacent ocean-current regimes (warm, cold, equatorial, mixed) were hand-labelled from standard oceanographic geography and analyzed descriptively given small cell sizes. All Section 2.7 analyses are ecological and hypothesis-generating; no causal interpretation is intended.
2.7.4. Ecological Discriminating Test of the 5–19-Year Divergence
To arbitrate between two explanations for the slow 5–19-year improvement—asymmetric reach of under-5-targeted interventions versus adolescent-specific mechanisms such as HIV and tuberculosis—we computed regional 1990–2023 EAPCs of the 5–19-year and under-5 crude LRI mortality rates and their difference (the age-divergence gap) and related them, by Spearman rank correlation across the 21 regions, to same-round pediatric (0–19-year) tuberculosis mortality in 2023 and its 1990–2023 EAPC [4]. Adolescent HIV mortality, co-located with pediatric tuberculosis in high-burden African regions [15,16], was incorporated qualitatively. The test is ecological and limited to 21 regional units.
2.7.5. Pathogen Age-Tropism Positioning
For the 14 pathogens shared between the GBD 2021 etiology incidence interface (coarse <5-year and 5–14-year bands) and the GBD 2023 etiology mortality interface (five bands), we computed a susceptibility-age index (SAI; 5–14-year to <5-year incidence share ratio, GBD 2021, both sexes, 2021) and a lethality-age index (LAI; 15–24-year to <5-year death share ratio, GBD 2023, 2023), summarized their concordance by Spearman correlation and log–log regression, and measured off-diagonal departure (age-tropism discordance, ATD) as the vertical log–log residual. The two-round splice and coarse incidence bands are caliber limitations (Section 4.9), so this analysis is model-based positioning, not individual-level virulence measurement.
3. Results
3.1. Global Burden at Ages 0–19 Years in 2023 and Long-Term Change (Table 1; Figure 1)
In 2023, lower respiratory infections (LRIs) caused an estimated 711,713 deaths (95% uncertainty interval [UI] 579,607–843,819) at ages 0–19 years worldwide (crude rate 26.6 per 100,000) [4]. Incident episodes numbered 81.05 million (72.33–89.77 million), prevalent cases 1.65 million (1.49–1.82 million), and total disability-adjusted life-years (DALYs) 62.49 million (50.74–74.24 million), of which years lived with disability (YLDs; 102,429, 76,345–128,513) contributed <0.2%; derived years of life lost were 62.39 million (50.64–74.14 million) (Table 1).
Between 1990 and 2023, deaths at ages 0–19 years fell by 64.8% (95% UI −73.0 to −55.4) and DALYs by 65.1% (−73.2 to −55.6); incident episodes fell by 51.0% (−58.5 to −42.4) (Table 1). Over 2019–2023, deaths declined by 12.2% on point estimates (−32.3 to +11.4) while incident episodes rose by 13.6% (−2.7 to +31.6); both intervals include zero (descriptive only; Section 3.7).
3.2. Age-Pattern: The Shifting Share Toward Ages 5–19 Years (Figure 1c,d; Figure 2)
The age distribution of the 2023 burden was steeply graded. Children under 5 years accounted for 609,540 deaths (478,375–740,704; 85.6% of all 0–19-year deaths) at a crude rate of 94.79 per 100,000, versus 7.09, 4.34, and 3.55 per 100,000 across the 5–9-, 10–14-, and 15–19-year bands; incidence showed the same gradient.
Long-term improvement diverged sharply by age. In absolute counts, deaths fell between 1990 and 2023 by 67.7% (95% UI −75.9 to −57.9) under 5 years but by only 37.6%, 8.3%, and 3.8% at ages 5–9, 10–14, and 15–19 years—25.3% overall (137,279 to 102,173), with DALYs down 26.0%; the under-5 interval overlaps none of the older bands. Count contrasts are amplified by differential population growth (+4.7% under 5 years versus +23.6% at ages 5–19 years). In rate terms, mortality fell by 69.1% (−77.2 to −59.3) under 5 years versus 48.0%, 27.9%, and 22.3% across the older bands, and by 39.4% (−51.4 to −25.4) at ages 5–19 years overall—a large, statistically distinguishable divergence. Consequently, the 5–19-year share of 0–19-year LRI deaths more than doubled (6.7% to 14.4%), and their share of incident episodes rose from 25.0% to 38.9%.
Within the under-5 aggregate, the constituent <1-year and 2–4-year groups (supplementary detail; not summing to the official aggregate) recorded 426,982 deaths (342.6 per 100,000) and 108,285 (27.6), mortality concentrating in infancy (Supplementary Table S2).
3.3. Sex Differences
Males carried a modestly larger burden, the gap widening slightly over time: in 2023, 379,211 deaths (269,334–489,088) occurred in boys versus 332,502 (258,058–406,945) in girls (male-to-female ratio 1.14, versus 1.11 in 1990); crude mortality rates were 27.6 versus 25.6 per 100,000, and incident episodes 43.13 versus 37.92 million.
3.4. Socio-Demographic Index Gradient (Table 2; Figure 3)
The burden was strongly patterned by socio-demographic development (Table 2). In 2023, low-SDI countries accounted for 439,039 deaths—61.7% of the global 0–19-year total—at a crude mortality rate of 51.79 per 100,000, 22 times the high-SDI rate (2.36). Mortality rates rose monotonically across quintiles; incidence rates showed a parallel but shallower gradient (1,428 versus 4,298 per 100,000).
Improvement since 1990 was fastest where the baseline burden was lowest: deaths fell by 92.6% in high-SDI and 85.8% in high-middle-SDI countries, versus 78.2% in middle, 64.9% in low-middle, and only 44.5% in low-SDI countries (UIs in Table 2); the mortality gradient has widened.
3.5. Regional Patterns (Table 3)
Mortality was geographically concentrated (Table 3). Three regions—Western Sub-Saharan Africa (220,627 deaths; 31.0% of the global total), South Asia (196,859; 27.7%), and Eastern Sub-Saharan Africa (103,577; 14.6%)—together accounted for 73.3% of all 0–19-year LRI deaths in 2023. The highest crude mortality rates occurred in Western (78.30 per 100,000) and Central (59.08) Sub-Saharan Africa, Oceania (53.87), and Central Asia (48.83). South Asia carried the largest incident caseload (25.49 million episodes), followed by Western and Eastern Sub-Saharan Africa (13.26 and 10.55 million).
3.6. National Patterns (Figure 4a–b; Table 4)
Ten countries accounted for most deaths in 2023: India (143,193) and Nigeria (116,482) together contributed ~36% of the global total, followed by Pakistan, the Democratic Republic of the Congo, Niger, Ethiopia, Bangladesh, Indonesia, Chad, and Madagascar (Table 4). The highest national crude mortality rates were observed in Niger (153.2 per 100,000), the Central African Republic (132.1), Chad (116.3), South Sudan (94.2), Sierra Leone (94.0), and Guinea (91.7); Uzbekistan’s position in the national crude-rate ranking (eighth; 82.7 per 100,000)—markedly above regional peers—is examined in the Discussion. The largest incident caseloads occurred in India (15.86 million episodes), China (7.48 million), Nigeria (7.07 million), and Pakistan (6.82 million); the highest incidence rates were concentrated in Sub-Saharan Africa and Pakistan.
3.7. The COVID-19 Pandemic Window, 2019–2023 (Figure 2; Descriptive)
Globally at ages 0–19 years, deaths fell by 26.5% (95% UI −43.7 to −6.5) between 2019 and 2021; the point estimate then rose by 20.7% (−9.1 to +57.4) between 2021 and 2023 (net −12.2%, −32.3 to +11.4). Incident episodes rose across both sub-windows (net +13.6%, −2.7 to +31.6); all post-2021 intervals include zero and are directional only.
The 2021–2023 point-estimate increase in deaths was largest under 5 years (+23.1%, −11.6 to +67.9) and positive across the older bands (5–9 years +8.5%; 10–14 years +13.8%; 15–19 years +17.7%); all intervals include zero. For incidence, the increases were smallest at ages 5–9 years (+8.4%) and largest at 15–19 years (+12.3%). Net 2019–2023 changes at ages 5–19 years were +3.3% (−17.3 to +27.3) for deaths and +12.2% (−12.4 to +40.8) for incidence: mortality improvement in school-age children and adolescents plateaued on point estimates—a return toward pre-pandemic levels cannot be excluded—whereas uncertainty intervals include no change. Deaths under 5 years, by contrast, continued to decline over the full window (net −14.1%, −36.4 to +12.9).
Stratified by SDI quintile (crude 0–19-year rates; point estimates, directional only), the 2021–2023 rebound was smallest in low-SDI countries (death rate +13.6%; incidence rate +5.7%) and largest in high-middle- and low-middle-SDI settings (+29.3% and +27.0%; high SDI +21.0%). The post-2021 resurgence is thus not a low-development phenomenon: where baseline transmission remained highest, both the pandemic-era dip and the subsequent catch-up were shallowest (Section 4.4).
3.8. Cross-Validation Against Official GBD 2023 Capstone Estimates
The four-band aggregation was validated against the official capstone appendix: our <5-year figures are the official aggregate itself, and the 5–9 plus 10–14 sum reproduced the official 5–14-year estimates within +0.003% (deaths) and +0.157% (incidence); all absolute differences were ≤0.16% (Supplementary Material).
3.9. Long-Term Rate Trends, 1990–2023 (Table 5; EAPC)
Globally, the crude mortality rate declined by 3.89% per year (95% CI −4.06 to −3.71) and the incidence rate by 2.99% (−3.29 to −2.70) between 1990 and 2023. Mortality-rate declines were steepest in East Asia and high-SDI countries and slowest in Oceania, the Caribbean, and Southern Sub-Saharan Africa (CIs in Table 5). All-age age-standardized EAPCs describe the whole population and are not comparable with pediatric crude rates; short-window (2019–2023) EAPCs are relegated to the supplement and not used for inference (Section 3.7).
3.10. National Episode-Fatality Ratio Proxy (EFR), Income, and Inequality (Figure 4c–d)
The national episode-fatality ratio proxy (EFR; deaths per 1,000 incident episodes at ages 0–19 years in 2023) was computed for the 159 countries with at least 5,000 incident episodes (Figure 4c; Supplementary Table S7). The EFR varied 75.6-fold, from 0.45 per 1,000 episodes (Austria; Norway, Germany, Republic of Korea and Taiwan all ≤0.76) to 33.70 (Uzbekistan; Azerbaijan 29.08, Niger 27.04, Guatemala 21.63, South Sudan 21.04), with medians declining monotonically across World Bank income groups (low 13.31; lower-middle 10.07; upper-middle 3.71; high 1.50—an 8.9-fold ratio) [11]. The EFR fell steeply with GDP per capita (Spearman ρ = −0.766, P = 2.6×10⁻³¹, n = 156), and in a log–linear model adjusting for GDP per capita (n = 143), each 10-point higher Gini index was independently associated with a 1.31-fold higher EFR (P = 6.0×10⁻⁴; R² = 0.620). Within middle-income countries ($2,000–15,000 per capita), the median EFR was higher in the most than the least unequal Gini quartile (10.06 versus 6.35, n = 69; Figure 4d), consistent under income-group stratification (Supplementary Table S7). Urbanization showed a strong crude association (ρ = −0.603) that vanished after income adjustment (partial r = −0.096, P = 0.24). Results were robust to excluding countries below 1 million population (ρ = −0.771; Gini P = 4.3×10⁻⁴) and to a prevalence-based variant (ρ = −0.760). A counterfactual reducing every country’s EFR to the best-quartile threshold (1.84 per 1,000 episodes) would have averted an estimated 569,511 (95% UI 518,027–622,159) of the 710,980 analysis-set deaths in 2023—80.1%. The EFR fell between 1990 and 2023 in every SDI quintile (low 17.14 → 12.05; high 6.65 → 1.65 per 1,000 episodes), but the low-to-high-SDI ratio widened from 2.6 to 7.3. The global trend concealed a reversal: the EFR declined by only 6.9% between 1990 and 2019 (12.26 to 11.42 per 1,000 episodes) and rose by 30.4% between 2010 and 2019 (8.76 to 11.42), because incidence fell faster than deaths, before falling by 23.1% over 2019–2023 (point estimates).
Formal variance decomposition (Section 2.7.1) attributed cross-national variance in the log crude death rate to incidence (23.5%; bootstrap 95% CI 20.7–26.3), the EFR (37.4%; 33.5–42.3), and their covariance (39.1%; 35.1–42.1; r = 0.660, n = 159): the two margins stack in the same countries. Shares were essentially unchanged excluding Uzbekistan (23.7/36.9/39.4%) or trimming the extreme 2.5% of the EFR distribution at both ends (25.2/36.1/38.7%; Supplementary Table S13). Adding death-registration completeness to the income–inequality model on the 81 countries reporting since 2010 left the income and Gini coefficients essentially unchanged (Gini ×1.34 versus ×1.31 per 10 points; log-GDP coefficient −0.56 versus −0.52), with no independent completeness association (P = 0.54), although the reporting subset skews toward high-income, high-registration settings (Supplementary Table S14).
Relative to income-expected values (log–log regression residuals, n = 156; Section 2.7.1), the most elevated EFRs were in Azerbaijan (6.6× expected), Mexico (5.6×), Uzbekistan (5.4×), Guatemala (4.6×), and Panama (4.5×), and the lowest in conflict-affected, data-sparse settings (Syria 0.16×, Yemen 0.30×; Supplementary Table S9); the former-Soviet and Latin American concentration of positive outliers echoes the Uzbekistan pattern, and both extremes warrant caution (Section 4.5).
3.11. YLL:YLD Divergence and the Concentration of Fatal Burden
LRI remained overwhelmingly mortality-dominated at every development level, but the YLL:YLD ratio declined faster at higher SDI: from 458 (high SDI) versus 1,190 (low SDI) in 1990 (2.6-fold) to 108 versus 849 in 2023 (7.9-fold; global 844 → 609). In parallel, fatal burden concentrated geographically: the low- plus low-middle-SDI share of global deaths rose from 60.5% in 1990 to 82.6% in 2023, while the high-SDI share fell from 8.8% to 1.9%. These ratios are model-derived structural indicators rather than observed quantities (Section 2.7.2).
3.12. Ecological Climate Analysis in Island and Compact Coastal Nations (Figure S1)
In the a priori subset of 66 island and compact coastal nations (Section 2.7.3), crude 0–19-year LRI mortality rose with mean annual temperature (income-adjusted partial r = +0.449, P = 1.8×10⁻⁴) and toward the equator (partial r = −0.375, P = 0.0021), surviving false-discovery-rate control; relative humidity, precipitation, PM2.5, elevation, and fragmentation showed no income-adjusted association (Figure S1; Supplementary Table S8).
3.13. Competing Explanations for the 5–19-Year Divergence: An Ecological Discriminating Test
Two explanations could account for the 5–19-year divergence (Section 4.2): under-5-targeted interventions may not have reached older children, or residual 5–19-year deaths may arise from mechanisms those interventions cannot reach, especially HIV and tuberculosis co-infection [15,16]. These generate opposite geographic predictions: the second implies divergence should be widest where pediatric HIV/tuberculosis burden is highest. We tested this across the 21 GBD regions using same-round pediatric (0–19-year) tuberculosis mortality as the anchor [4], with adolescent HIV mortality incorporated qualitatively [15,16]. The 1990–2023 EAPC of the 5–19-year LRI mortality rate was uncorrelated with the regional pediatric tuberculosis death rate in 2023 (Spearman ρ = +0.28, P = 0.22), and the age-divergence gap (5–19-year minus under-5 EAPC) was, if anything, smallest in high-burden regions (ρ = −0.10, P = 0.66): the widest divergence occurred in Tropical (+6.2) and Southern (+5.8) Latin America, East Asia (+5.3), and Eastern (+4.6) and Central (+4.5) Europe—all low-tuberculosis regions—versus among the smallest gaps in Southern and Western Sub-Saharan Africa (0.8 and 0.9). Regions with the fastest pediatric tuberculosis mortality decline also showed the fastest 5–19-year LRI decline (ρ = +0.63, P = 0.002; significant after Bonferroni adjustment across the three regional tests), a pattern consistent with shared health-system reach (Supplementary Table S10). The divergence thus behaves as a signature of under-5 success rather than of adolescent-specific mechanisms.
3.14. Pathogen-Attributed Decomposition of Deaths, 1990–2023 (Figure 4E–F; Supplementary Table S12)
The GBD 2023 etiology attribution partitions LRI deaths into 26 mutually exclusive pathogen fractions summing to the all-pathogen envelope (Section 2.1.1). In 2023, Streptococcus pneumoniae remained the dominant etiology at ages 0–19 years (227,976 deaths; 32.0% of the total), followed by Klebsiella pneumoniae (85,107; 12.0%), Pseudomonas aeruginosa (7.4%), Staphylococcus aureus (5.3%), Escherichia coli (5.2%), other Mycobacterium spp. (non-tuberculous mycobacteria [NTM]; 5.0%), influenza (4.2%), respiratory syncytial virus (RSV; 3.9%), Mycoplasma (3.7%) and Group A Streptococcus (2.7%); the remaining 16 pathogens together caused 18.6% (Supplementary Table S12). The ranking was broadly stable across age bands, NTM entering the top five from ages 5–9 years upward. Eleven fractions newly attributed in GBD 2023 relative to the previous round [17], including NTM (ranked sixth) and Group A Streptococcus (tenth), together accounted for 109,475 deaths (15.4%). Because these attributions inherit the GBD population-attributable-fraction and case-fatality modelling assumptions, pathogen-level counts—especially for newly attributed causes such as NTM, which lacks pediatric clinical validation series—should be read as rankings and shares rather than microbiologically confirmed counts, an ordering consistent with the all-age capstone [1]. Boys carried more deaths than girls for every pathogen (ratio 1.14), but all 95% UIs overlapped: no pathogen-level sex difference was distinguishable.
The spectrum diversified markedly over the study period (Figure 4E–F): the S. pneumoniae share fell from 47.8% in 1990 to 32.0% in 2023, while K. pneumoniae (10.0%→12.0%), P. aeruginosa (5.0%→7.4%), S. aureus (2.8%→5.3%), E. coli (3.3%→5.2%) and NTM (3.0%→5.0%) all gained share, consistent with vaccine-era erosion of the most vaccine-preventable fraction leaving a more heterogeneous residual burden.
The pandemic window had a pathogen-specific anatomy. Pathogen-attributed deaths fell from 817,047 in 2019 to 596,607 in 2021 and rebounded to 711,713 in 2023 (point-estimate changes −27.0% and +19.3%; 2023 remaining 12.9% below 2019; Monte Carlo means in Section 3.7 differ slightly). The 2019–2021 collapse was steepest for the viruses: influenza −62.6% (55,265 to 20,646) and RSV −65.2% (54,481 to 18,960), against −27.1% for S. pneumoniae. The 2021–2023 rebound (+115,106 deaths) was driven most by S. pneumoniae (+32,678; 28.4%), while the viruses rose fastest in relative terms (RSV +48.0%; influenza +44.4%) yet remained 46–48% below their 2019 levels. This suppression-and-partial-release of viral circulation against a steadier bacterial core is the within-GBD signature of the Section 4.4 mechanism.
Geographically, Sub-Saharan Africa and South Asia together carried 81.4% of pathogen-attributed deaths in 2023, Sub-Saharan Africa alone accounting for 62.6% and 57.3% of global influenza and RSV deaths.
The complete 26-pathogen tabulation, with 1990 shares and pandemic-window changes, is in Supplementary Table S12; etiology-interface totals equal the cause-level totals exactly in 2019–2023 and within 0.2% in 1990.
Positioning the 14 pathogens shared between the two etiology interfaces on the age-tropism map (Section 2.7.5), the lethality-age index closely tracked the susceptibility-age index (Spearman ρ = 0.916, P < 0.0001; log–log slope 0.80): the age curve of death largely mirrors the age curve of infection, with nine pathogens infant-concordant and four older-concordant. The few off-diagonal exceptions—Legionella (ATD +0.57), influenza (+0.23), RSV (+0.16) and A. baumannii (−0.50)—mark where age-specific virulence plausibly departs from age-specific exposure, each consistent with its clinical age-fatality profile (Figure S2; Supplementary Table S15).
External triangulation against case-confirmation networks supports the dominant ordering while flagging expected calibration differences: in the CHAMPS network’s post-mortem-confirmed community pneumonia deaths across seven low- and middle-income settings, S. pneumoniae (35.3%) and K. pneumoniae (25.5%) likewise occupied the top two ranks, with rank-order agreement between the two sources across the five pathogens shared by both (Spearman ρ = 0.60) [18,19]. The higher K. pneumoniae (31.2% versus 12.0%) and Acinetobacter shares in CHAMPS reflect the nosocomial and low- and middle-income-site weighting of post-mortem series relative to the global PAF-modelled average, rather than a discrepancy in the dominant bacterial core; the ANISA neonatal series likewise showed respiratory syncytial virus as the leading infection by incidence and predominantly bacterial deaths among neonates [18,19].
Segmented (joinpoint) trend and inequality analyses. A segmented log-linear joinpoint regression of the 0–19-year crude LRI death rate (grid search over 0–3 joinpoints, BIC-selected; Supplementary Table S-JP1) identified three joinpoints globally (2010, 2018 and 2021): the decline flattened slightly between 1990–2010 (APC −3.90% per year, 95% CI −4.01 to −3.79) and 2010–2018 (−2.77%, −3.07 to −2.46), followed by a sharp pandemic-era drop in 2018–2021 (−12.30%, −13.31 to −11.27) and a significant rebound in 2021–2023 (+9.10% per year, 6.72 to 11.54); the 1990–2023 AAPC was −3.69% (−3.79 to −3.59). All five SDI quintiles showed the same pandemic-era pattern—a break in 2017–2019 followed by a 2021 joinpoint and a significant post-2021 rebound (in the low-middle SDI quintile the 2019 and 2021 joinpoints were the only ones selected). Population-weighted inequality across SDI quintiles remained substantial: the slope index of inequality was −194.3 (−232.5 to −42.8) deaths per 100,000 in 1990 and −69.5 (−75.8 to −12.5) in 2023, while the concentration index changed from −0.340 (−0.415 to −0.083) to −0.411 (−0.556 to −0.113), indicating that the relative concentration of child LRI mortality in disadvantaged settings has not narrowed (intervals overlap; the change is statistically indeterminate) (Supplementary Table S-SII1).
4. Discussion
4.1. Principal Findings
Drawing on Global Burden of Disease (GBD) 2023 estimates, this study provides, to our knowledge, the first systematic analysis of the LRI burden across the full 0–19-year span (four age bands, 204 countries, and the 2021–2023 post-pandemic window), validated against official capstone estimates to within 0.16%. Five findings stand out. First, fatality is the more unequally distributed of the two margins of the divide: the national episode-fatality ratio proxy (EFR; deaths per 1,000 incident episodes) varied 75.6-fold across 159 countries, three times the 25.9-fold national range of incidence, tracked income and, independently, inequality, and widened between low- and high-SDI settings over 1990–2023; because the margins are positively correlated (r = 0.66; the covariance term carries 39.1% of log-mortality variance), high-burden countries are hit on both; a best-quartile counterfactual implied 80.1% of 2023 deaths avertable (upper bound). Second, improvement has been profoundly age-asymmetric: the crude mortality rate fell by 69.1% under 5 years but by only 39.4% at ages 5–19 years (−67.7% versus −25.3% in counts; intervals non-overlapping), our most robust inference, resting on three-decade declines; the 5–19-year share of deaths more than doubled (6.7% to 14.4%) and their share of incident episodes rose from 25.0% to 38.9%. Third, an ecological discriminating test attributed this divergence to asymmetric reach of under-5-targeted interventions rather than adolescent-specific mechanisms such as HIV/tuberculosis (Section 3.13), and extrapolation places the 5–19-year share at 16.5% by 2030, crossing one fifth around 2040 (Section 4.7). Fourth, the burden remains large and almost entirely fatal (711,713 deaths [95% UI 579,607–843,819] and 62.49 million DALYs in 2023, YLDs under 0.2%), and inequity is stark and widening: low-SDI countries carried 61.7% of deaths at 22 times the high-SDI rate, and three regions concentrated 73.3%. Fifth, the 2019–2023 window showed a “more illness, directionally fewer deaths” configuration: incident episodes up 13.6% net, deaths down 12.2% net, both intervals including zero (descriptive only); the etiologic decomposition localized this window to a viral collapse and partial rebound against a steadier pneumococcal core (Streptococcus pneumoniae still 32.0% of 2023 deaths; 47.8% in 1990).
4.2. The Overlooked 5–19-Year-Old: Implications for a <5-Centered Agenda
Global child pneumonia policy, exemplified by GAPPD and the under-5 mortality target of SDG 3.2, is framed almost exclusively around children under 5 years [5,6]. Our results quantify the cost of that focus: the 102,173 deaths and 8.12 million DALYs estimated at ages 5–19 years in 2023 amount to 83% of the entire 0–19-year LRI death toll of all high-, high-middle-, and middle-SDI countries combined (123,000). The near-stagnation of decline at ages 10–14 and 15–19 years over 33 years (−8.3% and −3.8% in counts; −27.9% and −22.3% in rates), against a 69.1% rate decline under 5, indicates that the interventions credited with the under-5 success (vaccination, nutrition, household air pollution, case management) have not translated into equivalent gains for older children. Our discriminating test (Section 3.13) favours the asymmetric-reach reading: the divergence is widest where under-5 progress was fastest, is uncorrelated with pediatric tuberculosis burden, and co-moves with tuberculosis progress—although HIV/tuberculosis likely still sustains the level of residual mortality in sub-Saharan Africa [15,16,20].
Fatal LRI beyond early childhood concentrates in identifiable high-risk groups: HIV and tuberculosis co-infection (consistent with the heavy 15–19-year burden in sub-Saharan Africa), immunodeficiency, aspiration pneumonia in neuromuscular disease, acute chest syndrome in sickle cell disease, cystic fibrosis and bronchiectasis, and severe pneumonia with sepsis [15,21,22]. The rising share of deaths at ages 5–19 years is partly the arithmetic signature of faster under-5 decline, but the rate divergence behind it (−39.4% versus −69.1%) is real, statistically distinguishable, and predictable (Section 4.7). The divergence extends into early adulthood: the 1990–2023 mortality-rate EAPC at ages 20–24 years (−1.13% per year, −1.26 to −1.00) nearly equals the 15–19-year band (−1.11); regional divergence gaps at 20–24 years tracked those at 5–19 years across the 21 regions (ρ = 0.909, P = 1.6×10⁻⁸); and 2023 deaths (20,686; 3.44 per 100,000) exceeded 2019 levels (Supplementary Table S11).
4.3. Socioeconomic and Geographic Inequity
The 22-fold mortality-rate ratio between low- and high-SDI quintiles, and the decelerating gradient of improvement (high −92.6% versus low −44.5% since 1990), indicate widening relative inequality even as absolute rates fall everywhere. The concentration of 73.3% of deaths in three regions implies that a small number of high-burden, high-fertility settings will determine whether global pediatric LRI mortality continues to fall; the far shallower incidence gradient is consistent with case fatality (timely oxygen, antibiotics, referral care) rather than exposure driving the divide [23].
4.4. The Pandemic Window, Interpreted with Caution
This section aims to establish a baseline falsifiable in the GBD 2024/2025 rounds, not to report established facts: all post-2021 intervals include zero and are descriptive only. Within these limits, the age patterning is coherent: the 2021–2023 point-estimate increase in deaths was largest under 5 years (+23.1%), whereas incidence increases were largest at ages 15–19 years (+12.3%). This dissociation is compatible with susceptible-pool accumulation during non-pharmaceutical-intervention years (“immunity debt”) expressed as mortality preferentially in infants and toddlers, whose narrow airways and severity risk convert returning infections into deaths, while in older children it registers mainly as episodes [24]. Two qualifications are essential: the etiologic decomposition shows the expected viral anatomy (Section 3.14), but the attribution is itself model-based, so consistency with multi-country RSV and influenza resurgence remains ecological; and 2022–2023 estimates carry a substantial extrapolation component, so GBD estimates alone cannot test such hypotheses. The rebound was also smallest in low-SDI settings, consistent with shallower pandemic-era suppression—and hence less susceptible-pool accumulation—where baseline transmission remained high, rather than superior post-pandemic control.
For the 5–19-year band, the net 2019–2023 death change was +3.3% (95% UI −17.3 to +27.3): the point estimate exceeds the 2019 level but the interval spans zero—a plateau in improvement, with a genuine rebound possible but unproven.
One competing account can be ruled out: that the fall and rise of LRI deaths merely reflects COVID-19 mortality displacement. GBD assigns COVID-19 and LRI as mutually exclusive causes; 0–19-year COVID-19 deaths numbered 99,113 in 2020 and 147,942 in 2021 (15.0% and 24.8% of contemporaneous LRI deaths), then fell by 61–64% as LRI deaths rebounded. Counting both causes together would have shrunk the 2020–2021 respiratory-death decline rather than created it; the pathogen anatomy of Section 3.14 (suppressed viruses, steadier bacterial core) fits the non-pharmaceutical-intervention account instead.
Two calibrations sharpen this reading. First, pediatric COVID-19 deaths (an independent GBD 2023 cause, not folded into LRI estimates) equalled 15.0%, 24.8%, 8.6% and 7.4% of same-year LRI deaths in 2020–2023: co-infection and cause-of-death misclassification during the pandemic cannot explain the LRI decline, because LRI fell fastest precisely when pediatric COVID-19 mortality peaked (Section 3.13). Second, at regional level, 2020–2021 LRI incidence suppression was deepest in Eastern Europe (−2.1%) and Central Latin America (−1.6%) and absent in high-income North America (+1.4%), a pattern only weakly correlated with population-weighted OxCGRT stringency (ρ=+0.30, n=5 representative countries, descriptive) and with no signal in URI estimates (GBD’s URI model shows no NPI indentation), consistent with a modelling floor rather than a true null.
4.5. The Uzbekistan Anomaly: True Burden or Data Artifact
Uzbekistan ranked eighth among all countries for crude 0–19-year LRI mortality in 2023 (82.7 per 100,000; 11,065 deaths), well above the Central Asian mean (48.8), and first on the national episode-fatality ratio proxy (33.70 per 1,000 episodes; Section 3.10). Two non-exclusive explanations merit consideration: genuinely elevated pediatric pneumonia mortality, or a modeling artifact whereby redistribution of poorly specified death certificates and covariate-based extrapolation concentrate deaths in cells with weak vital registration [25]; we flag the finding for triangulation against national statistics rather than interpreting it at face value.
4.6. The National Fatality Gradient, Structural Indicators, and Climatic Signals
The 75.6-fold national range in the episode-fatality ratio proxy (EFR; Section 3.10)—three times the 25.9-fold range of incidence—makes fatality the more unequally distributed margin of the country-level divide, though the two margins co-vary (r = 0.66) and the divide therefore runs through both. Because the EFR divides two co-modelled GBD quantities, it cannot separate severity at onset from treatment failure, and episode under-ascertainment in data-sparse settings mechanically inflates it; it is an upper-bound marker of unmet treatment needs, not a clinical case-fatality risk. Its 0.45–33.70 range is nonetheless order-of-magnitude consistent with clinical reports of pediatric pneumonia case fatality below 1% in high-income settings and 5–15% in parts of sub-Saharan Africa [7,23]. Within those limits, the income gradient for fatality far exceeds that for incidence, consistent with the primacy of case management over exposure in determining who dies [23]; and the income-independent Gini association, persistent within the middle-income band, implicates within-country distributional deficits beyond average wealth. The 80.1% counterfactual is an ecological bound, not an attributable fraction, but quantifies the headroom for mortality reduction without advances in prevention. The income and inequality gradients were essentially unchanged when death-registration completeness was added to the model (Section 3.10), and the variance shares were stable to outlier exclusion; we nonetheless retain the upper-bound label for all EFR-based quantities.
The 2010–2019 decade adds a temporal dimension: the global EFR rose by 30.4% while deaths and incidence both fell, so mortality-monitored frameworks (GAPPD, SDG 3.2) registered uninterrupted success precisely as episode survival deteriorated—a silent decade of worsening fatality that an EFR-type indicator reported alongside mortality would have made visible (Section 3.10).
Two operational uses follow. First, the EFR is computable from any GBD round for every country and could serve as a case-management performance metric in GAPPD-successor frameworks, with income-residual outliers nominating priority settings for clinical-outcome studies (Section 3.10). Second, the widening low-to-high-SDI EFR ratio implies that the fatality divide is growing even as all quintiles improve: convergence in fatality, not merely in death counts, is now the binding frontier of pediatric pneumonia equity.
The island analysis (Section 3.12) adds a hypothesis-generating climatic dimension: mortality rose with temperature and toward the equator independently of income, while the expected humidity signal was absent—nulls that counsel against mechanistic claims. Together these patterns nominate warm, low-latitude, unequal, middle-income settings for clinical-outcome studies of pediatric LRI fatality.
The fatality gradient also intersects antimicrobial resistance: in the WHO GLASS network, median ceftriaxone resistance in K. pneumoniae bloodstream isolates was 70.3% and carbapenem resistance 32.7%—with Pakistan (79.6%), Egypt (95.7%) and India (98.3%) at the extreme—so the pathogen ranked second in our mortality spectrum is also the one where first-line therapy is most often already failing in the highest-burden settings [26]. The convergence of high attributable mortality (12.0% of 2023 deaths), high nosocomial weight in post-mortem series, and failing first-line agents makes K. pneumoniae the clearest case for the next generation of pediatric pneumonia therapeutics and stewardship.
4.7. Testable Predictions and the 2030 Horizon
Extrapolating the 1990–2023 log-linear mortality-rate trends to 2030, the SDG endpoint year (Section 2.5.5), we project 472,900 (95% UI 371,100–576,000) under-5 deaths and 93,400 (79,000–107,900) at ages 5–19 years in 2030 (Table 6); the 5–19-year share rises from 14.4% in 2023 to 16.5% (13.2–20.7) in 2030 and crosses one fifth around 2040. These illustrative baselines, not forecasts, convert the arithmetic of differential decline into four falsifiable predictions. P1 (fatality-first convergence): if case management rather than exposure drives the divide, national EFRs will converge toward best-quartile levels faster than incidence rates converge across income groups in future GBD rounds. P2 (age pattern of the post-pandemic window): if the susceptible-pool (“immunity debt”) reading of Section 4.4 is correct, GBD rounds incorporating observed 2022–2024 data will show mortality catch-up resolving faster under 5 years than at ages 5–19 years. P3 (share trajectory): under current trends the 5–19-year share will reach 16–17% by 2030 and exceed one fifth by the early 2040s; a share still below 15% in 2030—within the lower half of the 13.2–20.7% projection interval—would not falsify but would challenge the constant-trend reading, implying decelerating age convergence. P4 (inequality penalty): the Gini coefficient’s income-independent association with the EFR (×1.31 per 10 points) should attenuate only if case-management scale-up explicitly reaches the poor within countries.
Projections extrapolate the 1990–2023 estimated annual percentage change of the crude mortality rate (under 5 years −4.04%, 95% CI −4.11 to −3.97; ages 5–19 years −1.74%, −1.83 to −1.66) with Monte Carlo propagation of rate and slope uncertainty; populations are projected at 2000–2023 compound growth (0.51% and 0.48% per year).
4.8. Comparison with Previous Studies
The GBD 2023 LRI capstone analysis is all-age and pathogen-oriented, and its antimicrobial-resistance attribution—the capstone’s second axis—is likewise all-age rather than specific to pediatric age bands [1]; we do not re-estimate AMR-attributable deaths, instead quantifying the pathogen × age-band × sex structure of the 0–19-year burden and its fatality margins, which the capstone does not report. A GBD 2021-based analysis covered ages 0–14 years (no 15–19-year group) and ended in 2021, before the 2021–2023 rebound window [9]. Two further GBD 2023 works bound the novelty claim: an all-ages, risk-factor-oriented broadband analysis (preprint; 0–4, 5–14, 15–49, 50–69, and ≥70-year bands) that does not isolate the pediatric span [10], and an adolescent (10–19-year) analysis of six severe infectious causes including LRI that reports slower adolescent than late-childhood improvement—consistent with our four-band results—but no country-level, fatality-margin, or etiologic analyses [8]. Within this landscape, the present analysis extends prior work to the full 0–19 span and is, to our knowledge, the first to combine a four-band, six-measure, 204-country pediatric design with the episode-fatality analyses and the 26-fraction etiologic decomposition on GBD 2023; specifically, it provides the first quantification of the shift of LRI mortality share toward 5–19-year-olds within the complete 0–19-year frame, the first GBD-level examination of the 2021–2023 window across childhood age bands, the first ecological characterization of the national pediatric LRI episode-fatality ratio proxy against income and inequality, and the first pediatric etiologic decomposition on GBD 2023. Because each GBD round re-estimates the entire time series, we make no numeric comparisons with earlier rounds—only of coverage and pattern.
4.9. Limitations
Several limitations qualify these results. First, aggregate UIs were approximated by root-sum-of-squares pooling of half-widths under independence; because age-group draws within a location are positively correlated, pooled intervals are narrower than official joint-distribution intervals, though our key between-band contrast (−69.1% versus −39.4%) remains distinguishable and capstone anchors corroborate the pooled estimates (≤0.16%). Second, percentage-change intervals were Monte Carlo–propagated assuming symmetric normality and cross-year independence (both widening intervals), so directional conclusions are conservative. Third, the Results Tool publishes no 1-year age group; we used the official <5-year aggregate throughout, and single-year-of-age analyses were not possible. Fourth, the etiologic decomposition (Section 3.14) is a model-based, population-attributable-fraction partitioning that assigns each death to a single fraction and publishes deaths only, so no pathogen-level incidence or episode-fatality analysis was possible, and no risk-factor attribution was performed. Fifth, garbage-code redistribution (including unspecified pneumonia) and heavier covariate-based extrapolation in data-sparse regions may leave residual misclassification, as illustrated by the Uzbekistan anomaly. Sixth, population denominators were back-calculated from rounded Number/Rate pairs. Seventh, count-based age-band contrasts are sensitive to differential population growth (+23.6% at ages 5–19 years versus +4.7% under 5 years, 1990–2023); headline contrasts are therefore stated in rate terms. Eighth, all-age age-standardized rates are whole-population background, not comparable with pediatric crude rates. Ninth, 2022–2023 estimates are partly extrapolative; pandemic-window patterns should be revisited as the next round incorporates observed data. Tenth, the 2030 extrapolation assumes constant log-linear trends and 2000–2023 population growth, an illustrative baseline, not a forecast. Eleventh, the discriminating test (Section 3.13) is ecological across 21 regional units and its tuberculosis anchor spans ages 0–19 years rather than 5–19 years specifically; adolescent HIV burden was incorporated only qualitatively [15,16]. Twelfth, the variance decomposition is a cross-sectional accounting identity on point estimates whose shares depend on the log-scale choice, and the registration-completeness sensitivity covers only the 81 countries reporting since 2010—a high-income-skewed subset in which under-ascertainment bias, if present, may be undetectable. Thirteenth, the age-tropism map splices the GBD 2021 incidence and GBD 2023 mortality interfaces (non-identical age bands; n = 14; point estimates), and its lethality axis may partly inherit the age shape of the all-pathogen envelope through the attribution model. Finally, the analyses in Section 3.10, Section 3.11, Section 3.12, Section 3.13 and Section 3.14 are ecological and model-derived, subject to the ecological fallacy and residual confounding; the episode-fatality ratio proxy is inflated where episodes are under-ascertained and, because deaths and incidence are co-modelled, cannot separate episode severity from treatment failure (a circularity applying likewise to the YLL:YLD ratio); ocean-current classes were hand-labelled. All such findings are hypothesis-generating, requiring confirmation in individual-level data.
Twelfth, the GBD 2023 etiology attribution is a mutually exclusive, exhaustive partition: each death is apportioned to a single predominant pathogen via population-attributable fractions derived from case–control detection data. Polymicrobial infections—common in immunocompromised and critically ill children—are therefore allocated to one “predominant” fraction rather than represented as co-infections, and the separate polymicrobial category present in the GBD 2021 release was removed in GBD 2023. Our pathogen spectrum should be read as the distribution of predominant causes, not the full detection spectrum; co-infection biology is outside the model’s resolution.
5. Conclusion
Using Global Burden of Disease Study 2023 estimates, this study provides, to our knowledge, the first systematic four-band assessment of the global, regional, and national lower respiratory infection burden at ages 0–19 years, 1990–2023—combining the four-band, six-measure, 204-country design with the episode-fatality analyses and the 26-fraction etiologic decomposition—validated against capstone estimates to within 0.16%. In 2023, LRI caused an estimated 711,713 deaths (95% UI 579,607–843,819) and 62.49 million DALYs in this age group, still among the largest infectious causes of child death. The headline finding is a double-margin divide in which fatality is the more unequally distributed margin: the episode-fatality ratio proxy (EFR; deaths per 1,000 incident episodes) varies 75.6-fold across countries, three times the 25.9-fold national range of incidence, carries an income-independent inequality penalty, widened from 2.6- to 7.3-fold between low- and high-SDI settings over 1990–2023, and implies 80.1% of deaths avertable (upper bound) at best-quartile fatality levels—while the two margins are positively correlated (r = 0.66), so high-burden countries are hit on both. The global EFR also rose silently by 30.4% between 2010 and 2019, a deterioration invisible to mortality-only monitoring. Progress has also been age-asymmetric: the mortality rate fell by 69.1% under 5 years but by only 39.4% at ages 5–19 years, a statistically distinguishable divergence, consistent with asymmetric intervention reach rather than adolescent-specific mechanisms, that more than doubled the school-age share of deaths (6.7% to 14.4%) and projects 16.5% by 2030 and one fifth around 2040 under current trends. Low-SDI countries concentrate 61.7% of deaths at 22 times the high-SDI rate: relative inequity is widening. Streptococcus pneumoniae still accounts for one in three deaths (32.0%, down from 47.8% in 1990) amid a diversifying residual spectrum, and the pandemic window suppressed viral far more than bacterial deaths; post-2021 patterns remain directional signals, not established trends. Actionable implications are layered. Surveillance: pediatric pneumonia frameworks (GAPPD and SDG 3.2 successors) should report ages 5–19 years separately and adopt the EFR as a monitorable case-management indicator. Clinical: diagnostic and fast-track referral pathways should target identifiable high-risk groups (HIV/tuberculosis co-infection, neurodisability-related aspiration, sickle-cell disease, immunodeficiency), without routine adolescent vaccine expansion, which current data do not support. System: case-fatality-reducing interventions (oxygen, antibiotics, referral) should be prioritized in the three regions carrying 73.3% of deaths, while surveillance tracks whether the 5–19-year plateau resolves. The predictions of Section 4.7 are stated in quantities already computable from the GBD Results Tool.
Supplementary Materials
The following supporting information can be downloaded at the website of this paper posted on Preprints.org, Supplementary Data S1 (zip archive). Unmodified raw CSV extractions from the GBD 2023 Results Tool underpinning every estimate in this study: (i) global, SDI-quintile and 21-region series for the official <5-year aggregate (1990–2023, both sexes and sex-stratified); (ii) regional and global series for the 5–9, 10–14, 15–19, <1 and 2–4-year age groups; (iii) 204-country 2023 cross-sections (<5 aggregate and fine age groups); and (iv) all-ages and age-standardized series (whole-population context). Author-derived files (0–19-year aggregates, SDI gradient, EAPC tables, pandemic-window changes, cross-validation tables, back-calculated population denominators) are at the archive root. (“Supplementary Data S1” designates this data archive (a data item, not a table); supplementary tables are therefore numbered from Table S2 onward and there is no Supplementary Table S1.) Supplementary Table S2. Complete age-band cross-tabulation for 2023 (numbers, crude rates, shares of the 0–19-year total, and 1990–2023 changes with pooled 95% uncertainty intervals), including the <1-year and 2–4-year supplementary detail and the note that these two components do not sum to the official <5-year aggregate. Supplementary Table S3. Short-window (2019–2023) EAPCs for all locations, with the methodological note that these rest on five annual points (three residual degrees of freedom), that pandemic-era non-stationarity limits the linear assumption to descriptive use, and that no trend inference is drawn from them. Supplementary Table S4. Full 1990–2023 and 2019–2023 EAPC tables for all 21 GBD regions, and all-age age-standardized EAPCs (whole-population context; not comparable with pediatric crude rates). Supplementary Table S5. Complete 204-country 2023 rankings (deaths, incidence, and crude rates at ages 0–19 years). Supplementary Table S6. Cross-validation of the four-band aggregation against official GBD 2023 capstone estimates (under-5 and 5–14-year deaths, incidence, YLDs, YLLs; all absolute differences ≤0.16%). Supplementary Table S7. National episode-fatality ratio proxy (EFR) table (Section 3.10): 2023 deaths, incident episodes, and prevalence at ages 0–19 years with 95% uncertainty intervals, EFR values and the prevalence-based variant, and country covariates (GDP per capita, Gini index, World Bank income group, urbanization, population), for the 159-country analysis set and the excluded small locations. Supplementary Table S8. Island and compact coastal subset (Section 3.12): the full 4-outcome × 14-predictor Spearman and income-adjusted partial-correlation matrix with Benjamini–Hochberg false-discovery-rate q values and per-cell n (including all negative results), the 66-country subset dataset with author-labelled adjacent ocean-current classes, and the subset definition with the 9 unmatched candidate countries. Supplementary Table S9. Income-residual analysis of the national EFR (Section 2.7.1 and Section 3.10): observed and income-expected EFR, observed-to-expected ratio, and log residual for the 156 countries with GDP-per-capita data, with the top and bottom ten outlier rankings. Supplementary Table S10. Regional divergence and tuberculosis anchor table (Section 3.13): for each of the 21 GBD regions, the 1990–2023 EAPCs of the under-5 and 5–19-year crude LRI mortality rates and their gap, alongside same-round GBD 2023 pediatric (0–19-year) tuberculosis deaths and death rate in 2023 and the 1990–2023 tuberculosis EAPC, with the Spearman correlation results. Supplementary Table S11. Extension to ages 20–24 years (Section 4.2): deaths and crude mortality rates at ages 20–24 years in 1990, 2019, 2021 and 2023, and the 1990–2023 mortality-rate EAPC, globally and for the 21 GBD regions. Supplementary Table S12. Complete 26-pathogen etiologic decomposition of LRI deaths at ages 0–19 years (Section 3.14): deaths with 95% uncertainty intervals and shares in 2023, shares in 1990, and 2019–2023 percentage changes for all 26 GBD 2023 etiologic fractions, globally. Supplementary Table S13. Variance decomposition of the cross-national log crude death rate into log incidence rate, log episode-fatality ratio proxy and their covariance (Section 3.10): variance shares with bootstrap 95% confidence intervals (10,000 resamples), the incidence–fatality correlation, national ranges of the three quantities, and outlier-exclusion variants (Uzbekistan excluded; top and bottom 2.5% of the EFR distribution trimmed). Supplementary Table S14. Death-registration-completeness sensitivity of the national EFR model (Section 2.7.1 and Section 3.10): coefficients for log GDP per capita, the Gini index and registration completeness (World Development Indicators SP.REG.DTHS.ZS) for the baseline model and the augmented model on the 81 countries reporting completeness since 2010, with the any-available-year variant and subset composition notes. Supplementary Table S15. Pathogen age-tropism map data (Section 2.7.5 and Section 3.14; Supplementary Figure S2): susceptibility-age index (SAI; GBD 2021 etiology incidence, 2021), lethality-age index (LAI; GBD 2023 etiology deaths, 2023), LAI/SAI ratio, age-tropism discordance (ATD; log–log residual), and quadrant assignment for the 14 shared pathogens, with concordance statistics (Spearman ρ = 0.916; log–log slope 0.80). Supplementary Table S-JP1. Joinpoint regression of the 0–19-year crude LRI death rate, global and by SDI quintile, 1990–2023 (grid search 0–3 joinpoints, BIC). Supplementary Table S-SII1. Slope index of inequality (SII) and concentration index (CII) of the 0–19-year LRI death rate across SDI quintiles, 1990 and 2023. Supplementary Figure S2. Pathogen age-tropism map for the 14 pathogens shared between the GBD 2021 etiology incidence interface and the GBD 2023 etiology mortality interface (provided in the main text for reviewer convenience). Supplementary Figure S1. Climatic gradients of childhood LRI mortality in 66 island and compact coastal nations (provided in the main text for reviewer convenience). Supplementary Note S1. Pre-specified incidence–prevalence divergence analysis: rationale for non-reporting (the prevalent-to-incident ratio at ages 0–19 years is a model-implied episode-duration index, globally 0.0204 in 2023 [≈7.4 days], range 0.0194–0.0222 across the 21 GBD regions, 0.0209 in 1990) with the computed ratios for all regions and years.
Funding
This work was supported by the Beijing Science and Technology Nova Program Interdisciplinary Project (20230484439) and the Beijing High-Level Public Health Technical Talents Project (2023-02-33). The funder had no role in study design, data collection and analysis, decision to publish, or preparation of the manuscript.
Authors’ Contributions
Conceptualization: SC; Data curation: DL; Formal analysis: DL; Funding acquisition: SC; Investigation: DL, SC; Methodology: DL, SC; Software: DL; Supervision: SC; Validation: DL, SC; Visualization: DL; Writing—original draft: DL; Writing—review and editing: DL, SC. All authors read and approved the final manuscript.
Ethics approval and consent to participate:
This study is a secondary analysis of de-identified, aggregate, publicly available estimates from the Global Burden of Disease (GBD) Study 2023, coordinated by the Institute for Health Metrics and Evaluation (IHME). No individual-level or identifiable data were accessed. In accordance with institutional policy for research on publicly available aggregate data, this study was exempt from institutional review board approval. No participant consent was required.
Consent for publication:
Not applicable.
Availability of data and materials:
All estimates analyzed in this study were downloaded by the authors from the GBD Results Tool (https://vizhub.healthdata.org/gbd-results/), GBD 2023 round, using fully specified, reproducible queries (cause: lower respiratory infections; measures: deaths, DALYs, YLDs, YLLs, incidence, prevalence; number and rate with 95% uncertainty intervals). The unmodified raw CSV extractions, together with the author-aggregated derived datasets (0–19-year totals, SDI and regional stratifications, EAPC tables, pandemic-window changes, and cross-validation against official capstone estimates), are provided as Supplementary Data S1. Python analysis code is available from the corresponding author on reasonable request.
Acknowledgments
We thank the Institute for Health Metrics and Evaluation (IHME), University of Washington, for making the GBD 2023 estimates publicly available through the GBD Results Tool, and the Global Burden of Disease Collaborator Network, whose primary data collection and modeling underpin all estimates analyzed here.
Competing interests:
The authors declare no competing interests.
GATHER statement:
This study adheres to the Guidelines for Accurate and Transparent Health Estimates Reporting (GATHER); the completed checklist is provided as Supplementary Material.
GATHER checklist:
Provided as Supplementary Material.
Data availability:
All estimates are publicly accessible through the GBD Results Tool (https://vizhub.healthdata.org/gbd-results); author-aggregated datasets and analysis code are available in the Supplementary Materials / from the corresponding author on reasonable request.
Ethics statement
This secondary analysis of publicly available, de-identified, aggregate estimates was exempt from institutional review board approval.
Use of artificial intelligence
AI tools were used for language polishing and code drafting.
References
- GBD 2023 Lower Respiratory Infections and Antimicrobial Resistance Collaborators. Global burden of lower respiratory infections and aetiologies, 1990–2023: a systematic analysis for the Global Burden of Disease Study 2023. Lancet Infect. Dis. 2026, 26(4), 343–361. [CrossRef] [PubMed]
- World Health Organization. Pneumonia in children [fact sheet]; World Health Organization: Geneva, 2022; Available online: https://www.who.int/news-room/fact-sheets/detail/pneumonia (accessed on 16–18 August 2026).
- GBD 2023 Causes of Death Collaborators. Global burden of 292 causes of death in 204 countries and territories and 660 subnational locations, 1990–2023: a systematic analysis for the Global Burden of Disease Study 2023. Lancet 2025, 406(10513), 1811–1872. [CrossRef] [PubMed]
- Institute for Health Metrics and Evaluation (IHME). GBD Results Tool. Seattle, WA: IHME, University of Washington. Available online: https://vizhub.healthdata.org/gbd-results (accessed on 16–18 August 2026).
- World Health Organization; United Nations Children’s Fund. Ending preventable child deaths from pneumonia and diarrhoea by 2025: the integrated Global Action Plan for Pneumonia and Diarrhoea (GAPPD); WHO/UNICEF: Geneva, 2013; Available online: https://www.who.int/publications/i/item/9789241505239.
- United Nations. Transforming our world: the 2030 Agenda for Sustainable Development (A/RES/70/1); United Nations: New York, 2015; Available online: https://sdgs.un.org/2030agenda.
- Wang, X.; Li, Y.; Mei, X.; Bushe, E.; Campbell, H.; Nair, H. Global hospital admissions and in-hospital mortality associated with all-cause and virus-specific acute lower respiratory infections in children and adolescents aged 5–19 years between 1995 and 2019: a systematic review and modelling study. BMJ Glob. Health 2021, 6(7), e006014. [Google Scholar] [CrossRef] [PubMed]
- Han, Y.J. Global mortality from severe infectious diseases among adolescents aged 10–19 years, 1990–2023: long-term trends and cause composition from the Global Burden of Disease 2023 Study. Diseases 2026, 14(3), 94. [Google Scholar] [CrossRef] [PubMed]
- Lu, W.; Guo, X.; Ren, Y.; Wang, L.; Xu, T.; Xu, Y.; et al. Time trends in the burden of non-COVID-19 lower respiratory tract infections among children aged 0 to 14 years. Front Cell Infect. Microbiol. 2025, 15, 1582159. [Google Scholar] [CrossRef] [PubMed]
- Mu, C.; Liu, F.; Lei, M.; Feng, M.; Dang, X.; Xie, L.; et al. Global, regional, and national burden of non-COVID-19 lower respiratory infections and risks. Res. Sq. [preprint] 2025. [Google Scholar] [CrossRef] [PubMed]
- World Bank. World Development Indicators and World Bank Country and Lending Groups classification; World Bank: Washington, DC, 2025; Available online: https://data.worldbank.org (accessed on 16–18 August 2026).
- GBD 2023 Demographics Collaborators. Global age-sex-specific all-cause mortality and life expectancy estimates for 204 countries and territories and 660 subnational locations, 1950–2023: a demographic analysis for the Global Burden of Disease Study 2023. Lancet 2025, 406(10513), 1731–1810. [Google Scholar] [CrossRef] [PubMed]
- Kim, H.J.; Fay, M.P.; Feuer, E.J.; Midthune, D.N. Permutation tests for joinpoint regression with applications to cancer rates. Stat. Med. 2000, 19(3), 335–351. [Google Scholar] [CrossRef]
- Stevens, G.A.; Alkema, L.; Black, R.E.; Boerma, J.T.; Collins, G.S.; Ezzati, M.; et al. Guidelines for Accurate and Transparent Health Estimates Reporting: the GATHER statement. Lancet 2016, 388(10062), e19–e23. [Google Scholar] [CrossRef] [PubMed]
- Collaborative Initiative for Paediatric HIV Education and Research (CIPHER) Global Cohort Collaboration; Slogrove, A.L.; Schomaker, M.; Davies, M.A.; et al. The epidemiology of adolescents living with perinatally acquired HIV: a cross-region global cohort analysis. PLoS Med. 2018, 15(3), e1002514. [Google Scholar] [CrossRef] [PubMed]
- GBD 2021 HIV Collaborators. Global, regional, and national burden of HIV/AIDS, 1990–2021, and forecasts to 2050, for 204 countries and territories: the Global Burden of Disease Study 2021. Lancet HIV. 2024, 11(12), e807–e822. [Google Scholar] [CrossRef] [PubMed]
- GBD 2021 Lower Respiratory Infections and Antimicrobial Resistance Collaborators. Global, regional, and national incidence and mortality burden of non-COVID-19 lower respiratory infections and aetiologies, 1990–2021: a systematic analysis from the Global Burden of Disease Study 2021. Lancet Infect. Dis. 2024, 24(9), 974–1002. [CrossRef] [PubMed]
- Mahtab, S.; Blau, D.M.; Madewell, Z.J.; Ogbuanu, I.; Ojulong, J.; Lako, S.; et al. Post-mortem investigation of deaths due to pneumonia in children aged 1–59 months in sub-Saharan Africa and South Asia from 2016 to 2022: an observational study. Lancet Child Adolesc. Health 2024, 8(3), 201–213. [Google Scholar] [CrossRef] [PubMed]
- Saha, S.K.; Schrag, S.J.; El Arifeen, S.; Mullany, L.C.; Shahidul Islam, M.; Shang, N.; et al. Causes and incidence of community-acquired serious infections among young children in south Asia (ANISA): an observational cohort study. Lancet 2018, 392(10142), 145–159. [Google Scholar] [CrossRef] [PubMed]
- Li, X.; Li, Y.; Guo, L.; et al. Tuberculosis incidence, deaths and disability-adjusted life years in children and adolescence, 1990–2021: results from the Global Burden of Disease Study 2021. PLoS ONE 2025, 20(3), e0317880. [Google Scholar] [CrossRef] [PubMed]
- Thomson, J.; Hall, M.; Ambroggio, L.; Stone, B.; Srivastava, R.; Shah, S.S.; et al. Aspiration and non-aspiration pneumonia in hospitalized children with neurologic impairment. Pediatrics 2016, 137(2), e20151612. [Google Scholar] [CrossRef] [PubMed]
- GBD 2021 Tuberculosis Collaborators. Global, regional, and national age-specific progress towards the 2020 milestones of the WHO End TB Strategy: a systematic analysis for the Global Burden of Disease Study 2021. Lancet Infect. Dis. 2024, 24(7), 698–725. [Google Scholar] [CrossRef] [PubMed]
- Duke, T.; Wandi, F.; Jonathan, M.; Matai, S.; Kaupa, M.; Saavu, M.; et al. Improved oxygen systems for childhood pneumonia: a multihospital effectiveness study in Papua New Guinea. Lancet 2008, 372(9646), 1328–1333. [Google Scholar] [CrossRef] [PubMed]
- Cohen, R.; Ashman, M.; Taha, M.K.; Varon, E.; Angoulvant, F.; Levy, C.; et al. Pediatric Infectious Disease Group (GPIP) position paper on the immune debt of the COVID-19 pandemic in childhood: how can we fill the immunity gap? Infect. Dis. Now. 2021, 51(5), 418–423. [Google Scholar] [CrossRef] [PubMed]
- Naghavi, M.; Makela, S.; Foreman, K.; O’Brien, J.; Pourmalek, F.; Lozano, R. Algorithms for enhancing public health utility of national causes-of-death data. Popul Health Metr. 2010, 8, 9. [Google Scholar] [CrossRef] [PubMed]
- World Health Organization. Global antimicrobial resistance and use surveillance system (GLASS) report; World Health Organization: Geneva, 2022; Available online: https://www.who.int/initiatives/glass (accessed on August 2026).
Figure 1.
Global burden of lower respiratory infections in children and adolescents aged 0–19 years, 1990–2023. (a) Global deaths (number, left axis; crude rate per 100,000, right axis), 1990–2023; shaded bands are 95% uncertainty intervals (UIs). (b) Global incident cases (number, left axis; crude incidence rate per 100,000, right axis), 1990–2023, with 95% UIs. (c) Crude death rate per 100,000 in 1990 and 2023 by age group (<5, 5–9, 10–14, 15–19 years; log scale); error bars are 95% UIs. (d) Age–sex distribution of deaths in 2023 (number); the <5-year band uses the official GBD under-5 aggregate by sex; error bars are 95% UIs. Data: GBD 2023 Results (IHME). Notes. Ages 0–19 are defined as the official GBD under-5 aggregate plus the 5–9, 10–14, and 15–19-year groups. Aggregate 95% UIs combine subgroup uncertainty half-widths by root-sum-of-squares under an independence approximation and are therefore narrower than a joint-draw synthesis. Pandemic-window changes (2019–2021, 2021–2023) with UIs spanning zero are descriptive and are not interpreted as significant increases or rebounds.
Figure 1.
Global burden of lower respiratory infections in children and adolescents aged 0–19 years, 1990–2023. (a) Global deaths (number, left axis; crude rate per 100,000, right axis), 1990–2023; shaded bands are 95% uncertainty intervals (UIs). (b) Global incident cases (number, left axis; crude incidence rate per 100,000, right axis), 1990–2023, with 95% UIs. (c) Crude death rate per 100,000 in 1990 and 2023 by age group (<5, 5–9, 10–14, 15–19 years; log scale); error bars are 95% UIs. (d) Age–sex distribution of deaths in 2023 (number); the <5-year band uses the official GBD under-5 aggregate by sex; error bars are 95% UIs. Data: GBD 2023 Results (IHME). Notes. Ages 0–19 are defined as the official GBD under-5 aggregate plus the 5–9, 10–14, and 15–19-year groups. Aggregate 95% UIs combine subgroup uncertainty half-widths by root-sum-of-squares under an independence approximation and are therefore narrower than a joint-draw synthesis. Pandemic-window changes (2019–2021, 2021–2023) with UIs spanning zero are descriptive and are not interpreted as significant increases or rebounds.
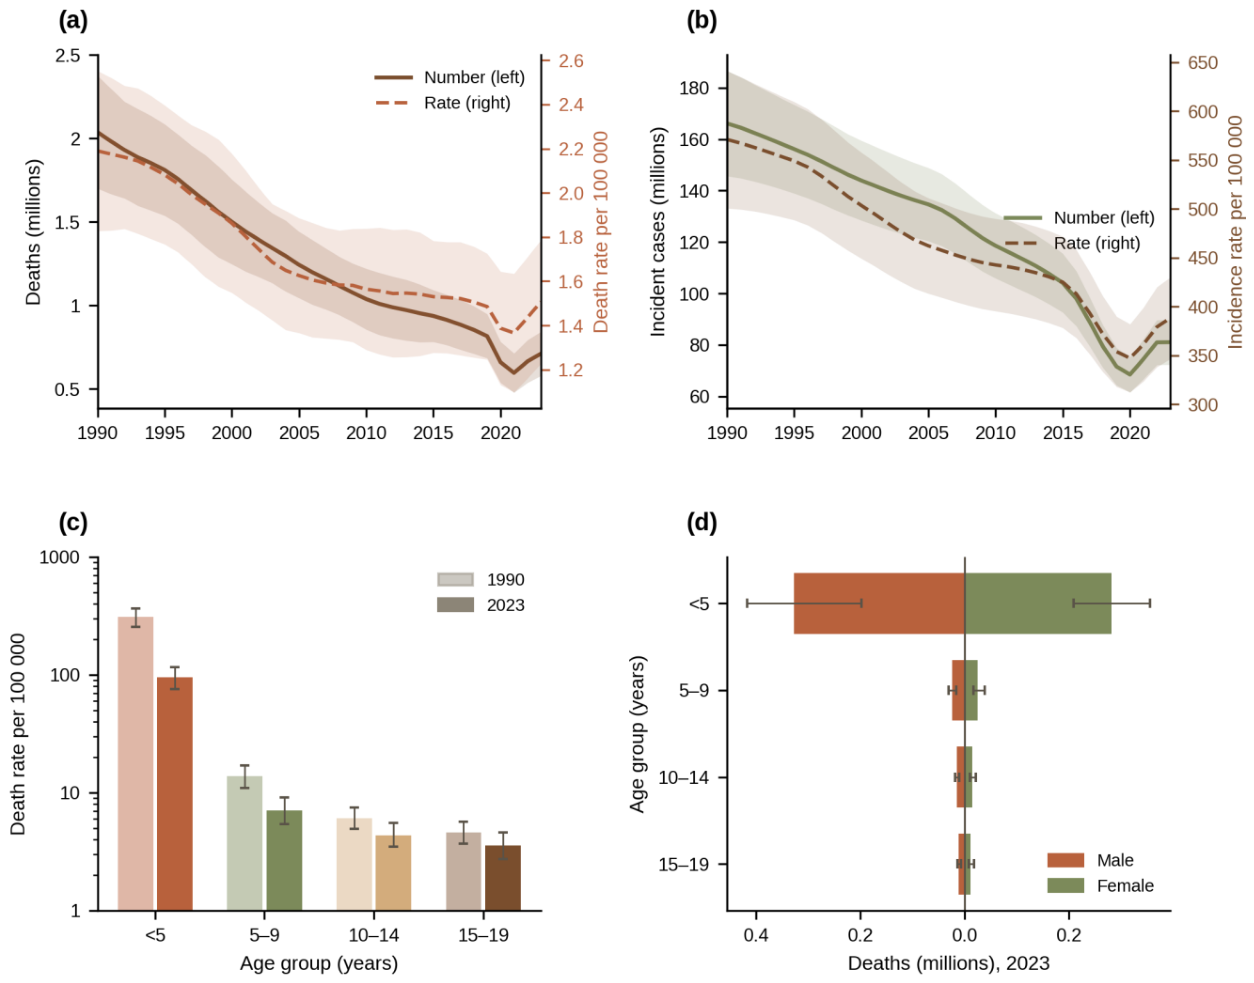
Figure 2.
Trend diagnostics for lower respiratory infection deaths among ages 0–19 years. (a) Deaths indexed to 2019 (=100) by age group, 2015–2023; the shaded window marks 2020–2021. (b) Percentage change in deaths during 2019–2021 versus 2021–2023 by age group; whiskers are 95% uncertainty intervals, several of which span zero. (c) Estimated annual percentage change (EAPC) in the crude death rate, 1990–2023, across the 21 GBD regions; whiskers are 95% confidence intervals from the regression standard error (Section 2.5.1), not GBD uncertainty intervals; the dashed line marks the global estimate (−3.89% per year). (d) Change in the number of deaths 1990–2023 for ages <5 (−67.7%) versus 5–19 years (−25.3% in counts; rate-based changes −69.1% versus −39.4%, Section 3.2) (left; whiskers are 95% UIs), and the share of ages 5–19 in all 0–19 deaths, 1990 (6.7%) versus 2023 (14.4%) (right). Data: GBD 2023 Results (IHME).
Figure 2.
Trend diagnostics for lower respiratory infection deaths among ages 0–19 years. (a) Deaths indexed to 2019 (=100) by age group, 2015–2023; the shaded window marks 2020–2021. (b) Percentage change in deaths during 2019–2021 versus 2021–2023 by age group; whiskers are 95% uncertainty intervals, several of which span zero. (c) Estimated annual percentage change (EAPC) in the crude death rate, 1990–2023, across the 21 GBD regions; whiskers are 95% confidence intervals from the regression standard error (Section 2.5.1), not GBD uncertainty intervals; the dashed line marks the global estimate (−3.89% per year). (d) Change in the number of deaths 1990–2023 for ages <5 (−67.7%) versus 5–19 years (−25.3% in counts; rate-based changes −69.1% versus −39.4%, Section 3.2) (left; whiskers are 95% UIs), and the share of ages 5–19 in all 0–19 deaths, 1990 (6.7%) versus 2023 (14.4%) (right). Data: GBD 2023 Results (IHME).
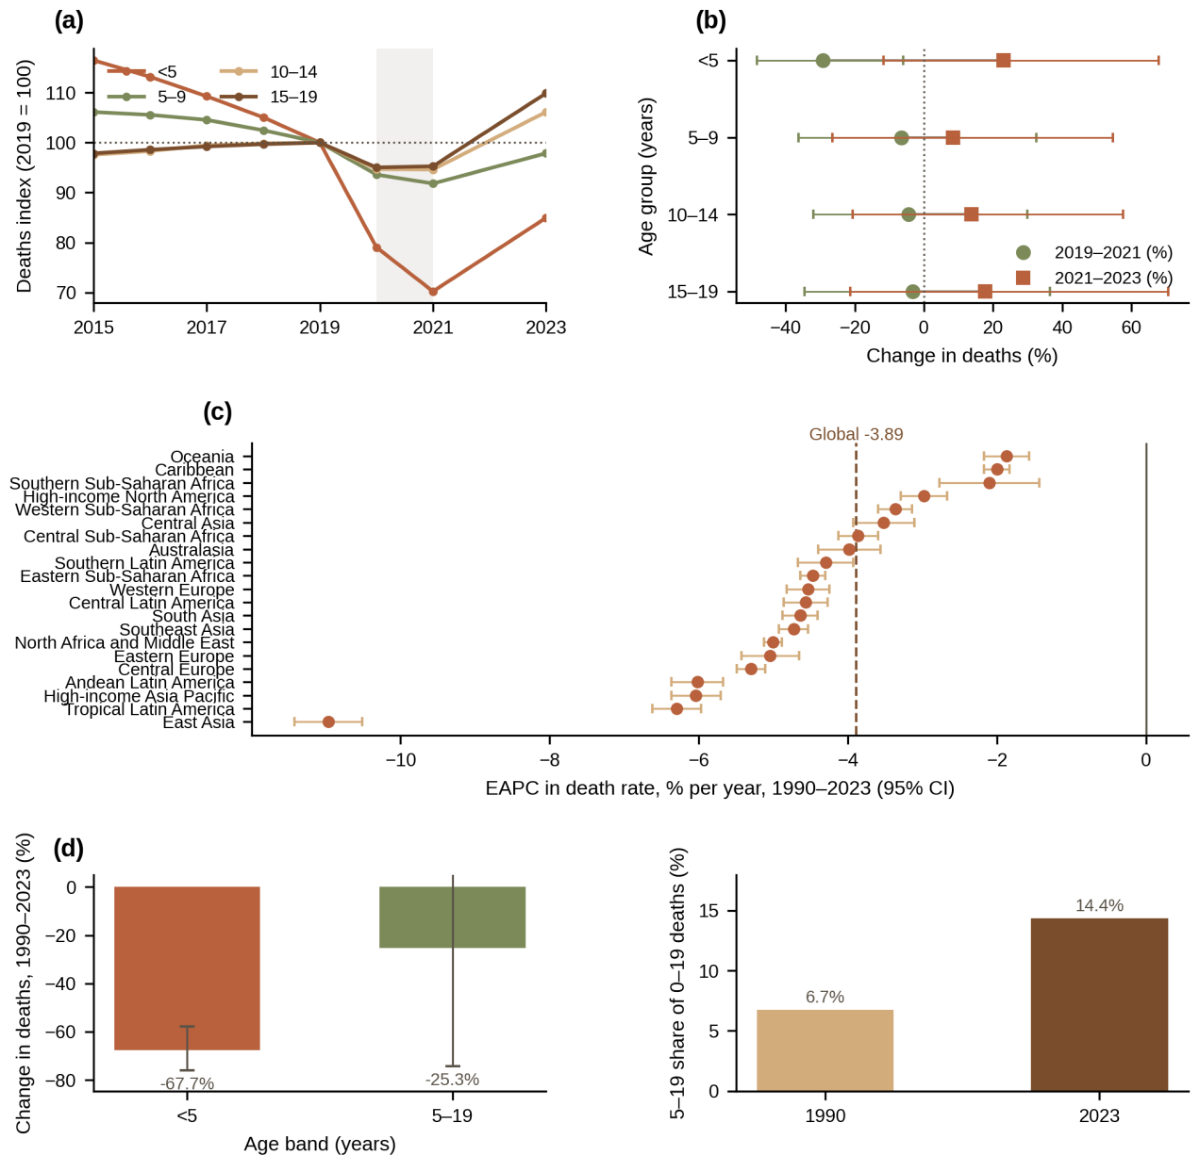
Figure 3.
Socio-demographic Index (SDI) gradient and regional distribution of deaths from lower respiratory infections among ages 0–19 years. (a) Crude death rate per 100,000 by SDI quintile, 1990–2023; shaded bands are 95% UIs. (b) Share of global 0–19 deaths in 2023 by SDI quintile (Low SDI 61.7%). (c) Crude death rate per 100,000 in 2023 across the 21 GBD regions, sorted; error bars are 95% UIs. Data: GBD 2023 Results (IHME).
Figure 3.
Socio-demographic Index (SDI) gradient and regional distribution of deaths from lower respiratory infections among ages 0–19 years. (a) Crude death rate per 100,000 by SDI quintile, 1990–2023; shaded bands are 95% UIs. (b) Share of global 0–19 deaths in 2023 by SDI quintile (Low SDI 61.7%). (c) Crude death rate per 100,000 in 2023 across the 21 GBD regions, sorted; error bars are 95% UIs. Data: GBD 2023 Results (IHME).
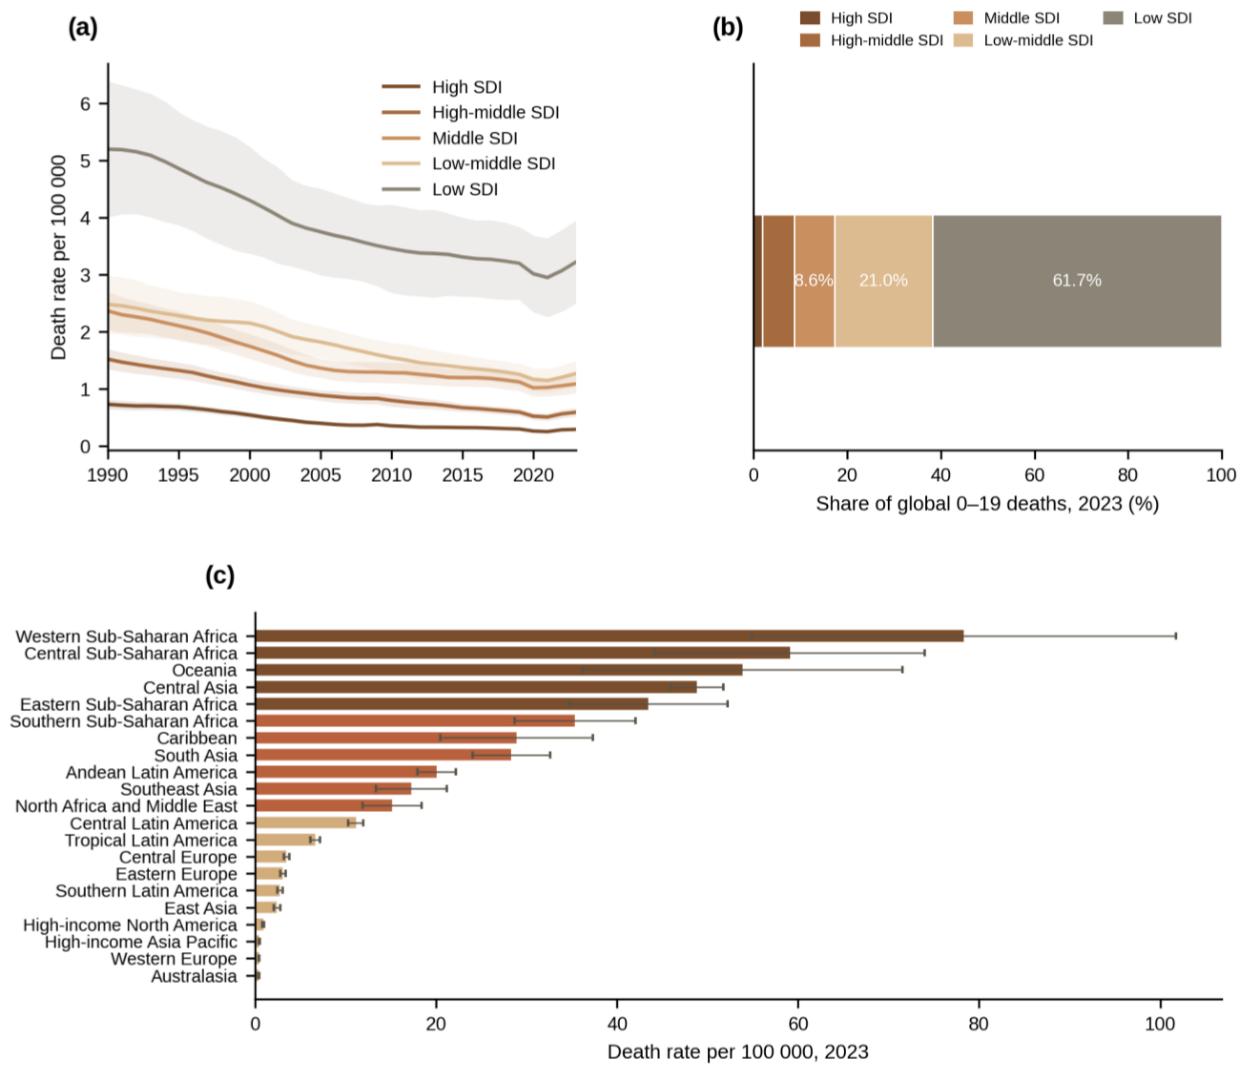
Figure 4.
Country-level deaths from lower respiratory infections among ages 0–19 years, 2023. (a) Top 15 countries by number of deaths in 2023; error bars are 95% UIs. (b) Distribution of country-level crude death rates per 100 000 across 204 countries and territories (log scale); the dashed line marks the median (9.2 per 100 000). Data: GBD 2023 Results (IHME). (c–d) National episode-fatality ratio proxy (EFR) for lower respiratory infections at ages 0–19 years, 2023 (GBD 2023). (c) The EFR (deaths per 1,000 incident episodes, ages 0–19 years, 2023) versus gross domestic product (GDP) per capita for 159 countries with at least 5,000 incident episodes (log–log scales; points colored by World Bank income group [11]; the three lowest and three highest values are labelled). (d) Distribution of the EFR (log₁₀ scale) by within-subset Gini quartile among middle-income countries (GDP per capita $2,000–15,000; n = 69); boxes show median and interquartile range, whiskers the range excluding outliers, and points individual countries. The EFR is an ecological ratio of modelled GBD quantities, not a clinical case-fatality risk. Data: GBD 2023 Results (IHME) [3,4]. (e–f) Pathogen-attributed deaths from lower respiratory infections at ages 0–19 years, 1990–2023 (GBD 2023 etiology attribution). (e) Stacked numbers of deaths (thousands) in 1990, 2019, 2021 and 2023, colored by pathogen (the ten leading pathogens of 2023 shown individually; the remaining 16 combined). (f) Corresponding percentage composition of deaths. The 26 etiologic fractions are mutually exclusive and exhaustive, summing to the all-pathogen 0–19-year LRI envelope; the etiology interface publishes deaths only. Data: GBD 2023 Results (IHME).
Figure 4.
Country-level deaths from lower respiratory infections among ages 0–19 years, 2023. (a) Top 15 countries by number of deaths in 2023; error bars are 95% UIs. (b) Distribution of country-level crude death rates per 100 000 across 204 countries and territories (log scale); the dashed line marks the median (9.2 per 100 000). Data: GBD 2023 Results (IHME). (c–d) National episode-fatality ratio proxy (EFR) for lower respiratory infections at ages 0–19 years, 2023 (GBD 2023). (c) The EFR (deaths per 1,000 incident episodes, ages 0–19 years, 2023) versus gross domestic product (GDP) per capita for 159 countries with at least 5,000 incident episodes (log–log scales; points colored by World Bank income group [11]; the three lowest and three highest values are labelled). (d) Distribution of the EFR (log₁₀ scale) by within-subset Gini quartile among middle-income countries (GDP per capita $2,000–15,000; n = 69); boxes show median and interquartile range, whiskers the range excluding outliers, and points individual countries. The EFR is an ecological ratio of modelled GBD quantities, not a clinical case-fatality risk. Data: GBD 2023 Results (IHME) [3,4]. (e–f) Pathogen-attributed deaths from lower respiratory infections at ages 0–19 years, 1990–2023 (GBD 2023 etiology attribution). (e) Stacked numbers of deaths (thousands) in 1990, 2019, 2021 and 2023, colored by pathogen (the ten leading pathogens of 2023 shown individually; the remaining 16 combined). (f) Corresponding percentage composition of deaths. The 26 etiologic fractions are mutually exclusive and exhaustive, summing to the all-pathogen 0–19-year LRI envelope; the etiology interface publishes deaths only. Data: GBD 2023 Results (IHME).
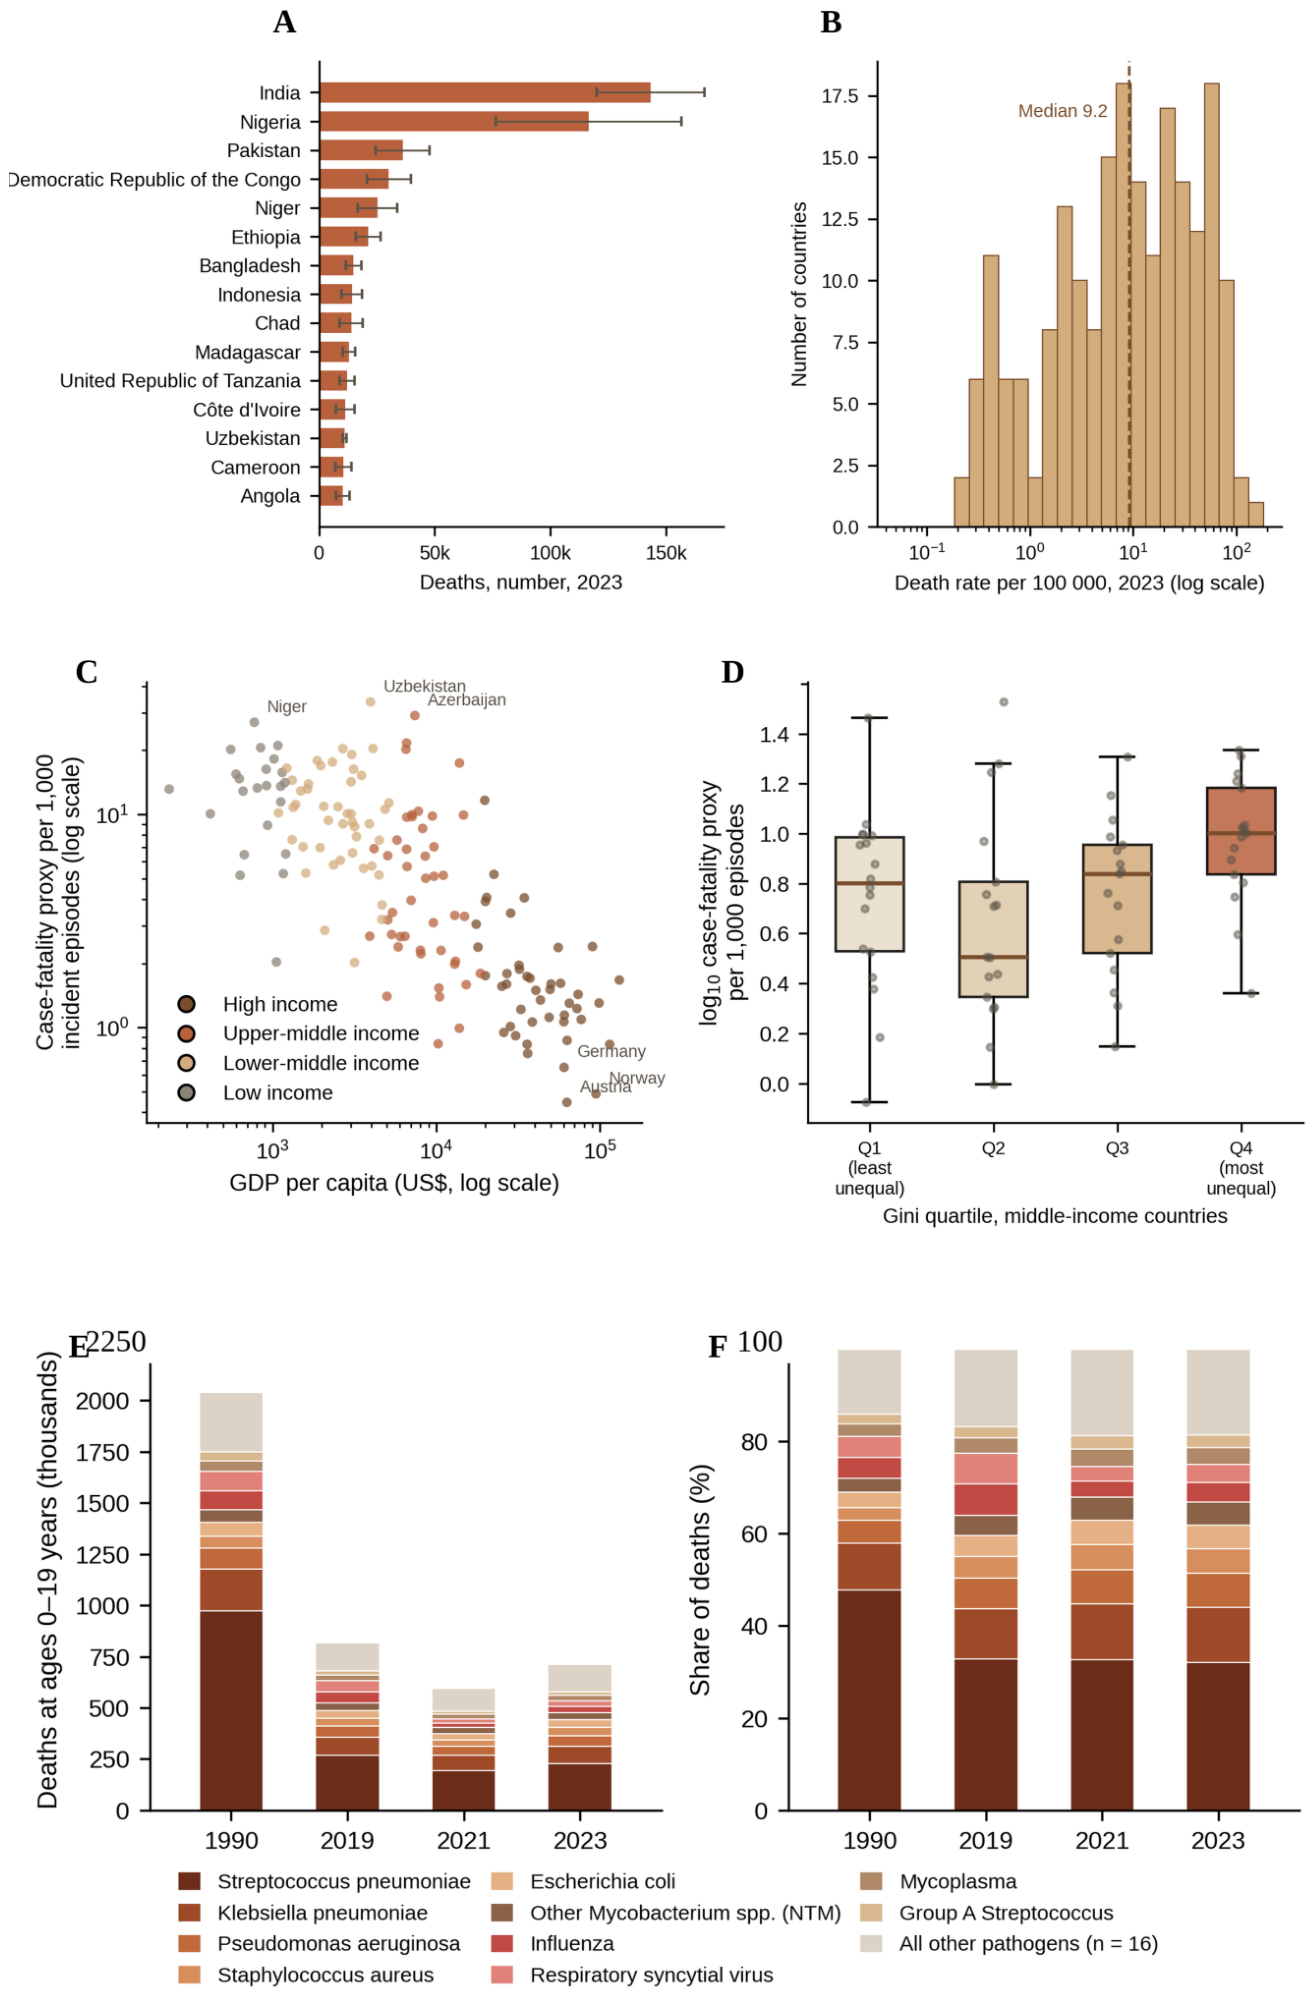

Table 1.
Global LRI burden at ages 0–19 years in 1990, 2019 and 2023: numbers with 95% uncertainty intervals (UI) and percentage change.
Table 1.
Global LRI burden at ages 0–19 years in 1990, 2019 and 2023: numbers with 95% uncertainty intervals (UI) and percentage change.
| Measure | 1990 (95% UI) | 2019 (95% UI) | 2023 (95% UI) | %Δ 1990→2023 (95% UI) | %Δ 2019→2023 (95% UI) |
| Deaths | 2,040,000 (1,700,000–2,370,000) | 817,047 (685,164–948,929) | 711,713 (579,607–843,819) | −64.8% (−73.0 to −55.4) | −12.2% (−32.3 to +11.4) |
| DALYs | 180.50M (150.60–210.39M) | 71.89M (60.22–83.56M) | 62.49M (50.74–74.24M) | −65.1% (−73.2 to −55.6) | −12.5% (−32.5 to +11.0) |
| YLDs | 213,686 (151,532–275,840) | 90,691 (68,122–113,260) | 102,429 (76,345–128,513) | −50.9% (−67.6 to −27.3) | +15.0% (−21.4 to +63.9) |
| Incidence | 166.16M (145.70–186.63M) | 71.57M (64.30–78.84M) | 81.05M (72.33–89.77M) | −51.0% (−58.5 to −42.4) | +13.6% (−2.7 to +31.6) |
| Prevalence | 3.47M (3.09–3.84M) | 1.46M (1.33–1.60M) | 1.65M (1.49–1.82M) | −52.2% (−58.9 to −44.6) | +13.2% (−1.5 to +29.4) |
| YLLs (derived) | 180.28M (150.39–210.18M) | 71.80M (60.13–83.47M) | 62.39M (50.64–74.14M) | −65.1% (−73.3 to −55.5) | −12.6% (−32.9 to +11.2) |
Data source: authors’ aggregation of official CSVs from the GBD 2023 Results Tool; 0–19-year totals are sums of the official <5-year aggregate and the 5–9, 10–14 and 15–19-year groups (both sexes). Aggregated UIs are approximated by root-sum-of-squares pooling of group half-widths under an independence assumption and are expected to be slightly narrower than official joint-distribution intervals. YLLs are derived as DALYs minus YLDs (conservative interval width). Percentage-change (%Δ) point estimates are Monte Carlo means; UIs were propagated by Monte Carlo simulation (20,000 draws; symmetric normal approximation, truncation at zero), conservative in direction. Rate UIs are converted from count UIs and do not incorporate denominator uncertainty. M, million.
Table 2.
LRI burden at ages 0–19 years by Socio-demographic Index (SDI) quintile, 2023.
| SDI quintile | Deaths 2023 (95% UI) | Mortality rate per 100,000 | Incident episodes 2023 | Incidence rate per 100,000 | Share of global deaths | Deaths %Δ 1990→2023 (95% UI) |
| High | 13,334 (12,433–14,234) | 2.36 | 8.07M | 1,428 | 1.9% | −92.6% (−93.5 to −91.5) |
| High-middle | 48,141 (42,410–53,872) | 10.36 | 10.03M | 2,159 | 6.8% | −85.8% (−88.0 to −83.3) |
| Middle | 61,525 (52,271–70,779) | 18.36 | 9.37M | 2,796 | 8.6% | −78.2% (−82.4 to −73.4) |
| Low-middle | 149,190 (123,371–175,008) | 32.71 | 17.09M | 3,747 | 21.0% | −64.9% (−73.2 to −54.6) |
| Low | 439,039 (340,315–537,764) | 51.79 | 36.43M | 4,298 | 61.7% | −44.5% (−60.3 to −24.0) |
Data source: GBD 2023 Results Tool. Counts are 0–19-year sums (both sexes; UIs pooled by root-sum-of-squares). Rates are crude. SDI quintiles are as defined by the GBD 2023 round. (the five SDI-quintile rows are the GBD 2023 SDI-quintile aggregates, which cover only countries assigned an SDI value, and therefore sum to 711,229 deaths—484 (0.07%) fewer than the global 0–19-year envelope of 711,713 reported in Table 1 and Table 3, which covers all locations. The Share-of-global-deaths column uses the global envelope (711,713) as denominator; at the one-decimal precision shown, the shares are identical under either denominator.).
Table 3.
LRI deaths and incident episodes at ages 0–19 years in the 21 GBD regions, 2023 (ranked by deaths).
Table 3.
LRI deaths and incident episodes at ages 0–19 years in the 21 GBD regions, 2023 (ranked by deaths).
| Rank | GBD region | Deaths 2023 (95% UI) | Mortality rate per 100,000 | Incident episodes 2023 | Share of global deaths |
| 1 | Western Sub-Saharan Africa | 220,627 (154,631–286,623) | 78.30 | 13.26M | 31.0% |
| 2 | South Asia | 196,859 (167,166–226,552) | 28.32 | 25.49M | 27.7% |
| 3 | Eastern Sub-Saharan Africa | 103,577 (82,676–124,479) | 43.42 | 10.55M | 14.6% |
| 4 | Central Sub-Saharan Africa | 46,827 (35,031–58,623) | 59.08 | 3.28M | 6.6% |
| 5 | Southeast Asia | 39,467 (30,515–48,419) | 17.27 | 5.91M | 5.5% |
| 6 | North Africa and Middle East | 36,098 (28,326–43,870) | 15.11 | 7.03M | 5.1% |
| 7 | Central Asia | 18,121 (17,047–19,195) | 48.83 | 820,201 | 2.5% |
| 8 | Southern Sub-Saharan Africa | 11,705 (9,489–13,922) | 35.37 | 1.44M | 1.6% |
| 9 | Central Latin America | 9,375 (8,688–10,062) | 11.14 | 709,648 | 1.3% |
| 10 | East Asia | 8,247 (7,005–9,490) | 2.40 | 7.79M | 1.2% |
| 11 | Andean Latin America | 4,569 (4,092–5,046) | 20.06 | 526,431 | 0.6% |
| 12 | Caribbean | 4,497 (3,182–5,811) | 28.88 | 328,995 | 0.6% |
| 13 | Tropical Latin America | 4,005 (3,680–4,329) | 6.65 | 1.71M | 0.6% |
| 14 | Oceania | 3,667 (2,463–4,871) | 53.87 | 288,643 | 0.5% |
| 15 | Eastern Europe | 1,307 (1,177–1,436) | 3.08 | 470,309 | 0.2% |
| 16 | Central Europe | 832 (760–903) | 3.48 | 380,228 | 0.1% |
| 17 | High-income North America | 821 (747–895) | 0.91 | 342,030 | 0.1% |
| 18 | Southern Latin America | 534 (477–591) | 2.74 | 175,431 | 0.1% |
| 19 | Western Europe | 405 (361–449) | 0.44 | 356,635 | 0.1% |
| 20 | High-income Asia Pacific | 140 (124–155) | 0.48 | 163,634 | <0.1% |
| 21 | Australasia | 33 (28–37) | 0.43 | 24,294 | <0.1% |
Data source: GBD 2023 Results Tool. Counts are 0–19-year sums (both sexes; UIs pooled by root-sum-of-squares). Rates are crude.
Table 4.
The ten countries with the largest numbers of LRI deaths at ages 0–19 years, 2023, with mortality rates.
Table 4.
The ten countries with the largest numbers of LRI deaths at ages 0–19 years, 2023, with mortality rates.
| Rank | Country | Deaths 2023 (95% UI) | Mortality rate per 100,000 | Incident episodes 2023 (95% UI) |
| 1 | India | 143,193 (119,957–166,428) | — | 15.86M (14.23–17.49M) |
| 2 | Nigeria | 116,482 (76,357–156,607) | 86.6 | 7.07M (6.31–7.83M) |
| 3 | Pakistan | 36,134 (24,428–47,841) | — | 6.82M (5.98–7.65M) |
| 4 | Democratic Republic of the Congo | 30,177 (20,605–39,750) | — | 2.27M (1.99–2.55M) |
| 5 | Niger | 25,191 (16,586–33,797) | 153.2 | — |
| 6 | Ethiopia | 21,197 (15,883–26,510) | — | 2.39M (2.14–2.63M) |
| 7 | Bangladesh | 14,891 (11,605–18,177) | — | 2.44M (2.18–2.71M) |
| 8 | Indonesia | 14,197 (9,814–18,580) | — | 2.22M (1.95–2.48M) |
| 9 | Chad | 13,920 (9,045–18,795) | 116.3 | — |
| 10 | Madagascar | 12,892 (10,208–15,575) | 80.4 | — |
Data source: GBD 2023 Results Tool. Counts are 0–19-year sums (both sexes; UIs pooled by root-sum-of-squares). Mortality rates are shown where the country also ranks in the top ten by rate; the complete 204-country dataset is in Supplementary Data S1.
Table 5.
Estimated annual percentage change (EAPC) in crude 0–19-year LRI mortality and incidence rates, 1990–2023, globally, by SDI quintile, and for the fastest- and slowest-declining GBD regions.
Table 5.
Estimated annual percentage change (EAPC) in crude 0–19-year LRI mortality and incidence rates, 1990–2023, globally, by SDI quintile, and for the fastest- and slowest-declining GBD regions.
| Location | Mortality-rate EAPC, %/yr (95% CI) | Incidence-rate EAPC, %/yr (95% CI) |
| Global | −3.89 (−4.06 to −3.71) | −2.99 (−3.29 to −2.70) |
| High SDI | −7.68 (−7.91 to −7.44) | −3.43 (−3.70 to −3.16) |
| High-middle SDI | −5.86 (−6.12 to −5.60) | −3.80 (−4.03 to −3.58) |
| Middle SDI | −5.18 (−5.40 to −4.97) | −4.00 (−4.32 to −3.68) |
| Low-middle SDI | −4.20 (−4.40 to −4.00) | −2.97 (−3.36 to −2.58) |
| Low SDI | −4.08 (−4.26 to −3.90) | −3.09 (−3.47 to −2.71) |
| East Asia | −10.81 (−11.27 to −10.36) | −4.13 (−4.48 to −3.78) |
| Tropical Latin America | −6.32 (−6.66 to −5.99) | −6.80 (−7.18 to −6.42) |
| Andean Latin America | −6.09 (−6.45 to −5.73) | −4.11 (−4.46 to −3.77) |
| High-income Asia Pacific | −6.06 (−6.41 to −5.71) | −2.44 (−2.72 to −2.15) |
| North Africa and Middle East | −5.19 (−5.32 to −5.06) | −3.16 (−3.44 to −2.88) |
| South Asia | −4.69 (−4.92 to −4.45) | −3.00 (−3.47 to −2.53) |
| Western Sub-Saharan Africa | −3.44 (−3.68 to −3.20) | −2.44 (−2.81 to −2.08) |
| Caribbean | −2.04 (−2.21 to −1.87) | −2.73 (−3.04 to −2.41) |
| Southern Sub-Saharan Africa | −2.04 (−2.69 to −1.39) | −1.62 (−1.93 to −1.31) |
| Oceania | −1.86 (−2.17 to −1.55) | −1.83 (−2.09 to −1.56) |
Data source: GBD 2023 Results Tool. EAPCs derive from log-linear regression of the crude 0–19-year rate on year (1990–2023); 95% CIs come from the ordinary least-squares standard error of the slope (t distribution) and reflect regression precision only. All-age age-standardized EAPCs (whole-population context, not comparable) and short-window 2019–2023 EAPCs (directional only) are in the supplementary archive.
Table 6.
Observed 2023 and trend-extrapolated 2030 pediatric LRI mortality, by age segment (GBD 2023).
Table 6.
Observed 2023 and trend-extrapolated 2030 pediatric LRI mortality, by age segment (GBD 2023).
| Quantity | 2023 observed (95% UI) | 2030 projected (95% UI) |
| Deaths under 5 years | 609,540 (478,375–740,704) | 472,900 (371,100–576,000) |
| Crude mortality rate under 5 years, per 100,000 | 94.79 (74.30–115.28) | 71.0 (55.7–86.5) |
| Deaths at ages 5–19 years | 102,173 (86,430–117,916) | 93,400 (79,000–107,900) |
| Crude mortality rate at ages 5–19 years, per 100,000 | 5.04 (4.26–5.82) | 4.46 (3.77–5.15) |
| Share of 0–19-year deaths at ages 5–19 years | 14.4% | 16.5% (13.2–20.7) |
Disclaimer/Publisher’s Note: The statements, opinions and data contained in all publications are solely those of the individual author(s) and contributor(s) and not of MDPI and/or the editor(s). MDPI and/or the editor(s) disclaim responsibility for any injury to people or property resulting from any ideas, methods, instructions or products referred to in the content. |
© 2026 by the authors. Licensee MDPI, Basel, Switzerland. This article is an open access article distributed under the terms and conditions of the Creative Commons Attribution (CC BY) license (http://creativecommons.org/licenses/by/4.0/).
Copyright: This open access article is published under a Creative Commons CC BY 4.0 license, which permit the free download, distribution, and reuse, provided that the author and preprint are cited in any reuse.