

Submitted:
27 October 2026
Posted:
28 October 2026
You are already at the latest version
Abstract
Background: Asthma accounts for the great majority of the chronic respiratory disease burden below 25 years of age, yet pediatric analyses based on the Global Burden of Disease (GBD) 2021 round terminate in 2021, predating the full COVID-19 period. We estimated the global, regional, and national burden of asthma among individuals aged 0–24 years from 1990 to 2023. Methods: We extracted estimates from the GBD Results Tool, GBD Study 2023 (data downloaded 13–15 August 2026), and aggregated six measures (prevalence, incidence, deaths, disability-adjusted life-years [DALYs], years lived with disability, and years of life lost) across the 0–24-year age range—using the official under-5-years aggregate row (which includes the 1-year age group, for which no single-year estimates are published) plus the 5–9, 10–14, 15–19, and 20–24-year bands—for 204 countries and territories, 21 GBD regions, and five Socio-demographic Index (SDI) quintiles, with 95% uncertainty intervals (UIs). Trends were quantified as estimated annual percentage changes (EAPCs) for 1990–2023 and the 2019–2023 pandemic window. Results: In 2023, an estimated 150,837,112 (95% UI 103,730,853–218,576,263) individuals aged 0–24 years were living with asthma, with 22,126 (15,409–32,090) deaths and 7,753,206 (5,069,966–11,580,326) DALYs. Between 1990 and 2023, prevalent cases rose by 23.1% while the all-population age-standardized prevalence rate (ASPR) was stable (EAPC +0.01, 95% confidence interval −0.04 to +0.05) and the all-population age-standardized mortality rate (ASMR) declined (EAPC −1.56). During 2019–2023, the all-population ASPR increased significantly (EAPC +1.07, +0.63 to +1.52) and deaths increased by 3.78% in absolute counts (point estimate). Low-SDI countries concentrated 55.3% of asthma deaths at these ages, with an all-population ASMR 13.6 times that of high-SDI countries. The male-to-female ratio of deaths converged from 1.758 in 1990 to near parity (1.017) in 2023, with sex-specific UIs overlapping throughout. Ten countries accounted for 46.3% of global cases, led by the United States (12.90 million). Conclusions: Case numbers continue to grow while the all-population age-standardized prevalence rate remains flat, and mortality remains concentrated where health systems are weakest. Priorities include reliable inhaled-corticosteroid access in low-SDI settings, surveillance of adolescent girls and young women, and protection of chronic respiratory care continuity in pandemic preparedness.
Keywords:
asthma
; global burden of disease
; children and adolescents
; prevalence
; mortality
1. Introduction
1.1. Background and Motivation
1.1.1. Chronic Respiratory Diseases as Leading Non-Communicable Causes of Mortality and Morbidity
Chronic respiratory diseases (CRDs)—encompassing asthma, chronic obstructive pulmonary disease (COPD), pneumoconioses, interstitial lung disease (ILD) and pulmonary sarcoidosis, and other chronic respiratory conditions—constitute one of the largest contributors to the global non-communicable disease burden [1,14]. According to the Global Burden of Disease (GBD) Study 2023, an estimated 569.2 million people worldwide were living with a CRD in 2023, and CRDs accounted for approximately 4.2 million deaths in that year [1]. Asthma alone affected an estimated 362.7 million individuals of all ages and caused 441.9 thousand deaths in 2023 [1,11]. Although all-age CRD mortality declined by 25.7% between 1990 and 2023, CRDs remain a leading cause of preventable death and disability, with the burden concentrated disproportionately in low-income and middle-income countries [1,14,24].
1.1.2. The Fundamentally Distinct Pediatric CRD Profile
The epidemiological profile of CRDs in children, adolescents, and young adults differs fundamentally from that of older populations. Below the age of 25 years, asthma accounts for the overwhelming majority of CRD prevalence, mortality, and disability, whereas COPD, pneumoconioses, ILD, and pulmonary sarcoidosis are exceedingly rare [1,3,21]. Our aggregation of GBD 2023 estimates indicates that 150.8 million (95% uncertainty interval [UI] 103.7–218.6 million) individuals aged 0–24 years were living with asthma in 2023, with 22,126 deaths and 7.75 million disability-adjusted life-years (DALYs) [11,25]. Childhood-onset asthma is not a transient condition: persistent childhood asthma is associated with impaired lung-function growth and early decline, potentially altering respiratory trajectories across the life course [20], and its epidemiology is shaped by sex- and hormone-related factors that shift between childhood and adolescence [21,22]. Quantifying the pediatric CRD burden therefore requires an analytic frame distinct from adult-oriented approaches [3,21].
1.2. Research Gap
1.2.1. Predominance of Adult-Oriented CRD Analyses
Despite the scale of the pediatric burden, the CRD literature remains dominated by analyses oriented toward all-age or adult populations. The GBD 2017 CRD capstone and the more recent GBD 2023 global and Asia-focused analyses primarily characterized the CRD spectrum as it manifests in adulthood, where COPD predominates and smoking-related and occupational exposures drive attributable burden [1,6,14]. Consequently, age-disaggregated evidence on the distribution, trends, and determinants of CRDs among individuals younger than 25 years remains fragmented [1,3,14]. This imbalance limits the capacity of health systems to design age-appropriate prevention and management strategies, particularly in low-Socio-demographic Index (SDI) settings where pediatric respiratory mortality remains elevated [3,24].
1.2.2. What the Most Recent Pediatric Literature Does Not Provide
The available pediatric analyses are constrained by three specific limitations. First, dedicated pediatric asthma studies—the GBD 2021-based assessment by Chen et al. [3] and the forecasted modeling study by Kim et al. [4]—terminate in 2021, predating the complete COVID-19 pandemic period. Second, the GBD 2023 round re-ran its models with updated inputs and recalibrated estimates—substantially enough that its 2021 asthma prevalence estimate for ages 0–24 years (149.7 million) exceeds the GBD 2021 estimate (126.2 million) by approximately 18.7%—yet neither the GBD 2023 global capstone [1] nor its Asia-focused companion [6] disaggregates the 0–24-year population, and the corrected pandemic-era findings [1,2] remain unexamined at pediatric ages. Third, the official asthma capstone [13] and the GBD 2023 analysis of childhood asthma attributable to nitrogen dioxide (NO2) [5] each address a single condition or risk factor, without integrating the full burden spectrum, trend decomposition, and pandemic-period dynamics for this age group. No published study has provided a dedicated 0–24-year analysis built directly from GBD 2023 raw extractions and extended through 2023, thereby capturing the full COVID-19 period.
1.3. Objectives and Contributions
This study provides comprehensive estimates of the asthma burden among individuals aged 0–24 years from 1990 to 2023. All estimates were computed by the authors directly from raw data downloaded from the official GBD 2023 Results tool [25], aggregated from the official under-5-years aggregate row plus the four five-year age bands spanning 5–24 years, and cross-validated against published all-ages GBD 2023 values, with agreement to within 0.01% [11]. Four contributions follow.
First, we present the first full-spectrum analysis of asthma burden among individuals aged 0–24 years derived by direct aggregation of official GBD 2023 raw data, covering six measures (prevalence, incidence, deaths, DALYs, years lived with disability, and years of life lost) over 1990–2023 at global, SDI-quintile, 21 GBD region, and 204-country levels, with sex and age stratification [11,25]. Because the underlying extraction is new, the pediatric series is extended through 2023 for the first time, and the divergence between GBD 2021- and GBD 2023-based pediatric estimates is quantified and reconciled [3,11].
Second, we quantify COVID-19-era dynamics in a 2019–2023 sub-period analysis: the all-population age-standardized prevalence rate, essentially flat over 1990–2023 (estimated annual percentage change [EAPC] +0.01%), rose significantly during 2019–2023 (EAPC +1.07, 95% CI +0.63 to +1.52), while the long-standing decline in pediatric asthma deaths stalled, deaths increasing by 3.78% in absolute counts (point estimate) between 2019 and 2023—patterns that extend to pediatric ages the corrected GBD 2023 conclusion that pandemic-era mortality declines were less pronounced than initially reported [1,2].
Third, we report previously undocumented patterns, including the convergence of the male-to-female ratio of asthma deaths at ages 0–24 years—from 1.758 in 1990 to near parity (1.017; sex-specific uncertainty intervals overlap throughout) in 2023—and divergent SDI-quintile trajectories in which prevalent cases in low-SDI settings increased by 137.7% between 1990 and 2023 [21,22].
Fourth, the entire analytic pipeline is traceable at the raw-data and code level: every reported figure is computed from named official GBD 2023 CSV extracts, and the derived datasets and aggregation scripts are provided in the Supplementary Materials to permit independent verification and reuse [25].
The closest prior analyses—the GBD 2021-based pediatric assessment of Chen et al., which projects to 2040 but terminates in 2021 [3], and the official GBD 2021 asthma and atopic dermatitis capstone, whose 2050 projections are all-ages [13]—cannot capture the post-pandemic rebound of 2022–2023. This study updates all estimates to GBD 2023 and adds analyses of that rebound, the sex-ratio convergence in asthma deaths, and national case concentration as an equity dimension. Together, these contributions deliver an integrated, pandemic-aware, and fully reproducible assessment of the global pediatric CRD burden, intended to inform age-specific respiratory health policy and resource allocation worldwide. We present this article in accordance with the GATHER (Guidelines for Accurate and Transparent Health Estimates Reporting) reporting checklist.
2. Methods
2.1. Study Design and Data Sources
2.1.1. GBD 2023 Analytical Framework
This study is a secondary analysis of the Global Burden of Disease (GBD) Study 2023 (estimation years 1990–2023), coordinated by the Institute for Health Metrics and Evaluation (IHME) [11,12]. GBD 2023 estimates disease and injury burden for 204 countries and territories, aggregated into 21 GBD regions and grouped by quintile of the Socio-demographic Index (SDI; lag-distributed income per capita, mean educational attainment, and total fertility rate among women younger than 25 years) [11]; SDI quintiles are those provided by the GBD Results Tool for this round, and membership is round-specific. Nonfatal outcomes are modeled with DisMod-MR 2.1, a Bayesian meta-regression enforcing consistency among incidence, prevalence, remission, and mortality [11], and causes of death with the Cause of Death Ensemble model (CODEm) [12]. GBD 2023 estimates are based on 250 posterior draws; 95% uncertainty intervals (UIs) are the 2.5th and 97.5th draw percentiles, and age-standardized rates use the direct method against the GBD world population standard [11].
2.1.2. Direct Download and Author Aggregation of Estimates for Ages 0–24 Years
All pediatric estimates were derived from raw data downloaded by the authors directly from the GBD Results Tool, GBD Study 2023 [25], on 13–15 August 2026, using registered institutional IHME accounts. The extraction covered the fine age groups spanning 0–24 years plus official aggregate rows (including the “<5 years” aggregate); both sexes combined, male, and female; deaths, disability-adjusted life-years (DALYs), years lived with disability (YLDs), years of life lost (YLLs), prevalence, and incidence; number and rate per 100,000 with 95% UIs; 231 locations (global, five SDI quintiles, 21 GBD regions, 204 countries and territories); and all years 1990–2023. No estimate was transcribed from any previously published article. The GBD 2023 Results Tool does not publish single-year age groups—in particular, no “1 year” band exists—so the 0–24-year series was aggregated by the authors as the official “<5 years” aggregate row (which includes the 1-year age group) plus the 5–9, 10–14, 15–19, and 20–24-year bands.
Because the tool provides no 0–24-year aggregate, 0–24-year counts were computed as the sum of the official <5-years aggregate and the four five-year age bands, and 95% UIs approximated by summing the age-group-specific lower and upper bounds. This ignores correlation among age-group posterior draws and is expected to be conservative (wider than a draw-level aggregation); all 0–24-year UIs are reported under this approximation, and percentage changes in counts are reported as point estimates without propagated UIs.
2.1.3. Complementary Published Sources and Comparison with Previous GBD Rounds
Three published GBD 2023 analyses provide complementary context: the all-ages chronic respiratory disease (CRD) analysis of Oh et al. [1], interpreted per the corrected pandemic mortality-trend wording of its Author Correction [2]; the capstone all-ages asthma YLDs, deaths, and YLLs [11,12]; and the nitrogen dioxide (NO2)-attributable childhood asthma analysis [5]. Earlier rounds serve only as historical literature: previous 0–24-year analyses used GBD 2021 [3,4,7,8,13]. Because each round re-runs DisMod-MR and CODEm with new data sources and updated population denominators, estimates are not directly comparable across rounds—for calendar year 2021, GBD 2023 yields 149,728,659 prevalent cases aged 0–24 years, 18.7% above the GBD 2021-based published value (126,179,865) [3]; no GBD 2021 estimate enters any table, figure, or trend reported here.
2.2. Case Definitions and Disease Spectrum
2.2.1. Asthma and Other Chronic Respiratory Diseases
Asthma was defined per the GBD cause hierarchy as a physician diagnosis of asthma with wheezing in the past year (ICD-10 codes J45–J46) [11,13]. The broader CRD spectrum was contextualized with GBD 2023 all-ages analyses of chronic obstructive pulmonary disease, pneumoconiosis, and interstitial lung disease and pulmonary sarcoidosis [1,11]; these level-3 causes are mutually exclusive and collectively exhaustive within CRDs, so burdens can be summed without double counting [1,11].
2.3. Metrics and Measures
2.3.1. Measures and Rate Definitions
DALYs equal YLLs (cause-specific deaths multiplied by the standard life expectancy remaining at the age of death) plus YLDs (sequela-level prevalence multiplied by disability weights, adjusted for comorbidity) [11,12]. Each measure is reported as a number and a rate per 100,000, with 95% UIs.
Because no 0–24-year age-standardized rate exists in GBD output, three rate definitions are used and stated at each table. First, official age-specific rates for the five contributing age bands (<5, 5–9, 10–14, 15–19, and 20–24 years) are the primary basis of pediatric rate comparisons and trends. Second, 0–24-year crude rates were computed by the authors, with denominators back-calculated from the official number and rate rows (population = number ÷ rate × 100,000); these are sensitive to age-structure shifts within the 0–24-year range. Third, official “Age-standardized” aggregate rows are standardized across the full age range and characterize the whole population, not the 0–24-year subgroup; these all-population age-standardized rates are used only in the all-ages background analyses and are labeled as such.
2.4. Stratification
2.4.1. Age-Band Definitions, Sex, Geography, and Development Level
Estimates were stratified by age band, sex, SDI quintile, the 21 GBD regions, and the 204 countries and territories [11]. Three conventions require clarification. First, the GBD does not model asthma in infants under 1 year—estimates are structurally zero. Second, the GBD Results Tool does not publish single-year age groups; because no “1 year” band exists, all 0–24-year totals use the official “<5 years” aggregate row (which includes the 1-year group) plus the 5–9-, 10–14-, 15–19-, and 20–24-year bands, and age-stratified displays report the <5-years aggregate alongside the four five-year bands (the <1-year and 2–4-year detail rows are retained for reference, with the 2–4-year band excluding the 1-year group). Third, the official “<20 years” aggregate row is modeled independently and does not equal the sum of its constituent bands (2023 prevalence: 130,678,566 versus 127,111,994 for the summed 2–4- through 15–19-year bands; +2.8%). Under-20 statements use the official aggregate row; 0–24-year statements use the author-computed aggregate described above, for which no official aggregate exists.
2.5. Temporal Trend Analysis
2.5.1. Estimated Annual Percentage Change, 1990–2023
Trends were quantified using the estimated annual percentage change (EAPC) from a log-linear regression of the natural logarithm of the rate on calendar year (ln(rate) = α + β·year + ε); EAPC = 100 × (e^β − 1) [15]. The 95% confidence interval (CI) was computed from the standard error of the ordinary least-squares slope with a t-distribution (n−2 degrees of freedom); CIs reflect regression precision only, and draw-level uncertainty in the underlying rates was not propagated into EAPC CIs. A trend was classified as increasing or decreasing when both CI bounds lay above or below 0, and stable otherwise [15]. EAPCs over 1990–2023 were computed on age-specific rates (pediatric analyses) and all-population age-standardized rates (background analyses), with 0–24-year crude-rate EAPCs as sensitivity analyses; endpoint percentage changes are reported separately from EAPCs throughout.
2.5.2. COVID-19 Pandemic Window, 2019–2023
Pandemic-era patterns were assessed within GBD 2023, which extends the series through 2023 and explicitly models the COVID-19 period [11,25]; the same log-linear method was applied to the 2019–2023 window, alongside endpoint changes in 0–24-year counts and rates. Short-window EAPCs rest on five annual observations, have limited statistical power, and are exploratory; “stable” should be read as “not statistically distinguishable from no change”.
2.5.3. Illustrative Extrapolation to 2050
The 1990–2023 log-linear trend in the all-population age-standardized prevalence rate (EAPC +0.01% per year) was extended to 2050 under two simplified 0–24-year population scenarios—A, the 2023 population held constant; B, the 1990–2023 linear trend in the back-calculated 0–24-year population (approximately +16.2 million persons per year) continued—with sensitivity variants A2 and B2 substituting the crude-rate trend (+0.11% per year). Four assumptions govern interpretation. First, no external age-specific population projections (for example, UN World Population Prospects) were incorporated; scenario B likely overstates future population growth and is an upper-bound scenario. Second, multiplying an all-population standardized rate by the 0–24-year population is approximate, motivating the crude-rate variants. Third, the extrapolation assumes the 1990–2023 trend persists for 27 years, ignoring interventions, climate change, diagnostic-practice change, and cohort effects. Fourth, no prediction intervals are reported; the EAPC CI reflects historical regression precision, not structural uncertainty. These projections are illustrative extrapolations, not formal forecasts, and should not be cited as predictions; published GBD 2021 forecasting-framework projections [10,13] derive from a different round and are not directly comparable.
2.6. Risk Factor Attribution
2.6.1. Comparative Risk Assessment and NO2-Attributable Asthma
Attributable burden was framed within the GBD comparative risk assessment, which computes the population attributable fraction (PAF)—the proportional reduction in burden expected at the theoretical minimum risk exposure level—across 88 risk factors from exposure distributions, relative risks, and theoretical minima [9,11]. NO2-attributable childhood asthma burden for 204 countries and territories, 1990–2023, was taken from the GBD 2023 analysis of Burkart et al. [5]: a global PAF of 4.67% and 233,000 (95% UI −250,000 to 956,000) attributable YLDs in 2023, the wide zero-crossing UI reflecting exposure–response uncertainty and reported without truncation.
2.7. Statistical Analysis, Ethics, and Data Availability
Aggregation and all derived quantities were computed in Python (version 3.11) from the downloaded CSV files; no new GBD model runs were performed. This secondary analysis of publicly available, de-identified, aggregate data was exempt from institutional review board approval. Reporting follows the Guidelines for Accurate and Transparent Health Estimates Reporting (GATHER); the completed checklist is provided as Supplementary Material. All underlying estimates are publicly accessible through the GBD Results Tool (https://vizhub.healthdata.org/gbd-results) [25]. Raw downloaded and author-aggregated CSV files are provided as Supplementary Data (zip archive), and the analysis code is available from the corresponding author on reasonable request.
3. Results
3.1. Overall Burden at Ages 0–24 Years in 2023 (Table 1; Figure 1)
As summarized in Table 1 and illustrated in Figure 1a and Figure 1b, asthma among children, adolescents, and young adults aged 0–24 years constituted a substantial component of the global disease burden in 2023. An estimated 150,837,112 (95% uncertainty interval [UI] 103,730,853–218,576,263) individuals in this age band were living with asthma worldwide in 2023, corresponding to a crude prevalence rate of 4,608.7 (95% UI 3,169.4–6,678.5) per 100,000 [11,25]. Incident cases numbered 46,439,969 (95% UI 27,085,452–74,068,215; crude rate 1,418.94 per 100,000), and prevalent cases comprised 80,020,990 (54,489,226–115,707,053) males versus 70,816,119 (49,120,273–102,426,252) females (M:F ratio 1.130) [11,25]. The ratio of incident to prevalent cases (approximately 0.31) is consistent with a chronic, relapsing condition in which the prevalent pool accumulates through repeated episodes and incomplete remission across childhood and adolescence.
Data source: authors’ aggregation of official CSVs downloaded from the GBD Results Tool (GBD 2023, version 8352; accessed August 2026) [11,25]; extraction files are provided in the supplementary zip archive. Numbers are sums of the official <5-years aggregate row (which includes the 1-year age group, for which the Results Tool publishes no single-year band) and the 5–9-, 10–14-, 15–19-, and 20–24-year bands (estimates are zero at <1 year); aggregated UIs are approximated by summing age-group bounds and are conservative. Crude rates use the 0–24-year population implied from official Number/Rate rows. Percentage changes are point estimates without propagated uncertainty. GBD 2023-round estimates are not directly comparable with GBD 2021-based pediatric publications [3]. DALY, disability-adjusted life-year; YLD, years lived with disability; YLL, years of life lost.
Mortality was comparatively rare relative to prevalence: 22,126 (95% UI 15,409–32,090) deaths from asthma occurred globally among individuals aged 0–24 years in 2023 (crude mortality rate 0.68, 95% UI 0.47–0.98, per 100,000) [11,25]. Total disability-adjusted life-years (DALYs) reached 7,753,206 (5,069,966–11,580,326), of which years lived with disability (YLDs; 6,038,919) accounted for approximately 78% and years of life lost (YLLs; 1,714,287) for the remainder [11,25]. The 20–24-year stratum contributed 20,158,475 prevalent cases, roughly one-seventh (13.4%) of the 0–24-year total, indicating that the burden is concentrated in childhood and adolescence proper rather than being an artifact of the extended age definition.
Two features of the estimation framework qualify all 0–24-year figures. First, the GBD does not model asthma in infants under 1 year of age; estimates in that band are structurally zero [1]. Second, because the GBD Results Tool publishes no single-year age groups (no “1 year” band exists) and no 0–24-year aggregate row, all 0–24-year counts are author-computed sums of the official <5-years aggregate (which includes the 1-year group) and the 5–9-, 10–14-, 15–19-, and 20–24-year bands, with 95% UIs approximated by summing the group-specific bounds; this approximation ignores correlation among age-group posterior draws and is expected to be conservative (wider than a draw-level aggregate) [11,25].
Table 1 quantifies the defining asymmetry of pediatric asthma and its trajectory over three decades. Prevalence and incidence operate at scales of tens of millions, whereas mortality is measured in tens of thousands; the wide UIs around prevalence and incidence—spanning approximately 115 and 47 million cases, respectively—reflect the heterogeneity of asthma case ascertainment and severity modeling across data-sparse settings [1,7]. Between 1990 and 2023, absolute counts rose for every non-fatal measure (prevalence +23.1%, incidence +23.4%, YLDs +23.1%, DALYs +9.6%), while deaths fell by 18.9% and YLLs by 21.1%; crude rates, by contrast, were essentially flat for prevalence (+3.3%) and incidence (+3.6%), indicating that growth in case numbers is predominantly demographic. The shorter 2019–2023 window previews the pandemic-era pattern examined in Section 3.7: deaths rose by 3.8% while the crude mortality rate was nearly unchanged.
3.2. Disease Composition: Dominance of Asthma Among Pediatric CRDs
Within the broader spectrum of chronic respiratory diseases (CRDs), asthma accounted for the overwhelming majority of the burden in the 0–24-year population. This composition estimate is a framework-level judgment derived by the authors from the all-age CRD composition reported in GBD 2023 [1] together with the pediatric asthma estimates in the primary dataset [11,12], rather than a directly tabulated pediatric value. Other CRDs contribute negligibly at these ages: chronic obstructive pulmonary disease is exceedingly rare in children, pneumoconioses are effectively absent, and interstitial lung disease and pulmonary sarcoidosis make minimal contributions [1]. This near-single-cause composition contrasts with adulthood, where chronic obstructive pulmonary disease and asthma jointly dominate [1].
3.3. Socioeconomic and Geographic Variation in 2023
3.3.1. Socio-Demographic Index Quintiles (Table 2)
Burden estimates stratified by Socio-demographic Index (SDI) quintile are presented in Table 2. Because the GBD aggregate rows standardize rates across the full age range, the rate columns report all-population age-standardized rates (used here for between-quintile comparison), whereas the count columns are author-aggregated 0–24-year sums. The all-population age-standardized prevalence rate (ASPR) was highest in the high-SDI quintile at 6,031.60 (95% UI 5,158.15–7,206.30) per 100,000, followed by middle-SDI (4,648.72, 3,870.71–5,595.17), high-middle-SDI (3,866.05, 3,278.86–4,572.73), low-SDI (3,604.56, 3,041.15–4,302.52), and low-middle-SDI countries (3,498.52, 2,921.33–4,168.29) [11,25]. In absolute terms, however, low-SDI countries carried the largest case load (39,161,834 prevalent cases, 95% UI 24,948,249–59,274,407), the largest death count (12,227, 7,909–18,218), and the largest DALY total (2,519,809, 1,660,103–3,715,282) [11,25].
Table 2 reveals a markedly asymmetric gradient. For prevalence, the high-SDI quintile stands apart—the all-population ASPR is 1.67 times that of the low-SDI quintile, and the pediatric (under-20) crude prevalence rate shows the same 1.68-fold ordering—whereas the remaining four quintiles form a near-plateau between 3,499 and 4,649 per 100,000. For mortality the gradient is monotonic and far steeper: the all-population age-standardized mortality rate (ASMR) rises from 1.14 per 100,000 in high-SDI to 15.56 in low-SDI countries, a 13.6-fold ratio; on the pediatric crude-rate scale the under-20 gradient is approximately nine-fold (0.12 versus 1.12 per 100,000; official under-20 rows, Table 2 footnote). The age-standardized DALY rate (ASDR) was likewise highest in the low-SDI quintile (504.34 per 100,000) and lowest in the high-SDI quintile (263.41), with opposite internal composition: low-SDI DALYs are driven by premature mortality (YLL rate 364.35 versus 27.32 per 100,000 in high-SDI countries), whereas high-SDI DALYs are dominated by disability (YLD rate 236.09 per 100,000). Temporal change compounds the divergence: between 1990 and 2023, deaths fell by 67.9% in high-SDI countries but rose by 17.0% (from 10,452 to 12,227) in low-SDI countries, where prevalent cases increased by 137.7%; low-SDI countries thus concentrated 55.3% of all asthma deaths at ages 0–24 years in 2023.
3.3.2. Regional Patterns and the Prevalence–Mortality Paradox (Table 3)
Across the 21 GBD regions (Table 3), the largest 0–24-year case loads in 2023 occurred in North Africa and the Middle East (16,456,112 cases), South Asia (15,704,819), and Eastern Sub-Saharan Africa (15,000,099). All-population ASPRs varied nearly six-fold, from Australasia (13,364.4, 95% UI 10,910.1–16,540.6 per 100,000), high-income North America (11,044.5, 9,327.4–13,130.2), Tropical Latin America (8,810.9, 7,264.5–10,813.7), the Caribbean (8,759.6, 7,252.7–10,529.7), and Western Europe (7,687.7, 6,600.2–9,187.8) at the top, to Central Asia (2,258.8, 1,830.2–2,775.4), South Asia (2,475.2, 2,062.2–2,953.3), and East Asia (3,118.7, 2,577.3–3,732.2) at the bottom [11,25]. The mortality geography was nearly orthogonal: the highest all-population ASMRs occurred in Oceania (18.13, 10.61–32.19), South Asia (15.40, 8.43–26.91), Central Sub-Saharan Africa (15.15, 7.51–25.58), Eastern Sub-Saharan Africa (14.79, 9.18–23.26), and Southeast Asia (12.58, 8.90–19.50) per 100,000, and the lowest in Eastern Europe (0.40, 0.34–0.47), high-income Asia Pacific (0.64, 0.40–1.39), and Western Europe (0.65, 0.57–0.73). In absolute terms, the largest death counts were concentrated in South Asia (5,222, 3,312–8,192), Southeast Asia (4,481, 2,970–6,406), and Western and Eastern Sub-Saharan Africa (4,715 and 3,552, respectively) [11,25].
Table 3 makes the prevalence–mortality paradox explicit at regional resolution. The five highest-prevalence regions are all high- or high-middle-income settings with ASMRs at or below 3.31 per 100,000, whereas the five highest-mortality regions span Oceania, South Asia, Southeast Asia, and Sub-Saharan Africa, where ASPRs are middling or low; Australasia, the highest-prevalence region, records an ASMR of only 1.04 per 100,000, roughly one-eighteenth that of Oceania, the highest-mortality region. The regional ASDR ranking is correspondingly dominated by high-mortality settings (Oceania 660.6, Central Sub-Saharan Africa 580.8 per 100,000), in which the DALY total is driven by years of life lost rather than disability. The pattern is consistent with the interpretation that ascertainment, diagnostic capacity, and effective long-term control therapy—rather than underlying disease susceptibility alone—drive much of the observed geographic variation in fatal outcomes [1,24].
3.3.3. National Concentration of Cases (Figure 2a–b; Table 4)
The national distribution of prevalent cases was highly concentrated (Figure 2a; Table 4). The ten countries with the largest case counts in 2023—the United States of America, China, India, Brazil, Nigeria, Indonesia, the Democratic Republic of the Congo, Pakistan, the Philippines, and Mexico—together accounted for 69,902,707 prevalent cases, equivalent to 46.3% of the global 0–24-year total [11,25]. The United States ranked first with 12,899,076 (95% UI 9,392,578–17,505,494) cases and an all-population ASPR of 10,974.5 (9,069.5–13,288.3) per 100,000, followed by China (12,310,357 cases; ASPR 3,066.8) and India (11,121,052, 6,798,180–17,245,103; ASPR 2,334.0, 1,934.0–2,809.0); the United States rate is thus approximately 4.7 times that of India despite similar case totals. Relative to GBD 2021-based rankings [3], the Democratic Republic of the Congo and Mexico newly enter the top ten. Figure 2b shows the distribution of national ASPRs across 204 countries against the SDI-quintile reference rates.
Table 4 demonstrates that absolute burden is driven jointly by population size and underlying prevalence, such that countries with modest ASPRs but large pediatric populations (China, India, Indonesia, Pakistan) rank alongside high-rate countries (the United States, Brazil, and—at 14th place with an ASPR of 10,302.9 per 100,000—the United Kingdom). Mortality within the top 15 was highly heterogeneous: India and Indonesia together contributed approximately 4,800 deaths (2,625 and 2,217, respectively), and Nigeria a further 2,162, whereas the United States, Brazil, China, and Mexico each recorded fewer than 350—mirroring the prevalence–mortality paradox observed at regional and SDI levels. The concentration of nearly half the global burden in ten nations implies that improvements in asthma management in a small number of populous countries could materially shift global totals [11,25].
3.4. Temporal Trends, 1990–2023 (Figure 2c–E; Table 5; Figure 3)
Temporal trajectories by SDI quintile are displayed in Figure 2c–E, and estimated annual percentage changes (EAPCs) in the all-population age-standardized rates are summarized in Table 5 and Figure 3a. Between 1990 and 2023, the global ASPR was essentially stable (EAPC +0.01, 95% confidence interval [CI] −0.04 to +0.05), while the age-standardized incidence rate rose slightly (+0.17, +0.14 to +0.20); in contrast, the ASMR declined steadily (−1.56, −1.64 to −1.48) and the ASDR more modestly (−0.76, −0.81 to −0.72) [11,25]. Trends diverged by development level (Figure 2c–E): the ASPR increased significantly in high-SDI countries (EAPC +0.31, +0.26 to +0.35) and rose modestly in middle-SDI countries (+0.06, +0.03 to +0.10), was stable in low-SDI countries (+0.02, −0.01 to +0.06), and declined in high-middle- (−0.11, −0.23 to +0.02; not statistically significant) and low-middle-SDI countries (−0.09, −0.14 to −0.05), the latter showing the fastest significant decline, while ASMRs fell in every quintile, most rapidly in high-SDI countries (−3.97, −4.23 to −3.71).
Age-specific analyses refine the aggregate picture (Figure 3c). For prevalence, only the youngest stratum declined between 1990 and 2023 (the official <5-years aggregate: EAPC −0.07, 95% CI −0.15 to −0.00; net change −3.4%; the 2–4-year detail band, which excludes the 1-year group: −0.12, −0.18 to −0.06); rates rose in every older band, fastest at ages 10–14 years (EAPC +0.27, +0.22 to +0.32; net change +6.3%), with smaller increases at ages 5–9 (+0.14; +2.4%), 15–19 (+0.12; +4.5%), and 20–24 years (+0.08, −0.00 to +0.15; +4.2%) [11,25]. For mortality, all age bands improved, including the <5-years aggregate (EAPC −1.84, −2.01 to −1.67); the gradient peaked at ages 5–9 years (EAPC −2.00, −2.11 to −1.90) and attenuated toward older ages (2–4 years −1.62; 10–14 years −1.34; 15–19 years −0.87; 20–24 years −0.54, −0.68 to −0.39), identifying adolescents and young adults as the strata with the slowest fatal-burden improvement [11,25].
Table 5 and Figure 3 together formalize the asymmetry that structures the temporal narrative. Fatal outcomes improved at roughly 1.6% per year while non-fatal rates stagnated or rose, so the three-decade mortality decline has not been accompanied by any reduction in underlying disease occurrence; instead, absolute case numbers grew by 23.1% (prevalence) and 23.4% (incidence) between 1990 and 2023 (Table 1), driven by population growth and the shifting age structure of the global 0–24-year population [11,25]. Rate-based indicators alone therefore understate the service-delivery challenge: the number of children requiring long-term asthma management stands at historically high levels, and the concentration of mortality decline in younger bands has left adolescents and young adults with the weakest gains in fatal outcomes.
3.5. Age and Sex Patterns (Figure 1c and Figure 1d)
Age-specific prevalence rates in 2023—official GBD rate estimates, obviating external population denominators—followed a single-peak distribution (Figure 1c). The official <5-years aggregate rate was 3,862.8 (95% UI 2,586.7–5,785.7) per 100,000; within that stratum, the informative 2–4-year detail band (the GBD does not estimate asthma under 1 year of age) recorded 5,416.8 (3,423.2–8,112.9) per 100,000; the rate peaked at 5,706.2 (3,830.2–8,387.2) per 100,000 at ages 5–9 years and declined gradually through ages 10–14 (5,517.1, 3,914.8–7,903.3), 15–19 (4,376.8, 3,015.0–6,304.1), and 20–24 years (3,347.4, 2,343.7–4,656.8), the last still 58.7% of the 5–9-year peak [11,25]. Absolute case numbers were largest at ages 5–9 years (39,974,095; 26.5% of the 0–24-year total), followed by ages 10–14 (37,650,990), 15–19 (28,214,468), under 5 years (24,839,084), and 20–24 years (20,158,475) (Figure 1d). The early school-age peak and gradual decline thereafter are consistent with the natural history of childhood asthma, in which a substantial proportion of early-onset wheezing remits by adolescence [21].
The male-to-female prevalence ratio exhibited a systematic age-dependent transition (Figure 1d). Males predominated from early childhood through ages 10–14 years, with M:F rate ratios of 1.20 (ages 2–4 years), 1.26 (5–9 years), and 1.12 (10–14 years); the ratio reversed to 0.91 at ages 15–19 years and fell further to 0.79 at ages 20–24 years, by which point female prevalence (3,744.0 per 100,000) exceeded male prevalence (2,962.8 per 100,000) by approximately 26% [11,25]. A parallel convergence occurred in mortality: the 0–24-year M:F ratio of death counts converged from 1.758 in 1990 to near parity (1.017) in 2023, with sex-specific uncertainty intervals overlapping throughout, as male deaths declined by 35.8% (17,393 to 11,159) while female deaths rose by 10.8% (9,896 to 10,967); YLLs showed the same convergence (−37.3% in males versus +7.4% in females) [11,25]. The sex gap in prevalent case numbers was nearly constant (M:F 1.133 in 1990 versus 1.130 in 2023), indicating that the mortality convergence reflects differential trends in fatal outcomes rather than in disease occurrence.
3.6. Risk Factor Attribution
Population attributable fractions (PAFs) for asthma in the pediatric population are available from two GBD rounds with different risk coverage. In the GBD 2021 round (0–24-year extraction; reported as historical comparison because pediatric PAFs have not been re-estimated under GBD 2023), only three risk factors were quantified for asthma attribution: high body-mass index (BMI), occupational asthmagens, and air pollution [3]. The share of asthma DALYs attributable to high BMI more than doubled, from 4.17% in 1990 to 10.00% in 2021, and the attributable share of deaths rose from 3.19% to 7.83%; occupational asthmagens accounted for 2.59% of DALYs and 4.83% of deaths in 2021 (versus 2.34% and 2.87% in 1990), and air pollution contributed 3.49% of DALYs in 2021 versus 3.27% in 1990 [3,23]. Under GBD 2023, pediatric (<20-year) asthma attribution additionally quantifies second-hand smoke, which ranks first among attributable risks for childhood asthma YLDs, with high BMI second and nitrogen dioxide (NO2) third; in the all-ages framework, high BMI has become the leading risk factor for asthma globally [1,5,23]. High BMI thus remains the fastest-growing quantified contributor to pediatric asthma burden, paralleling the global rise in childhood adiposity [23].
Independent estimates from GBD 2023 quantified the contribution of NO2 exposure to childhood asthma. Globally in 2023, 4.67% (95% UI −3.75 to 20.6) of childhood asthma burden was attributable to NO2, corresponding to 233,000 (95% UI −250,000 to 956,000) attributable YLDs, with a relative risk of 1.05 (95% UI 0.99–1.12) per 5 parts per billion increment [5]. Regional PAFs were highest in high-income countries (6.45%) and North Africa and the Middle East (6.30%), followed by Southeast Asia, East Asia, and Oceania (5.30%), Latin America (4.86%), Central and Eastern Europe and Central Asia (4.77%), South Asia (3.83%), and Sub-Saharan Africa (2.34%) [5]; an earlier independent analysis attributed approximately 4 million new pediatric asthma cases per year to ambient NO2 [17]. The wide, zero-crossing uncertainty interval around the global PAF reflects the imprecision of the concentration–response function and warrants cautious interpretation [5]. Because the GBD quantifies only a limited set of risk factors for asthma, the attributable burden reported here is a lower bound on the modifiable fraction [1,3,5].
3.7. COVID-19 Pandemic Period, 2019–2023 (Figure 3b)
Trends restricted to the pandemic window (2019–2023) diverged from the long-term trajectory (Table 5, right columns; Figure 3b). The global all-population ASPR increased (EAPC +1.07, 95% CI +0.63 to +1.52), whereas the incidence rate rose only marginally and not significantly (+0.27, −0.01 to +0.55) [11,25]. The long-run mortality decline stalled: the ASMR EAPC was −0.38 (−5.07 to +4.55), statistically indistinguishable from zero, and the ASDR EAPC was +0.56 (−1.60 to +2.78). In absolute terms, deaths among ages 0–24 years rose by 3.78% between 2019 and 2023 (from 21,320 to 22,126) while the all-population ASMR fell by 4.19% (from 5.20 to 4.98 per 100,000), a divergence largely attributable to growth of the pediatric population (the 0–24-year crude mortality rate was nearly unchanged, 0.66 to 0.68 per 100,000); over the same window the YLD rate rose by 3.60% while the YLL rate fell by 2.40% [11,25].
All-age estimates from GBD 2023 provide broader context. In 2023, CRDs affected 569.2 million people and caused 4.2 million deaths globally, with the all-age age-standardized death rate having declined by 25.7% between 1990 and 2023 [1]. The long-run decline in CRD mortality was interrupted during the pandemic period, although—following an author correction to the original report—the attenuation was less pronounced than initially stated [1,2]; all-age analyses of GBD 2021 likewise found that the pre-pandemic decline in asthma prevalence stagnated during the pandemic years [13]. Together, the evidence indicates a pandemic-era halt or reversal of prevalence improvement alongside stalled mortality improvement and an increase in absolute pediatric deaths [1,2,13].
3.8. Whole-Population Context: All-Ages Asthma Burden in GBD 2023
To situate the pediatric findings within the whole-population trajectory, all-ages GBD 2023 estimates were examined as background context; all rates in this subsection are whole-population age-standardized and are not restricted to ages 0–24 years. Across all ages in 2023, asthma affected an estimated 362.7 million people and was responsible for 14.1 million (95% UI 8.80–20.3) YLDs, 441.9 thousand (305.8–665.1) deaths, and 11.76 million (8.32–16.92) YLLs globally [11,12]; the 0–24-year population therefore carried approximately 42% of all prevalent asthma cases. Although the all-ages death count rose by 29.0% relative to 2000, the age-standardized mortality rate declined by 29.1% (from 7.0 to 5.0 per 100,000), indicating that growing mortality counts reflect population growth and aging rather than worsening individual-level outcomes [11,12].
The global all-ages ASPR did not decline between 1990 and 2023; instead, it rose slightly from 4,388.35 (95% UI 3,699.66–5,184.61) to 4,457.71 (3,786.95–5,246.95) per 100,000, a net increase of 1.58% (95% UI 0.22–3.03) [1]. This aggregate stability conceals pronounced regional heterogeneity: the largest increase occurred in Tropical Latin America (+32.42%, 95% UI 19.94 to 43.51), followed by Eastern Europe (+14.14%), high-income North America (+12.65%), Southern Sub-Saharan Africa (+12.00%), Western Europe (+10.85%), and East Asia (+5.56%), whereas South Asia (−10.77%), Central Latin America (−7.14%), Central Europe (−6.80%), and Andean Latin America (−6.06%) recorded significant declines [1]. Australasia remained the highest-prevalence region in 2023 (13,364.38, 10,910.14–16,540.55 per 100,000), and Central Asia (2,258.76, 1,830.25–2,775.43) and South Asia (2,475.17, 2,062.22–2,953.32) the lowest—a nearly six-fold gap [1]. The full regional series for 1990, 2019, 2020, and 2023 is provided in Supplementary Table S1.
The official GBD 2023 series independently corroborates the post-pandemic rebound identified in the 0–24-year analysis. Globally, the all-ages ASPR rose marginally from 2019 to 2020 (+0.22%; 4,291.14 to 4,300.56 per 100,000) and then rebounded by 3.65% between 2020 and 2023 (to 4,457.71 per 100,000), most pronouncedly in high-income North America (+8.63%) and East Asia (+7.63%) [1]. These all-ages dynamics align with the pediatric pattern, in which the prevalence rate switched from long-run stability to an EAPC of +1.07 (95% CI +0.63 to +1.52) over 2019–2023. The rebound is visible both in the 0–24-year counts and in the all-ages standardized series, indicating that it is not an artifact of the author-performed age aggregation; continued monitoring will determine whether it is transient or durable [11,25].
3.9. Illustrative Extrapolation of Pediatric Cases to 2050 (Figure 3d)
To bound the possible scale of the future pediatric burden, an illustrative extrapolation extended the 1990–2023 log-linear trend in the age-standardized prevalence rate (EAPC +0.01% per year) to 2050 under two simplified 0–24-year population scenarios (Figure 3d). Under a constant-population scenario, prevalent cases at ages 0–24 years would number approximately 141.2 million in 2050; under a linear extrapolation of the 1990–2023 population trend—an upper-bound scenario that likely overstates future 0–24-year population growth (the United Nations World Population Prospects medium-variant trajectory implies that the global population under 25 years approaches a plateau by mid-century, well below a continued linear rise)—approximately 161.1 million. Sensitivity extrapolations using the 0–24-year crude-rate trend (EAPC +0.11% per year) yielded approximately 153.3 and 174.8 million cases, respectively. These projections are illustrative extrapolations, not formal forecasts: they assume continuation of the 1990–2023 log-linear trend in age-standardized prevalence for 27 years, under two simplified population scenarios, and take no account of interventions, climate change, diagnostic-practice change, or cohort effects; no prediction intervals are reported, because the EAPC confidence interval reflects only historical regression precision. They should not be cited as predictions. Within these limits, the pediatric asthma caseload in 2050 will plausibly remain in the range of 141–175 million even under flat epidemiological rates, underscoring that absolute service demand is a demographic, rather than an epidemiological, problem [11,25].
4. Discussion
4.1. Principal Findings
This analysis—the first pediatric burden assessment extracted directly from the GBD 2023 round rather than republished from earlier rounds—yields five principal findings for ages 0–24 years. First, the burden is substantial and predominantly non-fatal: an estimated 150,837,112 (95% UI 103,730,853–218,576,263) individuals were living with asthma in 2023—about 42% of all asthma cases worldwide—generating 7,753,206 (5,069,966–11,580,326) DALYs, of which YLDs accounted for approximately 78%, yet only 22,126 (15,409–32,090) deaths [11,25]. Second, the three-decade pattern is one of rising counts against flat rates: prevalent cases grew by 23.1% between 1990 and 2023 while the all-population ASPR was essentially stable (EAPC +0.01, 95% CI −0.04 to +0.05), and fatal outcomes improved steadily (all-population ASMR EAPC −1.56) [11,25]. Third, low-SDI countries—despite mid-range prevalence—concentrated 55.3% of all asthma deaths at these ages in 2023, with deaths rising 17.0% since 1990. Fourth, the adolescent sex reversal extends to mortality in convergent form: the male-to-female ratio of asthma deaths converged from 1.758 in 1990 to near parity (1.017; sex-specific uncertainty intervals overlap throughout) in 2023. Fifth, in the COVID-19 window (2019–2023) this configuration changed: the all-population ASPR rose significantly (EAPC +1.07) while mortality improvement stalled and absolute pediatric deaths increased by 3.8% (point estimate; uncertainty intervals overlap), with rates essentially unchanged [11,25].
4.2. Comparison with GBD 2021-Based Pediatric Estimates
These estimates differ systematically from the GBD 2021-based pediatric literature, and the difference must not be read as temporal change. For the same calendar year 2021, the present GBD 2023 aggregation yields 149,728,659 prevalent cases aged 0–24 years—18.7% above the 126,179,865 reported by Chen et al. from the GBD 2021 round [3]—because each round re-runs its models with new data sources and updated population denominators, so cross-round differences at a fixed year reflect model updates rather than epidemiological change [7,11]. GBD 2021-based estimates are therefore treated strictly as historical comparison, and no GBD 2021 value enters any table, figure, or trend reported here [3,4,13]. The same applies to trend direction: the three-decade decline in pediatric age-standardized prevalence reported from GBD 2021 (EAPC −1.00) [3] is not reproduced under GBD 2023, where standardized prevalence is stable and age-specific rates drift upward beyond early childhood. Reassuringly, the structural patterns—the school-age prevalence peak, the adolescent sex reversal, and the prevalence–mortality paradox—are concordant across rounds [1,3,21]. Beyond round differences, this analysis extends the Chen et al. framework: our series runs through 2023, capturing the 2022–2023 post-pandemic rebound, with the pandemic-window EAPC estimated over 2019–2023 rather than 2019–2021, and our extrapolation reaches 2050 at pediatric ages, whereas their projections end at 2040 and the capstone’s 2050 projections are all-ages only [3,13].
4.3. Pediatric vs Adult Chronic Respiratory Disease Spectrum and the Life-Course Perspective
The near-single-disease composition of the pediatric CRD spectrum has direct strategic implications. Whereas adult CRD policy must address COPD and asthma jointly [1,14], the pediatric burden is effectively an asthma problem [1]. Pediatric respiratory programs should therefore be organized around asthma-specific priorities—early diagnosis, sustained access to inhaled corticosteroid (ICS)-based controller therapy, and structured follow-up per the Global Initiative for Asthma (GINA) [16]—rather than replicating adult-style COPD-oriented services. The pediatric focus is simultaneously an upstream intervention against adult disease: persistent childhood asthma impairs lung-function growth and is a recognized antecedent of fixed airflow limitation and COPD [20,21]. The 151 million prevalent cases thus constitute both a contemporary disability burden and a reservoir of future adult disease; early, guideline-concordant control is an intergenerational as well as an immediate intervention [16,20].
4.4. The Prevalence–Mortality Paradox and the Low-SDI Mortality Rise
The inverse development gradient (Table 2 and Table 3) is unlikely to reflect differential biological susceptibility. On the all-population age-standardized scale, the high-SDI ASPR is 1.67 times the low-SDI value, whereas the ASMR rises monotonically from 1.14 per 100,000 in high-SDI to 15.56 in low-SDI countries (13.6-fold) [11,25]. Three complementary explanations are supported: under-diagnosis and under-reporting in data-sparse settings depress measured prevalence where mortality is highest [11,24]; uneven access to effective controller therapy—above all ICS—maps closely onto the mortality gradient [16,24]; and DALY composition inverts across the gradient (mortality-driven in low-SDI, disability-driven in high-SDI countries), so rankings by deaths and by DALYs diverge [24].
Most strikingly, asthma deaths at ages 0–24 years in low-SDI countries rose by 17.0% between 1990 and 2023 even as the all-population ASMR there fell by 32.1%—not worsening individual-level risk but population growth, with prevalent cases up 137.7%, outpacing the decline in per-capita fatality. This pattern fits the framework of Meghji and colleagues, which locates lung-health inequity in interacting deficits of diagnosis, treatment access, and environmental exposure [24], and identifies affordable, reliable ICS supply within primary care as the highest-yield mortality intervention in low-SDI settings [16,24].
4.5. Age-Dependent Sex Reversal: Prevalence and Mortality
The transition of the male-to-female prevalence ratio across the age bands—from 1.20 at ages 2–4 years to 0.79 at 20–24 years (Figure 1d)—mirrors the adolescent crossover documented in asthma epidemiology [21]. Plausible contributors include smaller airways relative to lung size and greater airway hyperresponsiveness in boys [21], pubertal hormonal shifts [22], and the female-predominant obesity distribution of late adolescence [23].
A parallel and previously unreported convergence occurred in fatal outcomes: the male-to-female ratio of asthma deaths at ages 0–24 years converged from 1.758 in 1990 to near parity (1.017) in 2023, with sex-specific uncertainty intervals overlapping throughout and a matching convergence in YLLs (Section 3.5). Because the sex gap in prevalent case numbers was nearly constant, the mortality convergence reflects differential trends in fatal outcomes rather than in disease occurrence. We interpret this cautiously: the pattern is consistent with the emerging female predominance of asthma after puberty and with sex-differential exposure to the rising high-BMI risk profile [21,22,23], but aggregate data cannot establish these mechanisms, and differential remission, care-seeking, and diagnostic labeling cannot be excluded [21]. Adolescent girls and young women nonetheless emerge as a priority group for surveillance [21,22].
4.6. The COVID-19 Period, 2019–2023
Pandemic-window trends diverged from the long-term trajectory: the all-population ASPR rose significantly (EAPC +1.07, 95% CI +0.63 to +1.52), while the long-run mortality decline stalled (ASMR EAPC −0.38, −5.07 to +4.55). Pediatric deaths rose by 3.78% (21,320 to 22,126) while the all-population ASMR fell by 4.19%—a divergence largely attributable to pediatric population growth rather than worsening individual risk. This configuration matches the corrected conclusion of the GBD 2023 all-ages CRD analysis, whose Author Correction revised the pandemic-era wording to a less pronounced—rather than reversed—decline in mortality rates [1,2].
The prevalence rebound is temporally consistent with the “immunity debt” hypothesis—reduced early-life viral exposure under non-pharmaceutical interventions followed by rebound infection surges that can trigger or unmask wheezing illness [19]—but deferred diagnosis and interrupted chronic-disease management are equally plausible [1,13], and mechanistic inference exceeds what GBD estimates can establish. The rebound is unlikely to be an artifact of the author-level aggregation: it appears both in the 0–24-year counts and in the all-ages standardized series (Section 3.8) [1], and the mortality signal is one of stalled improvement rather than resurgence—acute-care gains were largely preserved while prevention faltered. Pandemic preparedness frameworks should protect continuity of chronic respiratory care so that future shocks do not again decouple fatal from non-fatal trends [1,13,19].
4.7. Risk-Factor Attribution: An Age-Frame-Dependent Hierarchy
Attributable-risk rankings differ by age frame, and conflating them distorts prevention priorities. In the GBD 2023 pediatric (<20-year) framework, second-hand smoke ranks first among quantified contributors to childhood asthma YLDs, followed by high BMI and NO2 [1,5]; in the all-ages framework, high BMI leads globally [1,23]. High BMI is in both frames the fastest-growing quantified contributor: in the GBD 2021 pediatric extraction (retained as labeled historical comparison), its share of asthma DALYs more than doubled between 1990 and 2021 (4.17% to 10.00%), paralleling the global rise in childhood adiposity [3,23]. The NO2 analysis—the only GBD 2023-native pediatric attribution—estimated that 4.67% of childhood asthma burden in 2023 was attributable to NO2, with a wide, zero-crossing uncertainty interval that warrants caution [5]; the Sub-Saharan African fraction (2.34%) is currently lowest, but urbanization and traffic growth argue for early air-quality governance [5,17,18]. Because the GBD quantifies only a limited subset of putative risks, these attributable fractions are lower bounds on the modifiable fraction [1,5,9].
4.8. Illustrative Extrapolation to 2050
Four illustrative extrapolations place the 2050 caseload at ages 0–24 years between 141.2 and 174.8 million (Section 3.9). These are illustrative extrapolations, not formal forecasts (Section 2.5.3 and Section 3.9), and are not comparable with published GBD 2021 forecasting-framework projections (274.8 million all-ages cases by 2050), which derive from a different round [10,13]. Within these limits, the strategic message is that future pediatric service demand is a demographic, not epidemiological, problem: even under flat rates, case numbers remain at historically high levels, so capacity planning should follow pediatric population maps—above all in Sub-Saharan Africa—rather than expectations of rising per-capita risk [24].
4.9. Limitations
Several limitations temper these findings. First, the GBD 2023 Results Tool does not publish single-year age groups; 0–24-year counts are therefore author-computed sums of the official <5-years aggregate (which includes the 1-year group) and the four five-year bands, whose 95% UIs, approximated by summing group-specific bounds, ignore correlation among posterior draws and are expected to be conservative; percentage changes in counts are point estimates without propagated uncertainty. Second, no 0–24-year age-standardized rate exists in GBD output: pediatric comparisons rely on age-specific and crude rates, and ASPR/ASMR/ASDR values cited for quintile and regional comparisons are whole-population age-standardized rates dominated by adults. Third, the GBD does not model asthma in infants under 1 year, and the official under-20 aggregate is modeled independently of its constituent bands (+2.8% discrepancy in 2023). Fourth, EAPC confidence intervals reflect regression precision only; short-window (2019–2023) EAPCs rest on five annual observations and are exploratory. Fifth, the 2050 extrapolations carry the restrictive assumptions enumerated in Section 4.8. Sixth, estimates are not comparable across GBD rounds, and pediatric PAFs beyond the NO2 analysis have not been re-estimated under GBD 2023, so GBD 2021 attribution values appear only as labeled historical comparisons [3,5,9]. Seventh, diagnostic sparsity and limited vital-registration coverage in low-SDI settings likely depress measured prevalence and widen uncertainty [11,24]. Eighth, pandemic-era estimates are subject to data disruption and to model assumptions whose interpretation was itself revised by Author Correction [1,2]. Finally, national-level temporal series for deaths, YLDs, and YLLs were not re-analyzed (2023 country values only), and pediatric COPD and other CRDs are not separately quantifiable at these ages, so the disease-composition characterization remains a framework-level judgment [1]. The concordance of the principal patterns across GBD rounds and independent analyses nonetheless supports the robustness of the core conclusions [1,3,4,5].
5. Conclusion
To our knowledge, this study provides the first assessment of asthma burden among children, adolescents, and young adults aged 0–24 years extracted directly from the Global Burden of Disease Study 2023, extending pediatric estimates through the full COVID-19 period. In 2023, an estimated 150,837,112 (95% uncertainty interval 103,730,853–218,576,263) individuals in this age band were living with asthma—about 42% of all cases worldwide—yet only 22,126 (15,409–32,090) died. Between 1990 and 2023, absolute case numbers rose by 23.1% while the all-population age-standardized prevalence rate remained essentially flat and mortality declined steadily; during 2019–2023 this configuration shifted, with all-population age-standardized prevalence rising significantly, mortality improvement stalling, and absolute pediatric deaths increasing by 3.8% (point estimate; uncertainty intervals overlap). The inequity is pronounced and, by share of deaths, widening: low-Socio-demographic Index countries now concentrate 55.3% of asthma deaths at these ages, deaths there having risen 17.0% since 1990 as population growth outpaces declining fatality rates, and the male-to-female ratio has reversed in prevalence across adolescence and, in mortality, has converged from 1.758 in 1990 to near parity (1.017) across three decades. The single most important takeaway is that case numbers continue to grow while the all-population age-standardized prevalence rate remains flat, and deaths remain concentrated where health systems are weakest—and each dimension demands its own strategy. Actionable priorities follow: ensure reliable, affordable access to inhaled corticosteroids and guideline-concordant care within primary health systems in low-SDI settings; target adolescent girls and young women as an emerging risk group; address second-hand smoke and childhood obesity as leading quantified pediatric risks; protect continuity of chronic respiratory care in pandemic preparedness; and, for research, develop pediatric-specific quantification of non-asthma chronic respiratory diseases and formal forecasts with prediction intervals based on age-specific population projections.
Supplementary Materials
The following supporting information can be downloaded at the website of this paper posted on Preprints.org, Supplementary Data S1: Supplementary_RawData_GBD2023_asthma_0-24.zip. This archive contains the unmodified raw CSV extractions underpinning every pediatric estimate in this study—more than 520,000 rows of official GBD 2023 output from the GBD Results Tool (GBD 2023, version 8352; asthma) downloaded on 13–15 August 2026 [25]. Contents comprise: (i) the full regional time series, 1990–2023 (global, five SDI quintiles, 21 GBD regions; six pediatric age groups, sex, six measures, number and rate with 95% uncertainty intervals; files dl1a/dl1b); (ii) aggregate-age regional series (<5, <20, all ages, age-standardized; files dl2a/dl2b); and (iii) 204-country data (2023 cross-section by age and sex, dl5; age-standardized 2023 estimates and country time series for six measures, ctry files); and (iv) the official 204-country <5-years aggregate cross-section for 2023 (file asthma_u5_ctry2023), used for the national 0–24-year totals. Each extraction folder retains the original IHME citation.txt. Author-derived files (0–24-year crude-rate series, SDI-stratified EAPCs, implied 0–24-year population denominators) are at the archive root. Supplementary Table S1. All-population age-standardized asthma prevalence rates (per 100,000, both sexes) for the global level, five SDI quintiles, and all 21 GBD regions in 1990, 2019, 2020, and 2023, with 95% uncertainty intervals and 1990–2023 percentage change. The prose summary of these estimates appears in Section 3.8; the full 21-region table is provided here, with values sourced from the GBD 2023 chronic respiratory disease analysis [1].
GATHER checklist
This study adheres to the Guidelines for Accurate and Transparent Health Estimates Reporting (GATHER); the completed checklist is provided as Supplementary Material.
Acknowledgments
We thank the Institute for Health Metrics and Evaluation (IHME), University of Washington, for making the GBD 2023 estimates publicly available through the GBD Results Tool, and the Global Burden of Disease Collaborator Network, whose primary data collection and modeling underpin all estimates analyzed here. No part of this manuscript has been presented elsewhere.
Reporting Checklist
The authors have completed the GATHER (Guidelines for Accurate and Transparent Health Estimates Reporting) reporting checklist.
Data Sharing Statement
All estimates analyzed in this study were downloaded by the authors from the GBD Results Tool (https://vizhub.healthdata.org/gbd-results/) [25] on 13–15 August 2026 (GBD Study 2023, asthma). The raw downloaded CSV files, together with author-aggregated derived files, are provided as Supplementary Data S1 (zip archive). Python analysis code is available from the corresponding author on reasonable request.
Peer Review File
Available at the journal’s website upon acceptance, in line with the journal’s transparent peer review policy.
Conflicts of Interest
All authors have completed the ICMJE uniform disclosure form (available at https://cdn.amegroups.cn/static/public/coi_disclosure.docx). The authors have no conflicts of interest to declare.
Ethical Statement:
The authors are accountable for all aspects of the work in ensuring that questions related to the accuracy or integrity of any part of the work are appropriately investigated and resolved. This study is a secondary analysis of de-identified, aggregate, publicly available estimates from the Global Burden of Disease (GBD) Study 2023, coordinated by the Institute for Health Metrics and Evaluation (IHME); no individual-level or identifiable data were accessed. In accordance with institutional policy for research on publicly available aggregate data, this study was exempt from institutional review board approval, and no participant consent was required.
Consent for publication
Not applicable.
Author Contributions
DL curated the data and performed the formal analysis. SC conceived the study, supervised the work, and drafted and revised the manuscript. SC is the principal investigator who conceived the study and leads its overall conduct. All authors read and approved the final manuscript.
Funding
This work was supported by the Beijing Science and Technology Nova Program Interdisciplinary Project (20230484439) and the Beijing High-Level Public Health Technical Talents Project (2023-02-33). The funders had no role in study design, data collection and analysis, decision to publish, or preparation of the manuscript.
Use of artificial intelligence. Declaration of generative AI use
AI tools were used for language polishing and code drafting.
Related-manuscripts disclosure
This manuscript is a sister manuscript to two related analyses by our group, “Left behind in the asthma transition: the child-specific inequality penalty in the global burden of asthma at ages 0–24 years, 1990–2023” (inequality axis; pre-submission as of 21 October 2026) and “Global, regional, and national burden of asthma in children, adolescents, and young adults aged 0–24 years, 1990–2023: a systematic analysis of the Global Burden of Disease Study 2023” (descriptive-template axis; pre-submission as of 21 October 2026). All three manuscripts analyse the same publicly available Global Burden of Disease (GBD) Study 2023 asthma data panel for ages 0–24 years, 1990–2023, but pursue distinct research axes: the present manuscript takes the overall-burden axis, centred on stalled progress and the post-pandemic rebound, whereas the sister manuscripts address the inequality axis and the descriptive-template axis, respectively. Baseline headline estimates (150.8 million prevalent cases, 22,126 deaths, and 7.75 million DALYs at ages 0–24 years in 2023) coincide across the three manuscripts because all three are computed from the same public GBD 2023 estimates downloaded by the authors from the GBD Results Tool; this concordance reflects normal use of a common public data source, not duplicate reporting. The three manuscripts address distinct questions, and each is complete without the others. The relationship is disclosed in accordance with COPE guidance on redundant and overlapping publication.
Abbreviations
- ASDR: age-standardized DALY rate
- ASMR: age-standardized mortality rate
- ASPR: age-standardized prevalence rate
- BMI: body-mass index
- CI: confidence interval
- CODEm: Cause of Death Ensemble model
- COPD: chronic obstructive pulmonary disease
- CRD: chronic respiratory disease
- DALY: disability-adjusted life-year
- DisMod-MR: Bayesian meta-regression tool for disease modeling (version 2.1)
- EAPC: estimated annual percentage change
- GATHER: Guidelines for Accurate and Transparent Health Estimates Reporting
- GBD: Global Burden of Disease (Study)
- GINA: Global Initiative for Asthma
- ICD-10: International Classification of Diseases, Tenth Revision
- ICS: inhaled corticosteroid
- IHME: Institute for Health Metrics and Evaluation
- ILD: interstitial lung disease
- M:F: male-to-female ratio
- NO2: nitrogen dioxide
- PAF: population attributable fraction
- SDI: Socio-demographic Index
- UI: uncertainty interval
- UN: United Nations
- YLD: years lived with disability
- YLL: years of life lost
References
- Oh, J.; Kim, S.; Yim, Y.; et al. Global, regional, and national burden of chronic respiratory diseases and impact of the COVID-19 pandemic, 1990-2023: a Global Burden of Disease study. Nat. Med. 2026, 32, 197–223. [Google Scholar] [CrossRef]
- Oh, J.; Kim, S.; Yim, Y.; et al. Author Correction: Global, regional, and national burden of chronic respiratory diseases and impact of the COVID-19 pandemic, 1990-2023: a Global Burden of Disease study. Nat. Med. 2026, 32, 1160. [Google Scholar] [CrossRef]
- Chen, X.; Ma, D.; Li, H.; et al. The evolving global burden of asthma among children and adolescents, 1990-2040: trends, disparities, and future projections based on Global Burden of Disease (GBD) 2021. J. Thorac. Dis. 2026, 18, 229. [Google Scholar] [CrossRef]
- Kim, T.H.; Kim, H.; Oh, J.; et al. Global burden of asthma among children and adolescents with projections to 2050: a comprehensive review and forecasted modeling study. Clin. Exp. Pediatr. 2025, 68, 329–43. [Google Scholar] [CrossRef]
- Burkart, K.; Wozniak, S.; Anenberg, S.; et al. Global, regional and national estimates of the burden of childhood asthma attributable to NO2 exposure for 204 countries and territories from 1990 to 2023: a Global Burden of Disease study 2023. EClinicalMedicine 2025, 90, 103580. [Google Scholar] [CrossRef]
- Jo, H.; Kim, T.H.; Park, J.; et al. Burden of chronic respiratory disease in Asia, 1990-2023: a systematic analysis for the Global Burden of Disease Study 2023. Lancet Respir. Med. 2026, 14, 233–55. [Google Scholar] [CrossRef]
- GBD 2021 Diseases and Injuries Collaborators. Global incidence, prevalence, years lived with disability (YLDs), disability-adjusted life-years (DALYs), and healthy life expectancy (HALE) for 371 diseases and injuries in 204 countries and territories and 811 subnational locations, 1990-2021: a systematic analysis for the Global Burden of Disease Study 2021. Lancet 2024, 403, 2133–61. [Google Scholar] [CrossRef]
- GBD 2021 Causes of Death Collaborators. Global burden of 288 causes of death and life expectancy decomposition in 204 countries and territories and 811 subnational locations, 1990-2021: a systematic analysis for the Global Burden of Disease Study 2021. Lancet 2024, 403, 2100–32. [CrossRef]
- GBD 2021 Risk Factors Collaborators. Global burden and strength of evidence for 88 risk factors in 204 countries and 811 subnational locations, 1990-2021: a systematic analysis for the Global Burden of Disease Study 2021. Lancet 2024, 403, 2162–203. [Google Scholar] [CrossRef]
- GBD 2021 Forecasting Collaborators. Burden of disease scenarios for 204 countries and territories, 2022-2050: a forecasting analysis for the Global Burden of Disease Study 2021. Lancet 2024, 403, 2204–56. [Google Scholar] [CrossRef]
- GBD 2023 Disease and Injury and Risk Factor Collaborators. Burden of 375 diseases and injuries, risk-attributable burden of 88 risk factors, and healthy life expectancy in 204 countries and territories, including 660 subnational locations, 1990-2023: a systematic analysis for the Global Burden of Disease Study 2023. Lancet 2025, 406, 1873–922. [Google Scholar] [CrossRef]
- GBD 2023 Causes of Death Collaborators. Global burden of 292 causes of death in 204 countries and territories and 660 subnational locations, 1990-2023: a systematic analysis for the Global Burden of Disease Study 2023. Lancet 2025, 406, 1811–72. [CrossRef]
- Oh, J.; Kim, S.; Kim, M.S.; et al. Global, regional, and national burden of asthma and atopic dermatitis, 1990-2021, and projections to 2050: a systematic analysis of the Global Burden of Disease Study 2021. Lancet Respir. Med. 2025, 13, 425–46. [Google Scholar] [CrossRef]
- GBD Chronic Respiratory Disease Collaborators. Prevalence and attributable health burden of chronic respiratory diseases, 1990-2017: a systematic analysis for the Global Burden of Disease Study 2017. Lancet Respir. Med. 2020, 8, 585–96. [Google Scholar] [CrossRef]
- Wang, Z.; Li, Y.; Gao, Y.; et al. Global, regional, and national burden of asthma and its attributable risk factors from 1990 to 2019: a systematic analysis for the Global Burden of Disease Study 2019. Respir. Res. 2023, 24, 169. [Google Scholar] [CrossRef]
- Global Initiative for Asthma (GINA). Global Strategy for Asthma Management and Prevention (2024 update); GINA: Fontana (WI), 2024; Available online: https://ginasthma.org/2024-report/.
- Achakulwisut, P.; Brauer, M.; Hystad, P.; et al. Global, national, and urban burdens of paediatric asthma incidence attributable to ambient NO2 pollution: estimates from global datasets. Lancet Planet Health 2019, 3, e166–e178. [Google Scholar] [CrossRef]
- Anenberg, S.C.; Mohegh, A.; Goldberg, D.L.; et al. Long-term trends in urban NO2 concentrations and associated paediatric asthma incidence: estimates from global datasets. Lancet Planet Health 2022, 6, e49–e58. [Google Scholar] [CrossRef]
- Hatter, L.; Eathorne, A.; Hills, T.; et al. Respiratory syncytial virus: paying the immunity debt with interest. Lancet Child Adolesc. Health 2021, 5, e44–e45. [Google Scholar] [CrossRef]
- McGeachie, M.J.; Yates, K.P.; Zhou, X.; et al. Patterns of growth and decline in lung function in persistent childhood asthma. N Engl. J. Med. 2016, 374, 1842–52. [Google Scholar] [CrossRef]
- Dharmage, S.C.; Perret, J.L.; Custovic, A. Epidemiology of asthma in children and adults. Front Pediatr. 2019, 7, 246. [Google Scholar] [CrossRef]
- Yung, J.A.; Fuseini, H.; Newcomb, D.C. Hormones, sex, and asthma. Ann. Allergy Asthma Immunol. 2018, 120, 488–94. [Google Scholar] [CrossRef]
- Zhang, X.; Wang, W.; Wang, W.; et al. An analysis of the global burden of childhood and adolescent asthma attributable to high BMI: 1990-2021. Front Pediatr. 2025, 13, 1646693. [Google Scholar] [CrossRef]
- Meghji, J.; Mortimer, K.; Agusti, A.; et al. Improving lung health in low-income and middle-income countries: from challenges to solutions. Lancet 2021, 397, 928–40. [Google Scholar] [CrossRef]
- Institute for Health Metrics and Evaluation (IHME). GBD Results; IHME, University of Washington: Seattle (WA), 2026; Available online: https://vizhub.healthdata.org/gbd-results.
Figure 1.
Global asthma burden at ages 0–24 years, 1990–2023 (GBD 2023). (a) Global prevalent cases (solid line, left axis, millions; shaded band: 95% uncertainty interval, UI) and crude prevalence rate per 100,000 (dashed line, right axis; the right axis is truncated and does not start at zero), 1990–2023. (b) Global deaths (solid line, left axis, thousands; shaded band: 95% UI) and crude mortality rate per 100,000 (dashed line, right axis), 1990–2023. (c) Age-specific prevalence rate per 100,000 (both sexes) in 2023 with 95% UI band, with 1990 rates shown for comparison; asthma is not modeled under 1 year of age (estimates structurally zero). (d) Sex–age structure of prevalent cases (millions) in 1990 versus 2023; male cases are shown on the negative side. 0–24-year counts are author-aggregated sums of the official <5-years aggregate and the four five-year age bands, with UIs approximated by summing group-specific bounds. Data: GBD 2023 Results (IHME), version 8352 [11,25]. GBD, Global Burden of Disease; IHME, Institute for Health Metrics and Evaluation; UI, uncertainty interval.
Figure 1.
Global asthma burden at ages 0–24 years, 1990–2023 (GBD 2023). (a) Global prevalent cases (solid line, left axis, millions; shaded band: 95% uncertainty interval, UI) and crude prevalence rate per 100,000 (dashed line, right axis; the right axis is truncated and does not start at zero), 1990–2023. (b) Global deaths (solid line, left axis, thousands; shaded band: 95% UI) and crude mortality rate per 100,000 (dashed line, right axis), 1990–2023. (c) Age-specific prevalence rate per 100,000 (both sexes) in 2023 with 95% UI band, with 1990 rates shown for comparison; asthma is not modeled under 1 year of age (estimates structurally zero). (d) Sex–age structure of prevalent cases (millions) in 1990 versus 2023; male cases are shown on the negative side. 0–24-year counts are author-aggregated sums of the official <5-years aggregate and the four five-year age bands, with UIs approximated by summing group-specific bounds. Data: GBD 2023 Results (IHME), version 8352 [11,25]. GBD, Global Burden of Disease; IHME, Institute for Health Metrics and Evaluation; UI, uncertainty interval.
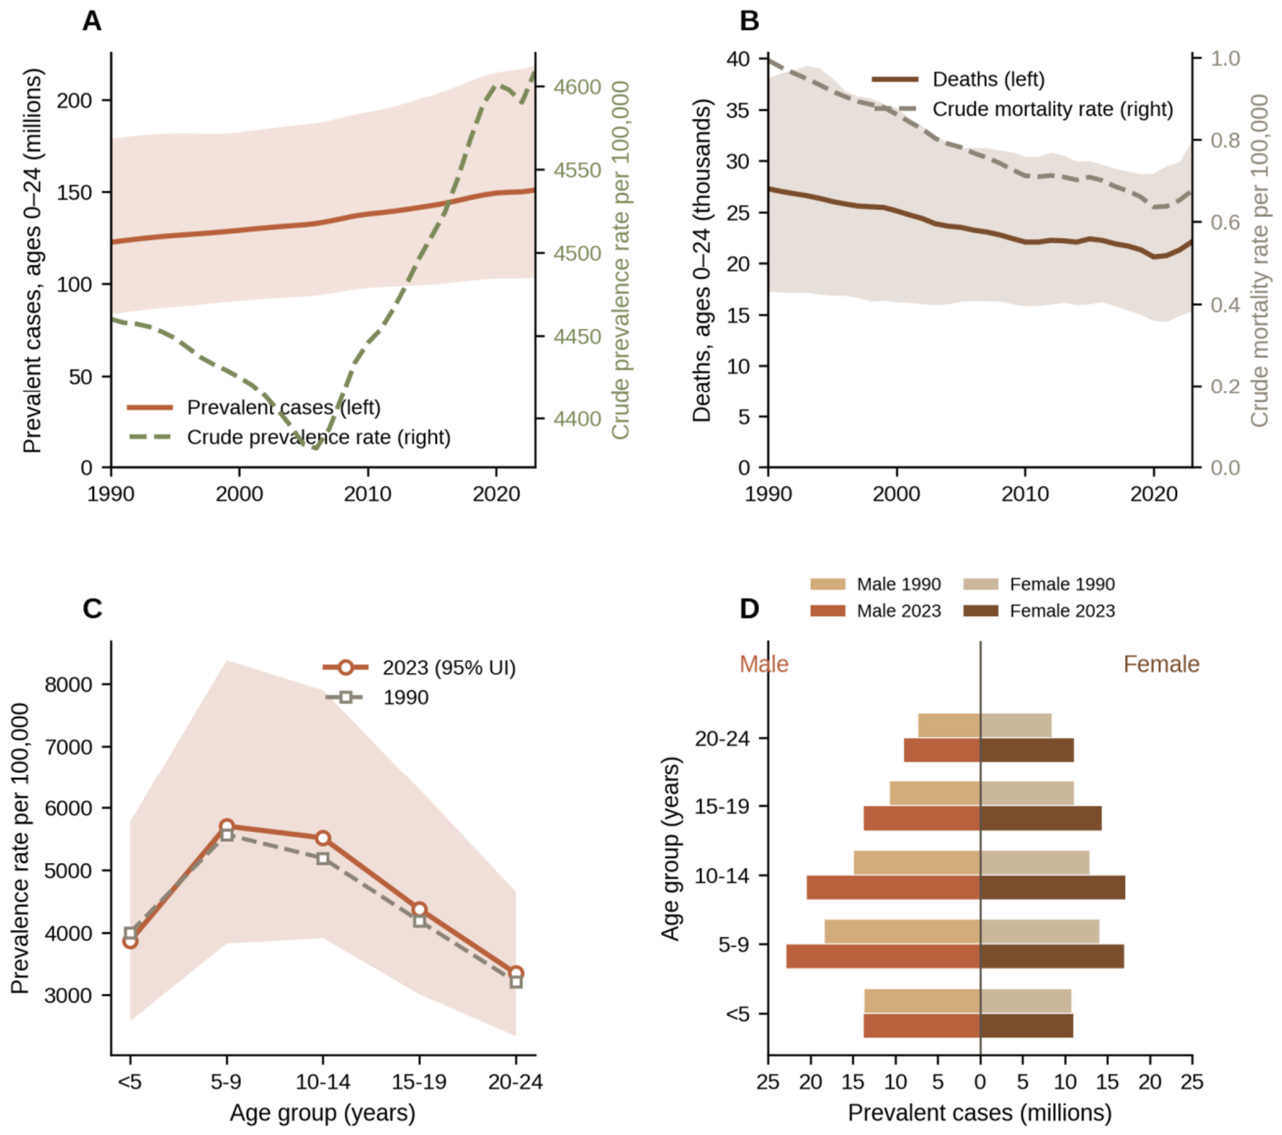
Figure 2.
National asthma burden at ages 0–24 years, 2023 (GBD 2023). (a) The 15 countries with the largest numbers of prevalent cases (millions; whiskers: 95% UI); bar-end labels show prevalent cases and the whole-population age-standardized prevalence rate (ASPR) per 100,000. (b) Distribution of national ASPRs across 204 countries (histogram); tick marks on the top edge show the whole-population age-standardized prevalence rates of the five SDI quintiles and the dashed line the global age-standardized rate (4,458 per 100,000). Data: GBD 2023 Results (IHME), version 8352 [11,25]. ASPR, age-standardized prevalence rate; GBD, Global Burden of Disease; IHME, Institute for Health Metrics and Evaluation; SDI, Socio-demographic Index; UI, uncertainty interval. (c–e) Socioeconomic pattern of asthma burden at ages 0–24 years: Socio-demographic Index (SDI) quintiles, 1990–2023 (GBD 2023). (c) Age-standardized prevalence rate (ASPR) per 100,000 by SDI quintile and globally, 1990–2023. (d) Age-standardized mortality rate (ASMR) per 100,000 by SDI quintile and globally, 1990–2023. (e) SDI gradient of ASPR in 2023 (bars; whiskers: 95% UI); the dashed line marks the global age-standardized rate (4,458 per 100,000). Rates are whole-population age-standardized (both sexes), not restricted to ages 0–24 years. Data: GBD 2023 Results (IHME), version 8352 [11,25].
Figure 2.
National asthma burden at ages 0–24 years, 2023 (GBD 2023). (a) The 15 countries with the largest numbers of prevalent cases (millions; whiskers: 95% UI); bar-end labels show prevalent cases and the whole-population age-standardized prevalence rate (ASPR) per 100,000. (b) Distribution of national ASPRs across 204 countries (histogram); tick marks on the top edge show the whole-population age-standardized prevalence rates of the five SDI quintiles and the dashed line the global age-standardized rate (4,458 per 100,000). Data: GBD 2023 Results (IHME), version 8352 [11,25]. ASPR, age-standardized prevalence rate; GBD, Global Burden of Disease; IHME, Institute for Health Metrics and Evaluation; SDI, Socio-demographic Index; UI, uncertainty interval. (c–e) Socioeconomic pattern of asthma burden at ages 0–24 years: Socio-demographic Index (SDI) quintiles, 1990–2023 (GBD 2023). (c) Age-standardized prevalence rate (ASPR) per 100,000 by SDI quintile and globally, 1990–2023. (d) Age-standardized mortality rate (ASMR) per 100,000 by SDI quintile and globally, 1990–2023. (e) SDI gradient of ASPR in 2023 (bars; whiskers: 95% UI); the dashed line marks the global age-standardized rate (4,458 per 100,000). Rates are whole-population age-standardized (both sexes), not restricted to ages 0–24 years. Data: GBD 2023 Results (IHME), version 8352 [11,25].
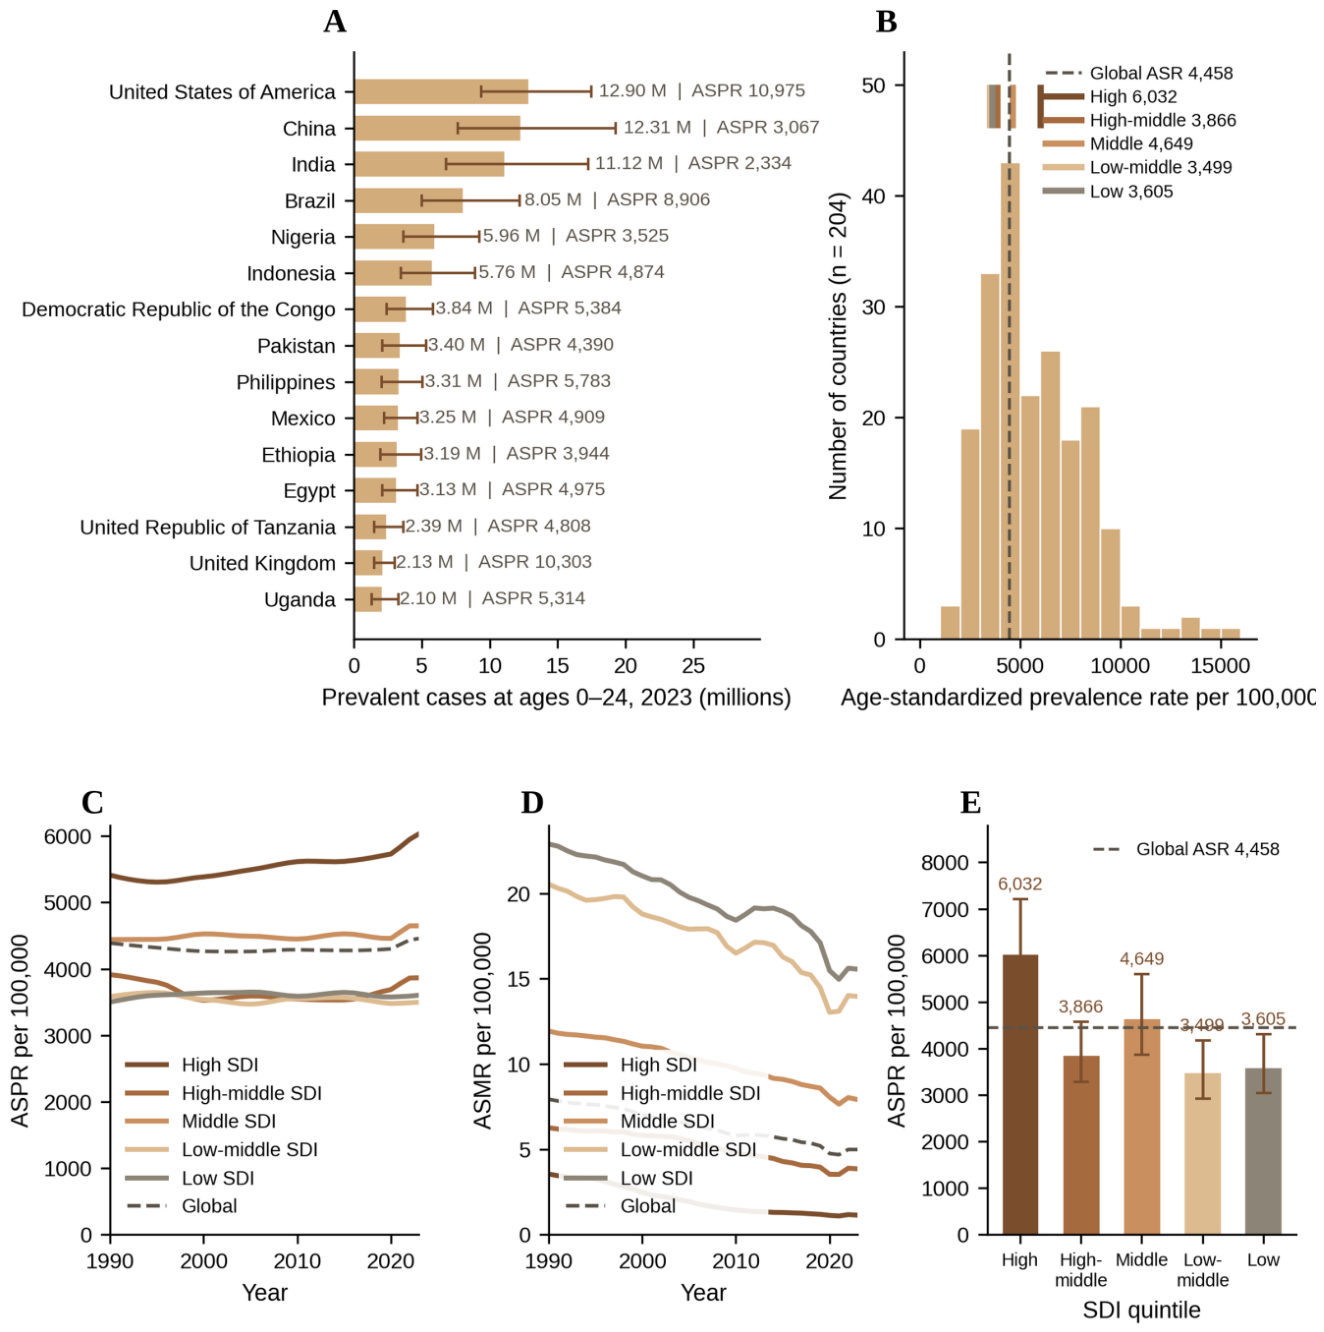
Figure 3.
Estimated annual percentage change (EAPC) analyses and illustrative 2050 extrapolation (GBD 2023). (a) EAPC in whole-population age-standardized prevalence, incidence, mortality and DALY rates, 1990–2023, globally and by SDI quintile (points: EAPC; whiskers: 95% CI). (b) The same quantities for the COVID-19 period, 2019–2023 (color coding as in panel a). (c) EAPC in age-specific prevalence and mortality rates by age group, global, 1990–2023 (<1 year not estimated—asthma estimates are zero at that age). (d) Global ASPR, 1990–2023, with an illustrative log-linear extrapolation to 2050 (dashed line with shaded 95% band; diamond: 2050 point estimate of 4,314 per 100,000, EAPC +0.01%/yr); the extrapolation is illustrative only and is not a formal forecast. Data: GBD 2023 Results (IHME), version 8352 [11,25]. ASPR, age-standardized prevalence rate; CI, confidence interval; DALY, disability-adjusted life-year; GBD, Global Burden of Disease; IHME, Institute for Health Metrics and Evaluation; SDI, Socio-demographic Index.
Figure 3.
Estimated annual percentage change (EAPC) analyses and illustrative 2050 extrapolation (GBD 2023). (a) EAPC in whole-population age-standardized prevalence, incidence, mortality and DALY rates, 1990–2023, globally and by SDI quintile (points: EAPC; whiskers: 95% CI). (b) The same quantities for the COVID-19 period, 2019–2023 (color coding as in panel a). (c) EAPC in age-specific prevalence and mortality rates by age group, global, 1990–2023 (<1 year not estimated—asthma estimates are zero at that age). (d) Global ASPR, 1990–2023, with an illustrative log-linear extrapolation to 2050 (dashed line with shaded 95% band; diamond: 2050 point estimate of 4,314 per 100,000, EAPC +0.01%/yr); the extrapolation is illustrative only and is not a formal forecast. Data: GBD 2023 Results (IHME), version 8352 [11,25]. ASPR, age-standardized prevalence rate; CI, confidence interval; DALY, disability-adjusted life-year; GBD, Global Burden of Disease; IHME, Institute for Health Metrics and Evaluation; SDI, Socio-demographic Index.
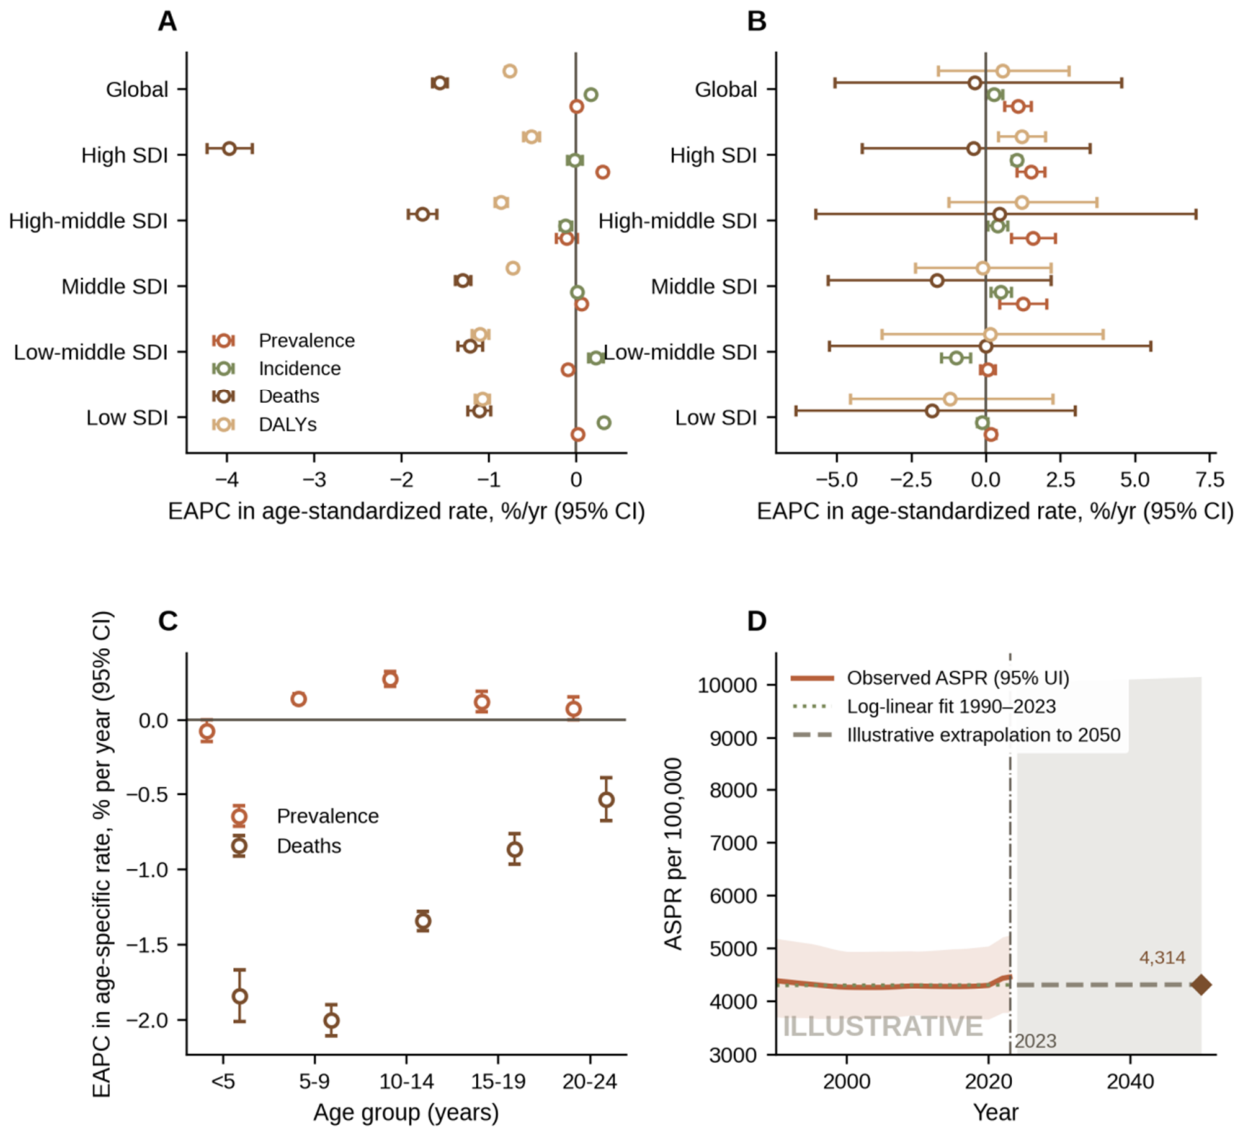

Table 1.
Global asthma burden at ages 0–24 years, 1990, 2019 and 2023: numbers and crude rates (per 100,000) with 95% uncertainty intervals (UI).
Table 1.
Global asthma burden at ages 0–24 years, 1990, 2019 and 2023: numbers and crude rates (per 100,000) with 95% uncertainty intervals (UI).
| Measure | Number 1990 (95% UI) | Crude rate 1990 | Number 2019 (95% UI) | Crude rate 2019 | Number 2023 (95% UI) | Crude rate 2023 | Number %Δ 1990→2023 | Number %Δ 2019→2023 | Rate %Δ 1990→2023 |
|---|---|---|---|---|---|---|---|---|---|
| Prevalence | 122,561,084 (83,729,789–178,843,676) | 4,460.29 (3,047.13–6,508.55) | 148,249,750 (102,593,073–212,839,033) | 4,589.48 (3,176.05–6,589.02) | 150,837,112 (103,730,853–218,576,263) | 4,608.73 (3,169.43–6,678.46) | +23.1% | +1.8% | +3.3% |
| Incidence | 37,635,648 (21,689,545–59,733,784) | 1,369.65 (789.33–2,173.86) | 47,271,029 (27,771,455–74,745,362) | 1,463.40 (859.74–2,313.95) | 46,439,969 (27,085,452–74,068,215) | 1,418.94 (827.58–2,263.11) | +23.4% | −1.8% | +3.6% |
| Deaths | 27,289 (17,225–38,141) | 0.99 (0.63–1.39) | 21,320 (15,008–28,742) | 0.66 (0.46–0.89) | 22,126 (15,409–32,090) | 0.68 (0.47–0.98) | −18.9% | +3.8% | −31.9% |
| DALYs | 7,076,981 (4,791,360–10,151,643) | 257.55 (174.37–369.44) | 7,604,539 (4,963,362–11,290,541) | 235.42 (153.65–349.53) | 7,753,206 (5,069,966–11,580,326) | 236.89 (154.91–353.83) | +9.6% | +2.0% | −8.0% |
| YLDs | 4,903,839 (2,814,925–8,019,240) | 178.46 (102.44–291.84) | 5,944,251 (3,422,544–9,564,456) | 184.02 (105.95–296.09) | 6,038,919 (3,459,524–9,786,428) | 184.52 (105.70–299.02) | +23.1% | +1.6% | +3.4% |
| YLLs | 2,173,142 (1,364,127–3,047,655) | 79.09 (49.64–110.91) | 1,660,288 (1,165,458–2,242,356) | 51.40 (36.08–69.42) | 1,714,287 (1,188,757–2,488,662) | 52.38 (36.32–76.04) | −21.1% | +3.3% | −33.8% |
Table 2.
Asthma burden at ages 0–24 years by Socio-demographic Index (SDI) quintile, 2023.
| SDI quintile | Prevalent cases 2023 (95% UI) | Prevalence %Δ 1990→2023 | Deaths 2023 (95% UI) | Deaths %Δ 1990→2023 | DALYs 2023 (95% UI) | DALYs %Δ 1990→2023 | ASPR per 100,000 (95% UI) | ASMR per 100,000 (95% UI) | ASDR per 100,000 (95% UI) |
|---|---|---|---|---|---|---|---|---|---|
| High | 47,583,991 (35,267,575–65,168,407) | −5.0% | 996 (843–1,206) | −67.9% | 1,983,418 (1,225,220–3,049,741) | −11.8% | 6,031.60 (5,158.15–7,206.30) | 1.14 (0.94–1.56) | 263.41 (173.50–361.80) |
| High-middle | 24,279,847 (15,954,532–35,526,279) | −7.5% | 1,580 (1,172–2,227) | −54.8% | 1,094,385 (668,523–1,721,636) | −17.9% | 3,866.05 (3,278.86–4,572.73) | 3.86 (2.71–5.77) | 243.26 (182.66–321.58) |
| Middle | 21,137,987 (13,680,205–31,792,684) | +22.4% | 3,495 (2,391–4,932) | −32.6% | 1,119,651 (717,682–1,695,563) | +0.8% | 4,648.72 (3,870.71–5,595.17) | 7.92 (5.59–12.24) | 378.70 (287.82–496.05) |
| Low-middle | 18,498,580 (11,940,481–27,988,220) | +50.5% | 3,810 (2,574–5,869) | −24.2% | 1,027,503 (661,158–1,558,712) | +15.8% | 3,498.52 (2,921.33–4,168.29) | 13.96 (7.99–24.44) | 451.30 (318.62–656.80) |
| Low | 39,161,834 (24,948,249–59,274,407) | +137.7% | 12,227 (7,909–18,218) | +17.0% | 2,519,809 (1,660,103–3,715,282) | +69.3% | 3,604.56 (3,041.15–4,302.52) | 15.56 (9.02–24.89) | 504.34 (359.21–735.66) |
Data source: GBD 2023, version 8352 [11,25]. Counts are 0–24-year sums of the official <5-years aggregate and the 5–9- through 20–24-year bands (both sexes; UIs approximated by summing bounds). ASPR/ASMR/ASDR are whole-population age-standardized rates from GBD aggregate rows, not 0–24-year-restricted rates. Incidence, YLD, and YLL columns and official under-20 crude rates (prevalence: High 6,944.57 to Low 4,143.47; mortality: High 0.12 to Low 1.12 per 100,000) are in the supplementary table archive. SDI quintiles are as provided by the GBD Results Tool for GBD 2023; quintile membership is round-specific. ASPR, age-standardized prevalence rate; ASMR, age-standardized mortality rate; ASDR, age-standardized DALY rate.
Table 3.
Asthma burden at ages 0–24 years in the 21 GBD regions, 2023 (ranked by prevalent cases, descending).
Table 3.
Asthma burden at ages 0–24 years in the 21 GBD regions, 2023 (ranked by prevalent cases, descending).
| Rank | GBD region | Prevalent cases 0–24, 2023 (95% UI) | Deaths 0–24, 2023 (95% UI) | DALYs 0–24, 2023 (95% UI) | ASPR per 100,000 (95% UI) | ASMR per 100,000 (95% UI) | ASDR per 100,000 (95% UI) |
|---|---|---|---|---|---|---|---|
| 1 | North Africa and Middle East | 16,456,112 (11,225,709–23,814,918) | 919 (556–1,455) | 730,132 (451,937–1,138,659) | 5,144.5 (4,353.8–6,213.7) | 5.77 (3.99–8.13) | 313.8 (232.8–412.9) |
| 2 | South Asia | 15,704,819 (9,829,774–24,102,759) | 5,222 (3,312–8,192) | 1,014,873 (665,053–1,511,080) | 2,475.2 (2,062.2–2,953.3) | 15.40 (8.43–26.91) | 434.1 (288.1–674.3) |
| 3 | Eastern Sub-Saharan Africa | 15,000,099 (9,289,310–23,056,798) | 3,552 (2,183–5,494) | 875,643 (559,838–1,328,345) | 4,323.5 (3,555.4–5,260.8) | 14.79 (9.18–23.26) | 513.4 (367.2–732.2) |
| 4 | Southeast Asia | 14,547,568 (9,216,895–22,030,898) | 4,481 (2,970–6,406) | 930,039 (620,575–1,364,188) | 4,778.2 (3,970.3–5,735.6) | 12.58 (8.90–19.50) | 508.7 (394.9–669.9) |
| 5 | High-income North America | 14,386,959 (10,881,246–19,002,256) | 320 (272–379) | 599,535 (380,581–888,884) | 11,044.5 (9,327.4–13,130.2) | 0.79 (0.70–0.88) | 461.0 (313.1–644.8) |
| 6 | East Asia | 13,050,793 (8,205,140–20,256,689) | 183 (115–294) | 540,923 (292,065–927,880) | 3,118.7 (2,577.3–3,732.2) | 1.14 (0.72–1.94) | 143.5 (94.8–199.9) |
| 7 | Western Sub-Saharan Africa | 12,211,525 (7,595,647–18,827,911) | 4,715 (2,966–7,300) | 866,678 (565,074–1,293,561) | 3,302.9 (2,741.4–4,058.8) | 8.51 (5.56–13.22) | 368.5 (275.3–499.0) |
| 8 | Western Europe | 9,324,982 (7,071,766–12,381,355) | 113 (100–129) | 381,416 (239,795–577,337) | 7,687.7 (6,600.2–9,187.8) | 0.65 (0.57–0.73) | 317.3 (204.3–445.0) |
| 9 | Central Latin America | 8,343,884 (5,553,797–12,144,561) | 236 (191–297) | 353,458 (212,863–557,291) | 6,418.0 (5,414.8–7,689.8) | 1.09 (0.95–1.32) | 283.0 (193.5–386.6) |
| 10 | Tropical Latin America | 8,279,003 (5,175,190–12,529,204) | 205 (175–241) | 347,318 (194,437–574,104) | 8,810.9 (7,264.5–10,813.7) | 1.17 (1.07–1.27) | 380.7 (252.1–542.9) |
| 11 | Central Sub-Saharan Africa | 6,231,130 (4,087,706–9,258,068) | 1,123 (702–1,773) | 335,768 (215,597–507,847) | 5,553.4 (4,654.3–6,715.8) | 15.15 (7.51–25.58) | 580.8 (403.0–846.1) |
| 12 | Andean Latin America | 2,772,161 (1,790,147–4,078,624) | 108 (64–184) | 120,254 (71,775–191,672) | 6,231.6 (5,078.7–7,594.7) | 0.92 (0.67–1.35) | 277.6 (187.7–384.9) |
| 13 | Caribbean | 2,205,786 (1,445,333–3,224,903) | 181 (117–271) | 102,491 (62,373–157,045) | 8,759.6 (7,252.7–10,529.7) | 3.31 (2.70–4.31) | 458.2 (324.9–615.1) |
| 14 | Eastern Europe | 2,086,021 (1,332,692–3,151,224) | 26 (21–32) | 85,818 (47,815–141,713) | 4,162.8 (3,423.8–5,125.9) | 0.40 (0.34–0.47) | 172.3 (110.1–245.1) |
| 15 | Southern Latin America | 2,080,226 (1,466,972–2,905,564) | 18 (14–23) | 84,857 (48,884–133,454) | 6,511.6 (5,417.7–7,768.4) | 0.83 (0.70–0.98) | 277.1 (180.7–386.5) |
| 16 | High-income Asia Pacific | 2,023,316 (1,372,577–2,933,724) | 19 (12–36) | 82,856 (47,132–133,003) | 4,870.2 (4,046.7–5,962.8) | 0.64 (0.40–1.39) | 204.4 (129.2–290.4) |
| 17 | Southern Sub-Saharan Africa | 1,840,126 (1,148,226–2,816,512) | 536 (365–794) | 115,843 (76,299–171,831) | 4,182.3 (3,475.7–5,149.1) | 12.58 (9.55–16.44) | 482.2 (372.5–607.7) |
| 18 | Australasia | 1,527,732 (1,029,781–2,197,895) | 27 (23–31) | 63,074 (36,479–100,546) | 13,364.4 (10,910.1–16,540.6) | 1.04 (0.90–1.16) | 554.1 (361.5–784.8) |
| 19 | Central Europe | 1,195,222 (802,594–1,718,982) | 7 (6–8) | 48,648 (27,634–79,822) | 4,270.1 (3,535.8–5,190.3) | 0.86 (0.75–1.09) | 183.0 (118.6–255.1) |
| 20 | Central Asia | 849,621 (532,108–1,326,347) | 65 (51–83) | 39,356 (23,752–63,890) | 2,258.8 (1,830.2–2,775.4) | 5.33 (4.50–6.26) | 196.1 (158.4–240.1) |
| 21 | Oceania | 720,026 (452,567–1,104,405) | 71 (38–123) | 34,227 (20,195–54,314) | 6,834.1 (5,509.2–8,386.3) | 18.13 (10.61–32.19) | 660.6 (459.7–979.0) |
Data source: GBD 2023, version 8352 [11,25]. Numbers are 0–24-year sums over the official <5-years aggregate and the four five-year bands (both sexes; UIs approximated). Under this aggregation, Southeast Asia (rank 4) and high-income North America (rank 5) exchange positions relative to a fine-age-band sum that omits the 1-year age group. ASPR/ASMR/ASDR are whole-population age-standardized rates per 100,000.
Table 4.
The 15 countries with the largest number of prevalent asthma cases at ages 0–24 years, 2023.
Table 4.
The 15 countries with the largest number of prevalent asthma cases at ages 0–24 years, 2023.
| Rank | Country | Prevalent cases 0–24, 2023 (95% UI) | Share of global 0–24 cases | ASPR per 100,000 (95% UI) | Deaths 0–24, 2023 (95% UI) |
|---|---|---|---|---|---|
| 1 | United States of America | 12,899,076 (9,392,578–17,505,494) | 8.6% | 10,974.5 (9,069.5–13,288.3) | 305 (239–381) |
| 2 | China | 12,310,357 (7,635,789–19,272,842) | 8.2% | 3,066.8 (2,529.4–3,675.7) | 171 (83–314) |
| 3 | India | 11,121,052 (6,798,180–17,245,103) | 7.4% | 2,334.0 (1,934.0–2,809.0) | 2,625 (1,317–4,869) |
| 4 | Brazil | 8,045,567 (5,026,426–12,195,414) | 5.3% | 8,906.3 (7,350.5–10,931.9) | 199 (161–244) |
| 5 | Nigeria | 5,963,146 (3,631,324–9,232,905) | 4.0% | 3,525.3 (2,907.5–4,365.5) | 2,162 (1,210–3,592) |
| 6 | Indonesia | 5,757,884 (3,464,386–8,943,152) | 3.8% | 4,873.6 (4,039.3–5,913.5) | 2,217 (1,018–3,856) |
| 7 | Democratic Republic of the Congo | 3,844,750 (2,426,190–5,832,348) | 2.5% | 5,384.1 (4,454.7–6,586.2) | 730 (358–1,340) |
| 8 | Pakistan | 3,399,828 (2,083,871–5,316,681) | 2.3% | 4,390.2 (3,555.1–5,278.5) | 753 (330–1,581) |
| 9 | Philippines | 3,306,996 (2,055,048–5,073,116) | 2.2% | 5,783.0 (4,791.9–6,992.2) | 974 (585–1,461) |
| 10 | Mexico | 3,254,050 (2,216,903–4,673,506) | 2.2% | 4,909.4 (4,179.1–5,831.2) | 79 (59–104) |
| 11 | Ethiopia | 3,192,066 (1,939,034–4,982,397) | 2.1% | 3,944.0 (3,235.8–4,840.1) | 897 (403–1,655) |
| 12 | Egypt | 3,132,785 (2,068,473–4,700,264) | 2.1% | 4,974.9 (4,164.8–6,035.9) | 163 (78–348) |
| 13 | United Republic of Tanzania | 2,392,341 (1,487,056–3,645,720) | 1.6% | 4,808.4 (3,890.1–5,885.3) | 513 (243–969) |
| 14 | United Kingdom | 2,129,795 (1,511,120–3,020,288) | 1.4% | 10,302.9 (8,506.0–12,928.5) | 47 (38–58) |
| 15 | Uganda | 2,095,407 (1,324,682–3,260,084) | 1.4% | 5,313.5 (4,369.5–6,898.5) | 403 (181–806) |
Data source: GBD 2023, version 8352 [11,25]. Cases are both-sexes sums of the official country-level <5-years aggregate (which includes the 1-year age group) plus the 5–9- through 20–24-year bands; deaths are male plus female 0–24-year sums on the same basis (UIs approximated by summing bounds). ASPR is the whole-population age-standardized prevalence rate. Shares use the global 0–24-year total of 150,837,112.
Table 5.
Estimated annual percentage change (EAPC) in age-standardized asthma rates, 1990–2023 and 2019–2023, globally and by SDI quintile.
Table 5.
Estimated annual percentage change (EAPC) in age-standardized asthma rates, 1990–2023 and 2019–2023, globally and by SDI quintile.
| Location | Measure | EAPC 1990–2023, %/yr (95% CI) | EAPC 2019–2023, %/yr (95% CI) |
|---|---|---|---|
| Global | Prevalence | +0.01 (−0.04 to +0.05) | +1.07 (+0.63 to +1.52) |
| Global | Incidence | +0.17 (+0.14 to +0.20) | +0.27 (−0.01 to +0.55) |
| Global | Deaths | −1.56 (−1.64 to −1.48) | −0.38 (−5.07 to +4.55) |
| Global | DALYs | −0.76 (−0.81 to −0.72) | +0.56 (−1.60 to +2.78) |
| High SDI | Prevalence | +0.31 (+0.26 to +0.35) | +1.51 (+1.05 to +1.97) |
| High SDI | Incidence | −0.01 (−0.10 to +0.07) | +1.03 (+0.88 to +1.18) |
| High SDI | Deaths | −3.97 (−4.23 to −3.71) | −0.41 (−4.16 to +3.48) |
| High SDI | DALYs | −0.51 (−0.60 to −0.42) | +1.21 (+0.42 to +2.00) |
| High-middle SDI | Prevalence | −0.11 (−0.23 to +0.02) | +1.58 (+0.85 to +2.32) |
| High-middle SDI | Incidence | −0.12 (−0.18 to −0.05) | +0.39 (+0.06 to +0.72) |
| High-middle SDI | Deaths | −1.76 (−1.92 to −1.60) | +0.46 (−5.71 to +7.03) |
| High-middle SDI | DALYs | −0.86 (−0.93 to −0.79) | +1.21 (−1.24 to +3.72) |
| Middle SDI | Prevalence | +0.06 (+0.03 to +0.10) | +1.24 (+0.45 to +2.03) |
| Middle SDI | Incidence | +0.02 (−0.01 to +0.04) | +0.51 (+0.16 to +0.85) |
| Middle SDI | Deaths | −1.30 (−1.38 to −1.21) | −1.64 (−5.30 to +2.17) |
| Middle SDI | DALYs | −0.72 (−0.76 to −0.68) | −0.11 (−2.36 to +2.18) |
| Low-middle SDI | Prevalence | −0.09 (−0.14 to −0.05) | +0.06 (−0.19 to +0.32) |
| Low-middle SDI | Incidence | +0.23 (+0.14 to +0.32) | −1.01 (−1.49 to −0.52) |
| Low-middle SDI | Deaths | −1.21 (−1.36 to −1.07) | −0.01 (−5.24 to +5.51) |
| Low-middle SDI | DALYs | −1.10 (−1.19 to −1.00) | +0.15 (−3.48 to +3.92) |
| Low SDI | Prevalence | +0.02 (−0.01 to +0.06) | +0.17 (+0.02 to +0.32) |
| Low SDI | Incidence | +0.32 (+0.28 to +0.35) | −0.12 (−0.29 to +0.06) |
| Low SDI | Deaths | −1.11 (−1.24 to −0.98) | −1.81 (−6.37 to +2.98) |
| Low SDI | DALYs | −1.08 (−1.16 to −0.99) | −1.21 (−4.54 to +2.25) |
Data source: GBD 2023, version 8352 [11,25]. EAPCs derive from log-linear regression, ln(rate) = a + b·year, on official whole-population age-standardized rates (both sexes); 95% CIs come from the ordinary least-squares standard error of the slope (t distribution) and reflect regression precision only. Short-window (2019–2023) EAPCs rest on five annual observations; “stable” should be read as “not statistically distinguishable from no change.”.
Disclaimer/Publisher’s Note: The statements, opinions and data contained in all publications are solely those of the individual author(s) and contributor(s) and not of MDPI and/or the editor(s). MDPI and/or the editor(s) disclaim responsibility for any injury to people or property resulting from any ideas, methods, instructions or products referred to in the content. |
© 2026 by the authors. Licensee MDPI, Basel, Switzerland. This article is an open access article distributed under the terms and conditions of the Creative Commons Attribution (CC BY) license (http://creativecommons.org/licenses/by/4.0/).
Copyright: This open access article is published under a Creative Commons CC BY 4.0 license, which permit the free download, distribution, and reuse, provided that the author and preprint are cited in any reuse.