

Submitted:
27 October 2026
Posted:
28 October 2026
You are already at the latest version
Preprints on COVID-19 and SARS-CoV-2
Abstract
Background Post-pandemic resurgence of childhood respiratory pathogens has been documented by case-based surveillance, but case counts are sensitive to testing behaviour. Whether the mortality rebound is uniform or structured is unknown. We phenotyped the 2019–2023 collapse and rebound of modelled childhood deaths from 29 respiratory infectious causes across 204 countries.Methods We assembled a country × cause panel of Global Burden of Disease Study 2023 death estimates at ages 0–19 years (26 lower-respiratory-infection aetiologies, tuberculosis, pertussis and COVID-19). For each cell we defined collapse (2019→2021), rebound (2021→2023) and net change (2019→2023), classified the 1,917 stable cells (2019 deaths ≥20; 1,800 non-COVID-19 and 117 COVID-19) into six phenotypes using declared thresholds, and handled COVID-19 separately as a peak-fade metric. Reporting follows GATHER.Findings The rebound was phenotypically structured, not uniform. Pertussis rebounded in 85 of 87 evaluable countries (98%; median +168%) yet only 32% exceeded their 2019 baseline—a rebound without overshoot, excess concentrated in sub-Saharan Africa. Influenza and respiratory syncytial virus showed a near-universal V-with-shortfall: fast rebound in 70.5% and 72.5% of countries, but median net change near −50%. Only Latin America and the Caribbean sat above baseline, marginally (+0.9%), against −17.0% in high-income countries. COVID-19 deaths faded by a median 73%, resurging in six countries, five late-exit settings. Pneumococcal rebound was uncorrelated with conjugate-vaccine coverage (ρ = 0.00).Interpretation Post-pandemic mortality rebounded as distinct, geographically structured phenotypes, not a single global wave; mortality readouts complement incidence surveillance and locate where the rebound window remains open.
Keywords:
COVID-19
; post-pandemic rebound
; childhood respiratory infections
; mortality
; global burden of disease
; rebound
; child mortality
; pertussis
; respiratory syncytial virus
; influenza
; atlas
1. Introduction
1.1. Surveillance Has Documented Resurgence, but Through a Testing Lens
As COVID-19 restrictions were lifted, case-based surveillance systems across the world reported the return of childhood respiratory pathogens, often out of season and at unusual intensity. Respiratory syncytial virus (RSV) and influenza resurged asynchronously across countries: off-season RSV epidemics followed the easing of restrictions in Australia [1], and a global multi-country analysis documented that the timing, magnitude and age structure of viral resurgence differed markedly between settings even within the same region [2,3]. Mycoplasma pneumoniae, near-absent worldwide through 2020–2021, re-emerged from late 2023 first in Asia and then Europe, tracked prospectively by the ESGMAC surveillance network and confirmed in US hospital data, where the paediatric re-emergence was large enough to warrant a national field note [4,5,6]. Pertussis produced the most striking 2023–2024 signal: US reports in 2024 exceeded six times the 2023 count and surpassed the pre-pandemic 2019 level, reaching the highest annual total since 2012 [7,8]; the EU/EEA notification rate reached 54.9 per 100,000 in 2024, over eight times the 2023 rate and 78 times the 2022 rate9; and a marked resurgence, including a macrolide-resistant isolate, was documented in France [10]. These observations motivated the immune-debt hypothesis: that interrupted exposure depleted population immunity, storing up susceptibility that would be repaid, possibly with interest, once transmission resumed [11,12,13,14]. Proposed prospectively for paediatric viral illness, it was later claimed as confirmed by the recrudescence of respiratory and invasive bacterial disease in France and elsewhere [11,12,14].
Case-based surveillance, however, measures detected infections, and detection is behaviour. Testing intensity, multiplex-panel uptake, clinical awareness, healthcare-seeking and reporting completeness all shifted during and after the pandemic, in ways that differ across countries and pathogens; the same ECDC report that documents the eightfold pertussis rise notes that the pandemic accelerated improvements in testing capacity and altered testing practices9. A resurgence measured in notifications therefore mixes epidemiology with ascertainment, and cross-country comparisons of resurgence intensity inherit each country's surveillance idiosyncrasies: a doubling of reported cases in a country that doubled its testing is not commensurable with a doubling in one that did not. This matters for the immune-debt debate, because the hypothesis is fundamentally about severe disease in susceptible children, yet the evidence brought to bear on it is predominantly mild-disease incidence. Mortality offers a complementary readout. Deaths are rarer and lag transmission, and they cannot resolve seasonality or age shifts, but they are far less sensitive to testing fashion and they anchor the resurgence question to the outcome that intervention ultimately targets. If the post-pandemic years truly repaid an immune debt with interest, the signature should be visible not only in case counts but in deaths exceeding pre-pandemic baselines; conversely, a mortality map that stays at or below baseline while notifications surge would redirect interpretation towards ascertainment and mild-disease volume.
1.2. Modelled Mortality as an Independent Readout, and an Unanswered National Question
The Global Burden of Disease (GBD) study provides cause-specific childhood mortality estimates for 204 countries through 2023, spanning the full perturbation window from the 2019 pre-pandemic baseline through the 2021 disruption trough to the 2023 recovery year [15,16]. Because GBD estimates integrate vital registration, surveillance and covariate-driven models, they are not independent of data availability, but they apply one standardized estimation framework to all countries and causes, removing cross-national heterogeneity in case ascertainment. Integrated across causes, the childhood respiratory mortality spectrum traces a global V-shape over this window: a 2019→2021 collapse followed by a 2021→2023 rebound. What that global V-shape conceals is geography. An aggregate V-shape can arise from near-identical national trajectories, or from strongly divergent ones that average out; the two possibilities have opposite implications for where post-pandemic control efforts should be directed, and they cannot be distinguished at the seven-super-region resolution. Single-cause rebound reports, for mycoplasma and pertussis in particular [4,9], suggest but cannot establish that the rebound's national geography is structured. To our knowledge, no study has mapped, at national scale and across the full cause spectrum, how the mortality rebound is actually distributed.
1.3. Research Questions
Using a 29-cause × 204-country mortality panel for 2019–2023, we asked three questions. First, is the national-level rebound a uniform phenomenon or a set of structured phenotypes, and which causes dominate each phenotype? Second, where do countries land net of the perturbation: which regions have returned above their 2019 mortality baseline and which have settled permanently below it? Third, do the exceptions, late COVID-19 resurgence, extreme outlier rebounds and the causes that missed the rebound window, follow interpretable patterns? We report the answers as a phenotype atlas with fully declared classification thresholds, complementing incidence-based resurgence surveillance with a mortality-based map.
2. Methods
2.1. Data Sources and Panel Construction
We conducted a secondary analysis of GBD 2023 estimates of cause-specific mortality [15,16], integrating four cause modules into a 29-cause spectrum: 26 aetiological attributions within lower respiratory infections (LRI), derived through a counterfactual population-attributable-fraction model in which pathogen-specific proportions are applied to modelled LRI mortality envelopes [16]; tuberculosis and pertussis, modelled directly as causes of death through cause-of-death ensemble and specialized models [15]; and COVID-19, modelled for 2020–2023 with structurally zero estimates before 2020 [15]. Because GBD causes are mutually exclusive and collectively exhaustive, concatenating modules introduces no double counting; the two estimation frameworks generate uncertainty differently (attribution-based versus cause-model draws), and module-specific uncertainty intervals (UIs) are treated as structurally heterogeneous rather than pooled. The analysis population was children and adolescents aged 0–19 years, aggregated from the standard GBD <5, 5–9, 10–14 and 15–19 year groups. The extraction grid covered 204 countries and territories at five timepoints (1990, 2010, 2019, 2021, 2023), yielding 5,916 country × cause cells with point estimates and 95% UIs per year. The present paper analyses this panel at national resolution. The 1990 and 2010 anchors provide secular-trend context for interpreting the 2019 baseline; all phenotype analysis uses the 2019–2023 window, in which 2019 is the last pre-pandemic year, 2021 approximates the disruption trough for non-COVID-19 causes, and 2023 is the most recent estimate year.
2.2. Perturbation Metrics
For each country × cause cell we defined collapse as the percentage change in deaths from 2019 to 2021, rebound as the change from 2021 to 2023, and net change as the change from 2019 to 2023. Collapse measures perturbation depth, rebound measures recovery speed, and net change measures where a country settled relative to its own pre-pandemic baseline; the three metrics jointly separate fast-but-incomplete recovery (large rebound, negative net) from genuine overshoot (positive net), a distinction that any single change measure would obscure. Using each country's own 2019 value as baseline absorbs national differences in reporting and model calibration that would distort cross-country comparisons of levels.
2.3. Stability Filter
Percentage changes on small counts are unstable. We therefore required at least 20 deaths in 2019 for a cell to be phenotype-classified; cells below this threshold (3,999 of 5,916; 68%) are labelled low-count, shaded grey in all maps, and excluded from phenotype statistics. Of the 1,917 stable (hereafter also 'evaluable') cells (32%), 1,800 were non-COVID-19 cells and 117 were COVID-19 cells meeting the cause-specific filter below. The filter preferentially excludes small states and high-income countries with low paediatric mortality, a bias we declare and return to in the limitations.
2.4. Phenotype Classification
Stable non-COVID-19 cells were assigned to six mutually exclusive phenotypes using thresholds calibrated empirically from the panel's collapse and rebound distributions, as described below, and held fixed across all causes and countries: inertial (absolute collapse <10%); pandemic-amplified (deaths rose through the pandemic window, collapse ≥ +10%); deep collapse (≤ −30%), split into deep-collapse + fast-rebound (rebound ≥ +20%) versus deep-collapse + stalled (rebound < +20%); and shallow collapse (−30% to −10%), split into shallow-collapse + rebound versus shallow-collapse + no-rebound by the same +20% rebound threshold. The 10% inertial band reflects the year-to-year variability of modelled estimates; the −30% deep-collapse boundary was calibrated so that the global viral collapses in this panel (−62.6% for influenza and −65.2% for respiratory syncytial virus, recomputed here from the same GBD 2023 extracts) classify as deep, while the modal bacterial collapse (−15% to −25%) classifies as shallow; the +20% rebound threshold is deliberately lower in absolute terms than the collapse thresholds because recovery starts from a diminished denominator. Cells with rebound above +50% were additionally flagged as outlier grids for separate examination. A cell was classified net-above-baseline when net change exceeded zero.
2.5. COVID-19 Peak-Fade Metric
COVID-19 has no 2019 baseline, so collapse and net change are undefined. We classified COVID-19 cells with at least 20 deaths in 2021 (n = 117) by peak-fade, the percentage change from 2021 to 2023: fade (≤ −20%), persistent (strictly between −20% and +20%) and resurgent (≥ +20%). Peak-fade measures change relative to 2021 rather than from each country's true peak; where paediatric COVID-19 deaths peaked only in 2022 (for example under later Omicron waves), a 2021→2023 rise can reflect a peak that had not yet occurred in 2021, and such countries may be classified persistent or resurgent without a true resurgence from a past peak.
2.6. Vaccine-Coverage Linkage (Descriptive)
We linked country-level pneumococcal rebound and net change to third-dose pneumococcal conjugate vaccine (PCV3) coverage from the WHO/UNICEF Estimates of National Immunization Coverage (WUENIC) [17], computing Spearman correlations between 2019 PCV3 coverage and the Streptococcus pneumoniae rebound, and between 2023 PCV3 coverage and the pneumococcal net change, across the 109 countries with stable pneumococcal cells. Because coverage already enters the GBD attribution model as a covariate [16], this analysis interrogates the resulting estimates and is descriptive only; WUENIC zeros denote non-introduction rather than true zero protection.
2.7. Uncertainty, Model Properties and Safeguards
GBD 2021 and 2023 values are model-based estimates, not direct counts, and the pandemic years carry additional modelling uncertainty because data flows were themselves disrupted. We propagated uncertainty by combining UI half-widths relative to point estimates in quadrature for each change metric, and we report the resulting relative UI half-widths alongside the estimates; across the 1,800 stable non-COVID-19 cells the median relative UI half-width was 0.55 for collapse, 0.57 for rebound and 0.54 for net change, so single-cell point changes should not be over-read. Because single country × cause changes are frequently compatible with a wide range of values, we prioritized medians and distributional shares (percentages of countries in a phenotype) over single country values throughout, reserving country names for clusters corroborated across multiple causes or for explicitly flagged outliers. Three safeguards address percentage artefacts: the stability filter removes small denominators (§2.3); extreme rebounds arising from near-zero 2021 denominators are flagged as outlier grids and reported with their absolute death counts so that percentage and magnitude can be read together; and choropleth maps cap displayed rebound at +300%. Phenotype thresholds (§2.4) were held fixed across all causes and countries, and no multiplicity adjustment was applied because the analysis is descriptive, with the two pre-specified Spearman correlations reported at two-sided α = 0.05. Analyses were performed in Python (pandas, NumPy, SciPy). The study follows the Guidelines for Accurate and Transparent Health Estimates Reporting (GATHER) [18] and used publicly available, de-identified, aggregate modelled estimates, exempt from ethics review.
2.8. External Cross-Check Against WHO Case Surveillance
As an external validation, we repeated the collapse, rebound and net-change computation for pertussis—the headline rebound cause—using nationally reported pertussis case counts from the WHO Global Health Observatory (indicator WHS3_43, Pertussis - number of reported cases; accessed 12 October 2026). We applied the same phenotype thresholds (§2.4) and an analogous stability filter (≥20 reported cases in 2019), then compared global-level perturbation metrics and, for countries evaluable in both sources, country-level rebound classification, reporting raw concordance and Cohen's kappa (Supplementary Table S7). Global case metrics are computed on a fixed panel of countries reporting in all three years (2019, 2021 and 2023) with ≥20 cases in 2019 (n = 77), giving a constant denominator comparable in design to the fixed GBD country panel; sums over all countries reporting in each single year (n = 167, 159 and 173 respectively) mix denominators across years and are reported for traceability only (Supplementary Table S7).
3. Results
3.1. A Structured Phenotype Landscape Across 1,917 Evaluable Cells
Of 5,916 country × cause cells, 1,917 (32%) passed the stability filter and were phenotype-classified; the remaining 68% were low-count and are shaded grey throughout. Among the 1,800 stable non-COVID-19 cells, no single phenotype dominated (Figure 1b): shallow-collapse + no-rebound was most frequent (536 cells; 29.8%), followed by inertial (424; 23.6%), shallow-collapse + rebound (416; 23.1%), deep-collapse + fast-rebound (283; 15.7%), deep-collapse + stalled (99; 5.5%) and pandemic-amplified (42; 2.3%). Only 7 of 29 causes ended 2023 above their 2019 global death total (median cause net change −3.1%). Leading-cause summaries are given in Table 1, and phenotype composition for the six leading causes in Table 2. Figure 1a plots national collapse against rebound for all stable cells: the cloud traces the collapse–rebound coupling visible in the panel's global totals (recomputed here from the same GBD 2023 extracts), but with wide national dispersion around the full-recovery diagonal, indicating that the global V-shape averages over strongly divergent national trajectories. Cells below the diagonal (rebound smaller in magnitude than collapse) dominate, consistent with this shortfall pattern; cells above the diagonal, where 2023 deaths exceed what full recovery would imply, are uncommon and concentrated in the cause-region combinations examined below. Median relative UI half-widths across stable cells were 0.55 for collapse, 0.57 for rebound and 0.54 for net change, so medians and shares are reported in preference to single-cell values; per-cause values were narrowest for Streptococcus pneumoniae (0.47) and widest for pertussis (1.93).
Global totals are sums of national estimates; country-level columns summarize the distribution across stable cells (2019 deaths ≥20; COVID-19: 2021 deaths ≥20, peak-fade 2021→2023). n/a, not applicable (no 2019 baseline). Percentage changes computed from unrounded values. For COVID-19 the final two columns report the share of countries fading by more than 20% and the number (%) resurgent under the peak-fade metric (§2.5); the COVID-19 median fade is taken across the 117 evaluable countries (the median across all 204 countries is −71.9%).
Each row covers the cause's stable cells (country counts as in Table 1); rows may not sum to 100% owing to rounding. COVID-19 is classified separately (§2.5).
3.2. Pertussis: A Pan-National Rebound Without Overshoot
Pertussis showed the broadest rebound signature in the atlas (Figure 1 and Figure 2). Global paediatric pertussis deaths fell from 125,461 in 2019 to 53,487 in 2021 (−57.4%) and rebounded to 112,839 in 2023 (+111.0%; net −10.1%), the only cause whose global rebound exceeded 100%. The rebound was pan-national rather than driven by a few countries: 85 of 87 evaluable countries (97.7%) rebounded, the median national rebound was +167.6%, and 77 countries (88.5%) rebounded by more than 50%; 93.1% of evaluable countries sat in the deep-collapse + fast-rebound phenotype, the most concentrated phenotype assignment of any cause (Table 2). Yet the median national net change was only −6.8%, and just 28 of 87 countries (32.2%) exceeded their 2019 baseline. The overshooting minority was geographically concentrated: Mozambique (+45.2% net), Niger (+16.1%), Chad (+11.3%), Côte d'Ivoire (+11.8%) and Uganda (+9.0%) are all in sub-Saharan Africa, the region that also holds most of the global pertussis burden (63.8% of 2019 global pertussis deaths in this panel, recomputed here from the same GBD 2023 extracts). Country-level pertussis classification carries the widest uncertainty in the atlas (median relative UI half-width on net change 1.93, meaning the interval on the net change exceeds the point change), so individual national signs are tentative even though the global +111% rebound and the near-universality of positive rebounds are robust.
External validation against WHO-reported pertussis cases was directionally concordant at the global level: on a fixed panel of 77 countries reporting in all three years (2019, 2021 and 2023) and with ≥20 reported cases in 2019, reported cases collapsed by 86.4% from 2019 to 2021 and rebounded by 726.3% from 2021 to 2023 (net +12.7%), reproducing the deep-collapse + fast-rebound signature seen in mortality (−57.4%, +111.0%, net −10.1%); the larger case-based amplitude is consistent with the testing-behaviour sensitivity of incidence surveillance. (global case metrics are now computed on this constant-denominator fixed panel; the earlier all-reporting-countries sums (−79.5%, +432.9%, net +9.0%) mix 167, 159 and 173 countries across the three years and are retained for traceability only (Supplementary Table S7).) Across the 67 panel countries with a non-zero 2021 denominator, 83.6% rebounded by 2023, mirroring the near-universal mortality rebound (97.7%). Country-level cross-classification was limited by overlap—only 25 countries were evaluable in both sources because pertussis mortality rarely reaches the 20-death stability threshold—yielding raw rebound concordance of 60% with a near-zero kappa (−0.08), an uninformative value driven by the near-absence of non-rebounding mortality cells (24 of 25 overlapping countries rebounded); the case-based overshoot at the global level (net +12.7%) against the mortality shortfall (net −10.1%) delineates where detection-based and mortality readouts diverge (Supplementary Table S7). (this cross-check compares WHO all-age reported case counts against GBD modelled deaths at ages 0–19 years; the two calibers are asymmetric, and with n = 25 overlapping countries the concordance statistics are not powered for formal testing.)
3.3. Respiratory Viruses: A Near-Universal V-with-Shortfall
Beyond pertussis (93.1%; §3.2), influenza and RSV were the only other causes dominated by the deep-collapse + fast-rebound phenotype (70.5% and 72.5% of evaluable countries; Table 2, Figure 1b), with the remainder almost entirely deep-collapse + stalled. Despite median national rebounds of +65.3% (influenza) and +107.3% (RSV), median net change remained −48.1% and −50.5%, and only 3.4% and 3.3% of countries had returned above baseline by 2023. The 2023 viral rebound is therefore real but partial nearly everywhere: a V whose right arm stops halfway. We identified 206 outlier grids with rebound above +50%; they were dominated by pertussis (77 cells), RSV (53) and influenza (49) and clustered in sub-Saharan Africa (57), Latin America and the Caribbean (52), Southeast Asia, East Asia and Oceania (37) and North Africa and the Middle East (32). The most extreme values (Table 3) arise where 2021 deaths approached zero, mechanically inflating percentages; these cells are reported with absolute counts and mapped under the +300% cap.
Deaths are point estimates at ages 0–19 years. Extreme percentages arise where 2021 deaths approached zero (denominator artefact); absolute counts and net change are shown alongside. Percentage changes computed from unrounded values. RSV, respiratory syncytial virus.
3.4. Geographic Divergence: Latin America Marginally Above Baseline, High-Income Settings Reset Below
Rebound geography inverted the usual mortality gradient (Figure 1c, Table 4). Latin America and the Caribbean was the only super-region whose median country-level net change lay above zero, and then only marginally (+0.9%, on a median country rebound of +24.6%): given the median relative UI half-width of 0.54 on net change, this median is indistinguishable from zero within uncertainty and is best read as the highest regional value rather than a clearly positive one. The region also had the atlas's highest share of shallow-collapse + rebound cells (36.6%). Peru (median net +26.3% across 18 stable causes), Ecuador (+50.2%), Brazil (+19.6%) and Paraguay (+20.5%) formed a coherent net-above-baseline cluster spanning bacterial and viral causes; 53.5% of the region's stable cells ended above baseline. By contrast, the high-income super-region showed a median national net change of −17.0% with no shallow-collapse + rebound cells at all: where collapse occurred it was not followed by rebound, consistent with a persistent downward reset rather than a V, and 45.8% of its cells were inertial. North Africa and the Middle East (median net −16.9%) was dominated by shallow-collapse + no-rebound (56.7%), an incomplete-recovery profile distinct from both the Latin American overshoot and the high-income reset. Central Europe, Eastern Europe and Central Asia (median net −8.8%) carried the atlas's only substantial pandemic-amplified fraction (28.2% of cells), including the Azerbaijan grids in Table 3, where several causes ended 2023 more than 20% above baseline. Sub-Saharan Africa, holding most of the absolute burden, sat near zero (median net −1.1%) with a mixed phenotype profile. The mycoplasma re-emergence documented in surveillance4,5 was echoed in mortality at national scale: Peru rebounded +116.4% to +35.0% above baseline, while China's mycoplasma net change was −26.0%.
Row percentages refer to stable cells and may not sum to 100 owing to rounding; the final column is the median of country-level median net changes. Cell counts reflect the stability filter, which preferentially excludes low-mortality settings.
3.5. COVID-19: Fast Fade with Six Resurgences, Five in Late-Exit Settings
Paediatric COVID-19 deaths faded rapidly after the 2021 peak: the median national peak-fade was −72.8% (median across the 117 evaluable countries; the median across all 204 countries is −71.9%), and 102 of 117 evaluable countries (87.2%) faded by more than 20%, with only 9 countries classified persistent. Six countries were resurgent (Table 5): China (+1,401.7%), the Lao People's Democratic Republic (+110.1%), Cambodia (+80.3%), Papua New Guinea (+44.5%), Chad (+38.5%) and Japan (+26.6%). Five of the six are settings that exited suppression later than the rest of the world, and their 2023 rise maps onto delayed paediatric waves after the end of zero-COVID or late reopening; Japan's resurgence was small in absolute terms (33.5 deaths in 2023) and may partly reflect a 2022 rather than 2021 paediatric peak (§2.5). Outside China, the resurgent counts remained in the low hundreds, so the signal is one of timing rather than magnitude; China's rise, from 197 to 2,960 deaths, is the only resurgence large enough to move global totals.
Resurgence defined as 2021→2023 change ≥ +20% among countries with ≥20 COVID-19 deaths in 2021 (n = 117); deaths are point estimates at ages 0–19 years, and percentage changes are computed from unrounded values. China's COVID-19 estimates are model-based with wide uncertainty, and the large percentage rests on a small 2021 denominator.
3.6. Tuberculosis Inertia and the Pneumococcal Vaccine Null
Tuberculosis missed the rebound window entirely: 69.0% of evaluable countries were inertial, the median national rebound was −8.0% and the median net change −12.8%, continuing secular decline without a perturbation signature (Table 1 and Table 2). For S. pneumoniae, national rebound intensity was uncorrelated with vaccination: across 109 countries, 2019 PCV3 coverage versus pneumococcal rebound gave Spearman ρ = 0.00 (p = 0.99), and 2023 PCV3 coverage versus net change gave ρ = −0.05 (p = 0.61). The rebound's national differentiation is therefore not explained by conjugate-vaccine coverage at this resolution.
4. Discussion
4.1. Principal Findings: Surveillance Maps Infections, Mortality Maps Deaths
Across 1,917 evaluable country × cause cells, the post-pandemic rebound was not a single wave but a structured set of phenotypes. Three signatures dominated: a pan-national pertussis rebound that in most countries did not overshoot the 2019 baseline; a near-universal V-with-shortfall for influenza and RSV, whose strong 2023 rebounds left deaths near 50% below baseline; and a geographic inversion in which Latin America and the Caribbean was the only super-region at or above baseline (marginally: median net +0.9%, indistinguishable from zero within uncertainty) while high-income settings settled into a persistent downward reset. Around these, tuberculosis stayed inertial, COVID-19 faded fast except in six countries, five of them late-exit settings, and pneumococcal rebound bore no relation to vaccine coverage.
The first implication is a division of labour between measurement systems. Surveillance maps infections; mortality maps deaths. The two need not coincide geographically. The countries with the loudest case-based resurgence reports in 2023–2024, the United States, China and much of Europe4,7,9, are not the countries with the largest mortality rebounds in this atlas; the mortality excess concentrated in sub-Saharan Africa and parts of Latin America. This decoupling is falsifiable and therefore useful. If case resurgence in high-income settings largely reflects ascertainment and mild-disease volume, mortality there should remain at or below baseline, which is what we observe (high-income median net −17.0%). If immune debt were generating severe disease at scale, mortality overshoot should appear where susceptibility accumulated most, yet overshoot is the minority pattern (7 of 29 causes globally; one super-region). The two maps also have different latencies and different policy customers: surveillance guides immediate clinical preparedness, whereas the mortality map identifies where severe-disease prevention failed to recover, information that is invisible to case counts because high-income surveillance is dense precisely where mortality is lowest. Mortality atlases can thus discipline resurgence narratives that case counts alone cannot arbitrate, and the present atlas offers a concrete benchmark: countries whose notifications surge while their mortality stays below baseline are candidates for an ascertainment explanation, whereas countries above both baselines, the sub-Saharan pertussis cluster being the clearest example, warrant programme-level attention.
4.2. Pertussis: Rebound Without Overshoot
Pertussis is the clearest case where the mortality readout reframes the surveillance story. Notifications in 2024 exceeded pre-pandemic levels in the United States and rose eightfold in the EU/EEA [7,8,9], and the immune-debt hypothesis predicts repayment with interest [11,12,13]. Our mortality data show the repayment but not the interest: 98% of evaluable countries rebounded, yet the median country ended 7% below its 2019 baseline and only 32% overshot. Three readings are compatible. Under the immune-debt reading, rebuilt susceptibility restored transmission but vaccination and prior immunity kept severity at or below baseline. Under the ascertainment reading, part of the notification surge is detection recovery, as ECDC itself notes [9], while deaths track a smaller true incidence rebound. Under the mortality-transition reading, the 2019 baseline was itself on a secular decline, so even full epidemiological recovery lands below it. Our design cannot separate these, and the wide pertussis uncertainty intervals (relative UI half-width 1.93 on net change) mean individual national signs are tentative. The concentration of genuine overshoot in sub-Saharan Africa, where pertussis mortality is highest and where pandemic-era disruption of infant immunization was most consequential, is nonetheless the atlas's clearest actionable signal: that is where the rebound window remained open in 2023, and where the 2024 incidence data suggest it stayed open [9,10].
Vaccine type and the durability of vaccine-induced immunity offer a further candidate explanation for rebound without overshoot, tested as a hypothesis-generating candidate in the Supplementary Text.
4.3. The Geographic Inversion
The contrast between Latin America's above-baseline cluster and the high-income downward reset invites a behavioural interpretation, offered descriptively. In high-income settings, no cell showed shallow collapse followed by rebound; where transmission fell, it did not fully return by 2023, consistent with durable changes in contact patterns, hygiene practices, remote work and schooling arrangements and, for influenza, possibly viral-interference aftereffects documented in incidence studies [2,3]. Whether this reset is transient or structural matters beyond the pandemic narrative: if part of the pre-2020 respiratory mortality of high-income children was sustained by contact patterns that have not resumed, the counterfactual against which future vaccine and treatment benefits are measured shifts downward. In much of Latin America, the return was faster and more complete, overshooting for Peru, Ecuador, Brazil and Paraguay across multiple causes simultaneously, a cross-cause coherence that argues against a cause-specific artefact and for a shared exposure-side driver, whether behavioural restoration, health-system strain during the window, or demographic susceptibility. North Africa and the Middle East presents a third profile, dominated by shallow collapse without rebound, suggesting transmission suppressed but not yet restored by 2023; whether these settings follow the Latin American or the high-income trajectory will be answerable with the next data cycle. We emphasize what the data do not show: they do not attribute these differences to any specific policy, and the wide cell-level uncertainty cautions against ranking individual countries. The robust claim is regional: the completeness of post-pandemic restoration varied widely across super-regions, from a median net change near zero in Latin America and the Caribbean to −17.0% in high-income settings, and any global statement about "the rebound" is an average over this heterogeneity. Two further qualifications, restored pathogen co-circulation and our contemporaneous rather than interacting reading of the phenotypes, are set out in the Supplementary Text.
4.4. The Six Resurgent Countries
The six resurgent COVID-19 countries form an interpretable set, five of them late-exit settings. China, the Lao People's Democratic Republic, Cambodia and Papua New Guinea exited suppression later than most of the world, and their 2023 paediatric rises are consistent with delayed first waves of paediatric exposure after reopening rather than with any property of the virus itself; Chad's rise is small in absolute terms (254.7 deaths in 2023) and, in the absence of a zero-COVID history, may reflect baseline estimation noise as much as late exit; Japan, which maintained mitigation longer than comparable high-income settings, fits the same timing gradient in milder form. The absolute magnitudes remain modest outside China (33–349 deaths in 2023), and even China's +1,402% rise follows the worldwide pattern in direction if not timing, with fade setting in thereafter in incidence data; China's COVID-19 estimates are model-based with wide uncertainty, so the exact percentage is less robust than its direction. Paediatric COVID-19 deaths are rare events in population terms [19], so these percentages should be read as timing signals, not emerging mortality hotspots.
The fade itself is a composite signal that modelled estimates cannot decompose. At least three drivers plausibly contribute. First, variant evolution: the Omicron lineages dominant from late 2021 onwards caused substantially less severe disease per infection than the preceding Delta variant [20], so deaths per case fell even where transmission did not. Second, population immunity: vaccination and prior infection, particularly in combination, confer durable protection against severe outcomes even as protection against infection wanes [21]. Third, residual behavioural change may have held exposure below pre-2020 levels in some settings. We cannot apportion the median −72.8% fade among these components and do not attempt to. The same logic reads the six resurgent countries in reverse: settings that exited suppression later met their first large paediatric waves only in 2022–2023, when circulating variants were highly transmissible but attenuated, a combination consistent with the small absolute counts outside China (Table 5).
4.5. The Vaccine Null and Its Meaning
The null association between PCV3 coverage and pneumococcal rebound (ρ = 0.00) should be read carefully. It does not question vaccine efficacy, which is trial-established; it shows that cross-national variation in rebound intensity is not organized by coverage. Countries with high and low PCV3 coverage rebounded by similar amounts, and countries ended the window above or below baseline with no coverage gradient. That redirects explanation towards non-vaccine factors: the depth of the local transmission collapse, the speed of behavioural restoration, health-system disruption, serotype ecology and the demographic structure of susceptibility. It also implies that projecting post-pandemic trajectories from immunization statistics alone will misrank countries. Because coverage enters the GBD attribution model as a covariate [16], the null partly reflects the model's own structure rather than independent evidence, and WUENIC zeros denote non-introduction rather than zero protection [17]; we therefore report it as descriptive. Analytical designs with within-country variation, such as interrupted time series around documented introduction cohorts, are needed to move beyond this resolution, and the panel released with this paper is structured to support exactly such analyses.
4.6. Limitations
Several limitations qualify these findings. First, GBD 2021 and 2023 values are model-based estimates; rebounds partly reflect model behaviour, particularly where vital registration is incomplete, and the atlas inherits GBD's assumptions rather than validating them. Second, uncertainty is wide at national scale: the median relative UI half-width on net change is 0.54, and for pertussis 1.93, so country-level classifications, especially pertussis signs, are tentative even where global and regional patterns are robust. Third, 68% of cells were low-count and excluded; small states and low-mortality high-income countries are under-represented, and the high-income row rests on 24 cells. Fourth, near-zero 2021 denominators mechanically inflate rebound percentages; we mitigated this with the stability filter, median-based summaries, outlier flags, absolute-count reporting and the +300% map cap, but extreme cells should be read as directional only. Fifth, deaths and incidence are different calibres: a mortality atlas cannot speak to mild-disease resurgence, and lethality changes are entangled with transmission changes. Sixth, five timepoints with a two-year rebound window cannot resolve seasonality or distinguish 2022 from 2023 recovery timing. Seventh, the analysis is descriptive; no causal link to non-pharmaceutical interventions, behaviour, variant properties or vaccination is established, and the COVID-19 fade bundles variant attenuation, population immunity and behavioural change in proportions this design cannot separate. Finally, the 2023 pertussis estimates precede the largest 2024 incidence wave [7,9,10] and may be revised in future GBD cycles.
5. Conclusions
Mapped in mortality at national scale, the post-pandemic rebound of childhood respiratory infectious causes is structured, not uniform. Across 1,917 evaluable country × cause cells from 29 causes in 204 countries, six phenotypes coexist, and each leading cause carries a characteristic signature. Pertussis rebounded almost everywhere (98% of evaluable countries; median +168%) but overshot its 2019 baseline in only a third, with the excess concentrated in sub-Saharan Africa: rebound without overshoot. Influenza and RSV show a near-universal V-with-shortfall, still about half below baseline in the median country despite fast 2023 rebounds. Geography inverts the burden gradient: Latin America and the Caribbean is the only super-region at or above baseline, and only marginally so (median net +0.9%, indistinguishable from zero within uncertainty, with a Peru-Ecuador-Brazil-Paraguay overshoot cluster), against a persistent downward reset in high-income settings (−17.0%). COVID-19 faded by a median 73% but resurged in six countries, five of them late-exit settings whose delayed paediatric waves trace the timing of reopening. Tuberculosis missed the rebound window entirely, and pneumococcal rebound is unexplained by vaccine coverage (ρ = 0.00), pointing to non-vaccine drivers of national differentiation.
Three practical consequences follow. First, global statements about "the rebound" should be retired in favour of phenotype-specific, region-specific ones; the average obscures exactly the variation that programmes act on. Second, the open rebound windows of 2023, pertussis in sub-Saharan Africa and the multi-cause Latin American cluster, define where severe-disease prevention most needs verification against 2024–2025 data. Third, mortality-based phenotyping is reproducible and low-cost to update: as each new GBD cycle extends the series, the same declared thresholds can be reapplied to test whether the V-with-shortfall closes, whether overshoot spreads, and whether the high-income reset persists. The rebound timings mapped here can be cross-validated externally against WHO FluNet and FluSurv-NET for influenza and RSV activity, and WHO–UNICEF Joint Reporting Form notification data for the vaccine-preventable causes. Surveillance will continue to map infections; this atlas supplies the complementary mortality map and a falsifiable benchmark against which the next cycle can be read.
Supplementary Materials
The following supporting information can be downloaded at the website of this paper posted on Preprints.org, Supplementary dataset. rebound_phenotype_panel_29pathogens_204countries.csv: full 5,916-cell panel with deaths and 95% UIs per year, collapse/rebound/net change, relative UIs, count class, phenotype and net-above-baseline flag. Additional file: GATHER checklist. Completed Guidelines for Accurate and Transparent Health Estimates Reporting checklist (to be included with the submission package). Supplementary Text. Vaccine type and the durability of vaccine-induced immunity. Over the past two decades most high-income, and many middle-income, programmes replaced whole-cell pertussis vaccine (wP) with acellular vaccine (aP), and aP-primed cohorts lose protection faster than wP-primed cohorts, an accelerated waning implicated in pre-pandemic resurgences and consistent with a rebound that restores transmission without exceeding the pre-transition baseline [22,23]. Immunization programmes also differ in the timing of the infant primary series, the number and spacing of booster doses, and the use of maternal vaccination in pregnancy [24], and such differences are a plausible source of the between-country variation in rebound intensity, including why only a third of countries overshot. A national mortality panel cannot test these programme-level mechanisms, so we report them as hypothesis-generating; the WUENIC third-dose diphtheria–tetanus–pertussis (DTP3) coverage estimates, which vary widely across regions and are lowest in the African region [17], are the background against which any such test would have to be constructed. Pathogen co-circulation and non-interacting phenotypes. The rebounds we map unfolded against a background of restored pathogen co-circulation: SARS-CoV-2, influenza, RSV and M. pneumoniae now circulate together with staggered, only partly overlapping seasonal peaks, and interactions among co-circulating pathogens can shift epidemic timing and magnitude [25,26]. Relatedly, we read the phenotypes as contemporaneous rather than interacting: nothing in this design establishes that one cause's rebound drove or suppressed another's.
Author Contributions
SC conceived and designed the study, curated and analysed the data, and drafted the manuscript; DL and HC interpreted the results and critically revised the manuscript. All authors read and approved the final manuscript.
Funding
This work was supported by the Beijing Science and Technology Nova Program Interdisciplinary Project (20230484439) and the Beijing High-Level Public Health Technical Talents Project (2023-02-33). The funder had no role in study design, data analysis, interpretation, or the decision to submit the manuscript for publication.
Ethics approval and consent to participate
Not applicable. This study uses publicly available, de-identified, aggregate modelled estimates and was exempt from institutional ethics review.
Consent for publication
Not applicable.
Availability of data and materials
The estimates analysed are publicly available from the Global Burden of Disease Results Tool (GBD 2023; Institute for Health Metrics and Evaluation) and the WHO/UNICEF Estimates of National Immunization Coverage (WUENIC). The country × cause panel (5,916 cells, five timepoints, with phenotypes and uncertainty) is provided as a supplementary dataset (rebound_phenotype_panel_29pathogens_204countries.csv; 03_Dataset.csv in the submission package). Analysis code is available from the corresponding author on reasonable request.
Acknowledgments
The authors thank the Institute for Health Metrics and Evaluation and the Global Burden of Disease collaborator network for making the underlying estimates publicly available.
Competing interests
The authors declare that they have no competing interests.
Presentation
This work has not been presented at any academic conference.
Disclosure of AI use
AI tools were used for language polishing and code drafting.
References
- Foley, D.A.; Phuong, L.K.; Peplinski, J.; et al. Off-season RSV epidemics in Australia after easing of COVID-19 restrictions. Nat. Commun. 2022, 13, 3023. [Google Scholar] [CrossRef]
- Zhao, C.; Zhang, T.; Guo, L.; et al. Respiratory Virus Global Epidemiology Network. Characterising the asynchronous resurgence of common respiratory viruses following the COVID-19 pandemic. Nat. Commun. 2025, 16(1), 1610. [Google Scholar] [CrossRef]
- Chow, E.J.; Uyeki, T.M.; Chu, H.Y. The effects of the COVID-19 pandemic on community respiratory virus activity. Nat. Rev. Microbiol. 2023, 21(3), 195–210. [Google Scholar] [CrossRef]
- Meyer Sauteur, P.M.; Zhang, X.-S.; Emborg, H.-D.; et al. ESGMAC MAPS study group. Global spatiotemporal dynamics of Mycoplasma pneumoniae re-emergence after COVID-19 pandemic restrictions: an epidemiological and transmission modelling study. Lancet Microbe 2025, 6(4), 101019. [Google Scholar] [CrossRef]
- Meyer Sauteur, P.M.; Beeton, M.L.; Uldum, S.A.; et al. ESGMAC–MyCOVID Study Team. Mycoplasma pneumoniae detections before and during the COVID-19 pandemic: results of a global survey, 2017 to 2021. Euro Surveill. 2022, 27(19), 2100746. [Google Scholar] [CrossRef]
- Edens, C.; Clopper, B.R.; DeVies, J.; et al. Notes from the field: reemergence of Mycoplasma pneumoniae infections in children and adolescents after the COVID-19 pandemic, United States, 2018–2024. MMWR Morb. Mortal. Wkly. Rep. 2024, 73(7), 149–151. [Google Scholar] [CrossRef]
- Centers for Disease Control and Prevention. Pertussis surveillance and trends. Atlanta, GA: CDC; 2025. Available online: https://www.cdc.gov/pertussis/php/surveillance/index.html (accessed on 2026).
- Tanne, J.H. Whooping cough: fivefold rise in US cases spells return to pre-pandemic levels. BMJ 2024, 386, q2114. [Google Scholar] [CrossRef]
- European Centre for Disease Prevention and Control. Pertussis – Annual Epidemiological Report for 2024. Stockholm: ECDC; 2026. Available online: https://www.ecdc.europa.eu/en/publications-data/pertussis-annual-epidemiological-report-2024.
- Rodrigues, C.; Bouchez, V.; Soares, A.; et al. Resurgence of Bordetella pertussis, including one macrolide-resistant isolate, France, 2024. Euro Surveill. 2024, 29(31), 2400459. [Google Scholar] [CrossRef]
- Cohen, R.; Levy, C.; Rybak, A.; Angoulvant, F.; Ouldali, N.; Grimprel, E. Immune debt: recrudescence of disease and confirmation of a contested concept. Infect. Dis. Now. 2023, 53(2), 104638. [Google Scholar] [CrossRef]
- Messacar, K.; Baker, R.E.; Park, S.W.; Nguyen-Tran, H.; Cataldi, J.R.; Grenfell, B. Preparing for uncertainty: endemic paediatric viral illnesses after COVID-19 pandemic disruption. Lancet 2022, 400(10364), 1663–1665. [Google Scholar] [CrossRef]
- Baker, R.E.; Park, S.W.; Yang, W.; Vecchi, G.A.; Metcalf, C.J.E.; Grenfell, B.T. The impact of COVID-19 nonpharmaceutical interventions on the future dynamics of endemic infections. Proc. Natl. Acad. Sci. U S A 2020, 117(48), 30547–30553. [Google Scholar] [CrossRef]
- Hatter, L.; Eathorne, A.; Hills, T.; Bruce, P.; Beasley, R. Respiratory syncytial virus: paying the immunity debt with interest. Lancet Child Adolesc. Health 2021, 5(12), e44–e45. [Google Scholar] [CrossRef]
- GBD 2023 Causes of Death Collaborators. Global burden of 292 causes of death in 204 countries and territories and 660 subnational locations, 1990–2023: a systematic analysis for the Global Burden of Disease Study 2023. Lancet 2025, 406(10513), 1811–1872. [CrossRef]
- GBD 2021 Lower Respiratory Infections and Antimicrobial Resistance Collaborators. Global, regional, and national incidence and mortality burden of non-COVID-19 lower respiratory infections and aetiologies, 1990–2021: a systematic analysis for the Global Burden of Disease Study 2021. Lancet Infect. Dis. 2024, 24(9), 974–1002. [CrossRef]
- World Health Organization and UNICEF. WHO/UNICEF Estimates of National Immunization Coverage (WUENIC), 2026 revision. Geneva: WHO; 2026. Available online: https://data.who.int.
- Stevens, G.A.; Alkema, L.; Black, R.E.; GATHER Working Group; et al. Guidelines for Accurate and Transparent Health Estimates Reporting: the GATHER statement. Lancet 2016, 388(10062), e19–e23. [Google Scholar] [CrossRef]
- Smith, C.; Odd, D.; Harwood, R.; et al. Deaths in children and young people in England after SARS-CoV-2 infection during the first pandemic year. Nat. Med. 2022, 28(1), 185–192. [Google Scholar] [CrossRef]
- Nyberg, T.; Ferguson, N.M.; Nash, S.G.; et al. Comparative analysis of the risks of hospitalisation and death associated with SARS-CoV-2 omicron (B.1.1.529) and delta (B.1.617.2) variants in England: a cohort study. Lancet 2022, 399(10332), 1303–1312. [Google Scholar] [CrossRef]
- Bobrovitz, N.; Ware, H.; Ma, X.; et al. Protective effectiveness of previous SARS-CoV-2 infection and hybrid immunity against the omicron variant and severe disease: a systematic review and meta-regression. Lancet Infect. Dis. 2023, 23(5), 556–567. [Google Scholar] [CrossRef]
- Domenech de Cellès, M.; Magpantay, F.M.G.; King, A.A.; Rohani, P. The impact of past vaccination coverage and immunity on pertussis resurgence. Sci. Transl. Med. 2018, 10(434), eaaj1748. [Google Scholar] [CrossRef]
- Cherry, J.D. The 112-year odyssey of pertussis and pertussis vaccines—mistakes made and implications for the future. J. Pediatr. Infect. Dis. Soc. 2019, 8(4), 334–341. [Google Scholar] [CrossRef]
- World Health Organization. Pertussis vaccines: WHO position paper — August 2015. Wkly. Epidemiol. Rec. 2015, 90(35), 433–460. [Google Scholar]
- Park, S.W.; Cobey, S.; Metcalf, C.J.E.; Levine, J.M.; Grenfell, B.T. Predicting pathogen mutual invasibility and co-circulation. Science 2024, 386(6718), 175–179. [Google Scholar] [CrossRef]
- Piret, J.; Boivin, G. Viral interference between respiratory viruses. Emerg. Infect. Dis. 2022, 28(2), 273–281. [Google Scholar] [CrossRef]
Figure 1.
(a) National collapse (2019→2021, x-axis) against rebound (2021→2023, y-axis) for the 1,800 stable non-COVID-19 country × cause cells, ages 0–19 years, with phenotype quadrants and the full-recovery diagonal marked; low-count cells (2019 deaths <20) are shown in grey and excluded from classification. (b) Phenotype composition by cause (share of evaluable countries in each phenotype; COVID-19 is classified separately in its three peak-fade classes), 29 causes ranked by deep-collapse + fast-rebound share. (c) Phenotype distribution by GBD super-region (stacked shares of stable non-COVID-19 cells), with median country-level net change annotated. Panel (c) visualizes the same quantities as Table 4, which reports the exact values.
Figure 1.
(a) National collapse (2019→2021, x-axis) against rebound (2021→2023, y-axis) for the 1,800 stable non-COVID-19 country × cause cells, ages 0–19 years, with phenotype quadrants and the full-recovery diagonal marked; low-count cells (2019 deaths <20) are shown in grey and excluded from classification. (b) Phenotype composition by cause (share of evaluable countries in each phenotype; COVID-19 is classified separately in its three peak-fade classes), 29 causes ranked by deep-collapse + fast-rebound share. (c) Phenotype distribution by GBD super-region (stacked shares of stable non-COVID-19 cells), with median country-level net change annotated. Panel (c) visualizes the same quantities as Table 4, which reports the exact values.
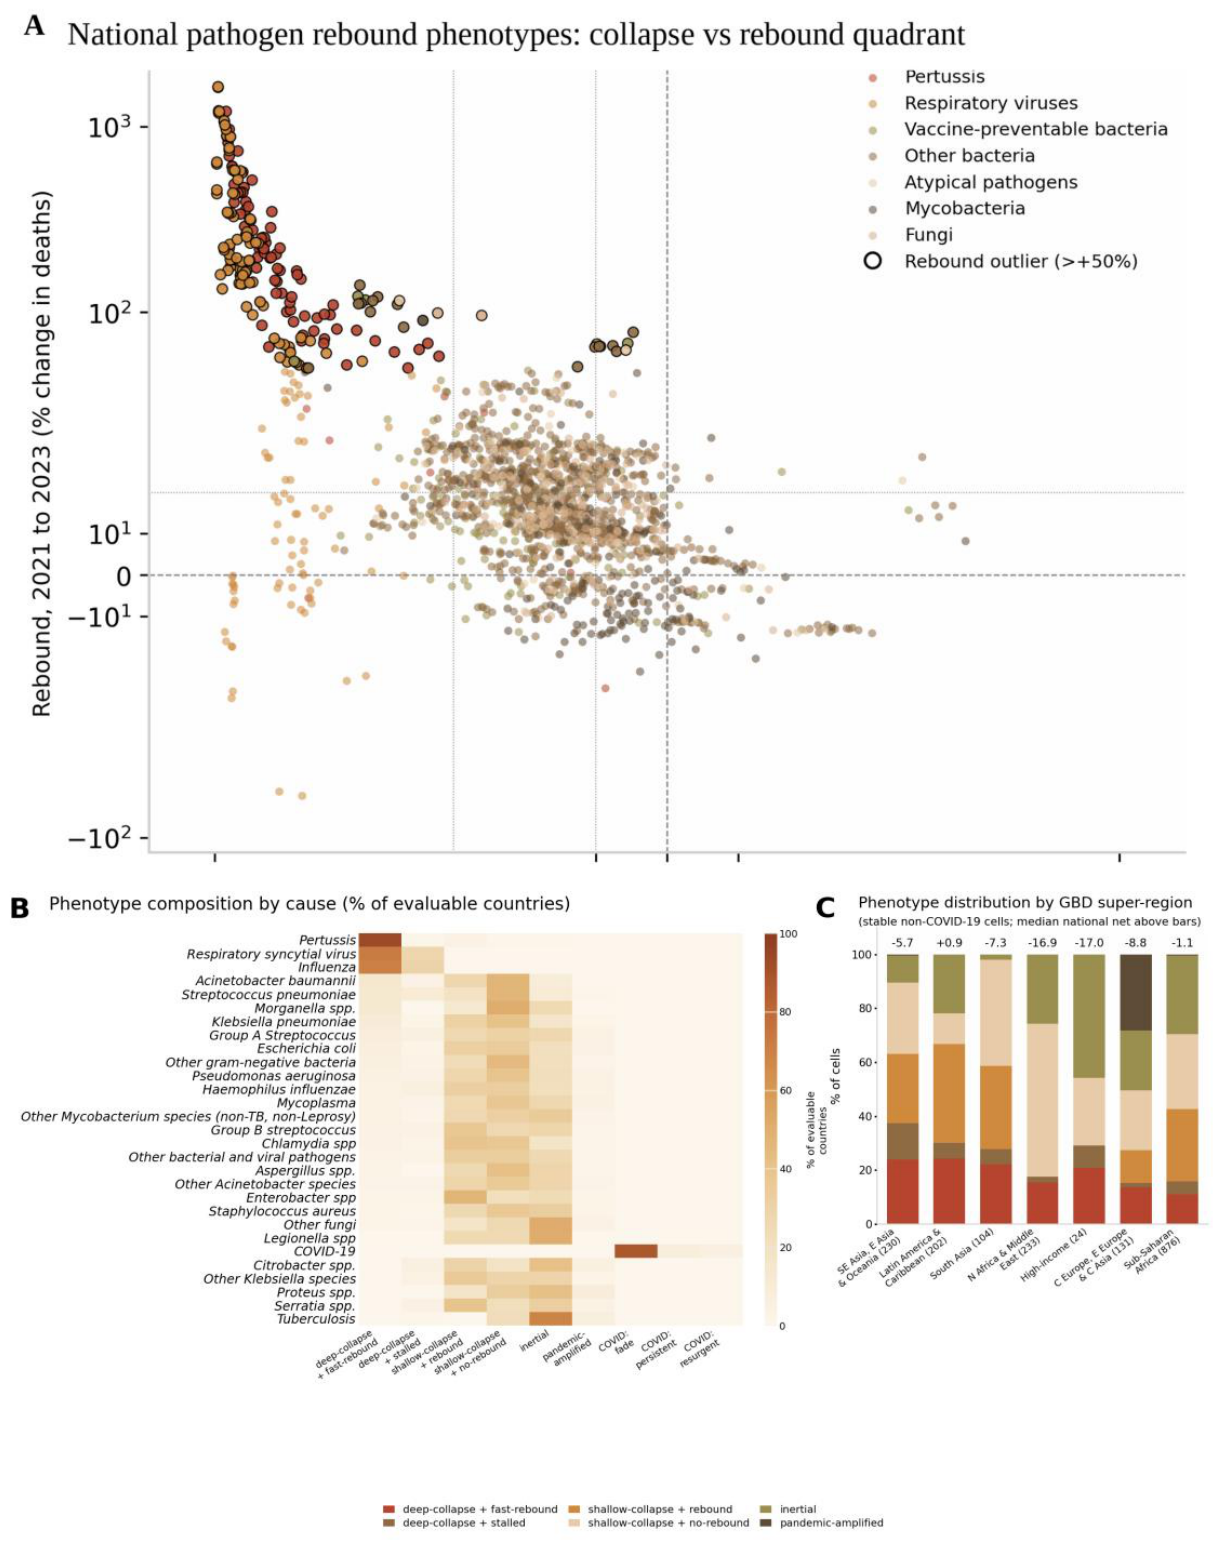
Figure 2.
Choropleth maps of national rebound (2021→2023) for six leading causes (pertussis, RSV, influenza, Streptococcus pneumoniae, Mycoplasma pneumoniae, tuberculosis); rebound is capped at +300% and low-count countries are shaded grey.
Figure 2.
Choropleth maps of national rebound (2021→2023) for six leading causes (pertussis, RSV, influenza, Streptococcus pneumoniae, Mycoplasma pneumoniae, tuberculosis); rebound is capped at +300% and low-count countries are shaded grey.
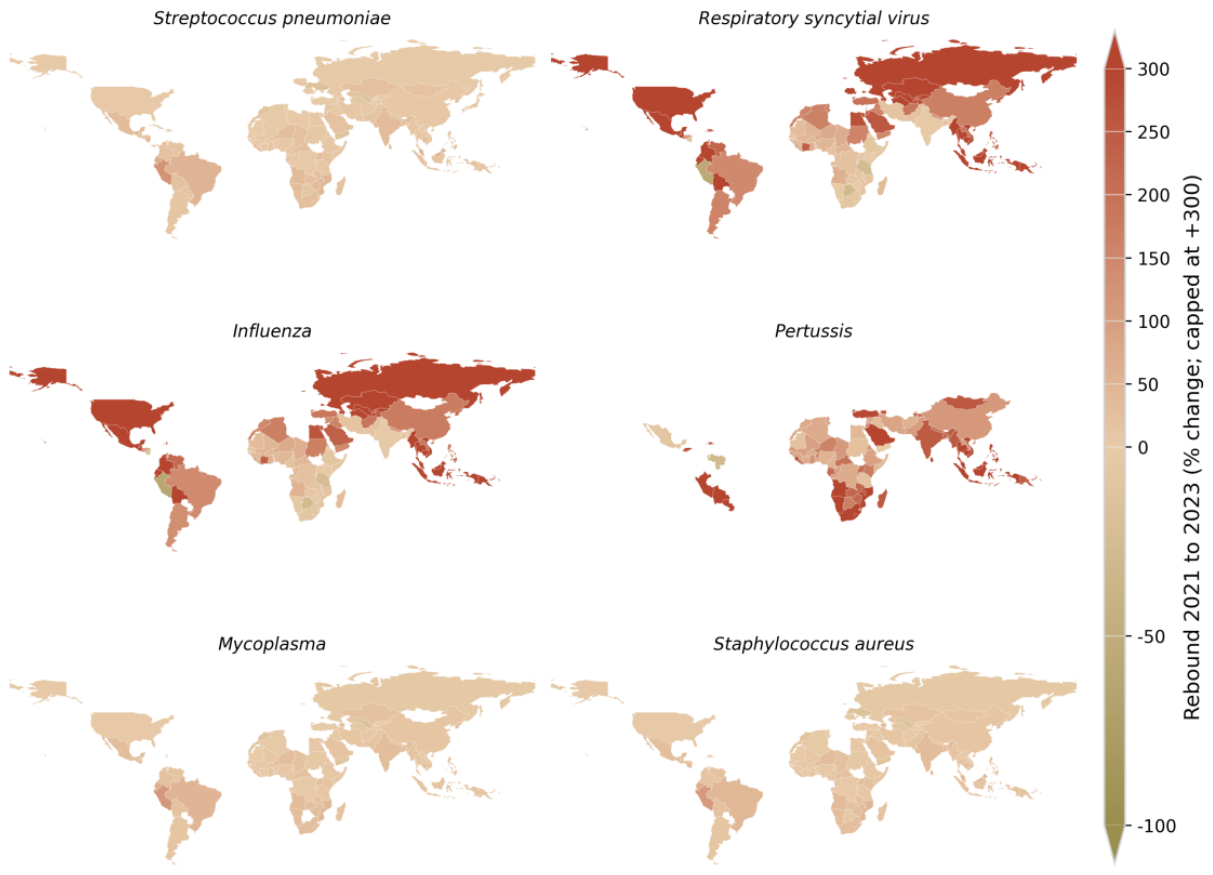

Table 1.
Collapse, rebound and net change for leading causes, global totals and country-level summaries, ages 0–19 years, 2019–2023.
Table 1.
Collapse, rebound and net change for leading causes, global totals and country-level summaries, ages 0–19 years, 2019–2023.
| Cause | Evaluable countries, n | Global collapse 2019→2021, % | Global rebound 2021→2023, % | Global net 2019→2023, % | Median national rebound, % | Median national net, % | Countries with rebound >0, % | Countries above 2019 baseline, % |
| Pertussis | 87 | −57.4 | +111.0 | −10.1 | +167.6 | −6.8 | 97.7 | 32.2 |
| Respiratory syncytial virus | 91 | −65.2 | +47.9 | −48.5 | +107.3 | −50.5 | 85.7 | 3.3 |
| Influenza | 88 | −62.6 | +44.3 | −46.1 | +65.3 | −48.1 | 81.8 | 3.4 |
| Streptococcus pneumoniae | 109 | −27.1 | +16.7 | −14.9 | +13.7 | −13.8 | 82.6 | 17.4 |
| Mycoplasma pneumoniae | 80 | −17.1 | +16.1 | −3.7 | +14.9 | −1.7 | 87.5 | 43.8 |
| Tuberculosis | 87 | −4.4 | −7.9 | −12.0 | −8.0 | −12.8 | 17.2 | 17.2 |
| COVID-19 (peak-fade) | 117 | n/a | n/a | n/a | −72.8 (fade) | n/a | 87.2 faded >20% | 6 (5.1%) resurgent |
Table 2.
Phenotype composition by cause, share of evaluable countries, %.
| Cause | Deep-collapse + fast-rebound | Deep-collapse + stalled | Shallow-collapse + rebound | Shallow-collapse + no-rebound | Inertial | Pandemic-amplified |
| Pertussis | 93.1 | 1.1 | 3.4 | 1.1 | 1.1 | 0.0 |
| Respiratory syncytial virus | 72.5 | 27.5 | 0.0 | 0.0 | 0.0 | 0.0 |
| Influenza | 70.5 | 29.5 | 0.0 | 0.0 | 0.0 | 0.0 |
| Streptococcus pneumoniae | 12.8 | 10.1 | 19.3 | 46.8 | 10.1 | 0.9 |
| Mycoplasma pneumoniae | 3.8 | 2.5 | 25.0 | 37.5 | 26.2 | 5.0 |
| Tuberculosis | 0.0 | 1.1 | 0.0 | 23.0 | 69.0 | 6.9 |
Table 3.
Fifteen largest outlier rebounds (rebound >+50%, ranked), with absolute deaths.
| Country | Cause | Deaths 2019 | Deaths 2021 | Deaths 2023 | Rebound 2021→2023, % | Net 2019→2023, % |
| Dominican Republic | RSV | 24.5 | 0.1 | 12.1 | +16,145 | −50.5 |
| Haiti | RSV | 221.9 | 0.8 | 110.4 | +14,301 | −50.3 |
| Haiti | Influenza | 194.4 | 0.7 | 97.0 | +14,288 | −50.1 |
| Romania | RSV | 23.6 | 0.1 | 17.8 | +12,635 | −24.7 |
| Cambodia | RSV | 161.2 | 1.0 | 90.5 | +9,178 | −43.8 |
| Cambodia | Influenza | 160.4 | 1.0 | 93.6 | +8,940 | −41.6 |
| Thailand | RSV | 35.3 | 0.2 | 6.4 | +2,965 | −81.8 |
| Thailand | Influenza | 44.1 | 0.3 | 8.2 | +2,841 | −81.3 |
| Azerbaijan | RSV | 140.6 | 5.9 | 172.6 | +2,825 | +22.7 |
| Azerbaijan | Influenza | 133.3 | 6.0 | 166.0 | +2,671 | +24.5 |
| Indonesia | RSV | 858.8 | 22.6 | 583.9 | +2,487 | −32.0 |
| Indonesia | Influenza | 784.3 | 20.4 | 511.6 | +2,413 | −34.8 |
| Peru | Pertussis | 279.7 | 21.1 | 477.0 | +2,158 | +70.6 |
| Viet Nam | RSV | 180.7 | 4.1 | 71.3 | +1,648 | −60.5 |
| Viet Nam | Influenza | 131.9 | 2.9 | 50.5 | +1,623 | −61.8 |
Table 4.
Phenotype distribution by GBD super-region, stable non-COVID-19 cells.
| Super-region | Cells, n | Deep-collapse + fast-rebound, % | Deep-collapse + stalled, % | Shallow-collapse + rebound, % | Shallow-collapse + no-rebound, % | Inertial, % | Pandemic-amplified, % | Median national net, % |
| Latin America and Caribbean | 202 | 24.3 | 5.9 | 36.6 | 11.4 | 21.8 | 0.0 | +0.9 |
| Sub-Saharan Africa | 876 | 11.1 | 4.7 | 26.8 | 27.9 | 29.1 | 0.5 | −1.1 |
| Southeast Asia, East Asia and Oceania | 230 | 23.9 | 13.5 | 25.7 | 26.5 | 10.0 | 0.4 | −5.7 |
| South Asia | 104 | 22.1 | 5.8 | 30.8 | 39.4 | 1.9 | 0.0 | −7.3 |
| Central Europe, Eastern Europe and Central Asia | 131 | 13.7 | 1.5 | 12.2 | 22.1 | 22.1 | 28.2 | −8.8 |
| North Africa and Middle East | 233 | 15.5 | 2.1 | 0.0 | 56.7 | 25.8 | 0.0 | −16.9 |
| High-income | 24 | 20.8 | 8.3 | 0.0 | 25.0 | 45.8 | 0.0 | −17.0 |
Table 5.
Countries with resurgent paediatric COVID-19 deaths, 2021→2023.
| Country | Super-region | Deaths 2021 | Deaths 2023 | Change, % |
| China | Southeast Asia, East Asia and Oceania | 197.1 | 2,960.2 | +1,401.7 |
| Lao People's Democratic Republic | Southeast Asia, East Asia and Oceania | 108.8 | 228.7 | +110.1 |
| Cambodia | Southeast Asia, East Asia and Oceania | 193.6 | 349.1 | +80.3 |
| Papua New Guinea | Southeast Asia, East Asia and Oceania | 157.2 | 227.1 | +44.5 |
| Chad | Sub-Saharan Africa | 183.9 | 254.7 | +38.5 |
| Japan | High-income | 26.5 | 33.5 | +26.6 |
Disclaimer/Publisher’s Note: The statements, opinions and data contained in all publications are solely those of the individual author(s) and contributor(s) and not of MDPI and/or the editor(s). MDPI and/or the editor(s) disclaim responsibility for any injury to people or property resulting from any ideas, methods, instructions or products referred to in the content. |
© 2026 by the authors. Licensee MDPI, Basel, Switzerland. This article is an open access article distributed under the terms and conditions of the Creative Commons Attribution (CC BY) license.
Copyright: This open access article is published under a Creative Commons CC BY 4.0 license, which permit the free download, distribution, and reuse, provided that the author and preprint are cited in any reuse.