
Submitted:
27 October 2026
Posted:
28 October 2026
You are already at the latest version
Abstract
Background: Genetic therapies aim to create targeted interventions that treat, prevent or manage genetic disorders, holding substantial promise for many pediatric diseases with underlying genetic causes. As emerging genetic therapies are increasingly being tailored to individual patients, evaluating their efficacy is challenging. Standard N-of-1 trial designs that require repeated crossovers between experimental and control conditions are infeasible as many genetic therapies produce one-time, irreversible effects. Quasi-experimental single-participant designs with pre- and post- intervention periods are a promising alternative in this context where interrupted time series (ITS) analysis can be applied. Herein, we evaluated and compared different design and statistical elements for single participant studies of novel genetic therapies. Methods: We simulated designs using pre- and post-intervention treatment periods examined with ITS models under different assumptions about treatment effects. Changes in a continuous study outcome were assumed to be linear with varying standard deviations (SD). Different frequentist and Bayesian statistical models were compared. Trial performance was evaluated across varying pre-treatment lengths, effect sizes, outcome measurement frequencies, and outcome SD. Patient and family engagement examined the feasibility of study design elements. Results: Using frequentist methods, three selected statistical models achieved similar optimal performance for a study duration of 2 years, yielding power of approximately 80% or higher while maintaining type I error rates around 5%. Simulations suggested studies with balanced pre-post intervention period lengths, larger treatment effects, lower outcome SD, and more frequent outcome assessments had the highest statistical power. Type I error rates were insensitive to outcome SD changes. Less frequent outcome measurement improved trial feasibility from a family perspective. Similar performance was observed when applying Bayesian analyses with minimally informative priors under the same trial design assumptions. Incorporating patient and caregiver perspectives identified additional strategies to improve feasibility and acceptability of the trial designs beyond statistical considerations. Conclusions: Quasi-experimental single participant studies with ITS analysis provide a feasible framework for evaluating novel genetic treatment effect in rare diseases. Appropriate statistical approaches and design parameters are critical for achieving adequate power while maintaining type I error control. Meaningful patient and family engagement during study design is critical for feasibility.
Keywords:
quasi-experimental design
; single patient study
; single participant study
; patient and family engagement
; Bayesian statistics
1. Introduction
Scientific advances have led to the development of personalized gene-targeting therapies that aim to treat individuals with genetic disorders [1,2]. For ultra-rare genetic conditions, it can be challenging to assess the efficacy of these interventions due to restricted sample sizes and heterogeneous populations. Increasingly, bespoke or custom designed genetic treatments are being developed for specific individuals, requiring evaluation of treatment effects in a single-participant study [3,4]. Randomized single-participant (N-of-1) studies are the gold standard design for trials involving a single participant [5,6]. In this study design, participants receive a sequence of treatments or placebos with multiple crossovers to assess the efficacy of each intervention. The requirement for crossover between interventions and controls means that traditional N-of-1 studies are only suitable for stable and reversible conditions [7]. Novel genetic therapies (e.g., gene replacement, gene editing or anti-sense oligonucleotide therapies) typically produce lasting effects that are difficult or often impossible to reverse, rendering conventional N-of-1 approaches infeasible [8].
Quasi-experimental designs offer a practical alternative for assessing the effect of an intervention when random assignment is unethical or not feasible [9]. Among them, interrupted time series (ITS) analysis is particularly useful, as it utilizes longitudinal outcome data collected before and after the intervention initiation [10,11]. In addition to pre-post comparisons, ITS analysis can account for natural increasing or decreasing trends in the outcomes, which is essential for correctly identifying causal effects [12], and required in settings where outcomes of interest may fluctuate over time (e.g., young children with developing skills or for neurodegenerative conditions). However, evaluating appropriate statistical approaches to ITS analyses in single-participant settings is critically important as autocorrelation (i.e., the correlation between observations) can complicate ITS analyses [12,13].
Several statistical models have been proposed for ITS analysis to evaluate the longitudinal effects of health interventions or health policy changes [14,15]. The segmented linear regression model (SRM) is the most widely used, while other approaches such as the generalized additive model (GAM) and the autoregressive integrated moving average (ARIMA) model are also common [16,17,18]. Previous simulation studies have compared these models under varying assumptions, highlighting their respective strengths and limitations and underscoring the importance of appropriate model selection [13,19]. However, the application of ITS analysis to single participant trials remains challenging and under explored, and no straightforward analytical solution exists for determining statistical power.
In addition to the choice of statistical approach for data analysis, the design of the single participant quasi-experimental study is a key factor. Design parameters, including the total study duration (comprising both pre- and post-treatment periods) and the selection of and evaluation frequency of outcome measurement, determine the amount of available data for analysis. These elements influence the ability of a quasi-experimental study to detect treatment effects (power) and to control false-positive findings (type I error). However, the optimal design from statistical perspectives may not be feasible for participants and their families. For example, while increasing the number of data points can improve power, longer study durations and more frequent (e.g., daily or weekly) outcome measurement may impose greater burden on participants and families, affecting adherence and overall feasibility. Therefore, meaningfully engaging patients in the trial design process, through collaboration between patients, families, caregivers, communities, clinicians, and biostatisticians can help develop a trial that balances clinical feasibility with statistical rigor [20].
The overarching aim of our study was to evaluate study design elements and ITS analysis approach applied to trials evaluating novel personalized genetic therapies in single-participant settings. Statistical simulations were based on prior published caregiver-reported data collected during a 40-week long single participant trial with weekly outcome assessment to evaluate the safety and effectiveness of fluoxetine for motor development in a female child with KCNC1 gene gain-of-function variant [21]. We then undertook patient and family engagement to inform the feasibility of the various proposed designs and to provide recommendations for future ITS design for single-participant studies in ultra-rare genetic conditions.
This work is undertaken by the Statistical Methods Sub-Platform of RareKids-CAN, a Pediatric Rare Disease Clinical Trials and Treatment Network (www.rarekidscan.com), funded by the Canadian Institutes of Health Research. As part of its strategic plan, RareKids-CAN aims to strengthen how children, families, and researchers connect and share information, generate new knowledge, and drive policy reform to improve access to clinical trials and treatments for children with rare diseases in Canada.
2. Methods
2.1. Quasi-Experimental Trial Design
Quasi-experimental pre-post trial designs offer a practical approach to outcome evaluation in a single participant setting, by collecting longitudinal outcome data before and after treatment initiation and comparing patterns across these two periods. This approach allows us to assess whether observed changes are attributable to the intervention rather than to natural variability over time. In this simulation study, the primary outcome is a continuous variable that increases over time in the absence of treatment. Following treatment initiation, the slope of this increase is assumed to change under various scenarios (Figure 1A).
2.2. Primary Outcome and Data Generation
Statistical models used a continuous primary outcome (Early Motor Questionnaire, EMQ version 1.6) collected as part of a prior single participant trial in an ultra-rare genetic condition. The EMQ measures global motor development between ages 0 and 24 months across 127 items completed by a parent or caregiver, with each item rated on a scale from -2 to +2 based on the degree of motor skill mastery. The EMQ was selected pragmatically in the previous trials [21,22], but resulting simulations could reflect effects measured on any continuous outcome collected over time. Outcome scores were assumed to follow a normal distribution with an increasing mean over time without ASO treatment, where is the expected outcome at time point , measured in weeks, and is the variance, which we assume is constant across time. We assumed that the intervention was provided at a time and, for , is a linear function
where is the baseline value of the outcome and is the weekly increase in the outcome without treatment. For , changes depend on the assumed treatment impact. When the treatment adjusts the rate of increase only, we modeled as
where represents the relative increase compared to the natural increase (Figure 1B, Pattern 1).
We also considered that the treatment could induce an abrupt change in the outcome, modelled as
where indicates the relative increase in the weekly rate of improvement in the outcome due to treatment and is the step change (Figure 1B, Pattern 2). Finally, we defined the overall treatment effect size ( as the difference between the expected outcome at 1 year when and when , i.e., representing the difference between the outcome if the participant did and did not receive the treatment for a year. In our simulations, we fixed the proportion of the abrupt change D at 50% of the total effect size E, to illustrate comparisons of possible treatment effect patterns.
2.3. Statistical Analysis and Modeling
We evaluated three different statistical methods for analyzing ITS data: SRM, GAM and ARIMA, with the main features of these models summarized in Table 1 [16,17,18,23,24]. Each model estimates treatment-effect parameters, which must be combined to compute the expected effect . However, the methods differ in how they model the longitudinal relationships between different measurements. The exact definitions of the models and how can be calculated is provided in the Supplementary Methods. Irrespective of the modelling approach, the treatment effect estimate is obtained alongside 95% confidence/credible intervals (CIs/CrIs). Broadly, for a two-sided test, we declare a positive conclusion if the lower bound of the 95% CI/CrI exceeds 0 or the upper bound is below 0. If the 95% CI/CrI covers 0, the result is considered inconclusive.
2.4. Simulation Study Design
The ITS trial designs and statistical methods were evaluated using simulations, a typical approach for evaluating statistical methods [25]. In an initial set of simulations, we fixed the total trial length to 1 year (52 weeks) or 2 years (104 weeks) before varying (1) the length of the pre-treatment period, (2) outcome measurement frequency, (3) treatment effect size, and (4) outcome variance. For each design, we computed the power, the probability of correctly identifying that the treatment changes the outcome [24], and type I error rate, the risk of incorrectly concluding that the treatment works when it does not [26]. This allowed us to identify promising settings that controlled type I error below 5%, although some designs allow type 1 error up to 10%, and had high power, usually understood to be 0.80 with a conventionally acceptable range from 0.80 to 0.95 [27,28].
Across all scenarios, we assumed that the trial outcome increases by 0.2 units per week, i.e., . We then varied the increase in the rate of change in the outcome, , for Pattern 1, and for Pattern 2, we chose and such that the same treatment effect was the same across both patterns. Note that when , the rate of increase for the primary outcome is not affected by treatment so this scenario estimates the type I error rate. The power is estimated when .
Since the structure of an ITS trial can be customized by altering the lengths of the pre- and post-treatment periods, our first simulation study aimed to identify a promising pre-post configuration. We evaluated pre-treatment periods ranging from 12 to 40 weeks within the 1-year trial or 16 to 88 weeks within the 2-year trial, assuming that outcome is measured weekly and . Type I error rates and power are assessed under each period-length setting across different values. The second phase of simulations examined fixed the pre-post configuration and varied the frequency of outcome measurement (weekly, biweekly, or monthly; ) and the standard deviation of the outcome (; weekly measurement), to understand their influence on the type I error rate and power. Note that across all these scenarios, the outcome variability is substantially larger than the natural increase. For each scenario, 1000 simulated trials were used to compute the power and type 1 error rate.
2.5. Determining the Simulated Scenarios Through Patient Engagement
After completing the initial simulation-based trial design, we engaged patient and family partners to co-develop feasible trial designs through Canada’s pediatric rare disease clinical trials and treatment network (RareKids-CAN) and the Lived Experience Network (LXN), a community of patients, caregivers, siblings and other community members who contribute to improvements in care, research, and education at The Hospital for Sick Children. As part of the recruitment process, we shared a call-out and a plain-language study protocol. After receiving applications from partner candidates, we held an initial meeting to introduce the research program, meet the candidates, and learn more about their experiences. Three patient and family partners were recruited, two of whom had no prior experience of biostatistics. We developed a 3-page, plain-language learning resource summarizing the fundamentals of genetic therapy, the purpose and rationale of N-of-1 trials, quasi-experimental single participant studies, and factors influencing study design (Supplementary Materials), which was provided to the three partners. We then held a series of virtual meetings to obtain their perspectives on the feasibility and interpretation of potential trial designs. Partners provided feedback on (1) total study duration, (2) timing of outcome collection, (3) burden of outcome measurement, and (4) how study results should be communicated across a range of potential study designs. After the engagement ended, we also invited all partners to provide written feedback to support our evaluation of the engagement. Following this engagement process, we extended our simulation study to evaluate a range of alternative designs that incorporated our patient and family feedback. In the following results, we report both the study design suggestions from our patient and family engagement and the results of our extended simulations.
3. Results
3.1. Balanced Pre-Post Treatment Period Design Yielded the Highest Power
Simulation results for the 1-year design suggest that a 1-year study period is insufficient to achieve adequate statistical power with the most likely outcome variance () estimated from the motivating study when the outcome assessment is performed weekly, irrespective of the pre-treatment period length (Supplementary Figure). In addition, inflated type I error rates around 0.1 are observed in the GAM and ARIMA models. Consequently, all subsequent evaluations focused on the 2-year design.
For the 2-year design with a weekly outcome measurement frequency and , type I error rates were generally well controlled by SRM and GAM at approximately 0.05 across a range of pre-treatment period lengths, with some fluctuation (Figure 2A). Slightly higher type I error rates at approximately 0.10 were observed for the ARIMA models. However, variation in the pre- and post-treatment period configuration had limited impact on type I error control for all three models. Power was sensitive to the length of the pre- and post-treatment periods, with the highest power seen when the pre- and post-treatment periods are approximately balanced (Figure 2B). Under Pattern 1 and assuming (the treatment effect corresponds to a 50% increase in the rate of change), power for the SRM increased to the highest value of 0.34 with a 48-week pre-treatment period, before decreasing again when the pre-treatment period was further extended. Similar behavior is observed for both the ARIMA model and GAM, with maximal power occurring when the pre-treatment period is between 48 and 56 weeks. As increases to 1.0 and 1.5, the range of pre-treatment period lengths associated with near-optimal power widens and the power exceeds 0.8 for the SRM and ARIMA methods, with acceptable power for the GAM method only seen when . Larger treatment effect sizes allow for greater flexibility in identifying promising pre-post period configurations, which means a shorter pre-treatment period can be used if the treatment effect is larger. Similar power trends are observed under Pattern 2.
3.2. Low Outcome Measurement Frequency Results in Reduced Trial Performance
Fixing both the pre- and post-treatment periods to 52 weeks and , we evaluated the impact of collecting outcomes on a bi-weekly and monthly schedule. Across both Pattern 1 and Pattern 2, type I error rates of SRM and GAM remain approximately 0.05 as outcome measurement frequency decreases from weekly to monthly (Figure 3A). The ARIMA model exhibits higher type I error rates than GAM, with a modest increase as measurement frequency decreases while SRM shows inflated type I error rates in Pattern 2. To assess power, we set (additional increase = 0.1 per week). All three methods demonstrated a reduction in power, generally decreasing below 0.8, with decreasing outcome measurement frequency, with largest reductions in the GAM method. Power also decreased more dramatically in Pattern 2 than in Pattern 1.
3.3. Small Outcome Variance Associated with Increased Power
Next, we examined the impact of outcome variance on trial performance under the balanced pre-post treatment period design (Figure 3B). The type 1 error rates were largely unaffected by variations in but the power increased substantially as variability decreased. These results have important implications for outcome selection as outcomes with relatively low variability compared to the expected natural increase should be prioritized in single participant settings to maximize statistical power.
3.4. Increased Bias Associated with Low Outcome Measurement Frequency
In addition to assessing type I error rates and power, we examined the difference between the estimated treatment effect and the true value specified in the simulations across three statistical approaches (Figure 3C). The simulation results showed relatively small differences across varying levels of outcome variance, ranging from approximately −0.2 to 0.2 in both null and effective scenarios, suggesting that outcome variance had minimal influence on effect estimation. Bias was also not strongly associated with the frequency of outcome measurements in the null scenario. However, in the effective scenarios, bias increased substantially as the measurement frequency decreased, particularly under Pattern 1. Under Pattern 2, the GAM demonstrated lower bias than the SRM and ARIMA models when outcomes are measured monthly, whereas differences among the three models were minimal with biweekly measurement frequency.
3.5. Lessons Learnt from Engagement with Patients and Families – A Bayesian Approach
In discussion with our patient and family partners, we identified that that the key question of interest is “what is the chance that the intervention works?” This cannot be directly obtained from frequentist analyses or the calculation of statistical power and type 1 error. Our partners highlighted that answering this question allows individual participants to trade off the risks and benefits of the intervention themselves. As genetic therapies are developed for the individual, it is critical to incorporate the individual preferences and risk-benefit tradeoffs into the design and analysis. Bayesian statistics, in which probability is interpreted as a degree of belief in an event, can answer this key patient centered question and so may be more appropriate for data analysis and interpretation. As such, we re-ran our simulations using a Bayesian approach for the GAM method, selected because our initial simulations demonstrated unstable type I error rates for the ARIMA models.
We used minimally informative priors for the Bayesian GAM approach, which led to similar type I error rates and power compared to the frequentist approach (Figure 4). Type I error rates were well controlled around 0.05 for both patterns, regardless of the length of the pre-treatment period, while the power was sensitive to the treatment effect and the configuration of the pre- and post-treatment periods. The maximum power achieved for designs that were comparable between the two Patterns, although greater flexibility in pre-post period configurations was observed in Pattern 1 as a wider range of configurations provided power around 0.80.
3.6. Lessons Learnt from Engagement with Patients and Families – Increasing Trial Feasibility
Our partners indicated that a two-year study may be infeasible for some families, with a feasible study duration depending on the participant’s life stage. For example, younger participants may have more frequent follow-ups in general, leading to greater willingness to enroll in long-term studies with intensive data collection. It is also important to consider whether life events would make it more challenging to enroll in a study, for example, changing schools or relocating. Thus, we evaluated a reduced study duration of 1.5 years (80 weeks). Our partners also emphasized that the feasibility of frequent outcome collection would depend heavily on what outcomes were being collected and the participant and family preferences. For example, outcomes that require a clinic visit would be difficult to collect frequently, especially for participants and families that live rurally. However, online questionnaires also have challenges as some families may forget to complete them. Furthermore, our partners highlighted that there may be time periods in the trial where participants and families are more engaged and data could be collected more intensively. For example, participants and families may be most enthusiastic around trial enrolment and treatment delivery. Therefore, we considered less frequent and uneven data collection to incorporate this patient perspective. The key takeaway is that the outcome collection schedule must be feasible for the participant and/or family enrolled in the trial and should account for the complexity of collecting the primary outcome of the study.
Thus, we evaluated a design where the frequency of outcome measurements varies over time, decreasing as the study progresses but increasing again when transitioning from the pre-treatment to treatment period. Specifically, during the first 16 weeks of either receiving control or treatment, outcomes were measured weekly. During weeks 17–32, the measurement frequency decreased to biweekly. Thereafter, outcomes are measured monthly. The Bayesian GAM method was applied in the simulations for the updated design. In both Patterns, Bayesian GAM models achieved well-controlled type I error rates although they exhibited slight inflation above 0.05 in certain settings. This design showed a reduced statistical power compared with the original 2-year trial design (Figure 5) with power maximized when the pre- and post-treatment periods were balanced. The maximum observed power was 0.62 in Pattern 1 when the treatment effect as assumed to be a 0.3-unit increase per week, compared to 1.00 in the original 2-year trial design with weekly outcome measurements. Thus, there is a loss of statistical power compared to a perfectly conducted 2-year study. However, this perfect 2-year study is unlikely to be completed so the greater feasibility of this uneven, reduced data collection should ensure the validity of the results as the data are collected.
4. Discussion
Evaluating efficacy of interventions in ultra-rare diseases, particularly for personalized genetic therapies is challenging. Randomized clinical trials are infeasible due to extremely limited participant numbers, and crossover or N-of-1 designs are not possible with many gene-directed treatments. Our study demonstrates that single participant pre-post quasi-experimental designs analyzed using ITS analysis offer a feasible and clinically meaningful alternative by using longitudinal data to estimate treatment effects. The probabilities of detecting true treatment effect are strongly influenced by the length of pre-treatment period, treatment effect size, outcome measurement frequency, and outcome variability, but type I error rate is related to outcome measurement frequency only. Design elements were evaluated with patient and family engagement on feasibility and burden. These findings support the use of customized ITS-based trials with Bayesian GAM analysis as a practical framework for evaluating novel genetic therapies in ultra-rare diseases. With the rapid advancement of genetic therapies, it is important that reviewers from regulatory agencies and health technology assessment bodies are equipped with the understanding of this novel trial design and relevant statistical approaches.
Our findings in the frequentist approach reveal that the ARIMA model has the most favorable ability to detect treatment effects with even outcome measurement frequency but could not control the type I error rate compared with SRM and GAM. Although GAM exhibited lower power than ARIMA model and SRM in most settings, it remains the most flexible statistical method of the three approaches, with the capacity to accommodate nonlinear outcome trajectories [29,30,31]. This flexibility is particularly helpful in practice, where the true trajectory of the outcome is often unknown and pre-treatment data are limited. A frequentist analysis provides a p-value and/or the confidence interval, where the p-value reports the probability of results more extreme than those observed would have arisen if there was no effect. A Bayesian analysis, however, provides the probability that the intervention has a positive effect on outcomes, which directly answers participants’ and families’ key questions of interest [32]. Our simulations reveal that Bayesian GAM models have similar performance to their frequentist counterpart, suggesting that a Bayesian approach may be more suitable to present study results to participants and families. In addition, the Bayesian approach allows to use informative priors to borrow external information for inference on the primary estimand to improve the power [33,34], especially in pediatrics and rare diseases [35].
Our study assumes that there is only one eligible participant, and our aim is to develop a design for this participant that maximizes statistical power while ensuring study feasibility and appropriate control of type I error rates. Similar to N-of-1 trials, it may also be possible to aggregate results across multiple quasi-experimental designs using ITS analysis if more than one participant is eligible [36,37,38], even when the total sample size remains insufficient for a conventional randomized clinical trial. This framework also would incorporate evidence from a newly conducted quasi-experimental trial with a previously completed study. With the information gained from multiple individuals and borrowing strength across participants, higher statistical power would be obtained and more accurate treatment effect estimates would also be available, depending on how much the estimate for each individual is informed by data from other participants [39,40,41].
An approximately balanced design has the most promising ability to identify treatment effects. In the pre-intervention period, robust data without treatment are critical for accurately characterizing baseline trajectories and distinguishing treatment effects from underlying disease progression, which closely aligns with the perspective of recent regulatory guidance that underscores the importance of systematic natural history data collection in rare disease research. The U.S. Food and Drug Administration’s Plausible Mechanism Framework for individualized therapies emphasizes reliance on well-characterized natural history data in untreated patients to support the interpretation of treatment effects and establish evidence of effectiveness [42]. A substantial symptom improvement or disease trajectory change inconsistent with the natural history data may provide solid evidence of treatment effectiveness. Early initiation of longitudinal data collection for natural history data can therefore strengthen internal validity and enhance the interpretability and regulatory relevance of findings, particularly in settings with limited sample sizes and heterogeneous disease courses.
Outcome variance is also strongly associated with power but is usually an intrinsic characteristic of the outcome and the measurement process, limiting the extent to which variance can be reduced to improve power. A further consideration is the availability of clinical outcome assessments suitable for repeated longitudinal measurement. Developing and validating patient-centered outcomes that can be assessed remotely by blinded raters with minimal burden to participants and families will be critical for enabling rigorous evaluation over time. For example, the CDKL5 hand function measure can be remotely scored by raters based on caregiver-uploaded videos, facilitating robust longitudinal assessment in rare disease populations while reducing participant burden [43]. Thus, careful selection of the trial outcomes is critical to the success of these quasi-experimental designs. Finally, although our findings indicate that an approximately balanced pre- and post-treatment period design is associated with the highest power, unexpected events can disrupt planned follow-up and lead to imbalanced designs. These practical considerations underscore the importance of co-designing the study with investigators, participants, their caregivers, and statisticians to maximize feasibility and data availability to answer these critical questions in ultra-rare genetic diseases.
Our patient and family engagement highlighted the importance of considering individual, patient-level feasibility for single participant designs. As such, we reviewed a range of assumptions about the treatment effect, outcome variance and trial design characteristics. This provides researchers with a range of feasible designs that can be tailored to the specific participant. Furthermore, we have provided our simulation code in the supplementary material to support researchers to designing tailored single participant designs. Feasibility is critically important when selecting the outcome measurement frequency [44,45]. While more frequent outcome measurements improve power, strict adherence to intensive visit schedules is often unrealistic, leading to missing data and further statistical challenges.
5. Conclusions
Quasi-experimental designs with ITS analysis using a Bayesian approach, incorporating patient and caregiver engagement, provide a feasible framework for evaluating the effects of novel genetic treatments in ultra-rare diseases. Appropriate selection of statistical models and design parameters is critical for achieving adequate power while maintaining control of type I error. This work addresses an important methodological gap by providing robust evidence-generation approaches to support regulatory review and health technology assessments. Adoption and understanding of quasi-experimental designs with ITS analysis will be critical to enable informed decision-making and timely access to emerging therapies.
Supplementary Materials
The following supporting information can be downloaded at the website of this paper posted on Preprints.org.
Author Contributions
X.Z.: Writing - review & editing, Writing - original draft, Visualization, Methodology, Formal analysis; Y.M.: Writing - review & editing, Writing - original draft, Visualization, Methodology; J.M.: Writing - review & editing, Methodology; L.F.: Writing - review & editing, Methodology; L.K.: Writing - review & editing, Methodology; T.L.-M.: Writing - review & editing, Funding; D.B.: Writing - review & editing, Validation, Supervision, Methodology, Investigation, Conceptualization; A.H.: Writing - review & editing, Writing - original draft, Visualization, Validation, Supervision, Methodology, Investigation, Conceptualization.
Funding
This study is funded by the RareKids-CAN: Pediatric Rare Disease Clinical Trials and Treatment Network. RareKids-CAN is funded by the Canadian Institutes of Health Research and its Institute of Genetics, as part of the Government of Canada’s National Strategy of Drugs for Rare Diseases (Grant #192262). Anna Heath is supported by a Canada Research Chair in Statistical Trial Design and a NSERC grant number RGPIN-2021-03366. Patient and family engagement activities of our partners were supported by Child Health Evaluative Sciences program grant of The Hospital for Sick Children through PricewaterhouseCoopers.
Institutional Review Board Statement
Not applicable.
Informed Consent Statement
Not applicable.
Data Availability Statement
The study used simulated data. The datasets used and/or analyzed during the current study are available from the corresponding author on reasonable request.
Acknowledgments
Not applicable.
Conflicts of Interest
The authors declare that they have no competing interests.
References
- Bulaklak, K.; Gersbach, C.A. The once and future gene therapy. Nat. Commun. 2020, 11(1), 5820. [Google Scholar] [CrossRef]
- Lauffer, M.C.; van Roon-Mom, W.; Aartsma-Rus, A. Collaborative N 1. Possibilities and limitations of antisense oligonucleotide therapies for the treatment of monogenic disorders. Commun. Med. 2024, 4(1), 6. [Google Scholar]
- Belgrad, J.; McConnell, E.; Leonard, S.; Nolen, N.; Lauffer, M.C.; Watts, J.K.; et al. The N= 1 Collaborative: advancing customized nucleic acid therapies through collaboration and data sharing. Nucleic Acids Res. 2025, 53(8), gkaf346. [Google Scholar] [CrossRef]
- Augustine, E.F.; Yu, T.W.; Finkel, R.S. N-of-1 studies in an era of precision medicine. JAMA 2024, 332(16), 1386–7. [Google Scholar] [CrossRef]
- Schork, N.J. Personalized medicine: time for one-person trials. Nature 2015, 520(7549), 609–11. [Google Scholar] [CrossRef]
- Müller, A.R.; Brands, M.M.; van de Ven, P.M.; Roes, K.C.; Cornel, M.C.; van Karnebeek, C.D.; et al. Systematic review of N-of-1 studies in rare genetic neurodevelopmental disorders: the power of 1. Neurology 2021, 96(11), 529–40. [Google Scholar] [CrossRef]
- Kaplan, H.C.; Opipari-Arrigan, L.; Yang, J.; Schmid, C.H.; Schuler, C.L.; Saeed, S.A.; et al. Personalized research on diet in ulcerative colitis and Crohn’s disease: a series of N-of-1 diet trials. Off. J. Am. Coll. Gastroenterol.| ACG 2022, 117(6), 902–17. [Google Scholar] [CrossRef]
- Ziegler, A.; Carroll, J.; Bain, J.M.; Sands, T.T.; Fee, R.J.; Uher, D.; et al. Antisense oligonucleotide therapy in an individual with KIF1A-associated neurological disorder. Nat. Med. 2024, 30(10), 2782–6. [Google Scholar] [CrossRef]
- Cook, T.D.; Campbell, D.T.; Shadish, W. Experimental and quasi-experimental designs for generalized causal inference; Houghton Mifflin Boston, MA, 2002; Vol. 1195. [Google Scholar]
- Wagner, A.K.; Soumerai, S.B.; Zhang, F.; Ross-Degnan, D. Segmented regression analysis of interrupted time series studies in medication use research. J. Clin. Pharm. Ther. 2002, 27(4), 299–309. [Google Scholar] [CrossRef]
- Jandoc, R.; Burden, A.M.; Mamdani, M.; Lévesque, L.E.; Cadarette, S.M. Interrupted time series analysis in drug utilization research is increasing: systematic review and recommendations. J. Clin. Epidemiol. 2015, 68(8), 950–6. [Google Scholar] [CrossRef]
- Kontopantelis, E.; Doran, T.; Springate, D.A.; Buchan, I.; Reeves, D. Regression based quasi-experimental approach when randomisation is not an option: interrupted time series analysis. BMJ 2015, 350. [Google Scholar] [CrossRef]
- Jiang, H.; Rehm, J.; Tran, A.; Lange, S. Interrupted Time Series Design and Analyses in Health Policy Assessment. Medrxiv 2024. [Google Scholar] [CrossRef]
- Bernal, J.L.; Soumerai, S.; Gasparrini, A. A methodological framework for model selection in interrupted time series studies. J. Clin. Epidemiol. 2018, 103, 82–91. [Google Scholar] [CrossRef]
- Bernal, J.L.; Cummins, S.; Gasparrini, A. Interrupted time series regression for the evaluation of public health interventions: a tutorial. Int. J. Epidemiol. 2017, 46(1), 348–55. [Google Scholar] [CrossRef]
- Sullivan, K.J.; Shadish, W.R.; Steiner, P.M. An introduction to modeling longitudinal data with generalized additive models: applications to single-case designs. Psychol. Methods 2015, 20(1), 26. [Google Scholar] [CrossRef]
- Nelson, B.K. Time series analysis using autoregressive integrated moving average (ARIMA) models. Acad. Emerg. Med. 1998, 5(7), 739–44. [Google Scholar] [CrossRef]
- Schaffer, A.L.; Dobbins, T.A.; Pearson, S.A. Interrupted time series analysis using autoregressive integrated moving average (ARIMA) models: a guide for evaluating large-scale health interventions. BMC Med. Res. Methodol. 2021, 21(1), 58. [Google Scholar] [CrossRef]
- Pinilla, J.; Negrín, M. Non-parametric generalized additive models as a tool for evaluating policy interventions. Mathematics 2021, 9(4), 299. [Google Scholar] [CrossRef]
- Gobat, N.; Slack, C.; Hannah, S.; Salzwedel, J.; Bladon, G.; Burgos, J.G.; et al. Better engagement, better evidence: working in partnership with patients, the public, and communities in clinical trials with involvement and good participatory practice. Lancet Glob. Health 2025, 13(4), e716–31. [Google Scholar] [CrossRef]
- Jha, V.; Tsetsos, C.; Bedford, M.; Costain, G.; Vohra, S.; Diaz Martinez, J.P.; et al. An n-of-1 gene-directed drug repurposing trial for an ultrarare genetic condition. Epilepsia 2026. [Google Scholar] [CrossRef]
- Libertus, K.; Landa, R.J. The Early Motor Questionnaire (EMQ): a parental report measure of early motor development. Infant Behav. Dev. 2013, 36(4), 833–42. [Google Scholar] [CrossRef]
- Shumway, R.H.; Stoffer, D.S. ARIMA models. In Time series analysis and its applications: with R examples; Springer, 2024; pp. 85–175. [Google Scholar]
- Wood, S.N. Generalized additive models. Annu. Rev. Stat. Its Appl. 2025, 12(1), 497–526. [Google Scholar] [CrossRef]
- Morris, T.P.; White, I.R.; Crowther, M.J. Using simulation studies to evaluate statistical methods. Stat. Med. 2019, 38(11), 2074–102. [Google Scholar] [CrossRef]
- Shreffler, J.; Huecker, M.R. Type I and type II errors and statistical power. In StatPearls [Internet]; StatPearls Publishing, 2023. [Google Scholar]
- Lipsey, M.W. Design sensitivity: Statistical power for experimental research. 1990, Vol. 19. sage. [Google Scholar]
- Banerjee, A.; Chitnis, U.B.; Jadhav, S.L.; Bhawalkar, J.S.; Chaudhury, S. Hypothesis testing, type I and type II errors. Ind. Psychiatry J. 2009, 18(2), 127. [Google Scholar] [CrossRef]
- Baayen, R.H.; Linke, M. An introduction to the generalized additive model. In A practical handbook of corpus linguistics; 2020; pp. 563–91. [Google Scholar]
- Dominici, F.; McDermott, A.; Zeger, S.L.; Samet, J.M. On the use of generalized additive models in time-series studies of air pollution and health. Am. J. Epidemiol. 2002, 156(3), 193–203. [Google Scholar] [CrossRef]
- Morton, R.; Henderson, B.L. Estimation of nonlinear trends in water quality: an improved approach using generalized additive models. Water Resour. Res. 2008, 44(7). [Google Scholar] [CrossRef]
- Berry, D.A.; Stangl, D. Bayesian biostatistics; CRC Press, 2018. [Google Scholar]
- Lemoine, N.P. Moving beyond noninformative priors: why and how to choose weakly informative priors in Bayesian analyses. Oikos 2019, 128(7), 912–28. [Google Scholar] [CrossRef]
- Psioda, M.A.; Ibrahim, J.G. Bayesian clinical trial design using historical data that inform the treatment effect. Biostatistics 2019, 20(3), 400–15. [Google Scholar] [CrossRef]
- Use of Bayesian Methodology in Clinical Trials of Drug and Biological Products | FDA [Internet]. [cited 2026 Aug 5]. Available online: https://www.fda.gov/regulatory-information/search-fda-guidance-documents/use-bayesian-methodology-clinical-trials-drug-and-biological-products.
- Kaplan, H.C.; Opipari-Arrigan, L.; Schmid, C.H.; Schuler, C.L.; Saeed, S.; Braly, K.L.; et al. Evaluating the comparative effectiveness of two diets in pediatric inflammatory bowel disease: a study protocol for a series of N-of-1 trials. In Healthcare. MDPI; 2019; p. 129. [Google Scholar]
- Zucker, D.R.; Schmid, C.H.; McIntosh, M.W.; D’Agostino, R.B.; Selker, H.P.; Lau, J. Combining single patient (N-of-1) trials to estimate population treatment effects and to evaluate individual patient responses to treatment. J. Clin. Epidemiol. 1997, 50(4), 401–10. [Google Scholar] [CrossRef]
- Zucker, D.R.; Ruthazer, R.; Schmid, C.H. Individual (N-of-1) trials can be combined to give population comparative treatment effect estimates: methodologic considerations. J. Clin. Epidemiol. 2010, 63(12), 1312–23. [Google Scholar] [CrossRef]
- Schmid, C.; Yang, J. Bayesian models for N-of-1 trials. Harv. Data Sci. Rev. 2022, 2022(SI3), 10–1162. [Google Scholar] [CrossRef]
- Ewusie, J.E.; Thabane, L.; Beyene, J.; Straus, S.E.; Hamid, J.S. Multicenter interrupted time series analysis: incorporating within and between-center heterogeneity. Clin. Epidemiol. 2020, 625–36. [Google Scholar] [CrossRef]
- Korevaar, E.; Turner, S.L.; Forbes, A.B.; Karahalios, A.; Taljaard, M.; McKenzie, J.E. Evaluation of statistical methods used to meta-analyse results from interrupted time series studies: A simulation study. Res. Synth. Methods 2023, 14(6), 882–902. [Google Scholar] [CrossRef]
- Research C for BE and. Considerations for the use of the Plausible Mechanism Framework to Develop Individualized Therapies that Target Specific Genetic Conditions with Known Biological Cause [Internet]. FDA; 2026 [cited 2026 Jul 27]. Available online: https://www.fda.gov/regulatory-information/search-fda-guidance-documents/considerations-use-plausible-mechanism-framework-develop-individualized-therapies-target-specific.
- Saldaris, J.; Leonard, H.; Jacoby, P.; Marsh, E.D.; Benke, T.A.; Demarest, S.; et al. Initial validation and reliability of the CDKL5 deficiency disorder hand function scale (CDD-Hand). J. Child Neurol. 2022, 37(6), 541–7. [Google Scholar] [CrossRef]
- Georgiou, A.; Pearson, M. Measuring outcomes with tools of proven feasibility and utility: the example of a patient-focused asthma measure. J. Eval. Clin. Pract. 2002, 8(2), 199–204. [Google Scholar] [CrossRef]
- Slade, M.; Thornicroft, G.; Glover, G. The feasibility of routine outcome measures in mental health. Soc. Psychiatry Psychiatr. Epidemiol. 1999, 34(5), 243–9. [Google Scholar] [CrossRef]
Figure 1.
Quasi-experimental trial design and two increasing pattern assumptions. (A) The quasi-experimental trial design consists of two periods: pre-treatment period and post-treatment period. Interrupted time series analysis based on longitudinal data is performed at the end of the quasi-experimental trial. (B) Two increasing patterns of the continuous outcome in the simulation (gradual treatment effect vs. abrupt and gradual treatment effect).
Figure 1.
Quasi-experimental trial design and two increasing pattern assumptions. (A) The quasi-experimental trial design consists of two periods: pre-treatment period and post-treatment period. Interrupted time series analysis based on longitudinal data is performed at the end of the quasi-experimental trial. (B) Two increasing patterns of the continuous outcome in the simulation (gradual treatment effect vs. abrupt and gradual treatment effect).
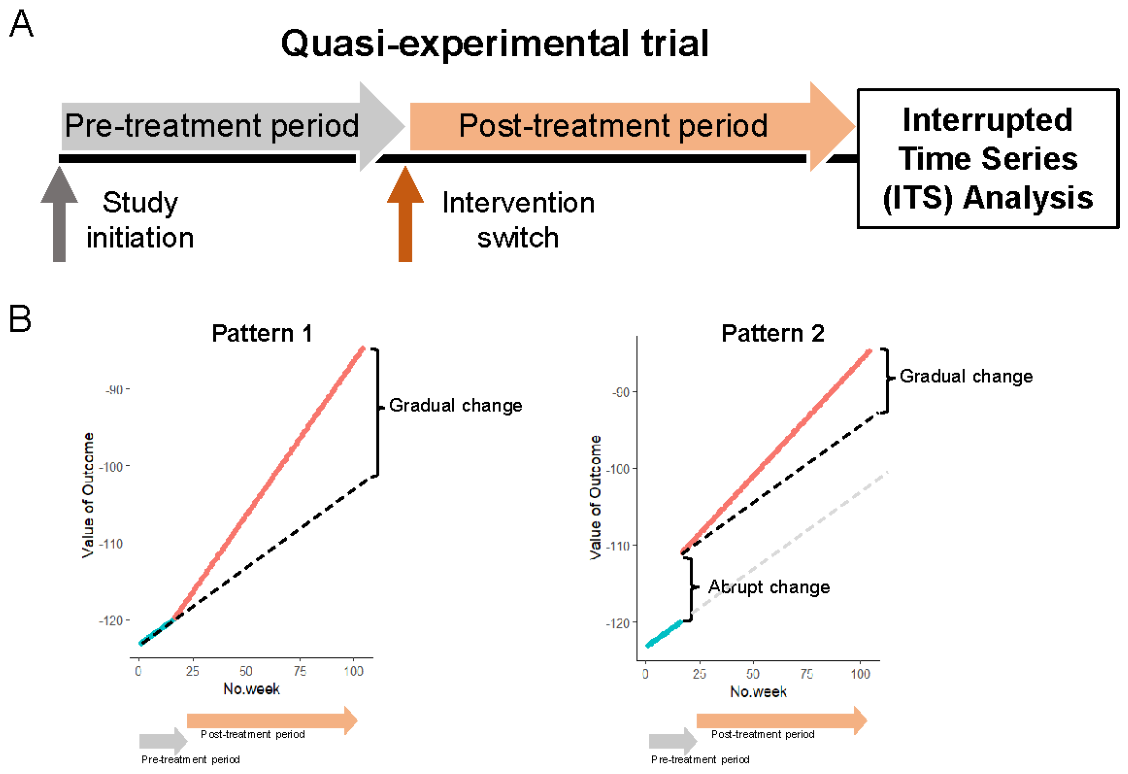
Figure 2.
Type I error rates and power across varying pre-treatment period length. (A) Type I error rates of three statistical methods in two outcome increasing patterns. (B) Power of three statistical methods in two outcome increasing patterns.
Figure 2.
Type I error rates and power across varying pre-treatment period length. (A) Type I error rates of three statistical methods in two outcome increasing patterns. (B) Power of three statistical methods in two outcome increasing patterns.
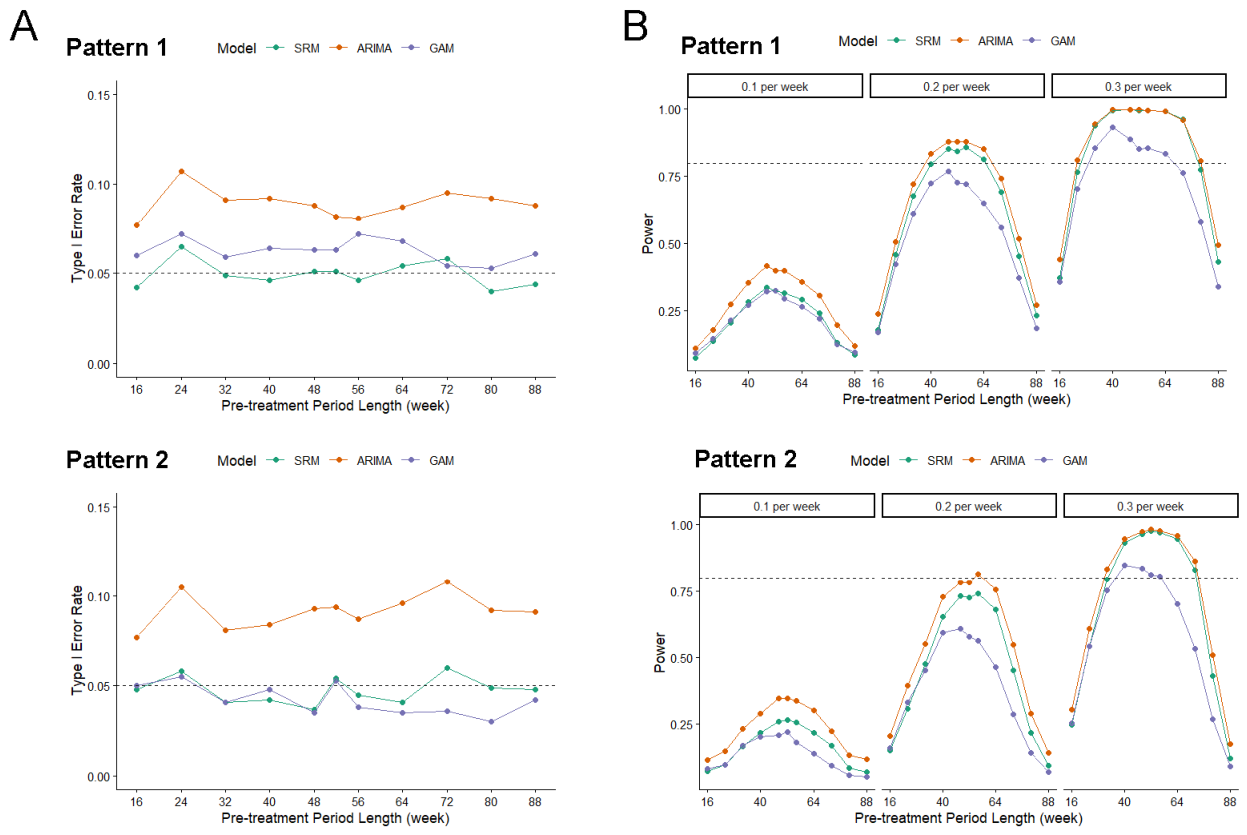
Figure 3.
The influence of outcome measurement frequency and variance on the performance of three statistical models. (A) The type I error rate and power of three models when the outcome is assumed to be measured weekly, biweekly, and monthly. (B) The type I error rate and power of three models when the outcome variance ranges from 1 to 5. (C) The differences between the 52-week treatment increase estimations and settings across various outcome variances and measurement frequency.
Figure 3.
The influence of outcome measurement frequency and variance on the performance of three statistical models. (A) The type I error rate and power of three models when the outcome is assumed to be measured weekly, biweekly, and monthly. (B) The type I error rate and power of three models when the outcome variance ranges from 1 to 5. (C) The differences between the 52-week treatment increase estimations and settings across various outcome variances and measurement frequency.
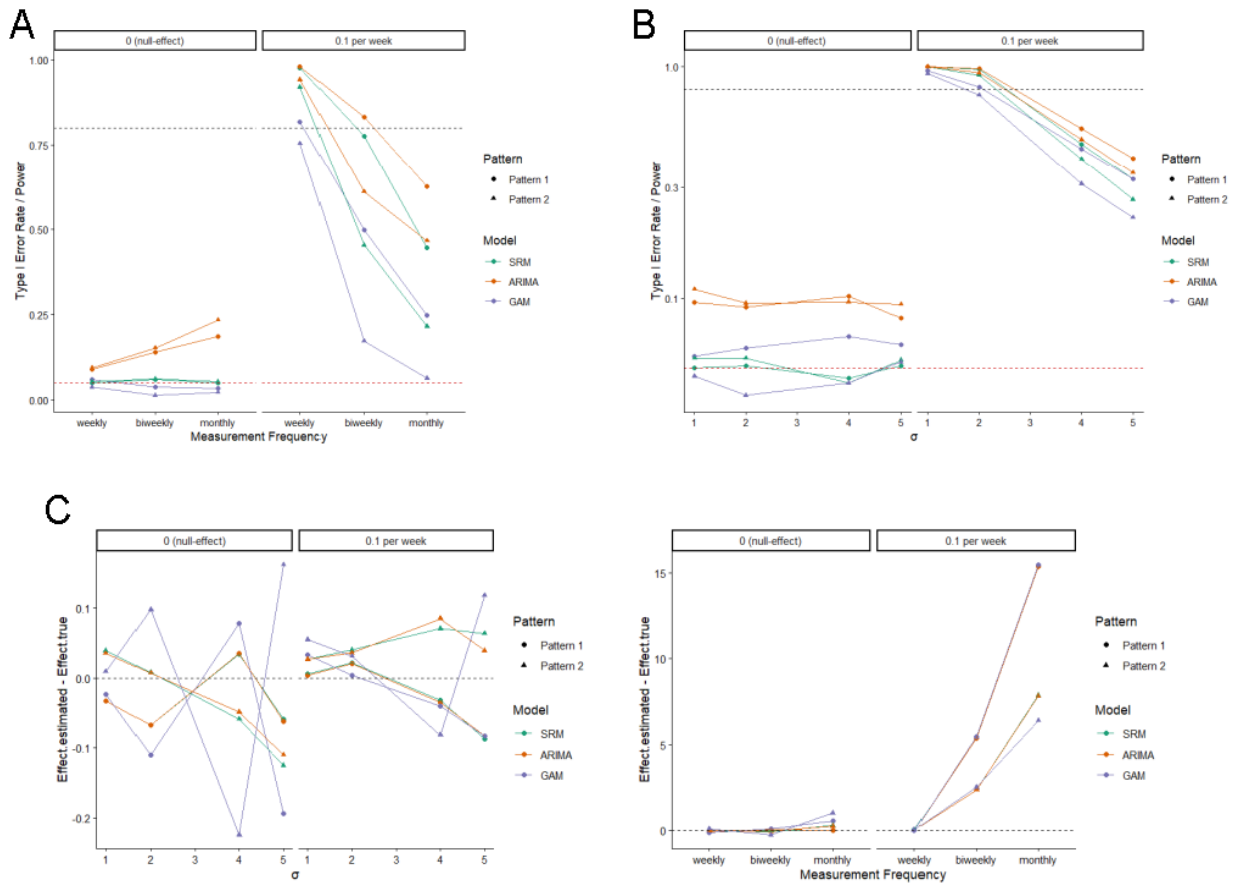
Figure 4.
The performance of the Bayesian GAM model across varying pre-treatment period length in a 2-year trial design.
Figure 4.
The performance of the Bayesian GAM model across varying pre-treatment period length in a 2-year trial design.
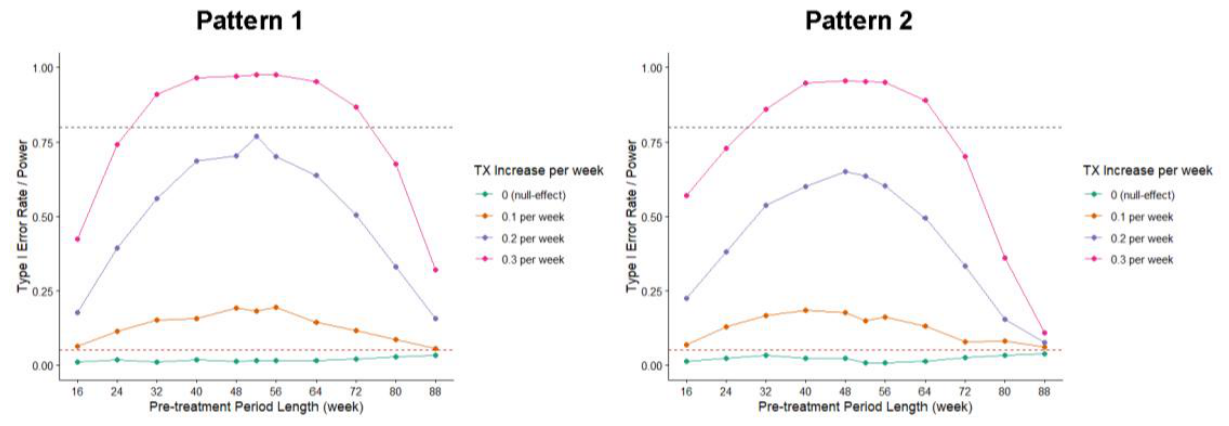
Figure 5.
The performance of the Bayesian GAM model across varying pre-treatment period length in a 1.5-year trial design.
Figure 5.
The performance of the Bayesian GAM model across varying pre-treatment period length in a 1.5-year trial design.
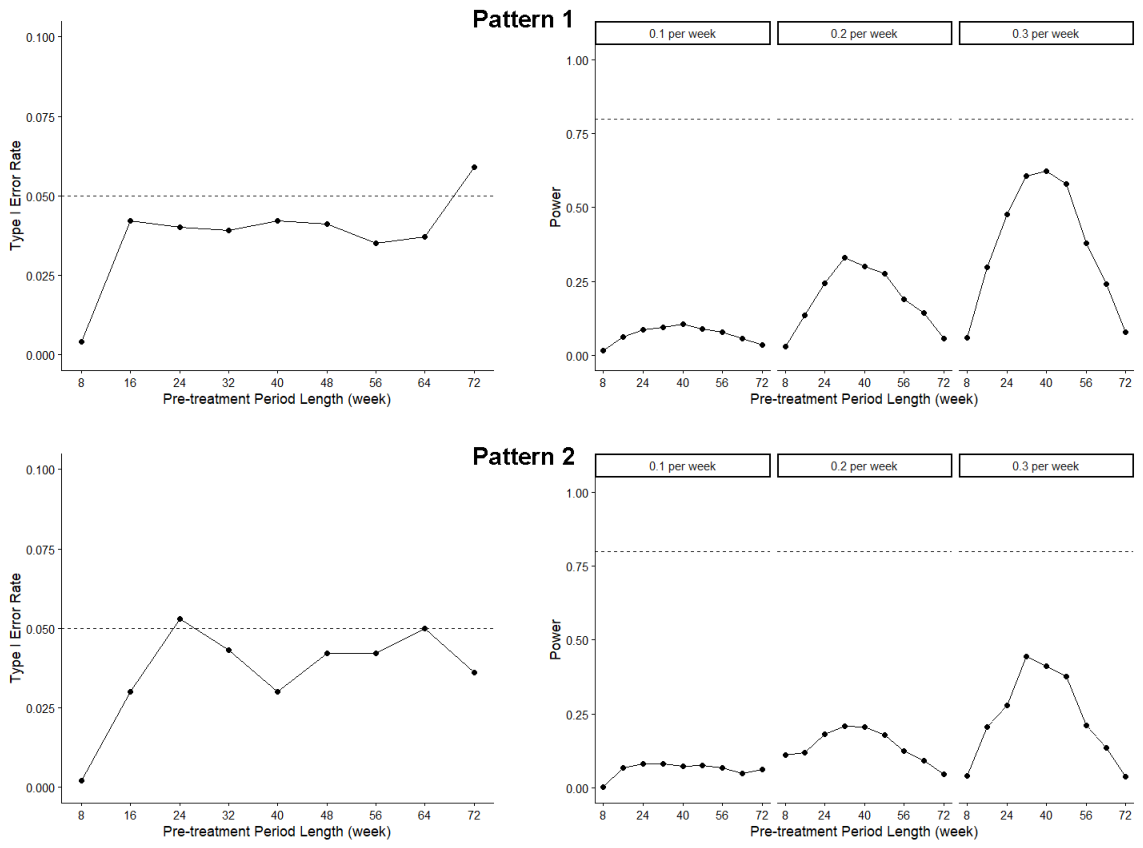

Table 1.
Three statistical methods for analyzing ITS data.
| Feature | SRM: segmented linear regression model | ARIMA: autoregressive integrated moving average model | GAM: generalized additive model |
| Core idea | To model the outcome over time with two separate lines to the data: one before the intervention and one after the intervention | To model the trend of the outcome by regressing on the outcome measured at previous time points | To model the outcome with flexible nonlinear relationships with predictors |
| Key feature | Allows slope changes at breakpoints | Captures autocorrelation and stochastic time patterns | Captures nonlinear smooth trends |
| Assumptions | Linear relationship within each segment | Stationary time series: a constant mean, constant variance, and constant covariance | Smooth underlying relationships |
| Autocorrelation | Usually not handled | Good | Limited |
Disclaimer/Publisher’s Note: The statements, opinions and data contained in all publications are solely those of the individual author(s) and contributor(s) and not of MDPI and/or the editor(s). MDPI and/or the editor(s) disclaim responsibility for any injury to people or property resulting from any ideas, methods, instructions or products referred to in the content. |
© 2026 by the authors. Licensee MDPI, Basel, Switzerland. This article is an open access article distributed under the terms and conditions of the Creative Commons Attribution (CC BY) license (http://creativecommons.org/licenses/by/4.0/).
Copyright: This open access article is published under a Creative Commons CC BY 4.0 license, which permit the free download, distribution, and reuse, provided that the author and preprint are cited in any reuse.