

Submitted:
27 October 2026
Posted:
28 October 2026
You are already at the latest version
Preprints on COVID-19 and SARS-CoV-2
Abstract
Background: Mycoplasma pneumoniae, a leading cause of paediatric community-acquired pneumonia, nearly disappeared under COVID-19 non-pharmaceutical interventions and re-emerged with a delay relative to other respiratory pathogens. Whether its timing tracks national and regional COVID-19 waves has not been quantified globally. Methods: From the Global Burden of Disease Study 2023 Results Tool we extracted, for 204 countries and seven GBD super-regions, deaths and disability-adjusted life years (DALYs) at ages 0–19 years from lower respiratory infections attributable to Mycoplasma pneumoniae (2019–2023) and deaths and incident cases of COVID-19 (2020–2023; 2019 set to zero by definition). For each geography we located the COVID-19 peak year, the Mycoplasma trough (minimum 2020–2023) and the post-trough rebound maximum, computed the peak-to-peak interval, and tested Spearman correlations between COVID-19 peak intensity and trough depth or rebound amplitude, with lagged z-score cross-correlations and alternative COVID-19 calibres (all-ages deaths; 0–19-year incidence) as sensitivity analyses. Results: Globally, Mycoplasma-attributed deaths at ages 0–19 years fell from 27,388 in 2019 to a trough of 22,711 in 2021 (−17.1%) and partially recovered to 26,366 in 2023 (−3.7% versus 2019), while paediatric COVID-19 deaths peaked at 147,850 in 2021. The modal interval from the COVID-19 peak to the Mycoplasma rebound peak was +2 years in five of seven super-regions and in 115 of 204 countries (56%; median 2 years). COVID-19 peak intensity showed no significant correlation with trough depth or rebound amplitude (|r| ≤ 0.21; p ≥ 0.09). Because rebound maxima fell in 2023—the final data year—in six of seven super-regions, the +2-year interval is partly a right-censoring artefact. The pattern strengthened under all-ages COVID-19 mortality (64% of countries at +2 years), shifted to +1 year under 0–19-year incidence, and was unchanged under the DALY calibre. Conclusions: Paediatric Mycoplasma-attributed mortality troughs followed COVID-19 mortality peaks with a modal two-year lag, consistent with suppression and delayed re-emergence under pandemic interventions, but with no detectable intensity gradient. The timing signal is robust to all-ages mortality calibration, calibre-dependent for incidence, and bounded by right-censoring at 2023; continued surveillance is required to observe complete rebound cycles.
Keywords:
mycoplasma pneumoniae
; COVID-19
; lower respiratory infection
; child mortality
; adolescents
; global burden of disease
; GBD 2023
; non-pharmaceutical interventions
; pathogen interference
; rebound
1. Introduction
Mycoplasma pneumoniae is a leading bacterial cause of community-acquired pneumonia in school-age children and adolescents—the archetypal agent of “walking pneumonia”—and exhibits characteristic multiannual epidemic cycles documented in longitudinal surveillance [1,2,3]. Transmission is predominantly respiratory and prolonged carriage is common, so population-level circulation is sensitive to contact patterns and respiratory hygiene [1,4].
The COVID-19 pandemic interrupted this cycle. Under non-pharmaceutical interventions (NPIs), M. pneumoniae detections nearly disappeared globally during 2020–2021, with re-emergence delayed relative to other respiratory pathogens in a prospective multinational surveillance network [5]. By late 2023, upsurges of M. pneumoniae respiratory illness among children in northern China prompted a WHO Disease Outbreak News release [6], and increases were subsequently reported across Europe and elsewhere [7,8]. These observations are consistent with models predicting that NPI-induced disruption of endemic respiratory pathogens would be followed by rebound dynamics once interventions relaxed [9], and with the “immunity debt” hypothesis for childhood respiratory infections [10].
What remains unquantified at global scale is the temporal coupling between the two phenomena: whether the timing of paediatric Mycoplasma suppression and rebound tracks the timing of national or regional COVID-19 waves, and whether more intense COVID-19 waves were followed by deeper troughs or stronger rebounds. Surveillance-based studies cover selected countries and rely on laboratory detections that are not available uniformly across the 204 countries and territories of the Global Burden of Disease (GBD) Study. The GBD 2023 round provides, for the first time in a single release, internally consistent estimates of both paediatric COVID-19 mortality (2020–2023) and lower respiratory infection (LRI) mortality attributable to M. pneumoniae within a counterfactual population-attributable-fraction framework [11,12], enabling a comparable, global, regionally aggregated assessment of peak timing.
We therefore conducted a secondary analysis of GBD 2023 to (i) describe the trough-and-rebound trajectory of M. pneumoniae-attributed mortality at ages 0–19 years globally, across seven GBD super-regions and in nine key countries, against the paediatric COVID-19 mortality wave; (ii) quantify the interval between the COVID-19 peak year and the Mycoplasma rebound peak year at super-region and country level; (iii) test whether COVID-19 peak intensity predicts trough depth or rebound amplitude; and (iv) probe robustness to alternative COVID-19 calibres (all-ages deaths; 0–19-year incidence) and to right-censoring of the rebound window at 2023. Because GBD 2023 does not publish pathogen-attributed incidence, Mycoplasma-attributed deaths and DALYs—the only available pathogen-specific measures—serve here as proxies for population-level circulation, analysed as a dual track; this proxy logic and its consequences are stated explicitly and revisited in the Limitations.
2. Methods
2.1. Data Sources and Definitions
This is a secondary analysis of publicly available, modelled estimates from the GBD Study 2023, coordinated by the Institute for Health Metrics and Evaluation (IHME) [13]. Extractions from the GBD Results Tool (https://vizhub.healthdata.org/gbd-results) in the cause and etiology interfaces were combined.
Mycoplasma pneumoniae series. Within the GBD etiology interface, LRI deaths (cause: lower respiratory infections) attributable to Mycoplasma (rei_id 423) were extracted for 204 countries and territories, both sexes, four paediatric age bands (<5, 5–9, 10–14, 15–19 years), 1990–2023, as death numbers with 95% uncertainty intervals (UIs); pathogen-attributed incidence is not published by the platform, so the mortality series is the only available pathogen-specific measure and is used as a proxy for circulation intensity. The 0–19-year aggregate is the sum of the four bands. Extraction accuracy was verified by cell-level read-back against the raw downloads (27,744 rows; maximum absolute difference 4.6×10⁻¹³) and against the GBD-modelled global 2023 total (author-tabulated country sum 26,366 versus modelled 26,382; 0.06% difference, consistent with rounding in national cells).
Mycoplasma DALY series (dual-track robustness). Because the mortality series is a proxy, the analysis was replicated under the disability-adjusted life-year (DALY) calibre: Mycoplasma-attributed LRI DALYs (same etiology interface, rei_id 423) were extracted as numbers and rates for the global aggregate, the seven super-regions and the nine key countries (1990–2023), and as numbers and rates for all 204 countries across the full 1990–2023 series (55,488 rows), with YLL companions (204 countries, 1992–2023; super-regions, 1990–2023) and YLD companions at super-region level for decomposition checks (zero duplicate or missing cells across all extraction tasks). The author-tabulated country sums reproduce the modelled global totals within 0.07% in every year, DALYs equal YLLs + YLDs exactly, and the 2023 global DALY total (2,305,466) is 87.4 times the corresponding death count—consistent with childhood deaths dominating DALYs at GBD standard life expectancy.
COVID-19 series. COVID-19 (cause_id 1048) deaths and incident cases (numbers and rates per 100,000) were extracted for the same 204 countries, both sexes, ages 0–19 years (four bands) plus All Ages, 2020–2023 (task ID cec819c174711b3ba97cfd12ed8a172e; 16,320 rows with zero duplicate or missing cells; overlapping cells of an earlier snapshot matched exactly). In GBD 2023, COVID-19 burden is estimated from 2020 onward and reflects excess-mortality-based modelling rather than reported deaths [14]; the 2019 value is set to zero by definition and labelled as such throughout. Both series inherit the GBD 2023 cause-of-death estimation framework [15]. Country-to-super-region mapping (seven GBD super-regions) was taken from the Mycoplasma panel’s superregion field. Population at ages 0–19 years was back-computed from GBD number/rate pairs, consistent with the GBD 2023 demographic estimates [16], to derive combined 0–19-year mortality rates.
2.2. Analysis Window and Regional Aggregation
The analysis window is 2019–2023: 2019 is the pre-pandemic baseline, and 2020–2023 spans the pandemic and early post-pandemic period—the full extent of COVID-19 estimation in GBD 2023. Country estimates were aggregated to super-region and global level by summation of death numbers; super-region and global rates use summed populations. All analyses are descriptive at the geography level (7 super-regions; 204 countries and territories) and are ecological in design.
2.3. Peak and Trough Metrics
For each geography we defined, on the 0–19-year death series: (i) COVID-19 peak year = argmax of COVID-19 deaths over 2020–2023, with peak deaths and peak mortality rate (per 100,000 population aged 0–19 years); (ii) Mycoplasma trough year = argmin of Mycoplasma-attributed deaths over 2020–2023, with trough depth (%) = (1 − trough value / 2019 baseline) × 100; (iii) rebound peak year = argmax of Mycoplasma-attributed deaths over the post-trough period (trough year to 2023), with rebound amplitude expressed versus the trough (%) and versus the 2019 baseline (%), and an indicator of whether the rebound exceeded 2019; and (iv) peak-to-peak interval (lag, years) = rebound peak year − COVID-19 peak year, positive values meaning the Mycoplasma rebound peak follows the COVID-19 peak. Because the series ends in 2023, a rebound peak located in 2023 indicates a series endpoint still rising rather than a completed rebound cycle; this right-censoring is reported explicitly alongside every interval estimate.
2.4. Statistical Analysis
The distribution of peak-to-peak intervals was summarised across the 204 countries and the seven super-regions (mode, median, full frequency distribution). Associations between COVID-19 peak intensity (peak 0–19-year mortality rate per 100,000) and Mycoplasma trough depth or rebound amplitude versus 2019 were quantified with Spearman rank correlations at super-region (n = 7) and country (n = 204) level; two-sided p values are reported without multiplicity adjustment given the exploratory design. Lagged cross-correlations between z-scored annual COVID-19 and Mycoplasma death series (2019–2023) were computed per super-region at lags −1, 0, +1 and +2 (positive lag = COVID-19 leads Mycoplasma); overlapping sample sizes are 5 at lag 0, 4 at lag ±1 and 3 at lag +2, so these correlations are descriptive only and no inferential claims are drawn from them.
As a grouped descriptive analysis, countries were additionally stratified into quartiles of land area (n = 201 with geodesic polygon areas; Cook Islands, Niue and Tokelau unmatched) and of GDP per capita (n = 198; current US$ from the series country-covariate table), the latter used strictly as a proxy for pandemic-response and surveillance capacity and not interpreted causally. Within each quartile, country deaths were summed and the group-aggregate series indexed (Mycoplasma: group 2019 value = 100; COVID-19: group peak = 100, the 2019 value being zero by definition). Between-quartile differences in trough depth and rebound amplitude were assessed with Kruskal–Wallis tests and Spearman correlations against log area or log GDP per capita, and differences in the share of countries with a +2-year interval with χ2 tests.
2.5. Sensitivity Analyses
Three pre-specified sensitivity analyses assessed calibre dependence: (i) replacing the COVID-19 peak definition with all-ages COVID-19 deaths (Mycoplasma side unchanged, as only 0–19-year bands were available); (ii) replacing it with 0–19-year COVID-19 incidence; and (iii) repeating country-level Spearman tests restricted to the 92 countries with ≥10 Mycoplasma-attributed deaths in 2019, to limit noise from small-count series. As a further robustness track, every peak, trough, interval and correlation indicator was recomputed with Mycoplasma-attributed DALYs replacing deaths (Section 3.10; Supplementary Table S5 and Supplementary Figure S2). Analyses used Python 3 (pandas, NumPy, SciPy); all scripts and figure-source data are provided in the Supplementary Materials. Reporting follows the GATHER guideline [17]; the completed checklist accompanies this submission.
2.6. Interrupted Time Series Analysis
As a formal test of the pandemic-era break, segmented interrupted time series (ITS) regression was fitted to the annual Mycoplasma-attributed mortality rate at ages 0–19 years (per 100,000; 1990–2023, n = 34) for the global aggregate and each super-region: ln(rate) = β0 + β1·time + β2·post + β3·time_after, where time = year − 1990, post = 1(year ≥ τ) and time_after = max(year − τ, 0), so that β2 captures the immediate level change at the intervention and β3 the change in the annual trend thereafter. Rates combine country-summed deaths with 0–19-year populations back-computed from GBD number/rate pairs (Section 2.1). The intervention year τ was selected by the Bayesian information criterion (BIC) over the candidate set {2020, 2021}, with fixed τ = 2020 reported alongside as a control. Inference used Newey–West heteroskedasticity- and autocorrelation-consistent standard errors with lag ⌊n^1/3⌋ = 3. Effect measures are the level change (%) = exp(β2) − 1, the slope change (% per year) = exp(β3) − 1, and the 2023 fitted value versus the counterfactual pre-intervention trend extrapolated to 2023 (deviation %, fitted-value basis), each with 95% confidence intervals (CIs). Residual autocorrelation was assessed with the Durbin–Watson statistic and the Ljung–Box test (10 lags), and the level-change coefficient was re-estimated under a first-order autoregressive (AR(1)) error model by iterative Cochrane–Orcutt generalised least squares as a sensitivity analysis. The identical model was fitted to the DALY-rate series as a second calibre. ITS models were fitted with statsmodels (Python 3); the analysis script, the full parameter table and the fitted-series source data are provided in the Supplementary Materials (Supplementary Table S7, Supplementary Figure S7).
3. Results
3.1. Global Trajectory: A Shared 2021 Hinge
Globally, Mycoplasma-attributed deaths at ages 0–19 years fell from 27,388 (95% UI 19,656–36,871) in 2019 to a trough of 22,711 (15,657–31,681) in 2021 (−17.1% versus 2019), then rose to 24,652 in 2022 and 26,366 (18,100–36,591) in 2023, remaining 3.7% below the 2019 baseline (Figure 1A). Paediatric COVID-19 deaths followed the inverse trajectory: 99,060 in 2020, a global peak of 147,850 in 2021, then 57,218 in 2022 and 52,850 in 2023. Thus the global COVID-19 mortality peak (2021) coincided with the Mycoplasma trough, and the Mycoplasma series was still rising at the end of the study window.
A natural-variability check against the 2017–2019 baseline confirmed that the 2021 trough was not ordinary year-to-year fluctuation (Supplementary Table S6, Supplementary Figure S6). Globally, Mycoplasma-attributed deaths were near-stable across 2017–2019 (coefficient of variation 2.0%; largest single-year decline −2.5%), whereas the 2021 value deviated −18.9% from the 2017–2019 mean—7.5 times the largest baseline annual decline and well outside the observed 2017–2019 variability band. At country level, 95 of the 107 countries with an informative baseline (≥5 baseline annual deaths; 88.8%) breached their own 2017–2019 variability band in 2021. The trough year (2021) was also the year of the global COVID-19 mortality peak, so the largest Mycoplasma deficit and the COVID-19 maximum occurred simultaneously.
3.2. Super-Region Peaks, Troughs and Rebounds
Across the seven super-regions, the COVID-19 0–19-year mortality peak occurred in 2021 in six regions; the exception was Southeast Asia, East Asia, and Oceania, where the peak shifted to 2023 (driven mainly by modelled 2023 COVID-19 mortality in China) (Table 1, Figure 1B). Mycoplasma troughs concentrated in 2021 (five regions), with 2020 troughs in Central Europe, Eastern Europe, and Central Asia and the High-income super-region, and a 2022 trough in North Africa and Middle East. Trough depth ranged from 5.9% (Central Europe, Eastern Europe, and Central Asia) to 28.3% (South Asia). Rebound maxima fell in 2023 in six of seven super-regions; only two regions—Latin America and Caribbean (+10.1% versus 2019) and Central Europe, Eastern Europe, and Central Asia (+9.6%)—exceeded their 2019 baseline by 2023, the latter being the only region where the Mycoplasma rebound peaked in 2021, the same year as the COVID-19 peak (a synchronous co-peak rather than a lagged rebound).
3.3. Key Countries
Among nine key countries (the most populous 0–19-year country of each super-region plus China, the United States, the United Kingdom, India, Brazil and South Africa), trough depths ranged from 1.9% (Russian Federation) to 34.4% (China) (Table 2, Supplementary Figure S4). Intervals were +2 years in six countries; Nigeria showed +3 years (COVID-19 peak 2020), China and the Russian Federation 0 years (China’s COVID-19 peak in 2023; Russia’s Mycoplasma rebound peak in 2021). Brazil (+24.7% versus 2019), South Africa (+12.6%), the United States (+9.0%) and the Russian Federation (+10.8%) exceeded their 2019 baselines by 2023, whereas China (−26.0%), India (−12.5%), Egypt (−11.8%) and the United Kingdom (−6.1%) had not fully recovered.
3.4. Peak-to-Peak Interval Across 204 Countries
The modal peak-to-peak interval was +2 years at both aggregation levels: five of seven super-regions and 115 of 204 countries (56%; median 2 years) (Figure 1C). The full country distribution was −2 years: 3 countries; 0 years: 32; +1 year: 26; +2 years: 115; +3 years: 28. The two super-regional exceptions (interval 0) reflect opposite mechanisms—an early synchronous Mycoplasma peak in Central Europe, Eastern Europe, and Central Asia (2021) and a delayed COVID-19 peak in Southeast Asia, East Asia, and Oceania (2023). Nationally, COVID-19 peaks occurred in 2021 in 138 of 204 countries (2020: 29; 2022: 14; 2023: 23), Mycoplasma troughs concentrated in 2021 (105 countries; 2020: 40; 2022: 25; 2023: 26; no post-2019 decline in 8), and rebound maxima fell in 2023 in 176 countries (86%), with 67 countries (33%) exceeding their 2019 baseline by 2023.
3.5. Grouped Trajectories by Land Area and GDP per Capita
Grouping countries into quartiles of land area (n = 201) and of GDP per capita (n = 198; used strictly as a proxy for pandemic-response and surveillance capacity, not as a causal factor) showed that the rebound, rather than the trough depth or the interval, carried the gradient (Figure 2). Median rebound amplitude rose monotonically with land area—6.3%, 11.1%, 14.7% and 16.0% versus the trough from the smallest to the largest quartile (Kruskal–Wallis p = 1.1×10⁻⁴; Spearman ρ versus log area = 0.32)—and the share of countries with a +2-year interval was lowest in the smallest-area quartile (41% versus 58–66% in the other three; χ2 p = 0.048), whereas trough depth showed no area gradient (median 14.4% versus 17.1% in the smallest and largest quartiles; p = 0.63). Across GDP-per-capita quartiles the rebound gradient ran in the opposite direction (median 14.2% in the lowest-income quartile versus 8.2% in the highest; ρ = −0.19, p = 0.007) and trough depth was non-monotone (13.4%, 19.4%, 18.4% and 12.6% from Q1 to Q4; p = 0.025), while the +2-year share did not differ materially (70%, 57%, 51% and 54%; p = 0.23). The modal interval was +2 years in every quartile group of both stratifications (group medians all 2 years).
3.6. No Intensity Gradient
COVID-19 peak intensity showed no significant association with the Mycoplasma response at either aggregation level (Table 3, Figure 3). At super-region level (n = 7), Spearman r was 0.179 for trough depth (p = 0.70) and −0.214 for rebound amplitude versus 2019 (p = 0.64). At country level (n = 204), r was 0.118 (p = 0.092) and 0.108 (p = 0.125), respectively; restricting to the 92 countries with ≥10 Mycoplasma-attributed deaths in 2019 gave r = −0.054 (p = 0.61) and r = 0.164 (p = 0.117). Illustratively, Sub-Saharan Africa had the highest COVID-19 peak mortality rate (10.7 per 100,000) yet a shallow trough (13.1%) and no supra-baseline rebound, whereas South Asia combined the deepest trough (28.3%) with an intermediate peak rate (6.3 per 100,000).
3.7. Lagged Cross-Correlation
Cross-correlations of z-scored 2019–2023 series were consistent with a seesaw pattern (Supplementary Figure S5): at lag 0, six of seven super-regions showed negative correlations (range −0.55 to −0.95), i.e., high-COVID-19 years coincided with depressed Mycoplasma; at lag +2, six of seven were positive, five of them between +0.90 and +1.00. Given only three overlapping points at lag +2, these values are descriptive and were not subjected to significance testing.
3.8. Sensitivity Analyses
Under the all-ages COVID-19 mortality calibre, the +2-year pattern strengthened: the country-level mode remained +2 years with 130 of 204 countries (64%), and six of seven super-regions showed +2 years, because the Southeast Asia, East Asia, and Oceania COVID-19 peak reverted from 2023 to 2021 (Table 4; Supplementary Figure S1). Under the 0–19-year COVID-19 incidence calibre, incidence peaks generally shifted later (2022–2023), and the country-level modal interval became +1 year (130 of 204; 64%)—the apparent +2-year interval is therefore specific to the mortality calibre and shortens by one year when incidence is used. Spearman correlations remained non-significant under all alternative calibres except all-ages COVID-19 peak deaths versus trough depth, which reached borderline significance with a negligible effect size (r = 0.181, p = 0.0096); the qualitative conclusion of no intensity gradient was robust.
3.9. Right-Censoring of the Rebound Window
Because the series ends in 2023, rebound maxima at 2023 denote an endpoint still rising rather than an observed complete rebound cycle. Six of seven super-regional rebound maxima and 86% of country rebound maxima fell in 2023, and five of seven super-regions remained below their 2019 baseline in that year. The observed +2-year modal interval is therefore partly a truncation artefact: true rebound peaks may lie after 2023, and intervals computed here are lower bounds on completed-cycle durations for censored geographies.
3.10. DALY Track: The Mortality-Based Findings Are Unchanged
Replicating the full analysis with Mycoplasma-attributed DALYs left every conclusion intact (Supplementary Table S5, Supplementary Figure S2). Globally, DALYs at ages 0–19 years fell from 2,398,892 (95% UI 1,914,305–2,989,364) in 2019 to a trough of 1,983,879 (1,513,302–2,546,065) in 2021 (−17.3% versus 2019) and recovered to 2,305,466 (1,779,924–2,897,600) in 2023 (−3.9% versus 2019), closely mirroring the mortality trajectory (−17.1% and −3.7%). Trough years, rebound-peak years and peak-to-peak intervals were identical to the mortality track in all seven super-regions (five at +2 years) and in all nine key countries; at country level the modal interval remained +2 years in 115 of 204 countries (56%; 113 of them the same countries as under the mortality calibre), with exact interval agreement in 199 of 204 countries (97.5%). Trough depth and rebound amplitude under the two calibres correlated at r = 0.997 and r = 0.994 across countries (r = 1.00 for both at super-region level). Spearman correlations with COVID-19 peak intensity were unchanged at super-region level (r = 0.179, p = 0.70 for trough depth; r = −0.214, p = 0.64 for rebound amplitude) and remained non-significant for rebound amplitude at country level (r = 0.070, p = 0.320); the country-level correlation with DALY trough depth reached nominal significance (r = 0.157, p = 0.025) with a negligible effect size, and was null in the ≥10-death subset (r = −0.053, p = 0.62). This near-equivalence is expected mechanically: years of life lost constituted 99.6% of DALYs in 2023 (YLD share 0.4%), so the DALY series is essentially a life-expectancy-weighted rescaling of the death series (2023 DALY-to-death ratio 87.4).
3.11. Interrupted Time Series: A Significant Trend Break, a Localised Level Drop
Segmented regression of the 1990–2023 mortality-rate series confirmed a statistically significant pandemic-era change in trend everywhere, but an immediate level drop in only one super-region (Supplementary Table S7, Supplementary Figure S7). BIC selected the intervention year 2021 for the global series and four of the seven super-regions (Sub-Saharan Africa, South Asia, Southeast Asia, East Asia, and Oceania, and Latin America and Caribbean) and 2020 for the remaining three (North Africa and Middle East; Central Europe, Eastern Europe, and Central Asia; High-income); the fixed-2020 control gave the same qualitative results (global level −3.3%, p = 0.50; slope +6.3% per year, p < 0.001). Globally the immediate level change was −3.1% (95% CI −11.7 to 6.4; p = 0.52), non-significant, as in five of the seven super-regions; the exceptions were South Asia, with a significant level drop of −17.1% (−20.1 to −14.1; p < 0.001), and Central Europe, Eastern Europe, and Central Asia, with a significant upward step of +32.8% (+12.0 to +57.4; p = 0.003) consistent with its synchronous 2021 co-peak. The post-intervention slope change was significantly positive in all eight series (global +10.9% per year; range +4.5% in North Africa and Middle East to +21.6% per year in Latin America and Caribbean; all p < 0.001), i.e., the pre-2020 decline flattened or reversed after the intervention. The 2023 fitted value exceeded the counterfactual pre-intervention trend in all eight series (global +19.2%, 95% CI 7.9 to 31.7), with confidence intervals excluding zero in seven of eight (Sub-Saharan Africa +11.9%, −0.1 to 25.4, borderline). Residual diagnostics flagged strong positive autocorrelation in seven of eight series (Durbin–Watson 0.11–0.55; Ljung–Box p < 0.001), South Asia being the only well-behaved fit (Durbin–Watson 1.38; Ljung–Box p = 0.55). Under the AR(1) error sensitivity, level-change significance flipped in three super-regions: the Central Europe, Eastern Europe, and Central Asia step became non-significant (−6.0%, p = 0.16), whereas the High-income (−14.0%, p < 0.001) and North Africa and Middle East (−6.8%, p < 0.001) level drops became significant; the South Asia drop (−14.0%, p < 0.001) and the global null (p = 0.07) were unchanged. The DALY-calibre models reproduced every qualitative result (global level −3.3%, slope +11.0% per year, 2023 counterfactual deviation +19.1%, identical intervention-year selections and the same three significance flips).
4. Discussion
4.1. Principal Findings
In this global, internally consistent comparison of GBD 2023 estimates, paediatric Mycoplasma-attributed mortality troughs were tightly coupled to the COVID-19 mortality wave: the global trough (2021) coincided with the global COVID-19 peak, and the modal interval from the COVID-19 peak to the Mycoplasma rebound maximum was +2 years at super-region level (5/7) and country level (115/204, 56%). A lag-0 negative correlation between z-scored series in six of seven super-regions corroborates the seesaw morphology. Equally important is the negative result: COVID-19 peak intensity did not predict trough depth or rebound amplitude at either aggregation level. Two regional exceptions—an early synchronous rebound in Central Europe, Eastern Europe, and Central Asia and a delayed COVID-19 peak in Southeast Asia, East Asia, and Oceania—show that the coupling is temporal rather than mechanical. Grouped analyses by land-area and GDP-per-capita quartiles added a consistent secondary pattern: rebound amplitude, not trough depth or interval timing, carried the grouping gradient—stronger relative rebounds in larger countries and shallower rebounds in higher-income countries—while the +2-year modal interval held in every quartile group. Finally, the +2-year figure is partly a right-censoring artefact, and it is calibre-dependent: it strengthens under all-ages mortality and shortens to +1 year under 0–19-year incidence.
4.2. Interpretation in the Context of Surveillance Evidence
The timing pattern we observe in mortality estimates mirrors the laboratory-surveillance record. A multinational prospective survey documented near-disappearance of M. pneumoniae detections under NPIs with re-emergence delayed relative to other respiratory pathogens [5]; the late-2023 paediatric upsurge in northern China and subsequent European increases [6,7,8] align with the still-rising 2022–2023 mortality series in our data. Two non-exclusive mechanisms are consistent with these observations: direct suppression of transmission by NPIs (masks, school closures, reduced mixing) [9], and ecological interference between SARS-CoV-2 and co-circulating respiratory pathogens, possibly compounded by waning population immunity during the suppression years (“immunity debt”) [10]. The absence of an intensity gradient argues against a simple dose–response between COVID-19 wave size and Mycoplasma displacement: the near-universal, synchronised adoption of NPIs in 2020–2021 may have imposed a threshold effect largely independent of the subsequent size of national mortality waves, and GBD COVID-19 mortality—an excess-mortality-based modelled quantity [14]—may index health-system disruption more than transmission intensity per se.
Set against the full LRI aetiology panel, the Mycoplasma trough-and-rebound was unremarkable in depth. Ranking all 26 LRI aetiologies by a V-shape score (trough depth plus rebound to 2023) places Mycoplasma 19th of 26, and every one of the 26 aetiologies breached its 2017–2019 natural-variability band in both 2020 and 2021 (Supplementary Table S6, Supplementary Figure S6). The suppression–rebound morphology was therefore a near-universal, NPI-era phenomenon rather than a Mycoplasma-specific signature: it was sharpest for respiratory syncytial virus and influenza (2021 deviations of −65.2% and −62.1% from the 2017–2019 mean) and mildest for tuberculosis, a chronic infection outside the LRI aetiology panel (−4.4% from 2019 to 2021)—a gradient that tracks each pathogen’s reliance on contemporaneous person-to-person transmission. Accordingly, the contribution of this study is not to claim a unique perturbation of Mycoplasma epidemiology, but to quantify its temporal coupling to the COVID-19 wave: the peak-to-rebound interval, its regional exceptions, and its robustness across calibres.
4.3. Regional Heterogeneity
Central Europe, Eastern Europe, and Central Asia was the only region where Mycoplasma-attributed deaths peaked in 2021, simultaneously with COVID-19 (+9.6% versus 2019)—a co-peak consistent with the region’s early relaxation of interventions and with documented large 2021–2022 rebounds of other respiratory pathogens. The shifted 2023 COVID-19 peak in Southeast Asia, East Asia, and Oceania reflects GBD modelling of the late wave in China, whose abandonment of zero-COVID policies in late 2022 was followed by the nationally documented 2023 M. pneumoniae upsurge [6]; under the all-ages mortality calibre the region’s COVID-19 peak reverts to 2021 and its interval aligns with the global +2-year mode. That only Latin America and Caribbean and Central Europe, Eastern Europe, and Central Asia exceeded their 2019 baselines by 2023 underscores that, in mortality terms, the Mycoplasma rebound was globally incomplete at the end of the GBD 2023 estimation window.
4.4. Implications
For surveillance, the coupling suggests that regional COVID-19 wave timing can serve as a coarse leading indicator for the window in which delayed Mycoplasma re-emergence should be expected and proactively monitored—particularly in school-age children, the group with peak incidence [1,3] and the group in which 2023–2024 clinical upsurges were concentrated [6,8]. For clinical preparedness, an anticipated two-to-three-year post-peak window of elevated Mycoplasma activity argues for pre-emptive attention to macrolide-resistance surveillance and paediatric empirical-treatment guidance in settings approaching that window. For GBD-based monitoring of pathogen-attributed burden, our results highlight the value of publishing pathogen-attributed incidence series, which would permit direct study of circulation suppression rather than its mortality proxy.
4.5. Limitations
Several limitations qualify these findings, and we state them explicitly. First, proxy calibration: GBD 2023 publishes only fatal pathogen-attributed measures (deaths, DALYs, YLLs and YLDs) and no pathogen-attributed incidence, so Mycoplasma circulation is proxied by LRI burden attributed to Mycoplasma through a modelled population-attributable-fraction framework [11,12]. We therefore ran the analysis on a dual track—deaths and DALYs—with unchanged conclusions (Section 3.10); but because YLDs contribute only 0.4% of DALYs in this age range, both tracks are mortality-driven, and the dual-track design does not remove the proxy limitation: mortality additionally reflects health-care access, case fatality and attribution modelling, and need not track infection incidence. Second, annual resolution: GBD estimates are yearly, so within-year epidemic timing (e.g., the late-2023 Chinese upsurge [6]) is invisible and intervals are quantised to whole years. Third, right-censoring at 2023: rebound maxima at the series endpoint are endpoints still rising; the modal +2-year interval is partly a truncation artefact and true completed-cycle intervals may be longer. Fourth, ecological design: geographic units are analysed in aggregate; no individual-level or causal inference is possible, and confounding by intervention stringency, testing practices or reporting is unmeasured. Fifth, statistical power and descriptive statistics: with n = 7 at super-region level, Spearman tests are underpowered, and lagged cross-correlations rest on three to five overlapping points; country-level tests (n = 204) are dominated by small-count series, partially mitigated by the ≥10-death subset. Sixth, calibre dependence: the headline interval shifts from +2 to +1 years when COVID-19 incidence replaces mortality, and the 2019 COVID-19 value is a definitional zero. Seventh, GBD COVID-19 estimates are excess-mortality-based modelled quantities [14] that differ from reported deaths, notably the modelled 2023 peak in China. Eighth, the interrupted time series analysis carries its own caveats: the intervention year was selected post hoc by BIC, and the confidence intervals do not incorporate this selection uncertainty; the counterfactual is a fitted-value extrapolation of the pre-intervention log-linear trend, not an observed quantity, and 2023 counterfactual deviations are read on that fitted-value basis; the reported confidence intervals reflect regression precision only and do not propagate the GBD 95% uncertainty intervals of the input rates; and the eight series were tested in parallel without multiplicity adjustment, so isolated significant coefficients should be read accordingly. Moreover, GBD point-estimate series are model-smoothed, and ITS residuals were strongly autocorrelated in seven of eight series: level-change significance proved sensitive to the error model, reversing in three super-regions under the AR(1) sensitivity (Section 3.11), which is why we report both estimators rather than selecting one. Finally, each GBD round re-estimates the full time series, so these figures are specific to the GBD 2023 round.
5. Conclusions
Across 204 countries and seven super-regions of GBD 2023, paediatric Mycoplasma pneumoniae-attributed mortality exhibited a trough-and-rebound pattern that was temporally coupled to the COVID-19 wave, with a modal peak-to-peak interval of +2 years under the primary mortality calibre. The coupling is one of timing, not magnitude: COVID-19 peak intensity did not predict trough depth or rebound amplitude. Because most rebound maxima sit at the 2023 series endpoint, the observed interval is a lower bound bounded by right-censoring, and the +1-year shift under the incidence calibre cautions against over-literal reading of the two-year figure. Continued annual monitoring—and publication of pathogen-attributed incidence in future GBD rounds—is needed to observe complete rebound cycles and to confirm whether the mortality proxy matches surveillance-documented re-emergence.
Supplementary Materials
The following supporting information can be downloaded at the website of this paper posted on Preprints.org. Supplementary Figure S1, sensitivity four-panel figure (all-ages COVID-19 mortality and 0–19-year incidence calibres: country-level interval distributions, super-region intervals, and Spearman robustness; source data: sensitivity_*.csv files); Supplementary Figure S2, DALY-track versus mortality-track trajectories, 2019–2023, for the global aggregate and the seven super-regions (Mycoplasma-attributed DALYs and deaths on dual axes; panel titles give trough and rebound-peak years under both calibres; source data: fig_s2_daly_track_data.csv and daly_metrics_*.csv files); Supplementary Figure S3, the 204-country small-multiple panel (per-country dual-axis 2019–2023 series grouped by super-region; source data: fig_s3_small_multiples_data.csv); Supplementary Figure S4, dual-axis trajectories 2019–2023 for the global aggregate and the seven super-regions (panel a) and the nine key countries (panel b), with COVID-19 peak years and Mycoplasma trough years annotated (source data: fig_s4_superregion_curves_data.csv, fig_s4_key_countries_data.csv); Supplementary Figure S5, lagged cross-correlation of z-scored COVID-19 and Mycoplasma death series by super-region (Pearson r at lags −1 to +2, positive lag meaning COVID-19 leads Mycoplasma, with overlapping sample sizes 4/5/4/3; values at lag +2 rest on three overlapping points and are descriptive only; source data: fig_s5_crosscor_heatmap_data.csv); Supplementary Figure S6, natural variability versus pandemic-window deviation for the 26 LRI aetiologies, 2017–2023 (global 0–19-year deaths normalised to the 2017–2019 mean; grey band: observed 2017–2019 variability band; red circles: years outside the band; source data: natvar_global_metrics.csv); Supplementary Figure S7, interrupted time series of Mycoplasma-attributed mortality rates, 1990–2023, global and seven super-regions (observed rates, segmented fit with BIC-selected intervention year, and the counterfactual pre-intervention trend; source data: fig_s7_its_data.csv). Supplementary Figure S8, climate-layer sensitivity of the Mycoplasma trough to annual precipitation (tercile median trajectories, country scatter with OLS fit, and tercile median contrasts; source data: fig_s8_precipitation_vshape_data.csv, fig_s8_panelC_terciles.csv); and Supplementary Figure S9, temporal-resolution sensitivity: weekly COVID-19 surveillance versus annual GBD aggregates in ten small countries (source data: fig_s9_weekly_peak_counts.csv).
Author Contributions
Conceptualization: SC; Data curation: DL; Formal analysis: DL; Investigation: DL, HC, XW; Methodology: DL, SC; Software: DL; Supervision: SC; Validation: DL, HC, XW; Visualization: DL; Writing—original draft: DL; Writing—review and editing: DL, HC, XW, SC. SC is the principal investigator who conceived the study and leads its overall conduct. All authors read and approved the final manuscript.
Funding
This work was supported by the Beijing Science and Technology Nova Program Interdisciplinary Project (20230484439) and the Beijing High-Level Public Health Technical Talents Project (2023-02-33). The funders had no role in study design, data collection and analysis, decision to publish, or preparation of the manuscript.
Institutional Review Board Statement
This secondary analysis of publicly available, de-identified, aggregate estimates was exempt from institutional review board approval.
Data Availability Statement
All estimates are publicly accessible through the GBD Results Tool (https://vizhub.healthdata.org/gbd-results); the author-aggregated datasets, figure-source data and analysis code accompany this submission in the Supplementary Materials. AI tools were used for language polishing and code drafting.
Acknowledgments
We thank the Institute for Health Metrics and Evaluation (IHME), University of Washington, for making the GBD 2023 estimates publicly available through the GBD Results Tool, and the Global Burden of Disease Collaborator Network, whose primary data collection and modelling underpin all estimates analysed here.
Conflicts of Interest
The authors declare no conflicts of interest.
GATHER statement
This study adheres to the Guidelines for Accurate and Transparent Health Estimates Reporting (GATHER); the completed checklist accompanies this submission as a separate file.
Ethics approval and consent to participate
This study is a secondary analysis of de-identified, aggregate, publicly available estimates from the Global Burden of Disease (GBD) Study 2023, coordinated by the Institute for Health Metrics and Evaluation (IHME). No individual-level or identifiable data were accessed. In accordance with institutional policy for research on publicly available aggregate data, this study was exempt from institutional review board approval. No participant consent was required.
Consent for publication
Not applicable.
Availability of data and materials
All estimates analysed in this study were downloaded by the authors from the GBD Results Tool (https://vizhub.healthdata.org/gbd-results), GBD 2023 round, using fully specified, reproducible queries (COVID-19 extraction task ID cec819c174711b3ba97cfd12ed8a172e; Mycoplasma DALY/YLL/YLD extraction task IDs are listed in the Supplementary Materials (data availability section)). The author-aggregated datasets underlying every figure and table, the figure-source data files, and the complete analysis code accompany this submission in the Supplementary Materials; the unmodified raw GBD extractions are publicly available from the GBD Results Tool and are also available from the corresponding author on reasonable request.
Abbreviations
AR(1): first-order autoregressive; BIC: Bayesian information criterion; CI: confidence interval; DALY: disability-adjusted life-year; GBD: Global Burden of Disease; GATHER: Guidelines for Accurate and Transparent Health Estimates Reporting; IHME: Institute for Health Metrics and Evaluation; ITS: interrupted time series; LRI: lower respiratory infection; MP: Mycoplasma pneumoniae; NPI: non-pharmaceutical intervention; UI: uncertainty interval; YLD: years lived with disability; YLL: years of life lost.
References
- Waites, K.B.; Talkington, D.F. Mycoplasma pneumoniae and its role as a human pathogen. Clin. Microbiol. Rev. 2004, 17(4), 697–728. [Google Scholar] [CrossRef] [PubMed]
- Waites, K.B.; Xiao, L.; Liu, Y.; Balish, M.F.; Atkinson, T.P. Mycoplasma pneumoniae from the respiratory tract and beyond. Clin. Microbiol. Rev. 2017, 30(3), 747–809. [Google Scholar] [CrossRef] [PubMed]
- Jain, S.; Williams, D.J.; Arnold, S.R.; Ampofo, K.; Bramley, A.M.; Reed, C.; et al. Community-acquired pneumonia requiring hospitalization among U.S. children. N Engl. J. Med. 2015, 372(9), 835–845. [Google Scholar] [CrossRef] [PubMed]
- Meyer Sauteur, P.M.; van Rossum, A.M.C.; Vink, C. Mycoplasma pneumoniae in children: carriage, pathogenesis, and antibiotic resistance. Curr. Opin. Infect. Dis. 2014, 27(3), 220–227. [Google Scholar] [CrossRef] [PubMed]
- Meyer Sauteur, P.M.; Chalker, V.J.; Berger, C.; Nir-Paz, R.; Beeton, M.L. ESGMAC and the ESGMAC–MyCOVID study group. Mycoplasma pneumoniae: delayed re-emergence after COVID-19 pandemic restrictions. Lancet Microbe 2024, 5(2), e100–e102. [Google Scholar] [PubMed]
- World Health Organization. Upsurge of respiratory illnesses among children – northern China. In Disease Outbreak News; World Health Organization: Geneva, 2023; Available online: https://www.who.int/emergencies/disease-outbreak-news/item/2023-DON494 (accessed on 13 October 2026).
- Beeton, M.L.; Zhang, X.S.; Uldum, S.A.; Bébéar, C.; Dumke, R.; Gullsby, K.; et al. Mycoplasma pneumoniae infections, 11 countries in Europe and Israel, 2011 to 2016. Euro Surveill. 2020, 25(2), 1900112. [Google Scholar] [CrossRef] [PubMed]
- European Centre for Disease Prevention and Control. Mycoplasma pneumoniae infections in the EU/EEA: increase in infections observed in 2023–2024 [epidemiological update]; ECDC: Stockholm, 2024; Available online: https://www.ecdc.europa.eu/en/mycoplasma-pneumoniae-infections (accessed on 13 October 2026).
- Baker, R.E.; Park, S.W.; Yang, W.; Vecchi, G.A.; Metcalf, C.J.E.; Grenfell, B.T. The impact of COVID-19 nonpharmaceutical interventions on the future dynamics of endemic infections. Proc. Natl. Acad. Sci. USA 2020, 117(48), 30547–30553. [Google Scholar] [CrossRef] [PubMed]
- Cohen, R.; Ashman, M.; Taha, M.K.; Varon, E.; Angoulvant, F.; Levy, C.; et al. Pediatric Infectious Disease Group (GPIP) position paper on the immune debt of the COVID-19 pandemic in childhood: how can we fill the immunity gap? Infect. Dis. Now. 2021, 51(5), 418–423. [Google Scholar] [CrossRef] [PubMed]
- GBD 2023 Lower Respiratory Infections and Antimicrobial Resistance Collaborators. Global burden of lower respiratory infections and aetiologies, 1990–2023: a systematic analysis for the Global Burden of Disease Study 2023. Lancet Infect. Dis. 2026, 26(4), 343–361. [CrossRef] [PubMed]
- GBD 2021 Lower Respiratory Infections and Antimicrobial Resistance Collaborators. Global, regional, and national incidence and mortality burden of non-COVID-19 lower respiratory infections and aetiologies, 1990–2021: a systematic analysis from the Global Burden of Disease Study 2021. Lancet Infect. Dis. 2024, 24(9), 974–1002. [CrossRef] [PubMed]
- Institute for Health Metrics and Evaluation (IHME). GBD Results Tool. Seattle, WA: IHME, University of Washington. Available online: https://vizhub.healthdata.org/gbd-results (accessed on August–October 2026).
- COVID-19 Excess Mortality Collaborators. Estimating excess mortality due to the COVID-19 pandemic: a systematic analysis of COVID-19-related mortality, 2020–21. Lancet 2022, 399(10334), 1513–1536. [Google Scholar] [CrossRef] [PubMed]
- GBD 2023 Causes of Death Collaborators. Global burden of 292 causes of death in 204 countries and territories and 660 subnational locations, 1990–2023: a systematic analysis for the Global Burden of Disease Study 2023. Lancet 2025, 406(10513), 1811–1872. [CrossRef] [PubMed]
- GBD 2023 Demographics Collaborators. Global age-sex-specific all-cause mortality and life expectancy estimates for 204 countries and territories and 660 subnational locations, 1950–2023: a demographic analysis for the Global Burden of Disease Study 2023. Lancet 2025, 406(10513), 1731–1810. [Google Scholar] [CrossRef] [PubMed]
- Stevens, G.A.; Alkema, L.; Black, R.E.; Boerma, J.T.; Collins, G.S.; Ezzati, M.; et al. Guidelines for Accurate and Transparent Health Estimates Reporting: the GATHER statement. Lancet 2016, 388(10062), e19–e23. [Google Scholar] [CrossRef] [PubMed]
Figure 1.
Spatiotemporal pattern of COVID-19 and Mycoplasma-attributed mortality, ages 0–19 years, 2019–2023. (A) Global dual-axis trajectory: deaths from lower respiratory infections attributable to Mycoplasma pneumoniae (mist blue, left axis) and COVID-19 deaths (terracotta, right axis), with the 2021 Mycoplasma trough (22,711 deaths; −17.1% versus 2019) and the 2021 COVID-19 peak (147,850 deaths) annotated. (B) Mini dual-axis trajectories for the seven GBD super-regions; dotted lines mark the Mycoplasma trough year and the COVID-19 peak year in each region. (C) Distribution across the 204 countries and territories of the interval from the COVID-19 peak year to the Mycoplasma rebound-peak year, stacked by GBD super-region (mode +2 years, 115/204 countries, 56%; median 2 years); positive values indicate the Mycoplasma rebound follows the COVID-19 peak, and intervals ending at a 2023 rebound maximum are lower bounds owing to right-censoring. The 2019 COVID-19 value is zero by definition (GBD 2023 estimates COVID-19 burden from 2020). Source data: Supplementary fig_data (fig_f1_superregion_curves_data.csv, fig_f1_lag_distribution_data.csv).
Figure 1.
Spatiotemporal pattern of COVID-19 and Mycoplasma-attributed mortality, ages 0–19 years, 2019–2023. (A) Global dual-axis trajectory: deaths from lower respiratory infections attributable to Mycoplasma pneumoniae (mist blue, left axis) and COVID-19 deaths (terracotta, right axis), with the 2021 Mycoplasma trough (22,711 deaths; −17.1% versus 2019) and the 2021 COVID-19 peak (147,850 deaths) annotated. (B) Mini dual-axis trajectories for the seven GBD super-regions; dotted lines mark the Mycoplasma trough year and the COVID-19 peak year in each region. (C) Distribution across the 204 countries and territories of the interval from the COVID-19 peak year to the Mycoplasma rebound-peak year, stacked by GBD super-region (mode +2 years, 115/204 countries, 56%; median 2 years); positive values indicate the Mycoplasma rebound follows the COVID-19 peak, and intervals ending at a 2023 rebound maximum are lower bounds owing to right-censoring. The 2019 COVID-19 value is zero by definition (GBD 2023 estimates COVID-19 burden from 2020). Source data: Supplementary fig_data (fig_f1_superregion_curves_data.csv, fig_f1_lag_distribution_data.csv).
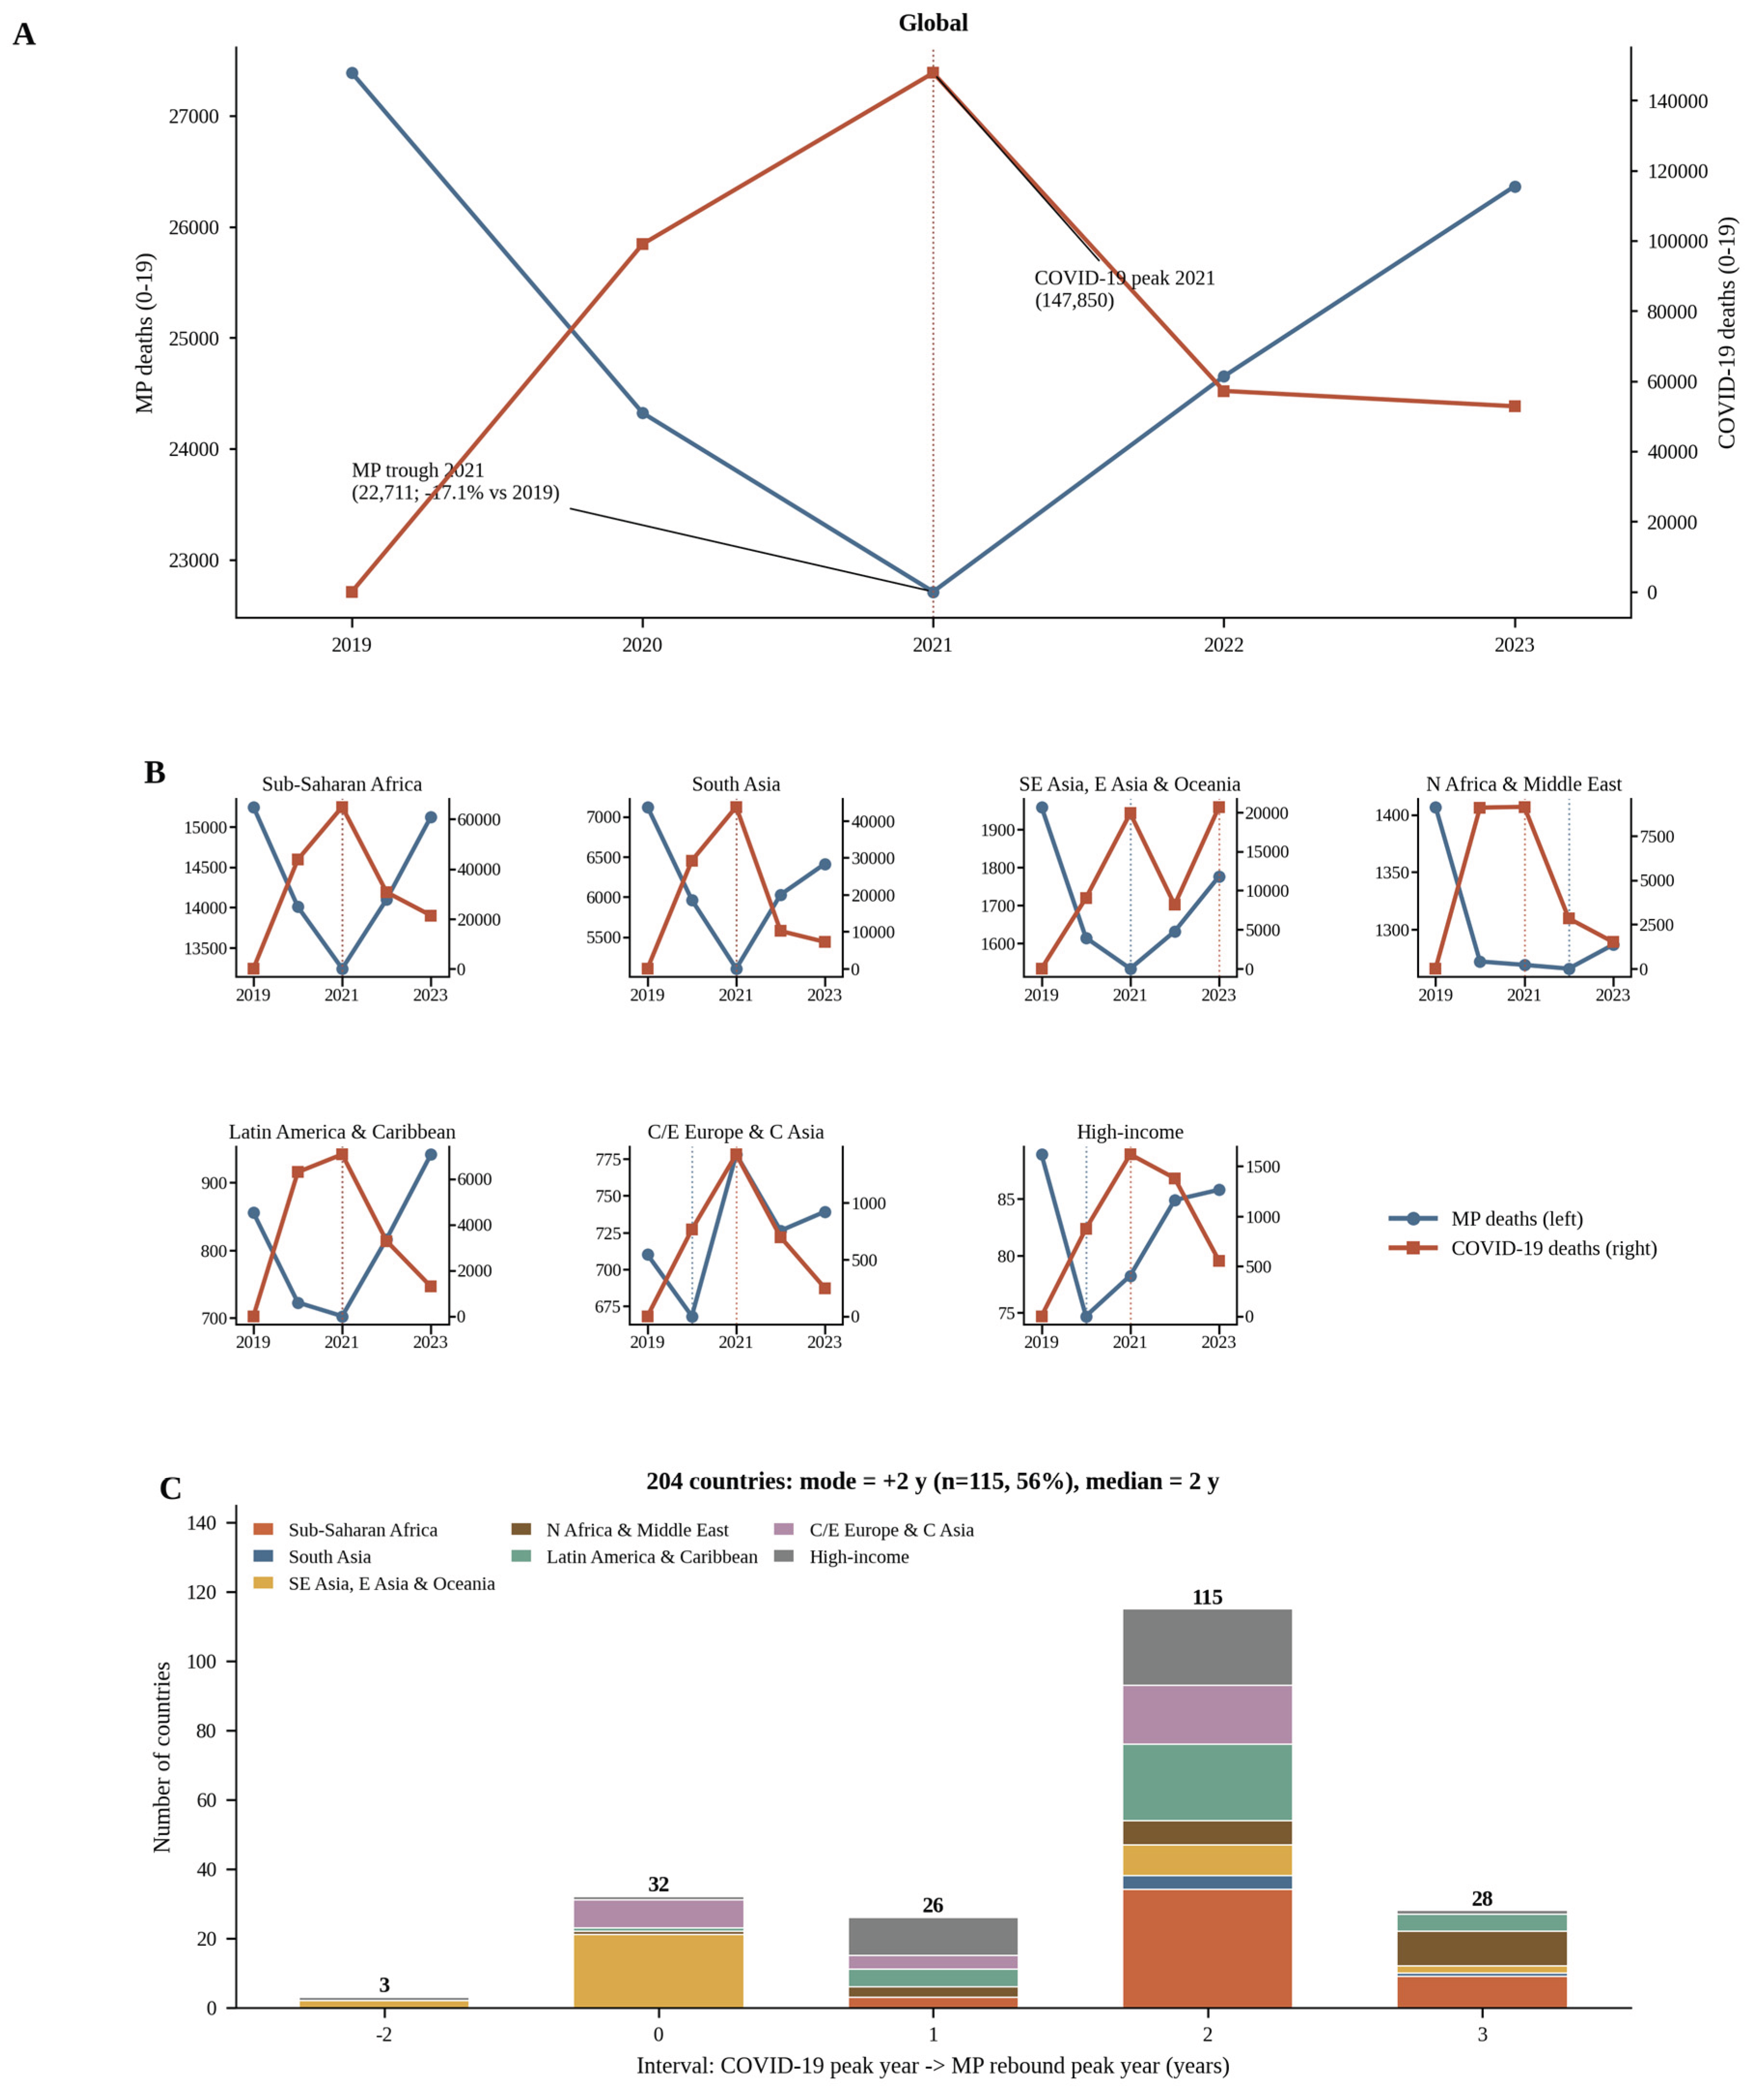
Figure 2.
Group-aggregate trajectories by country land-area and GDP-per-capita quartiles, ages 0–19 years, 2019–2023. Countries were grouped into quartiles of land area (upper row; n = 201 with data) and of GDP per capita (lower row; n = 198 with data), the latter used strictly as a proxy for pandemic-response and surveillance capacity and not interpreted causally. Within each quartile, deaths were summed across countries and the group series indexed: Mycoplasma-attributed deaths to the group 2019 value = 100 (left column, A and C) and COVID-19 deaths to the group peak = 100 (right column, B and D; the 2019 value is zero by definition). Group sizes (number of countries) are annotated in each panel; quartiles are labelled directly at the curve ends and in the shared key at the bottom, running from Q1 (smallest area / lowest GDP per capita, lightest shade) to Q4 (largest area / highest GDP per capita, darkest shade). Source data: Supplementary fig_data (fig_f2_grouped_curves_data.csv, fig_f2_grouped_metrics_data.csv).
Figure 2.
Group-aggregate trajectories by country land-area and GDP-per-capita quartiles, ages 0–19 years, 2019–2023. Countries were grouped into quartiles of land area (upper row; n = 201 with data) and of GDP per capita (lower row; n = 198 with data), the latter used strictly as a proxy for pandemic-response and surveillance capacity and not interpreted causally. Within each quartile, deaths were summed across countries and the group series indexed: Mycoplasma-attributed deaths to the group 2019 value = 100 (left column, A and C) and COVID-19 deaths to the group peak = 100 (right column, B and D; the 2019 value is zero by definition). Group sizes (number of countries) are annotated in each panel; quartiles are labelled directly at the curve ends and in the shared key at the bottom, running from Q1 (smallest area / lowest GDP per capita, lightest shade) to Q4 (largest area / highest GDP per capita, darkest shade). Source data: Supplementary fig_data (fig_f2_grouped_curves_data.csv, fig_f2_grouped_metrics_data.csv).
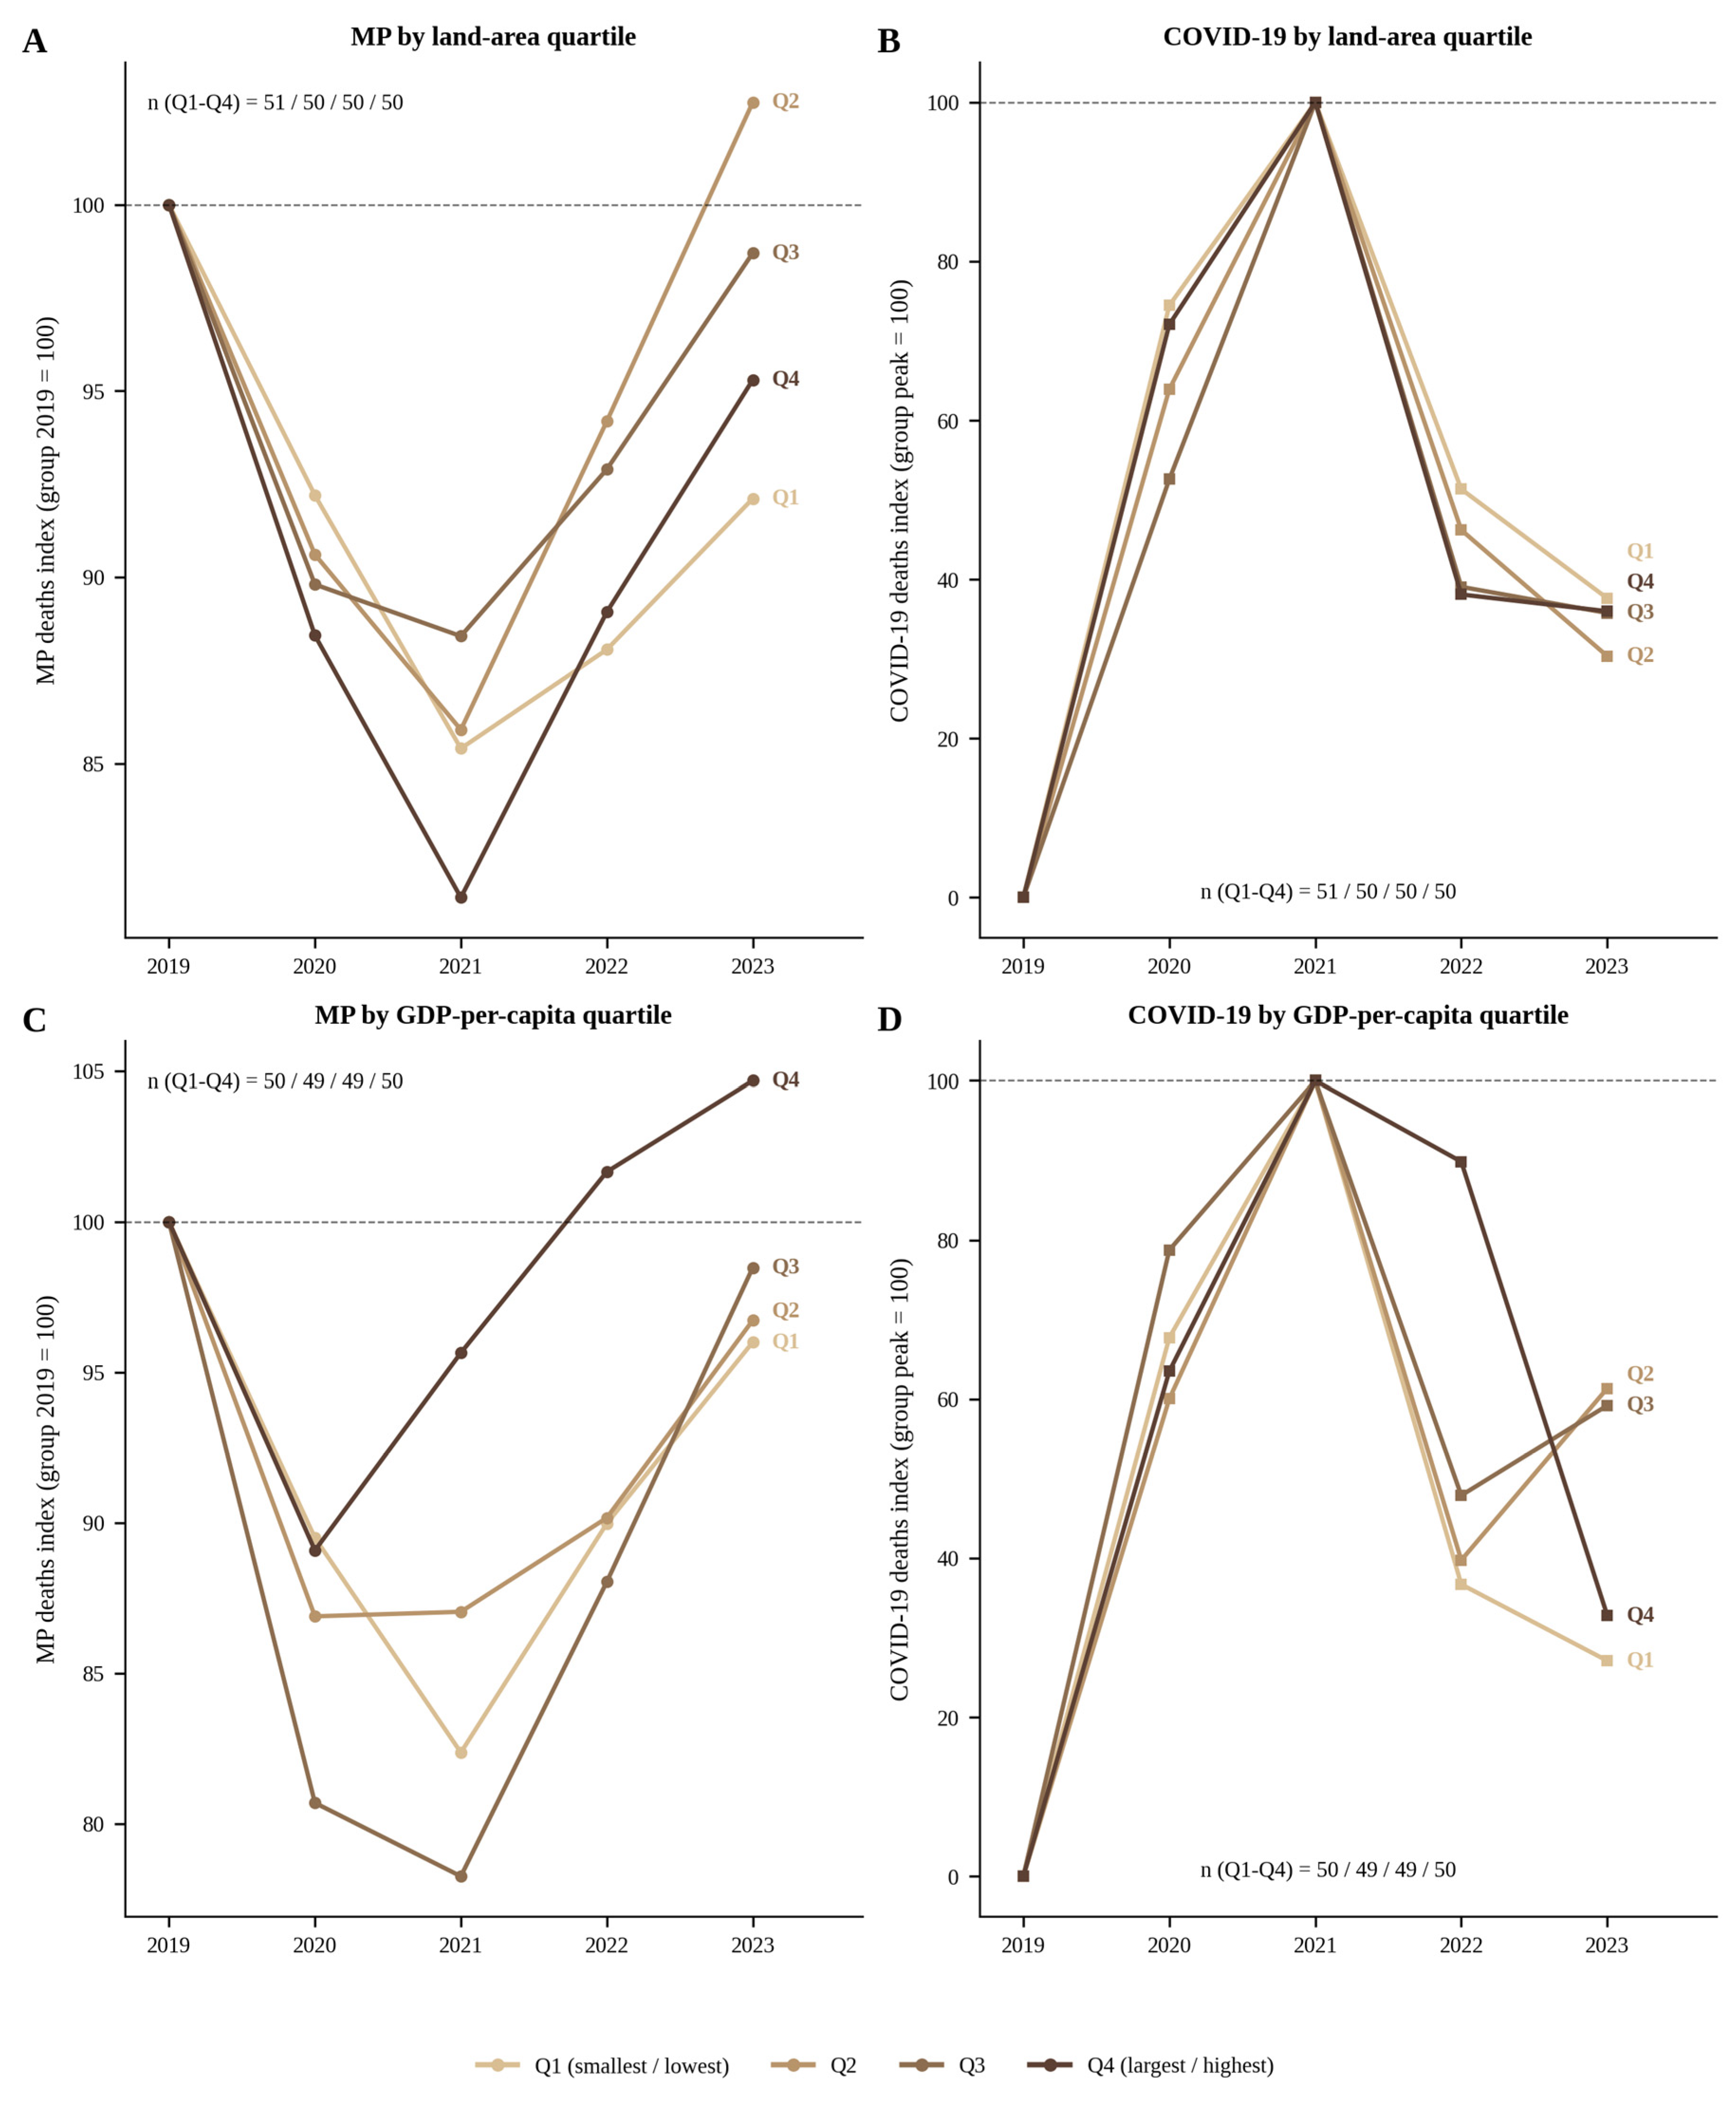
Figure 3.
COVID-19 peak intensity versus Mycoplasma response across 204 countries. Scatter of peak COVID-19 0–19-year mortality rate (per 100,000; log scale) against (A) Mycoplasma trough depth (% versus 2019), (B) rebound amplitude (% versus 2019), and (C) the COVID-19-peak-to-Mycoplasma-rebound-peak interval (years; points jittered vertically for legibility), with Spearman r and p annotated per panel; points are coloured by super-region. Source data: Supplementary fig_data (fig_f3_scatter_data.csv; panel C statistics in fig_f3_panelC_spearman.csv).
Figure 3.
COVID-19 peak intensity versus Mycoplasma response across 204 countries. Scatter of peak COVID-19 0–19-year mortality rate (per 100,000; log scale) against (A) Mycoplasma trough depth (% versus 2019), (B) rebound amplitude (% versus 2019), and (C) the COVID-19-peak-to-Mycoplasma-rebound-peak interval (years; points jittered vertically for legibility), with Spearman r and p annotated per panel; points are coloured by super-region. Source data: Supplementary fig_data (fig_f3_scatter_data.csv; panel C statistics in fig_f3_panelC_spearman.csv).
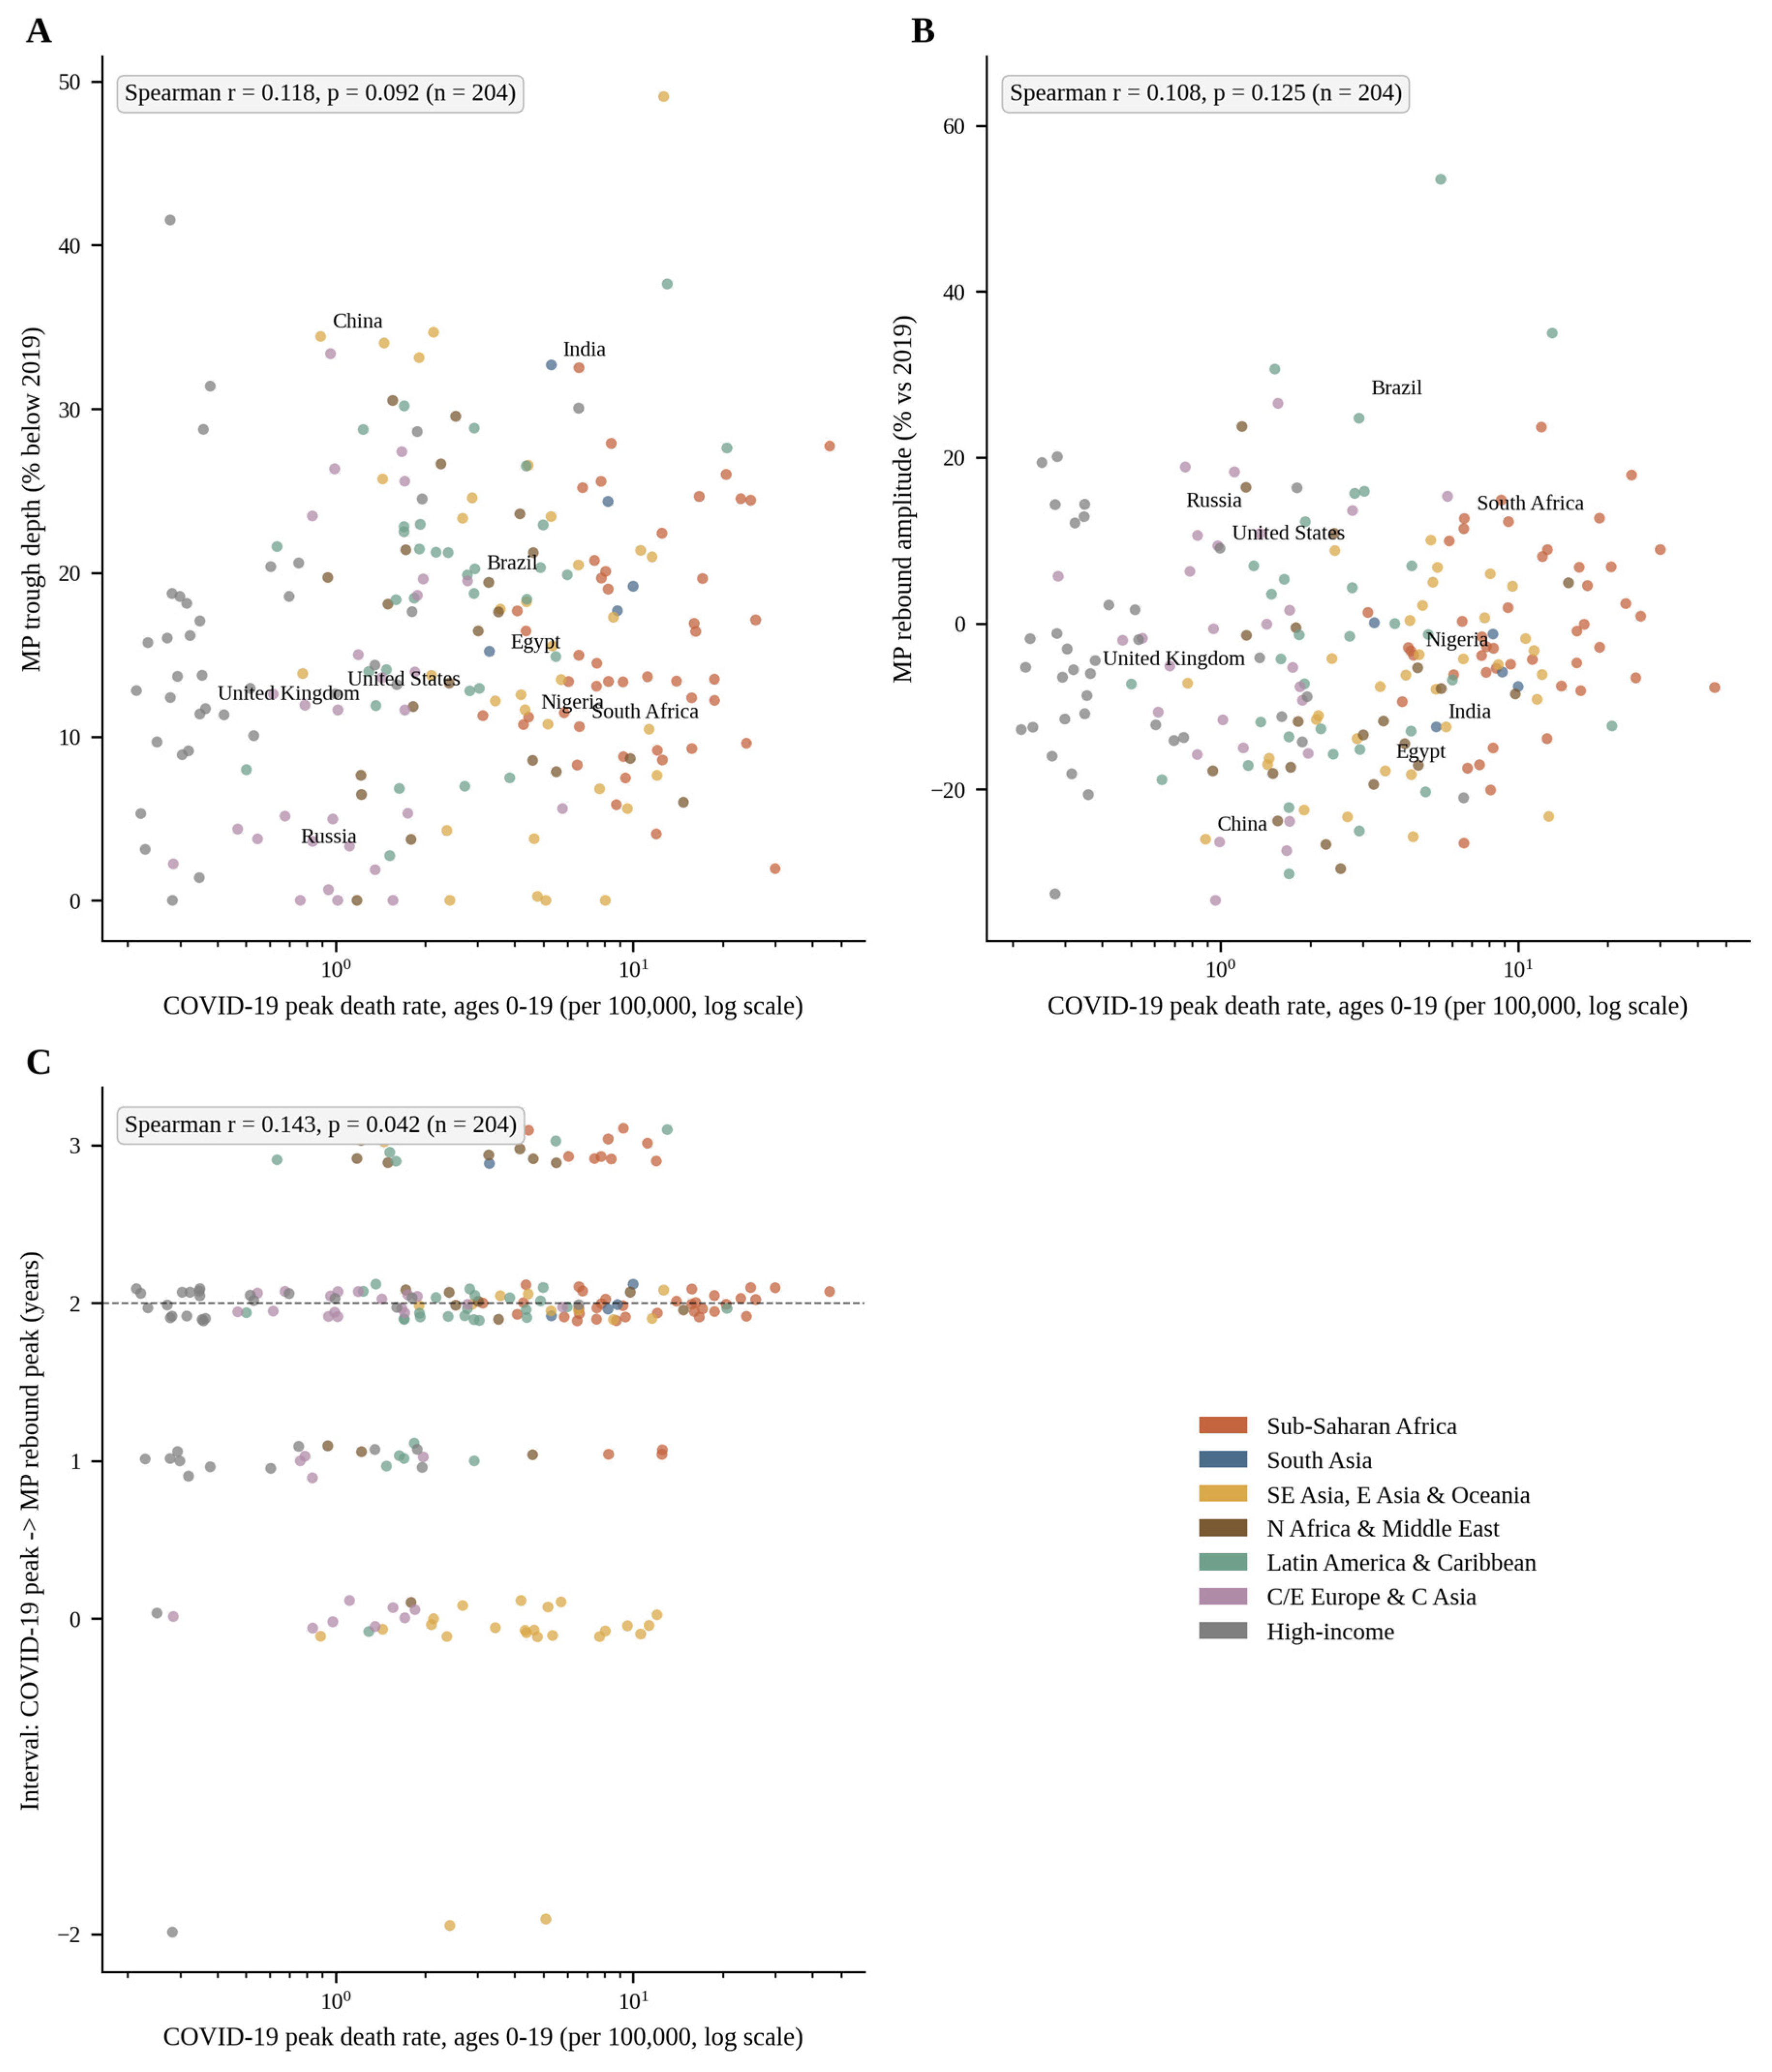

Table 1.
Peak and trough indicators by GBD super-region, ages 0–19 years, 2019–2023. MP = Mycoplasma pneumoniae-attributed LRI deaths; trough = minimum over 2020–2023; trough depth = percent below 2019 baseline; rebound peak = maximum over trough year to 2023; interval = rebound peak year minus COVID-19 peak year. Globally, MP deaths fell from 27,388 (2019) to 22,711 (2021; −17.1%) and recovered to 26,366 (2023; −3.7% vs 2019); COVID-19 deaths were 99,060 (2020), 147,850 (2021 peak), 57,218 (2022) and 52,850 (2023). Rebound peaks at 2023 are series endpoints still rising (right-censoring).
Table 1.
Peak and trough indicators by GBD super-region, ages 0–19 years, 2019–2023. MP = Mycoplasma pneumoniae-attributed LRI deaths; trough = minimum over 2020–2023; trough depth = percent below 2019 baseline; rebound peak = maximum over trough year to 2023; interval = rebound peak year minus COVID-19 peak year. Globally, MP deaths fell from 27,388 (2019) to 22,711 (2021; −17.1%) and recovered to 26,366 (2023; −3.7% vs 2019); COVID-19 deaths were 99,060 (2020), 147,850 (2021 peak), 57,218 (2022) and 52,850 (2023). Rebound peaks at 2023 are series endpoints still rising (right-censoring).
| Super-region | MP deaths 2019 (n) | Trough year | Trough value (n) | Trough depth (%) | Rebound peak year | Rebound peak (n) | Rebound vs 2019 (%) | COVID-19 peak year | COVID-19 peak deaths (n) | Peak rate /100,000 | Interval (y) |
|---|---|---|---|---|---|---|---|---|---|---|---|
| Sub-Saharan Africa | 15,245 | 2021 | 13,243 | 13.1 | 2023 | 15,123 | -0.8 | 2021 | 64,981 | 10.66 | +2 |
| South Asia | 7,123 | 2021 | 5,106 | 28.3 | 2023 | 6,413 | -10.0 | 2021 | 43,747 | 6.25 | +2 |
| Southeast Asia, East Asia, and Oceania | 1,959 | 2021 | 1,534 | 21.7 | 2023 | 1,776 | -9.3 | 2023 | 20,687 | 3.58 | +0 |
| North Africa and Middle East | 1,407 | 2022 | 1,266 | 10.0 | 2023 | 1,287 | -8.6 | 2021 | 9,140 | 3.85 | +2 |
| Latin America and Caribbean | 855 | 2021 | 703 | 17.9 | 2023 | 942 | +10.1 | 2021 | 7,070 | 3.81 | +2 |
| Central Europe, Eastern Europe, and Central Asia | 710 | 2020 | 668 | 5.9 | 2021 | 778 | +9.6 | 2021 | 1,428 | 1.38 | +0 |
| High-income | 89 | 2020 | 75 | 16.0 | 2023 | 86 | -3.5 | 2021 | 1,619 | 0.67 | +2 |
Note. Trough depth is the percentage decline from 2019 to the trough year; rebound peak is the post-trough maximum through 2023; interval is COVID-19 peak year to MP rebound-peak year in calendar years. MP values are LRI deaths attributed to Mycoplasma pneumoniae (GBD 2023 rei 423); COVID-19 values are GBD 2023 cause 1048 deaths; both ages 0–19 years. Because 2023 is the final data year, rebound peaks falling in 2023 are right-censored.
Table 2.
Peak and trough indicators in nine key countries (the most populous 0–19-year country of each super-region plus China, the USA, the UK, India, Brazil and South Africa), ages 0–19 years, 2019–2023. Definitions as in Table 1.
Table 2.
Peak and trough indicators in nine key countries (the most populous 0–19-year country of each super-region plus China, the USA, the UK, India, Brazil and South Africa), ages 0–19 years, 2019–2023. Definitions as in Table 1.
| Country | Super-region | MP deaths 2019 (n) | Trough year | Trough depth (%) | Rebound peak year | Rebound vs 2019 (%) | COVID-19 peak year | Peak rate /100,000 | Interval (y) |
|---|---|---|---|---|---|---|---|---|---|
| India | South Asia | 4,782 | 2021 | 32.7 | 2023 | -12.5 | 2021 | 5.31 | +2 |
| Nigeria | Sub-Saharan Africa | 4,647 | 2021 | 11.2 | 2023 | -3.8 | 2020 | 4.45 | +3 |
| China | Southeast Asia, East Asia, and Oceania | 345 | 2021 | 34.4 | 2023 | -26.0 | 2023 | 0.89 | +0 |
| Egypt | North Africa and Middle East | 316 | 2021 | 17.6 | 2023 | -11.8 | 2021 | 3.53 | +2 |
| South Africa | Sub-Saharan Africa | 303 | 2021 | 10.6 | 2023 | +12.6 | 2021 | 6.59 | +2 |
| Brazil | Latin America and Caribbean | 152 | 2020 | 18.7 | 2023 | +24.7 | 2021 | 2.92 | +2 |
| Russian Federation | Central Europe, Eastern Europe, and Central Asia | 44 | 2020 | 1.9 | 2021 | +10.8 | 2021 | 1.36 | +0 |
| United States of America | High-income | 30 | 2020 | 12.6 | 2023 | +9.0 | 2021 | 1.00 | +2 |
| United Kingdom | High-income | 5 | 2020 | 11.7 | 2023 | -6.1 | 2021 | 0.37 | +2 |
Note. Countries are the most populous 0–19-year country per super-region plus China, the USA, the UK, India, Brazil, South Africa, Egypt, Nigeria and Russia. Definitions as in Table 1. Peak rate is the COVID-19 death rate per 100,000 in the peak year.
Table 3.
Spearman rank correlations between COVID-19 peak intensity (peak 0–19-year mortality rate per 100,000) and the Mycoplasma response, two-sided. Small-count sensitivity subset (92 countries with ≥10 MP-attributed deaths in 2019): r = −0.054 (p = 0.61) for trough depth and r = 0.164 (p = 0.117) for rebound amplitude. No correlation was statistically significant.
Table 3.
Spearman rank correlations between COVID-19 peak intensity (peak 0–19-year mortality rate per 100,000) and the Mycoplasma response, two-sided. Small-count sensitivity subset (92 countries with ≥10 MP-attributed deaths in 2019): r = −0.054 (p = 0.61) for trough depth and r = 0.164 (p = 0.117) for rebound amplitude. No correlation was statistically significant.
| Dataset | n | Outcome (y) | Spearman r | p value |
|---|---|---|---|---|
| Super-regions (n=7) | 7 | MP trough depth (%) | 0.179 | 0.7017 |
| Super-regions (n=7) | 7 | MP rebound amplitude (% vs 2019) | -0.214 | 0.6445 |
| Countries (n=204) | 204 | MP trough depth (%) | 0.118 | 0.0920 |
| Countries (n=204) | 204 | MP rebound amplitude (% vs 2019) | 0.108 | 0.1254 |
Note. Spearman rank correlations; r with two-sided p value. COVID-19 peak intensity is the peak-year 0–19-year death rate per 100,000. MP trough depth and rebound magnitude are percentages relative to 2019. Regional rows use the seven GBD super-regions; country rows use 204 countries.
Table 4.
Sensitivity of the peak-to-peak interval to the COVID-19 peak definition: country-level interval distributions (n = 204) under three calibres. At super-region level, the number of regions at +2 years is 5/7 (primary 0–19-year deaths), 6/7 (all-ages deaths) and 0/7 (0–19-year incidence). Spearman correlations under alternative calibres remained non-significant except all-ages peak deaths versus trough depth (r = 0.181, p = 0.0096).
Table 4.
Sensitivity of the peak-to-peak interval to the COVID-19 peak definition: country-level interval distributions (n = 204) under three calibres. At super-region level, the number of regions at +2 years is 5/7 (primary 0–19-year deaths), 6/7 (all-ages deaths) and 0/7 (0–19-year incidence). Spearman correlations under alternative calibres remained non-significant except all-ages peak deaths versus trough depth (r = 0.181, p = 0.0096).
| COVID-19 peak definition | −3 y | −2 y | −1 y | 0 y | +1 y | +2 y | +3 y | Modal interval | Countries at mode (%) |
|---|---|---|---|---|---|---|---|---|---|
| COVID-19 deaths, ages 0–19 (primary) | 0 | 3 | 0 | 32 | 26 | 115 | 28 | +2 y | 115/204 (56%) |
| COVID-19 deaths, all ages | 0 | 1 | 0 | 12 | 31 | 130 | 30 | +2 y | 130/204 (64%) |
| COVID-19 incidence, ages 0–19 | 1 | 3 | 10 | 44 | 130 | 15 | 1 | +1 y | 130/204 (64%) |
Note. Main calibre: 0–19-year deaths for both pathogens. All-ages calibre substitutes all-ages COVID-19 deaths (MP side unchanged: only 0–19-year bands were extracted). Incidence calibre substitutes 0–19-year COVID-19 incident cases. Modal interval is the country-level mode (n of 204); super-regions n = 7. The DALY-calibre replication of the MP side is reported in Section 3.10 and Supplementary Table S5.
Disclaimer/Publisher’s Note: The statements, opinions and data contained in all publications are solely those of the individual author(s) and contributor(s) and not of MDPI and/or the editor(s). MDPI and/or the editor(s) disclaim responsibility for any injury to people or property resulting from any ideas, methods, instructions or products referred to in the content. |
© 2026 by the authors. Licensee MDPI, Basel, Switzerland. This article is an open access article distributed under the terms and conditions of the Creative Commons Attribution (CC BY) license (http://creativecommons.org/licenses/by/4.0/).
Copyright: This open access article is published under a Creative Commons CC BY 4.0 license, which permit the free download, distribution, and reuse, provided that the author and preprint are cited in any reuse.