

Submitted:
27 October 2026
Posted:
28 October 2026
You are already at the latest version
Abstract
Objective To describe, for every country, pathogen-attributable fractions (PAFs) of childhood (0–19 years) lower respiratory infection (LRI) deaths in 2023, and to classify countries by etiologic composition for vaccine, treatment and hospital policy.Methods We analysed the Global Burden of Disease Study (GBD) 2023 etiology module: PAFs for 26 pathogens, 204 countries and four childhood age groups. Country PAFs for ages 0–19 years were computed as deaths-weighted averages. We derived a five-type typology by k-means clustering, quantified a hospital-associated pathogen group, and cross-tabulated profiles against pneumococcal conjugate vaccine (PCV) policy, death burden and age.Findings Streptococcus pneumoniae was the largest single contributor in all 204 countries (PAF 13.1%–51.5%; median 26.4%); nineteen countries exceeded 40%. Five composition types traced a gradient from pneumococcus hyper-dominance to diversified high-income profiles; Klebsiella pneumoniae ranked second in 125 countries and Staphylococcus aureus in 75. The hospital-associated group accounted for 19.1%–33.8% of deaths in every country (mean 27.6%), without high-income exemption. Intersecting PAF above 40% with the 20 highest-burden countries isolated Indonesia, Chad and, borderline, Somalia as priority cells (threshold-sensitive; Text S8); India, Nigeria and the Democratic Republic of the Congo formed the volume core. All 19 high-PAF countries completed nationwide PCV introduction only from 2021, or lacked a universal programme by end-2023.Conclusion One pathogen leads childhood LRI mortality everywhere, but with a four-fold gradient; country PAF profiles are a direct, reproducible input for prioritizing PCV completion, hospital-platform interventions and age-stratified strategies.
Keywords:
lower respiratory infections
; pathogen-attributable deaths
; child mortality
; Global Burden of Disease
; country profiles
; lower respiratory infection
; pneumonia
; population attributable fraction
; Streptococcus pneumoniae
; pneumococcal conjugate vaccine
; healthcare-associated infection
Introduction
Lower respiratory infections (LRIs) remain the leading infectious cause of death in children. The Global Burden of Disease Study (GBD) estimated approximately 711,000 LRI deaths among children and adolescents aged 0–19 years in 2023, concentrated in South Asia and sub-Saharan Africa but occurring in every country.1 Designing control programmes against this burden requires knowing not only how many children die, but of what. The fraction of deaths attributable to each pathogen, the population attributable fraction (PAF), is the basic input to distinct policy problems: which vaccines to prioritize, which pathogens empiric antibiotic guidelines must cover, and which organisms hospital infection-prevention programmes and surveillance systems should expect.
National pathogen-attributable profiles have not been assembled into a policy-ready country atlas. Global and regional estimates exist for selected pathogens: pneumococcus and Haemophilus influenzae type b through vaccine-probe modelling,2,3 respiratory syncytial virus (RSV) and influenza through systematic reviews,4 and site-based studies such as PERCH. The GBD 2021 cycle published national attributable estimates for 18 aetiologies across 204 countries and territories,5 and the GBD 2023 etiology module extends this to 26 pathogens with a 2023 cross-section.6 What remains undone is the country-level synthesis: re-aggregating national PAFs to the full childhood span on a deaths-weighted basis, reducing each country's composition to an interpretable typology, and cross-tabulating profiles against vaccine policy, hospital-platform relevance and age structure. Country level matters because regional averages average out what programmes act on: identical mortality rates can conceal a pneumococcus-dominated mixture in one country and a hospital-associated gram-negative mixture, against which no vaccine exists, in another. This study provides that synthesis.
The timing matters. Pneumococcal conjugate vaccine (PCV) introduction is in its endgame: 155 of 194 WHO Member States had introduced by early 2023, and most remaining last-mile countries introduced or moved toward introduction in 2024–2025,7 while post-COVID-19 coverage recovery remains incomplete in many high-burden settings.8 New RSV immunization products have reached licensure and early deployment,9,10 and antimicrobial resistance has pushed hospital-associated gram-negative pathogens up the global priority agenda.11 These debates are currently conducted with regional or global averages; a country-level etiologic baseline for 2023, set as these programmes deploy, provides the reference distribution against which their impact will be measurable.
This study assembles the complete country-level PAF atlas of childhood LRI deaths for 2023, addressing three questions: the leading-pathogen landscape when every country is ranked by the same metric; whether the 26-pathogen compositions fall into a small number of reproducible types aligned with development; and how the profiles connect to intervention design, from PCV policy to hospital platforms and age-stratified immunization. The analysis is descriptive and cross-sectional.
Methods
Data sources
The primary input was the GBD 2023 etiology module: pathogen-specific PAFs for LRI deaths (measure: deaths; metric: percent) for 26 pathogens, 204 countries and territories, four childhood age groups (younger than 5 years, 5–9 years, 10–14 years, 15–19 years) and the year 2023.6 Each country-by-age PAF vector sums to 1.0. The pathogens span bacteria, viruses (influenza and RSV) and fungi, plus residual aggregate categories; the second input was the corresponding etiology-attributed deaths panel from the same release. GBD etiologic attribution uses a network analysis model reconciling cause-of-death, vital registration, hospital discharge, laboratory and literature data.5 Download integrity was verified by re-deriving etiology-attributed deaths from PAFs and country-by-age death envelopes (Text S7).
Country-level aggregation
Country PAFs for the full childhood span (0–19 years) were computed as deaths-weighted averages of the four age-specific PAF vectors, with weights equal to total LRI deaths in each country-by-age cell. Weighted country vectors again sum to exactly 1.0. Because LRI mortality is concentrated in children younger than 5 years, the deaths-weighted 0–19 profile approximates, but is not identical to, the under-5 profile.
Leading pathogen and runner-up tabulation
For each country we ranked the 26 weighted PAFs and recorded the leading and second-ranked pathogens, repeating the tabulation within age groups.
Composition typology
We applied k-means clustering to the standardized 26-pathogen PAF vectors (each pathogen centred and scaled) to reduce 204 countries to an interpretable set of national profiles. The number of clusters, k = 5, was selected by silhouette score over candidates k = 4–6; the algorithm was run with 50 random initializations (n_init = 50) and a fixed seed (42). Clusters were labelled descriptively from their centroid compositions; labels are summaries, not taxonomic ranks, and carry no assessment of any country's health system. Robustness of the typology was verified by bootstrap resampling (500 replicates, fixed seed sequence): all five clusters were stable (mean Jaccard 0.88–0.93; Text S8, Table S6), and ±5 percentage-point sensitivity of the 40% priority-cell threshold is reported in Text S8 (Table S7).
Hospital-associated group
We defined a hospital-associated group as the sum of PAFs for Klebsiella pneumoniae, Pseudomonas aeruginosa, Acinetobacter baumannii, Staphylococcus aureus and Enterobacter spp., organisms prominent in neonatal sepsis, healthcare-associated pneumonia and antimicrobial-resistance agendas.11 The grouping is etiologic and pragmatic, not a strict nosocomial case definition: it includes community-acquired infections with these organisms, including much of childhood S. aureus pneumonia and neonatal Klebsiella infection originating in the community or birth canal.
Priority cells
To isolate the sharpest vaccine-targetable opportunities, we intersected pneumococcal PAF above 40% (etiologic intensity) with membership in the 20 countries with the largest absolute childhood LRI death counts in 2023 (volume).
Age contrast
Global deaths-weighted PAFs were computed separately for children younger than 5 years and adolescents aged 15–19 years, and the difference (15–19 minus younger than 5) was tabulated per pathogen in percentage points (pp).
Vaccine policy layer
PCV introduction status and third-dose (PCV3) coverage were taken from the WHO immunization data portal and the WHO/UNICEF Estimates of National Immunization Coverage (WUENIC, 2024 revision),8 with introduction years verified against WHO, Gavi, UNICEF and International Vaccine Access Center sources7–12 (Text S2). Vaccine-policy facts are sourced independently of the GBD panel and enter no PAF computation. Because GBD etiology estimation adjusts cause-fraction models for vaccine coverage where this informs the underlying data,5 pneumococcal PAF and PCV introduction status are not fully independent; we read their correspondence as corroboration of a shared signal, not independent evidence of vaccine effects.
Scope and reuse terms
PAFs are modelled point estimates; uncertainty bounds were not propagated into the typology or priority cells, so threshold-based lists are approximate (see Limitations). The analysis reuses publicly available GBD 2023 estimates under the Institute for Health Metrics and Evaluation non-commercial terms and, as a secondary analysis of aggregate modelled estimates, required no ethics review. Maps use the Natural Earth 110 m basemap, which renders 169 of 204 countries; unmapped small island states and territories remain in all tabular outputs. Analyses used Python 3 with pandas and scikit-learn.
Results
A single leading pathogen in all 204 countries
the leading contributor in all 204 countries

Table 1.
Nineteen countries with pneumococcal PAF above 40%: PAF, PCV introduction status and WUENIC PCV3 coverage.
Table 1.
Nineteen countries with pneumococcal PAF above 40%: PAF, PCV introduction status and WUENIC PCV3 coverage.
| Country | Pneumococcal PAF | PCV status (national programme) | WUENIC PCV3 coverage 2023 |
| Tokelau | 51.5% | Introduced 2022 under Pacific regional project8,13 | no estimate |
| South Sudan | 48.9% | Introduced 2025 (Gavi-supported)14,12 | 0% |
| Timor-Leste | 47.5% | Introduced January 20237 | 56% |
| Samoa | 47.1% | Introduced 20217 | 93% |
| Thailand | 45.8% | Not introduced (private-market availability)7 | 0% |
| Chad | 44.4% | Introduced October 2024 (Gavi-supported)14 | 0% |
| Guinea | 44.4% | Not introduced as of 202512 | 0% |
| Tuvalu | 44.2% | Introduced 20218,13 | 98% |
| Vanuatu | 44.1% | Introduced 20217 | 63% |
| Equatorial Guinea | 42.9% | Not introduced7 | 0% |
| Belarus | 42.8% | Partial (risk groups); no universal programme7 | 0% |
| Nauru | 42.4% | Introduced 20217 | 84% |
| China | 41.8% | Not in national immunization programme (subnational/private use)7 | 0% |
| Indonesia | 41.7% | Phased introduction from 2017; nationwide September 202215,16 | 31% |
| Comoros | 41.7% | Not introduced7 | 0% |
| Democratic People's Republic of Korea | 41.1% | Not introduced7 | 0% |
| Tajikistan | 40.6% | Introduced November 20227 | 31% |
| Suriname | 40.5% | Not introduced7 | 0% |
| Somalia | 40.1% | Introduced 2025 (Gavi-supported)12 | 0% |
Introduction status and years from the WHO immunization data portal and cited verification sources; PCV3 coverage from WUENIC (2024 revision).8 Vaccine-policy data are independent of the GBD panel. Throughout this article, universal or nationwide introduction denotes completion of rollout to the whole country; countries with phased or subnational rollouts that began earlier (for example Indonesia, from 2017) are classified by the year nationwide completion was achieved.
Five composition types describe the world
Clustering partitioned the 204 countries into five reproducible composition types (Figure 3, Table 2). Twenty-four countries form a pneumococcus hyper-dominant type (centroid pneumococcal PAF about 41.5%), including Indonesia, Papua New Guinea, Timor-Leste, much of the Pacific and parts of sub-Saharan Africa. A pneumococcus-dominant type (n = 42; centroid about 35.5%) covers China, the Democratic People's Republic of Korea, Thailand, Viet Nam and Malaysia. The largest type (n = 55) is a Klebsiella-elevated composition, with pneumococcus at about 26.8% but Klebsiella elevated to about 12.5%, spanning most of sub-Saharan Africa and parts of South-East Asia and Latin America. An intermediate mixed type (n = 52; pneumococcus about 20.8%) covers Central Asia, North Africa and the Middle East and much of Latin America. A diversified high-income type (n = 31) pairs the lowest pneumococcal share (about 18.5%) with the highest S. aureus (about 12.8%) and Legionella (about 6.6%) shares. Read as an ordered sequence, the five types trace a development gradient, with a distinct Klebsiella-elevated belt across sub-Saharan Africa.
Figure 1.
Leading pathogen of childhood (0–19 years) LRI deaths by country, 2023. (a) Categorical map of the leading pathogen: Streptococcus pneumoniae leads in all 204 countries. (b) Continuous map of the country-level pneumococcal PAF (13.1%–51.5%). (c) Country counts by leading and runner-up pathogen: Klebsiella pneumoniae is runner-up in 125 countries, Staphylococcus aureus in 75 and influenza in four. Natural Earth 110 m basemap; 169 of 204 countries rendered.
Figure 1.
Leading pathogen of childhood (0–19 years) LRI deaths by country, 2023. (a) Categorical map of the leading pathogen: Streptococcus pneumoniae leads in all 204 countries. (b) Continuous map of the country-level pneumococcal PAF (13.1%–51.5%). (c) Country counts by leading and runner-up pathogen: Klebsiella pneumoniae is runner-up in 125 countries, Staphylococcus aureus in 75 and influenza in four. Natural Earth 110 m basemap; 169 of 204 countries rendered.
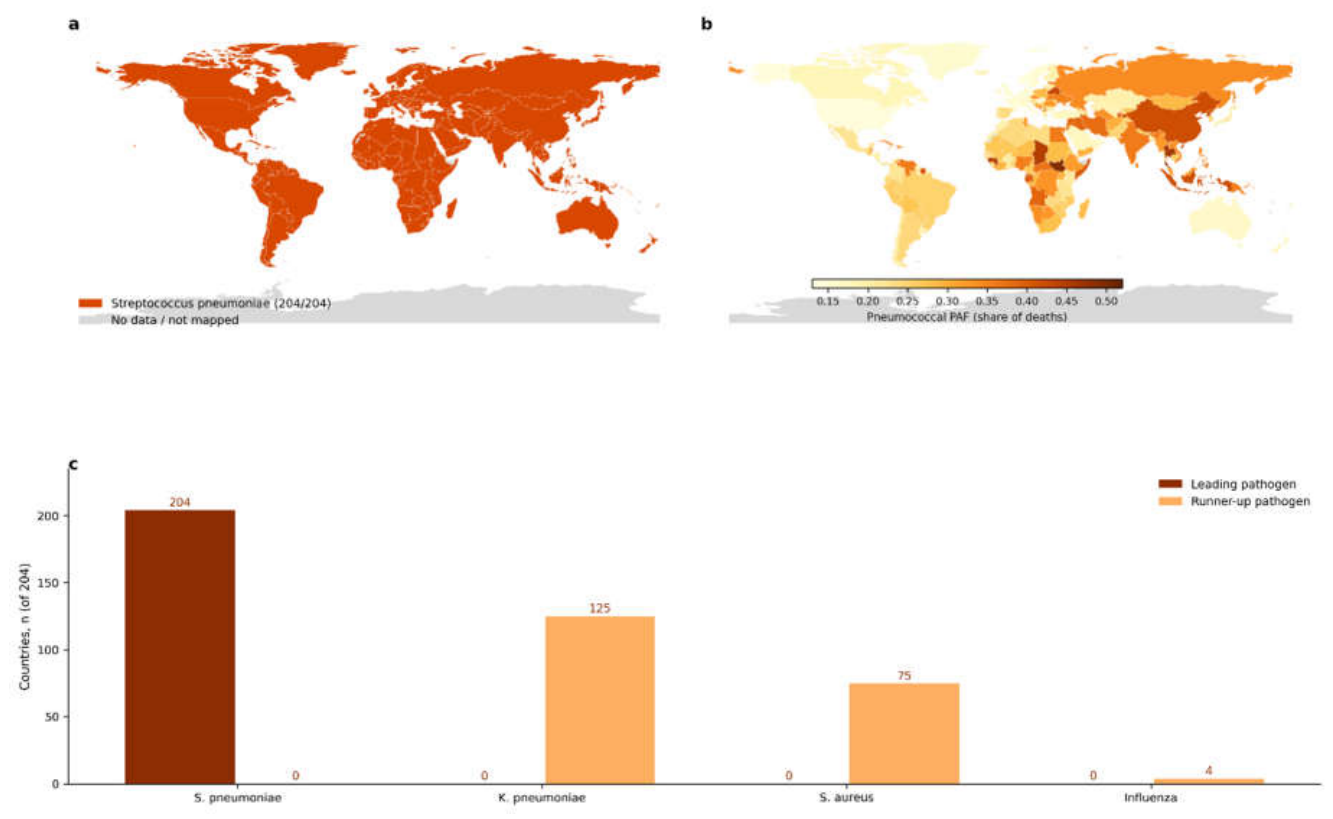
Figure 2.
Country-level deaths-weighted PAFs for six focal pathogens across 204 countries, 2023 (panels a–f).Streptococcus pneumoniae, respiratory syncytial virus, influenza, Klebsiella pneumoniae, Staphylococcus aureus and Mycoplasma spp. All six maps share a common colour scale (0–0.52 share of deaths).
Figure 2.
Country-level deaths-weighted PAFs for six focal pathogens across 204 countries, 2023 (panels a–f).Streptococcus pneumoniae, respiratory syncytial virus, influenza, Klebsiella pneumoniae, Staphylococcus aureus and Mycoplasma spp. All six maps share a common colour scale (0–0.52 share of deaths).
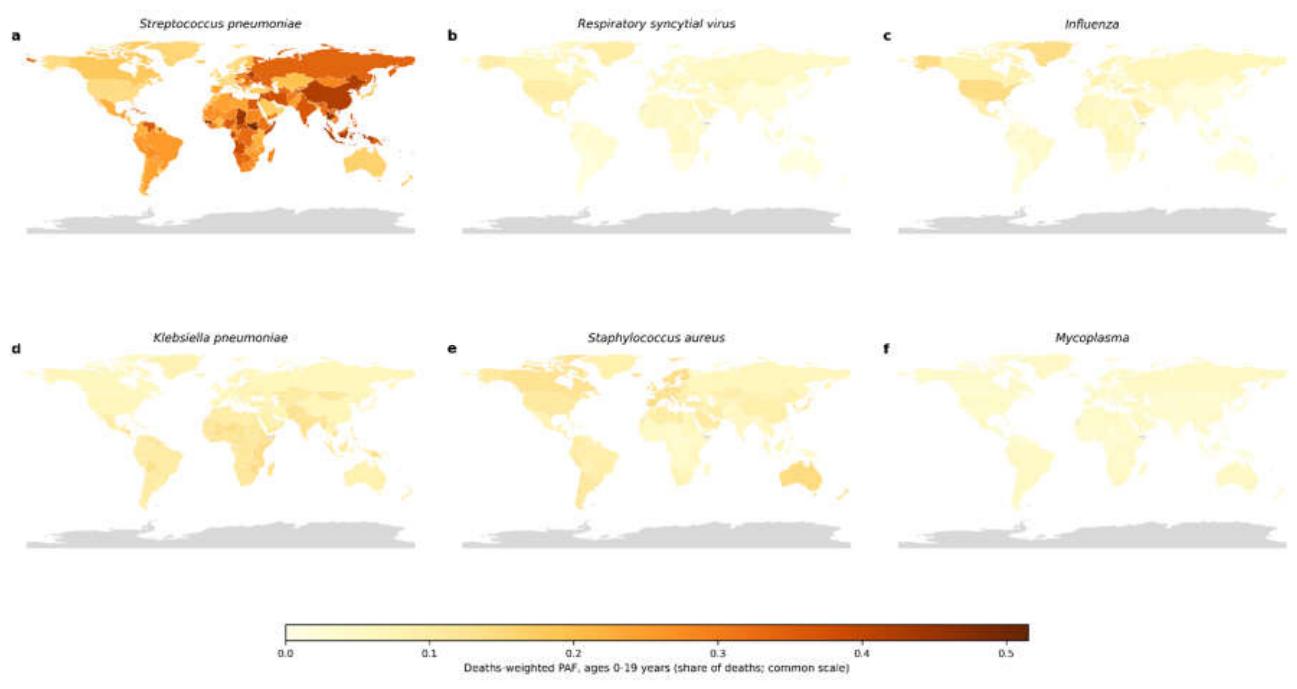
Figure 3.
Five-type composition typology of childhood LRI deaths, 204 countries, 2023: k-means clustering (k = 5) of standardized 26-pathogen PAF vectors. (a) Country map of the five types: pneumococcus hyper-dominant (n = 24), pneumococcus-dominant (n = 42), Klebsiella-elevated composition (n = 55), intermediate mixed (n = 52) and diversified high-income (n = 31). (b) Type centroid compositions (percentage of deaths), with centroid pneumococcal PAFs of 41.5%, 35.5%, 26.8%, 20.8% and 18.5%, respectively. (c) Cross-tabulation of composition type by GBD super-region (country counts).
Figure 3.
Five-type composition typology of childhood LRI deaths, 204 countries, 2023: k-means clustering (k = 5) of standardized 26-pathogen PAF vectors. (a) Country map of the five types: pneumococcus hyper-dominant (n = 24), pneumococcus-dominant (n = 42), Klebsiella-elevated composition (n = 55), intermediate mixed (n = 52) and diversified high-income (n = 31). (b) Type centroid compositions (percentage of deaths), with centroid pneumococcal PAFs of 41.5%, 35.5%, 26.8%, 20.8% and 18.5%, respectively. (c) Cross-tabulation of composition type by GBD super-region (country counts).
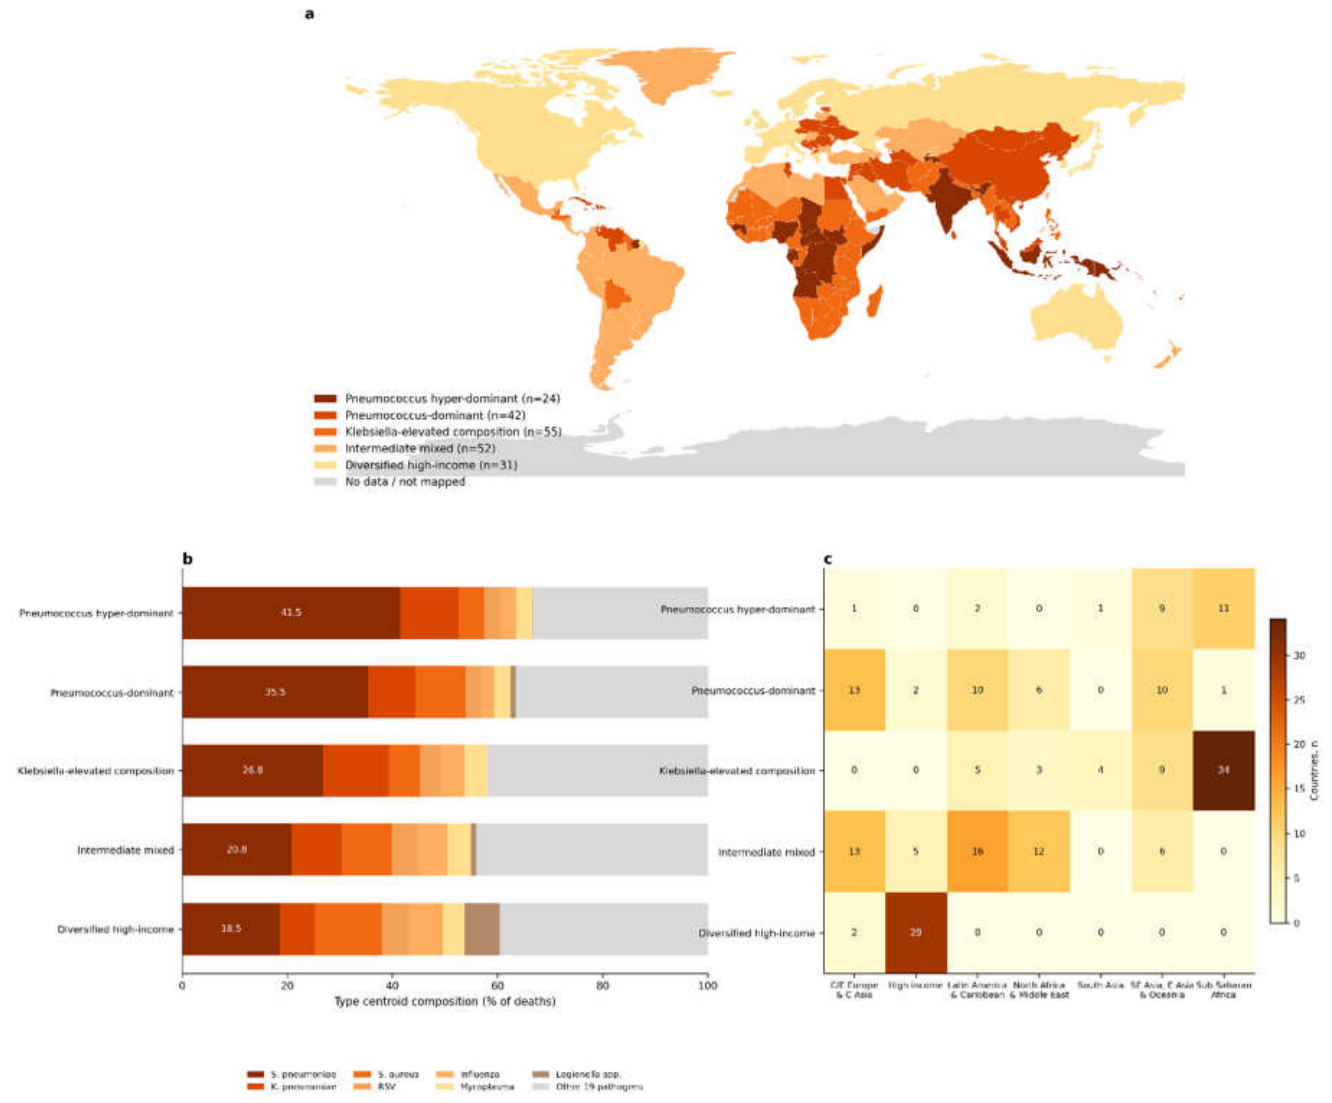
Table 2.
Five-type composition typology of childhood LRI deaths, 204 countries, 2023.
| Type | Countries, n | Pneumococcal PAF, centroid | Second signature | Representative geography |
| Pneumococcus hyper-dominant | 24 | ~41.5% | pneumococcus > 3× runner-up | Indonesia, Papua New Guinea, Timor-Leste, Pacific islands, Tajikistan, Haiti, parts of sub-Saharan Africa |
| Pneumococcus-dominant | 42 | ~35.5% | moderate gram-negatives | China, Democratic People's Republic of Korea, Thailand, Viet Nam, Malaysia, Sri Lanka, Tonga |
| Klebsiella-elevated composition | 55 | ~26.8% | Klebsiella ~12.5% | most of sub-Saharan Africa, parts of South-East Asia, parts of Latin America |
| Intermediate mixed | 52 | ~20.8% | balanced gram-negatives | Central Asia, North Africa and Middle East, Latin America |
| Diversified high-income | 31 | ~18.5% | S. aureus ~12.8%, Legionella ~6.6% | high-income countries, Russian Federation |
The hospital-associated group: a compressed, universal quarter-to-third
The combined PAF of the hospital-associated group (Klebsiella pneumoniae, Pseudomonas aeruginosa, Acinetobacter baumannii, Staphylococcus aureus and Enterobacter spp.) is strikingly compressed across countries: 19.1% to 33.8%, mean 27.6% (Figure 4; Table S4). Roughly one in four to one in three childhood LRI deaths in every country is attributable to this group, and there is no high-income exemption: New Zealand (32.2%) and Chile (32.3%) rank among the five highest countries, alongside Nicaragua (33.8%), Solomon Islands (33.0%) and Bangladesh (32.5%).
PAF-by-burden priority cells
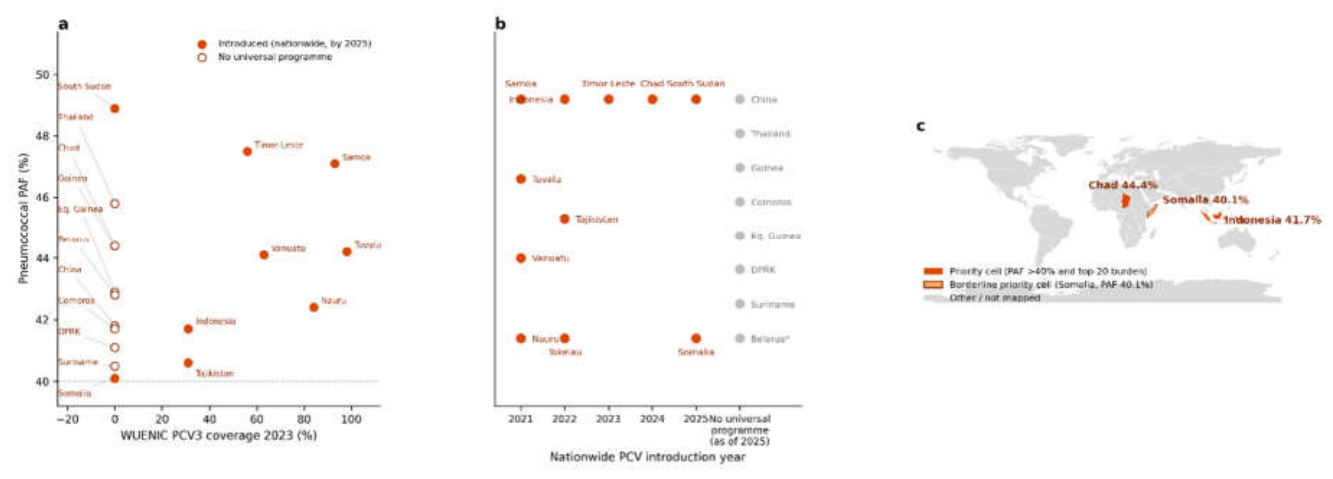
Global childhood LRI deaths in 2023 numbered about 711,000 (711,229 in the pathogen-attribution panel analysed here, versus 711,713 in the cause-specific GBD all-pathogen envelope). Intersecting the two policy dimensions, pneumococcal PAF above 40% and membership in the top-20 burden list, yields three countries: Indonesia (PAF 41.7%), Chad (44.4%) and Somalia (40.1%) (Table 3, Figure 6). Indonesia and Chad are the sharpest cells, combining very high etiologic intensity with very large absolute burden. Somalia is a borderline cell, with a modelled PAF of 40.098% and a rank of 19 in the burden list (8,812 deaths), and its classification should be read as approximate given the unpropagated uncertainty intervals (see Limitations). A second stratum comprises the large-burden countries with mid-range pneumococcal PAF, India (36%), Nigeria (36%) and the Democratic Republic of the Congo (33%): individually less intense but, by volume, the quantitative core of the global pneumococcal opportunity.
Figure 5.
Change in global deaths-weighted PAF between children younger than 5 years and adolescents aged 15–19 years, 2023 (percentage points, pp). (a) Dumbbell plot of the nine largest shifts; the zero point marks the <5 years reference and the endpoint the 15–19 years change. (b) The same shifts ranked: respiratory syncytial virus −3.7 pp to non-tuberculous mycobacteria +3.9 pp. (c) National hotspots of the adolescent Mycoplasma share in the 5.8%–6.1% band (named examples: Uruguay 5.9%, El Salvador 5.8%, South Africa 5.8%).
Figure 5.
Change in global deaths-weighted PAF between children younger than 5 years and adolescents aged 15–19 years, 2023 (percentage points, pp). (a) Dumbbell plot of the nine largest shifts; the zero point marks the <5 years reference and the endpoint the 15–19 years change. (b) The same shifts ranked: respiratory syncytial virus −3.7 pp to non-tuberculous mycobacteria +3.9 pp. (c) National hotspots of the adolescent Mycoplasma share in the 5.8%–6.1% band (named examples: Uruguay 5.9%, El Salvador 5.8%, South Africa 5.8%).
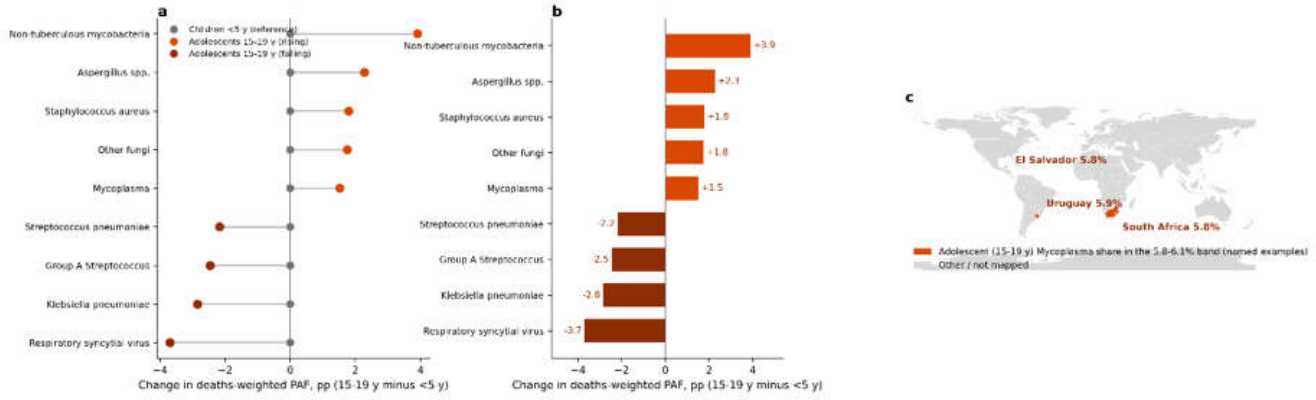
Figure 6.
Pneumococcal PAF cross-tabulated with pneumococcal conjugate vaccine (PCV) policy, 19 countries with pneumococcal PAF above 40%, 2023. (a) Pneumococcal PAF versus WUENIC PCV3 coverage 2023 by nationwide introduction status (Tokelau has no coverage estimate and is not plotted). (b) Nationwide PCV introduction year: 2021 (Samoa, Tuvalu, Vanuatu, Nauru), 2022 (Indonesia, Tajikistan, Tokelau), 2023 (Timor-Leste), 2024 (Chad), 2025 (South Sudan, Somalia); eight further high-PAF countries had no universal programme as of 2025 (Belarus operates a partial risk-group programme). (c) Locator map of the PAF-by-burden priority cells: Indonesia (PAF 41.7%) and Chad (44.4%); Somalia (40.1%) is a borderline cell (burden rank 19). Vaccine-policy data are independent of the GBD panel; see Table 1 and Text S2.
Figure 6.
Pneumococcal PAF cross-tabulated with pneumococcal conjugate vaccine (PCV) policy, 19 countries with pneumococcal PAF above 40%, 2023. (a) Pneumococcal PAF versus WUENIC PCV3 coverage 2023 by nationwide introduction status (Tokelau has no coverage estimate and is not plotted). (b) Nationwide PCV introduction year: 2021 (Samoa, Tuvalu, Vanuatu, Nauru), 2022 (Indonesia, Tajikistan, Tokelau), 2023 (Timor-Leste), 2024 (Chad), 2025 (South Sudan, Somalia); eight further high-PAF countries had no universal programme as of 2025 (Belarus operates a partial risk-group programme). (c) Locator map of the PAF-by-burden priority cells: Indonesia (PAF 41.7%) and Chad (44.4%); Somalia (40.1%) is a borderline cell (burden rank 19). Vaccine-policy data are independent of the GBD panel; see Table 1 and Text S2.
The ten highest-burden countries in 2023 were India (about 143,000 deaths), Nigeria (116,000), Pakistan (36,000), the Democratic Republic of the Congo (30,000), Niger (25,000), Ethiopia (21,000), Bangladesh (15,000), Indonesia (14,000), Chad (14,000) and Madagascar (13,000).
Aging out of RSV, into atypicals
Between children younger than 5 years and adolescents aged 15–19 years, the global deaths-weighted composition shifts systematically (Figure 5; Table S5). The fallers are the classic early-childhood pathogens: RSV declines by 3.7 percentage points (pp), Klebsiella pneumoniae by 2.8 pp, group A streptococcus by 2.5 pp and pneumococcus by 2.2 pp; the risers are pathogens of later childhood and altered host states: non-tuberculous mycobacteria (+3.9 pp), Aspergillus spp. (+2.3 pp), S. aureus (+1.8 pp), other fungi (+1.8 pp) and Mycoplasma (+1.5 pp). The school-age atypical pattern has clear national signatures: the adolescent Mycoplasma share reaches 5.8%–6.1% in several Latin American and southern African countries.
Discussion
This atlas establishes three facts about childhood LRI mortality in 2023: one pathogen, Streptococcus pneumoniae, leads in every country but with a four-fold gradient; a hospital-associated group accounts for a compressed, universal quarter-to-third of deaths; and composition shifts predictably with age. National-level attribution for an earlier, 18-aetiology framework was published with the GBD 2021 cycle;5 the increment here is the 2023, 26-pathogen cross-section delivered as a deaths-weighted 0–19-year country panel with a composition typology and vaccine-policy, hospital-platform and age-structure cross-tabulations, rather than as country estimates alone.
One pathogen first, but a four-fold gradient: PCV completion and the priority cells
The perfect 204-of-204 monopoly of pneumococcus is the single strongest cross-national argument for completing pneumococcal conjugate vaccine introduction and scale-up. WHO has recommended PCV inclusion in all national programmes since 2007, and modelling finds vaccination cost-effective or cost-saving in nearly all low- and middle-income settings.17,18 Yet the 13.1%–51.5% gradient means the return on completion is unevenly distributed, and cross-tabulating the 19 countries above 40% PAF against verified introduction status (Table 1, Figure 6) separates three distinct situations. The recent introducers, Indonesia (nationwide September 2022), Tajikistan, Timor-Leste and the Pacific introducers of 2021–2022, still carry high modelled PAF: the 2023 deaths reflect pre-rollout cohorts, PCV3 coverage was 31% in Indonesia and Tajikistan, and herd effects take years.8–16 For these countries the policy variable is coverage completion, not introduction. The fragile-state introducers of 2024–2025, Chad, Somalia and South Sudan, all sit above 40%,14,12 while Guinea and Comoros, both Gavi-eligible and classed as low-barrier to introduction, had not introduced as of 2025.7,12
The third situation is the non-introducers with functioning programmes and purchasing capacity: China, where PCV remains outside the national immunization programme despite domestic 13-valent production; Thailand, where it is available only privately; plus Belarus, Equatorial Guinea, Suriname and the Democratic People's Republic of Korea.7 We draw no conclusion about any national programme's performance; the atlas simply shows where the vaccine-targetable fraction of deaths is largest. Two cautions apply: the correspondence is partly endogenous because GBD etiology models adjust for vaccine coverage,5 corroboration rather than independent evidence; and the relationship is bidirectional, since the highest-share countries are also those where introduction has been hardest to complete. Below the 40% threshold, the volume core, India, Nigeria and the Democratic Republic of the Congo at 33%–36%, matters more in absolute terms than any priority cell: roughly 290,000 deaths a year, about a third pneumococcal-attributable. All three have introduced PCV,19,20,21 so the binding constraints are coverage and equity of reach.8,12,22
The hidden quarter-to-third: national evidence for a hospital-platform agenda
The most under-recognized finding of the atlas is the hospital-associated group. That these five organisms together account for 19.1%–33.8% of deaths in every country reframes a large slice of child pneumonia mortality as a problem no childhood vaccine will soon reach. The group overlaps the WHO bacterial priority pathogens for antimicrobial resistance,11 and its documented reservoirs, neonatal units, hospital wards and post-viral superinfection, point to platform interventions: infection prevention and control, neonatal care quality, antimicrobial stewardship and hospital surveillance. The platform reading should not be over-extended. In the diversified high-income type, S. aureus alone contributes about half of the group's share, and much childhood S. aureus pneumonia is community-acquired; neonatal Klebsiella infections likewise often originate in the community or birth canal. Hospital-platform interventions therefore address only part of the group's share; the 19.1%–33.8% quantification stands independently of where infections were acquired. The present atlas supplies the national-level evidence base for sequencing such platform interventions.
The typology as a working tool
The typology compresses 26 dimensions into a classification planners can act on. A Klebsiella-elevated country needs empiric cover and diagnostics weighted toward gram-negative bacilli; a diversified high-income country needs pathways that anticipate staphylococcal and legionella disease; a hyper-dominant country can anchor its algorithm on pneumococcus and its vaccine programme. The same logic applies to panel selection, surveillance design and outbreak interpretation.
The age gradient and the new immunization window
The systematic under-5-to-adolescent shift recasts childhood pneumonia as an age-stratified portfolio. The 3.7 pp exit of RSV and the parallel decline of pneumococcus, group A streptococcus and Klebsiella concentrate the benefit of the new RSV immunization tools squarely in the youngest ages, where these products are indicated and were trialled.9,10 Conversely, the entrance of non-tuberculous mycobacteria, Aspergillus, other fungi and Mycoplasma in adolescence argues for school-age and adolescent respiratory surveillance that under-5-oriented systems do not provide. These contrasts are modelled, but the direction of the shift is consistent with clinical experience.
Limitations
Six limitations qualify these findings. First, PAFs are modelled, not measured: the GBD etiology model reconciles sparse and heterogeneous data,5 and country-level PAFs in data-sparse settings borrow strength across geography and time. Second, we report point estimates and do not propagate the published uncertainty intervals through the typology, the 40% threshold or the priority cells; borderline classifications are approximate. (under ±5pp threshold perturbation the priority-cell set ranges from 0 to 8 countries (Table S7).) Third, PAF is a share of deaths, not of cases: pathogens with high case fatality are overweighted relative to their contribution to illness. Fourth, the typology depends on analytic choices; we selected k by silhouette score and stabilized estimation with multiple starts and a fixed seed, but alternative partitionings are defensible. Fifth, 2023 is a post-pandemic rebound-year cross-section: after non-pharmaceutical interventions were lifted, resurgences of RSV, influenza, Mycoplasma and pertussis were widely reported in 2022–2023, so the 2023 pathogen shares may carry transient perturbations, viral PAFs plausibly above steady state and bacterial shares correspondingly diluted. The 2023 values should be read as a deployment-era snapshot rather than a long-run average; the annual updating proposed below can absorb this limitation. Sixth, 35 of 204 countries, all small island states or territories, are absent from the map layer although present in all tables, and the vaccine-policy crosswalk reflects status at the time of writing.8,7
Conclusions
In 2023, Streptococcus pneumoniae was the leading single contributor to childhood LRI deaths in all 204 countries analysed, but its attributable share ranged from 13.1% to 51.5%, and the residual composition sorted countries into five reproducible types. The policy consequence is threefold: complete PCV introduction and coverage where vaccine-targetable share and burden intersect (Indonesia and Chad the sharpest priority cells; India, Nigeria and the Democratic Republic of the Congo the volume core); build hospital-platform responses to a hospital-associated group accounting for a quarter to a third of deaths everywhere, rich and poor alike; and treat childhood pneumonia as an age-stratified portfolio, aiming new RSV immunization tools at the youngest children while extending surveillance to school-age atypical pathogens. Because the analysis rests entirely on publicly available GBD estimates and standard methods, any programme can regenerate its own profile. Maintaining the atlas, with propagated uncertainty and annual updating, would give programmes a standing baseline against which to measure the impact of the vaccines and platforms now being deployed.
Declarations
Supplementary Materials
The following supporting information can be downloaded at the website of this paper posted on Preprints.org.
Funding
This work was supported by the Beijing Science and Technology Nova Program Interdisciplinary Project (20230484439) and the Beijing High-Level Public Health Technical Talents Project (2023-02-33). The funder had no role in study design, data collection, data analysis, data interpretation, or writing of the report.
Data: availability
All inputs are publicly available from the Global Burden of Disease Study 2023 results tools6 and the WHO immunization data portal.8 Derived outputs (country PAF panel, machine-readable key statistics, map layer and figures) and the analysis scripts accompany this article; analysis code is also available from the corresponding author on reasonable request.
Presentation
This work has not been presented previously, in whole or in part, at any conference or meeting, and has not been published in a peer-reviewed journal; it is posted as a preprint (version of 21 October 2026).
Disclosure
All authors have completed the ICMJE uniform disclosure form and declare: no competing interests.
Ethics
Secondary analysis of publicly available, aggregate, modelled estimates; no ethics review required.
Contributors
Chen Shen had full access to all of the data in the study and takes responsibility for the integrity of the data and the accuracy of the data analysis. Concept and design: SC. Acquisition, analysis and interpretation of data: all authors. Drafting of the manuscript: SC. Critical revision for important intellectual content: all authors. All authors approved the final version.
GATHER: statement
This study adheres to the Guidelines for Accurate and Transparent Health Estimates Reporting (GATHER); the completed checklist accompanies the submission as a separate file.
Use: of artificial intelligence
AI tools were used for language polishing and code drafting.
References
- GBD 2023 Causes of Death Collaborators. Global burden of 292 causes of death in 204 countries and territories and 660 subnational locations, 1990–2023: a systematic analysis for the Global Burden of Disease Study 2023. Lancet. 2025;406(10513):1811–1872. [CrossRef]
- O'Brien KL, Wolfson LJ, Watt JP, Henkle E, Deloria-Knoll M, McCall N, et al. Burden of disease caused by Streptococcus pneumoniae in children younger than 5 years: global estimates. Lancet. 2009;374(9693):893–902.
- Wahl B, O'Brien KL, Greenbaum A, Majumder A, Liu L, Chu Y, et al. Burden of Streptococcus pneumoniae and Haemophilus influenzae type b disease in children in the era of conjugate vaccines: global, regional, and national estimates for 2000–15. Lancet Glob Health. 2018;6(7):e744–57.
- Shi T, McAllister DA, O'Brien KL, Simoes EAF, Madhi SA, Gessner BD, et al. Global, regional, and national disease burden estimates of acute lower respiratory infections due to respiratory syncytial virus in young children in 2015: a systematic review and modelling study. Lancet. 2017;390(10098):946–58.
- GBD 2021 Lower Respiratory Infections and Antimicrobial Resistance Collaborators. Global, regional, and national incidence and mortality burden of non-COVID-19 lower respiratory infections and aetiologies, 1990–2021: a systematic analysis from the Global Burden of Disease Study 2021. Lancet Infect Dis. 2024;24(9):974–1002. [CrossRef]
- Institute for Health Metrics and Evaluation. Global Burden of Disease Study 2023 (GBD 2023) results: lower respiratory infection etiology attribution, deaths, percent, 2023. Seattle: IHME; 2025. Available from: https://ghdx.healthdata.org/gbd-results-tool (accessed 2025).
- Banerjee P, Huber J, Denti V, Sauer M, Weeks R, Dhaliwal BK, et al. Closing the pneumococcal conjugate vaccine (PCV) introduction gap: an archetype analysis of last-mile countries. Glob Health Action. 2023;16(1):2281065. [CrossRef]
- World Health Organization; United Nations Children's Fund. WHO/UNICEF estimates of national immunization coverage (WUENIC), 2024 revision; PCV introduction status and PCV3 coverage. Geneva: WHO Immunization Data Portal; 2025. Available from: https://immunizationdata.who.int (accessed 2025).
- Hammitt LL, Dagan R, Yuan Y, Baca Cots M, Bosheva M, Madhi SA, et al. Nirsevimab for prevention of RSV in healthy late-preterm and term infants. N Engl J Med. 2022;386(9):837–46.
- Kampmann B, Madhi SA, Munjal I, Simoes EAF, Pahud BA, Llapur C, et al. Bivalent prefusion F vaccine in pregnancy to prevent RSV illness in infants. N Engl J Med. 2023;388(16):1451–64.
- World Health Organization. WHO bacterial priority pathogens list, 2024: bacterial pathogens of public health importance to guide research, development and strategies to prevent and control antimicrobial resistance. Geneva: WHO; 2024.
- Secure PCV Collaborators; Stop Pneumonia/Every Breath Counts Coalition. Historic milestone: 71% of world's children protected against pneumococcal disease [statement in response to the WHO/UNICEF Estimates of National Immunization Coverage (WUENIC)]. Baltimore: Every Breath Counts (Stop Pneumonia), International Vaccine Access Center, Johns Hopkins Bloomberg School of Public Health; July 2026. Available from: https://stoppneumonia.org/historic-milestone-71-of-worlds-children-protected-against-pneumococcal-disease/.
- Rotary Give Every Child A Future. New vaccines in Pacific island countries: 2022 progress review [newsletter]. Suva: UNICEF Pacific and Rotary International; 2023. Available from: https://everychildafuture.com/wp-content/uploads/2023/05/2023_04-RGECAF-Newsletter-FINAL.pdf.
- Gavi, the Vaccine Alliance. Chad launches pneumococcal vaccine in historic multi-vaccine rollout. Geneva: Gavi; 13 November 2024. Available from: https://www.gavi.org/vaccineswork/chad-launches-pneumococcal-vaccine-historic-multi-vaccine-rollout.
- Athiyaman A, Herliana P, Anartati A, Widyastuti N, Yosephine P, Tandy G, et al. Accelerating pneumococcal conjugate vaccine introductions in Indonesia: key learnings from 2017 to 2022. Infect Dis Poverty. 2023;12(1):107. [CrossRef]
- World Health Organization. The government guarantees PCV immunization for all Indonesian children to protect them from the dangers of pulmonary inflammation (pneumonia) [news release]. Jakarta: WHO Indonesia Country Office; 12 September 2022. Available from: https://www.who.int/indonesia/news/detail/12-09-2022-the-government-guarantees-pcv-immunization-for-all-indonesian-children-to-protect-them-from-the-dangers-of-pulmonary-inflammation-(pneumonia).
- World Health Organization. Pneumococcal conjugate vaccines in infants and children under 5 years of age: WHO position paper, February 2019. Wkly Epidemiol Rec. 2019;94(8):85–104.
- Chen C, Cervero Liceras F, Flasche S, Sidharta S, Yoong J, Sundaram N, et al. Effect and cost-effectiveness of pneumococcal conjugate vaccination: a global modelling analysis. Lancet Glob Health. 2019;7(1):e58–67.
- Gavi, the Vaccine Alliance. India completes national introduction of pneumococcal conjugate vaccine [press release]. Geneva: Gavi; 12 November 2021. Available from: https://www.gavi.org/news/media-room/india-completes-national-introduction-pneumococcal-conjugate-vaccine.
- Adamu AL, Ojal J, Abubakar IA, Odeyemi KA, Bello MM, Okoromah CAN, et al. The impact of introduction of the 10-valent pneumococcal conjugate vaccine on pneumococcal carriage in Nigeria. Nat Commun. 2023;14(1):2666. [CrossRef]
- World Health Organization Regional Office for Africa. DR Congo introduces new vaccine against one of its leading causes of child death [news release]. Kinshasa/Brazzaville: WHO AFRO; 4 April 2011. Available from: https://www.afro.who.int/fr/countries/democratic-republic-congo/news/dr-congo-introduces-new-vaccine-against-one-its-leading.
- World Health Organization; United Nations Children's Fund. Ending preventable child deaths from pneumonia and diarrhoea by 2025: the integrated Global Action Plan for Pneumonia and Diarrhoea (GAPPD). Geneva: WHO; 2013.
Figure 4.
Hospital-associated group share of childhood LRI deaths by country, 2023 (Klebsiella pneumoniae + Pseudomonas aeruginosa + Acinetobacter baumannii + Staphylococcus aureus + Enterobacter spp.; range 19.1%–33.8%). (a) Country map of the combined PAF. (b) Twenty highest-ranked countries. (c) Super-regional means with the five highest countries marked: no high-income exemption (New Zealand 32.2% and Chile 32.3% rank among the five highest).
Figure 4.
Hospital-associated group share of childhood LRI deaths by country, 2023 (Klebsiella pneumoniae + Pseudomonas aeruginosa + Acinetobacter baumannii + Staphylococcus aureus + Enterobacter spp.; range 19.1%–33.8%). (a) Country map of the combined PAF. (b) Twenty highest-ranked countries. (c) Super-regional means with the five highest countries marked: no high-income exemption (New Zealand 32.2% and Chile 32.3% rank among the five highest).
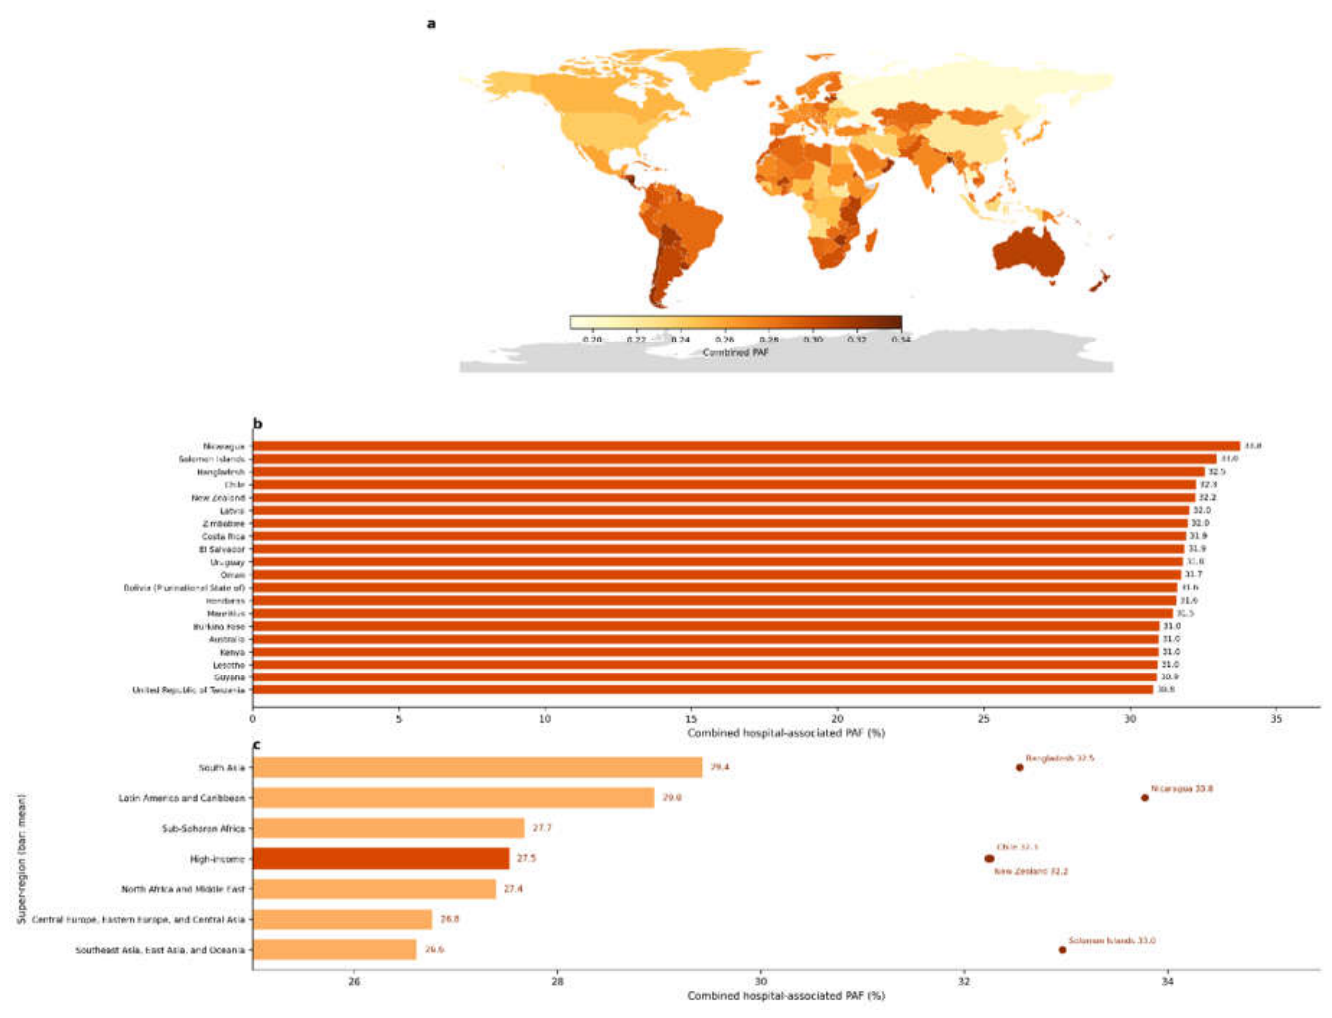
Table 3.
PAF-by-burden priority structure for pneumococcal control, 2023.
| Stratum | Countries | Pneumococcal PAF | Childhood LRI deaths, approx. |
| Priority cells (PAF > 40% and top-20 burden) | Indonesia; Chad; Somalia (borderline) | 41.7%; 44.4%; 40.1% | 14,000; 14,000; 9,000 |
| Volume core (top-3 burden, mid-range PAF) | India; Nigeria; Democratic Republic of the Congo | 36%; 36%; 33% | 143,000; 116,000; 30,000 |
Disclaimer/Publisher’s Note: The statements, opinions and data contained in all publications are solely those of the individual author(s) and contributor(s) and not of MDPI and/or the editor(s). MDPI and/or the editor(s) disclaim responsibility for any injury to people or property resulting from any ideas, methods, instructions or products referred to in the content. |
© 2026 by the authors. Licensee MDPI, Basel, Switzerland. This article is an open access article distributed under the terms and conditions of the Creative Commons Attribution (CC BY) license (http://creativecommons.org/licenses/by/4.0/).
Copyright: This open access article is published under a Creative Commons CC BY 4.0 license, which permit the free download, distribution, and reuse, provided that the author and preprint are cited in any reuse.