

Submitted:
27 October 2026
Posted:
28 October 2026
You are already at the latest version
Abstract
Background Global child pneumonia strategy increasingly asks whether marginal resources should go to completing vaccine programmes or to hospital platform investments. The answer cannot be uniform across countries. We operationalised this question as a country-level priority typology for 204 countries, treating the vaccine policy dimension, coverage with pneumococcal conjugate vaccine (PCV), Haemophilus influenzae type b (Hib) vaccine, and diphtheria-tetanus-pertussis vaccine (DTP), as a first-order input to classification rather than an after-the-fact check. Methods We combined Global Burden of Disease Study 2023 estimates of deaths from 29 pneumonia-relevant pathogens in ages 0–19 years for 204 countries in 2023, each pathogen assigned to a dominant intervention channel (vaccine-reachable, mixed, platform-sensitive) under previously published rules, with WHO/UNICEF Estimates of National Immunization Coverage (WUENIC) for PCV3, Hib3, DTP3 and BCG, and with WHO vaccine-introduction records. An EPI coverage index (mean of PCV3 and Hib3) summarised conjugate-vaccine programme strength. Countries were classified by declared thresholds into low-burden (<500 deaths), vaccine-priority (vaccine-channel share ≥40% and EPI index <80%), platform-priority (platform share ≥50%), or mixed-transitional. Vaccine residual space was computed as vaccine-channel deaths multiplied by the coverage gap. Robustness of the typology was verified by bootstrap resampling of the 204 countries (500 replicates; all four types perfectly stable, mean Jaccard 1.00, because classification is a deterministic per-country rule) and by ±5 percentage-point sensitivity on all three declared thresholds, which reclassified 4–11 countries (2.0–5.4%) per threshold (Supplementary Text S9, Tables S9–S10). Findings In 2023 the 29 pathogens accounted for 964,615 deaths: 45.7% vaccine-reachable, 13.1% mixed and 41.1% platform-sensitive. Thirty-two vaccine-priority countries carried 51.8% of all deaths; within them, 20 urgent-stratum countries (EPI index <60%) carried 209,807 deaths and 12 completion-stage countries (60-80%) carried 289,607. Ten vaccine-priority countries, including China, had not introduced PCV nationally, representing introduction space rather than within-programme coverage gaps. Forty-seven countries with DTP3 coverage below 80% carried 62.6% of global pertussis deaths. Eighteen platform-priority countries carried 7.8% of deaths; the same two pathogens (Klebsiella pneumoniae, Pseudomonas aeruginosa) led the platform channel across high-burden settings. Across the 2019-2023 pandemic window, the largest single-country share movements pushed platform shares down as COVID-19 entered the vaccine channel, but across the full set of 82 countries with at least 500 deaths the platform share rose in 61 countries and fell in 21 (median +1.8 percentage points), with the largest increases in South Africa (+8.1) and Lesotho (+8.0). Conclusions Whether vaccines or platforms come first is an empirical country attribute, not a global verdict. The 204-country typology and accompanying dataset offer a concrete starting point for allocating the next increment of child pneumonia resources.
Keywords:
childhood pneumonia
; vaccine coverage
; hospital platforms
; intervention priorities
; Global Burden of Disease
; child pneumonia
; immunization coverage
; pneumococcal conjugate vaccine
; oxygen systems
; priority setting
Introduction
The childhood pneumonia field is living through the second half of the vaccine era. Vaccines against Haemophilus influenzae type b (Hib) and Streptococcus pneumoniae removed a large share of the historical burden, and Global Burden of Disease Study 2023 (GBD 2023) estimates show what that success leaves behind: a mortality spectrum that is diversifying, with residual deaths shifting toward opportunistic and hospital-associated organisms for which no licensed childhood vaccine exists.[1,2] The consequence is a sequencing problem: as single-pathogen tools address shrinking slices of the total, marginal resources should migrate toward platform investments, the oxygen systems, antimicrobial access, infection prevention and control, and referral capacity that act across pathogens on the shared severe-disease pathway. Scott and English anticipated this transition in 2008, warning that successful conjugate vaccination would diversify the causes of childhood pneumonia and strain diagnostic and management systems built around two dominant organisms.[3] The integrated Global Action Plan for Pneumonia and Diarrhoea and the Every Breath Counts coalition have since codified a protect-prevent-treat package in which oxygen, antimicrobial access and referral care stand beside immunization.[4,5]
That framing, however, is global. A ministry of health does not face the global average; it faces its own pathogen mix, its own coverage history and its own hospital capacity. In a country where pneumococcus still accounts for the largest slice of deaths and conjugate-vaccine coverage is 60%, the marginal dollar probably belongs to the vaccine programme. In a country where conjugate coverage is 90% and the dominant residual pathogens are Klebsiella pneumoniae and Pseudomonas aeruginosa, it probably belongs to oxygen systems, infection prevention and control, and antimicrobial access. The strategic question "vaccine completion or hospital platforms first?" therefore has no single global answer. It has 204 national answers, and those answers can be measured.
The need for country-level resolution is practical rather than rhetorical. Allocation decisions are taken country by country: Gavi co-financing and new-vaccine support are negotiated per country, oxygen and hospital investments are budgeted per facility network, and bilateral programmes select priority geographies from ranked lists. Yet the quantitative versions of the vaccine-versus-platform comparison have so far stopped at the global or super-region level, where aggregation conceals exactly the variation that matters. Two countries can sit in the same super-region, carry similar total burdens, and still require opposite sequencing because one has an unfinished conjugate-vaccine programme and the other has already compressed its vaccine-preventable burden. A global or regional average cannot see this; a country typology can.
Three features of the current moment make the country-level version of the question tractable and timely. First, the vaccine policy layer is now measurable in a harmonised way: WHO/UNICEF Estimates of National Immunization Coverage (WUENIC) provide country-consistent series for PCV, Hib, DTP and BCG coverage,[6] and GBD 2023 provides pathogen-attributable deaths for the same countries and years.[1,2] The two sources share a country-year grid, so coverage status and pathogen burden can be combined without ecological stitching across incompatible datasets. Second, the tail of vaccine introduction is now well described: as of 2023, on the introduction record used throughout this paper, roughly 35 countries had not introduced PCV into national schedules, and barrier archetypes for these last-mile countries have been published.[7] Third, in some large countries the constraint is not delivery within a programme but the absence of the antigen from the national schedule altogether; in China, PCV and Hib vaccines are licensed and sold in the private market but are not publicly provided, so their measured programme coverage is zero by construction.[8] Treating such settings as ordinary coverage gaps would misstate the policy lever. A useful typology must therefore respect a distinction that coverage series alone do not encode: the difference between a vaccine that is in the schedule but under-delivered and a vaccine that is not in the schedule at all. It must also respect the fact that coverage is not the only vaccine-side variable; DTP3, the conventional marker of routine-programme reach, matters doubly here because pertussis is itself among the largest vaccine-channel pathogens.
This paper makes the vaccine policy dimension a first-order input to country classification, not a post hoc check. We ask three questions. (i) How do child pneumonia deaths in each of 204 countries distribute across intervention channels (vaccine-reachable, mixed, platform-sensitive), and what four-type priority typology results when coverage and introduction status are built into the classification rule? (ii) Within the vaccine-priority group, which countries face urgent completion tasks, which face completion-stage tasks, and which face introduction decisions rather than coverage gaps? (iii) Within the platform-priority group, how large and how pathogen-stable is the platform-addressable burden, and how did channel shares shift across the 2019-2023 pandemic window? The deliverable is a citable 204-country priority list intended for direct use in allocation discussions.
Methods
Data Sources
The mortality backbone is a country panel of GBD 2023 deaths from 29 pathogens in ages 0–19 years for 204 countries and territories at five time points (1990, 2010, 2019, 2021, 2023).1,2 The panel combines the 26 GBD lower respiratory infection etiology fractions, applied to country-level LRI mortality, with three supplementary causes handled separately: tuberculosis (mixed channel), pertussis (vaccine-reachable) and COVID-19 (vaccine-reachable; zero before 2021). Panel completeness was verified so that every country-year holds all 29 pathogens, and GBD uncertainty intervals are carried through the panel, although the typology itself uses point estimates. Each country-year is weighted by its 0-19 population for rate calculations.
Pathogen-to-channel classification followed pre-specified pathogen-level rules (Supplementary Table S1), applied without country-level modification. Briefly, a pathogen is vaccine-reachable where a licensed childhood vaccine addresses it directly and coverage is the binding constraint (Streptococcus pneumoniae, Haemophilus influenzae, influenza, pertussis, COVID-19); mixed where prevention and treatment tools share the burden (three pathogens, including tuberculosis); and platform-sensitive where no licensed childhood vaccine exists or is imminent and deaths are compressible mainly through the shared severe-disease pathway of hospital care: oxygen, antimicrobials, infection prevention and control, referral and nutrition (21 pathogens, dominated by opportunistic and hospital-associated bacteria such as Klebsiella pneumoniae, Pseudomonas aeruginosa, Staphylococcus aureus and Acinetobacter baumannii). Classification is pathogen-level and global; we did not re-estimate channel membership within countries, so a country's channel profile reflects its pathogen mix, not country-specific judgements about intervenability.
Vaccine Policy Layer
We drew national coverage estimates from WUENIC (2025 revision) via the WHO Global Health Observatory for four antigens: PCV3 (final-dose pneumococcal conjugate vaccination by the locally recommended age), Hib3, DTP3 and BCG.[6] PCV3 is defined as completion of the locally recommended schedule (second or third dose), so it is comparable across 3+0 and 2+1 programmes; using it as the endpoint therefore sidesteps the 2+1 versus 3+0 schedule differences between national programmes. For each country we used the latest available year up to 2023; 2023 values were available for the large majority of countries. Global 2023 aggregates (PCV3 66%, Hib3 77%, DTP3 84%, BCG 88%) were reproduced as a sanity check against the published series.
WUENIC assigns zero coverage where a vaccine is not in the national programme, so a zero can mean "not introduced" rather than "introduced but unreached". We therefore read zero values jointly with the WHO vaccine-introduction record, which lists countries that had not introduced PCV or Hib as of the 2025 revision,[9] and we report the two situations separately throughout. Introduction timing was read primarily from the WUENIC methodological notes, with the IVAC VIEW-hub database used as a supplementary source for introduction dates and status.[10] China is the prominent case: PCV3 and Hib3 are zero because neither antigen is in the national schedule, although DTP3 coverage is 96% and BCG 99%; its residual-deaths figures should be read as addressable by introduction rather than by delivery strengthening.[8] Coverage was unavailable for nine non-WHO-member territories (Taiwan, Guam, Puerto Rico, American Samoa, Northern Mariana Islands, Greenland, US Virgin Islands, Bermuda, Tokelau); all fall below the low-burden deaths threshold, so the typology is unaffected. BCG was retained as a descriptor of birth-dose platform delivery rather than a classification input, given its contested pathogen-specific interpretation. Whole-cell versus acellular pertussis vaccine type is not observable in these data and is handled as a discussion item only. We additionally attached each country's 2023 Gavi eligibility and transition status, taken from Gavi's published eligibility-by-country series, as a gavi_status column in the dataset (eligible, transition, graduated, not-eligible, or na for non-WHO territories), so that vaccine-financing instruments can be mapped directly onto the typology.[11]
We summarised conjugate-vaccine programme strength as an EPI coverage index, defined as the mean of PCV3 and Hib3 coverage. The index deliberately excludes DTP3, which we analyse separately because pertussis is itself a leading vaccine-channel pathogen and DTP3 additionally serves as the standard marker of routine-programme reach; it also excludes influenza and COVID-19 vaccines, for which no comparable childhood series exists. We considered a three-antigen index including DTP3; because PCV3 is almost always the binding constraint among the three, the two-antigen version classifies nearly identically while keeping the pertussis analysis clean. DTP3 coverage serves here as the indicator of routine-programme weakness; the Immunization Agenda 2030 zero-dose indicator, the number of children who have not received a first DTP-containing dose, is a complementary equity-focused alternative.[12]
Priority Typology
Countries were classified by declared thresholds, applied in order: (1) low-burden, total 0-19 deaths in 2023 below 500; (2) vaccine-priority, vaccine-reachable share of deaths at least 40% and EPI coverage index below 80%; (3) platform-priority, platform-sensitive share at least 50%; (4) mixed-transitional, all remaining countries. The thresholds encode conservative readings of dominance: 40% and 50% are simple majority-adjacent shares for the two main channels, 80% coverage approximates the level at which conjugate-vaccine programmes are usually described as established, and 500 deaths separates countries where pneumonia remains a leading child-killer from those where it is rare. The order of application matters: a high-burden country cannot be labelled low-burden, and a country qualifying as both vaccine- and platform-priority is assigned to the vaccine channel on the argument that unfinished vaccine business is generally cheaper to complete than platform construction. Thresholds were fixed before examining the resulting country assignments and are reported so that alternative calibrations can be tested against the published dataset.
Derived Metrics
Vaccine residual space was computed as vaccine-reachable deaths multiplied by (1 - EPI coverage index/100), an upper-bound measure of vaccine-channel deaths that remain addressable by closing the conjugate-vaccine coverage gap; for countries that have not introduced an antigen, residual space is read as addressable by introduction. The measure is static: it applies a coverage gap to current deaths without modelling transmission dynamics, herd effects or serotype replacement, and so should be read as a sizing of the task rather than a prediction of avertable deaths. Within the vaccine-priority group we prespecified two strata: urgent (EPI index below 60%) and completion-stage (60-80%). Pandemic-window change was measured as the shift in channel shares from 2019 to 2023, summarised by total variation distance (half the sum of absolute share changes across the three channels) and reported for the policy-relevant set of countries with at least 500 deaths in 2023, because in low-mortality countries a handful of COVID-19 deaths mechanically dominates share changes. Reporting follows GATHER guidance.[13]
Limitations Declared in Advance
The typology uses point estimates; countries near thresholds could shift class under uncertainty intervals. The EPI index proxies conjugate-vaccine programme strength and does not capture all antigens. GBD etiology fractions are modelled, and 2019-2023 share changes partly reflect pandemic-era redistribution methods.
Results
Global Channel Composition and the Four-Type Typology
The 29 pathogens accounted for 964,615 deaths at ages 0–19 years in 2023: 441,052 (45.7%) vaccine-reachable, 126,835 (13.1%) mixed and 396,727 (41.1%) platform-sensitive. The median country-level platform-sensitive share was 45.4% (Figure 1a). Applying the declared thresholds (Table 1, Figure 1b), 32 countries classified as vaccine-priority carried 499,414 deaths (51.8% of the global total); 32 mixed-transitional countries carried 379,656 (39.4%); 18 platform-priority countries carried 75,126 (7.8%); and 122 low-burden countries carried 10,419 (1.1%). The typology boundaries are not knife-edges: 5 countries sit within ±10% of the 500-death low-burden line, 32 within ±5 percentage points of the 40% vaccine-channel threshold, 24 within ±5 points of the 50% platform threshold, 15 within ±5 points of the 80% EPI line, and 7 vaccine-priority countries within ±5 points of the 60% urgency stratum, so borderline reclassifications are possible with small input changes.
The vaccine-priority set is headed by Nigeria (146,745 deaths), the Democratic Republic of the Congo (DRC; 45,902), Ethiopia (33,707), Indonesia (31,764) and Chad (19,331), and further includes Madagascar, Angola, Somalia, Mozambique, Côte d'Ivoire, Afghanistan, Cameroon, Myanmar, Mali, China, Egypt, Guinea, South Sudan, the Central African Republic, Haiti, Yemen, Papua New Guinea, Sudan, Viet Nam, Lao PDR, Iraq, Tajikistan, Bolivia, Congo, Iran, the Democratic People's Republic of Korea and Thailand. The platform-priority set comprises Bangladesh, Uzbekistan, Kenya, Burkina Faso, Brazil, Rwanda, Mexico, Guatemala, Azerbaijan, Ecuador, Morocco, Venezuela, Kazakhstan, Turkmenistan, Colombia, Saudi Arabia, Kyrgyzstan and Argentina, a mix of high-burden African countries and middle-burden middle-income countries. India (166,438 deaths) and Pakistan (50,820), the first- and third-largest contributors to the global total, both sit in the mixed-transitional band: in each, both the vaccine channel and the platform channel carry more than 20,000 deaths, so neither sequencing rule dominates. The 122 low-burden countries are mostly high-income states and small island territories, together carrying about 1% of deaths. The geographic concentration behind these counts is extreme: the 32 vaccine-priority countries span sub-Saharan Africa, South and Southeast Asia and a small number of middle-income states elsewhere, and the ten largest national burdens (India, Nigeria, Pakistan, DRC, Ethiopia, Niger, Indonesia, Chad, Madagascar and Angola) account for well over half of the global total.
The Vaccine-Priority Group Stratified by Programme Status
Splitting the 32 vaccine-priority countries on the EPI coverage index (Table 2) separates two different policy situations. Twenty urgent-stratum countries (index below 60%) carried 209,807 deaths with a combined residual space of 60,990 deaths; their median PCV3 coverage was 7% against median Hib3 of 66% and DTP3 of 68%, a pattern dominated by missing or recent PCV introduction rather than uniformly weak delivery. Indonesia illustrates the recency of the transition: it completed nationwide PCV introduction only in 2022,[14] and PCV3 coverage stood at 31% in 2023 against Hib3 of 83%, so its urgent classification reflects a programme still in roll-out, with COVID-19 (9,645 deaths) its largest single vaccine-channel pathogen in 2023. Twelve completion-stage countries (index 60-80%), including Nigeria, Ethiopia, Madagascar, Afghanistan, Mozambique, Côte d'Ivoire, Cameroon, Myanmar, Mali, Lao PDR, Bolivia and Congo, carried 289,607 deaths with a residual space of 46,102; here medians for PCV3 (67.5%), Hib3 (71.5%) and DTP3 (71.5%) move together, indicating functioning programmes with unfinished last-mile delivery. Nigeria dominates this stratum numerically, contributing 26,273 residual deaths, more than the other eleven combined.
Ten of the 32 vaccine-priority countries had not introduced PCV nationally as of 2023: Chad, Somalia, China, Guinea, Egypt, South Sudan, Viet Nam, Thailand, Iran and the Democratic People's Republic of Korea.[9,10] Together they carried 83,802 deaths, of which 43,920 were vaccine-channel, and a residual space of 30,670. Their median DTP3 coverage of 82.5% shows that most operate capable delivery systems; the binding constraint is the introduction decision. The group is heterogeneous: Chad, Somalia, Guinea and South Sudan combine non-introduction with weak routine delivery (DTP3 60-73%), whereas Egypt, Thailand, Iran and Viet Nam report DTP3 of 65-99% and face a narrower scheduling question. China is the extreme case: EPI index 0 with DTP3 at 96% and BCG at 99%, and a residual space of 7,234 deaths that is entirely introduction space, since PCV and Hib vaccines are available only outside the national programme; the estimate does not net out the partial private-market uptake of these vaccines that already occurs in China, so it overstates the introduction-addressable space there to a degree we cannot quantify.[8] China was also the only country in the panel without national Hib introduction.
DTP3 coverage completes the picture for pertussis. Forty-seven countries had DTP3 coverage below 80%; they carried 70,588 pertussis deaths, 62.6% of the global total of 112,839, and 24 of the 32 vaccine-priority countries are among them. The largest national pertussis burdens, Nigeria (18,968 deaths, DTP3 63%), DRC (7,312, 60%), Ethiopia (6,722, 75%), Angola (5,019, 60%) and Somalia (4,639, 69%), sit squarely in the incomplete-coverage zone. By contrast, the two largest pertussis burdens outside the vaccine-priority group, India (11,238 deaths, DTP3 91%) and Pakistan (6,664, 86%), occur in countries where coverage is already high, pointing to drivers that a coverage metric does not capture.
Platform-Priority Countries and Pathogen Stability
Platform-sensitive deaths were concentrated in a short country list (Table 3, Figure 1c–d): India (78,284), Nigeria (60,085), Pakistan (22,141), DRC (15,439), Niger (14,438), Ethiopia (12,162), Bangladesh (10,077), Madagascar (7,901), Tanzania (7,840), Indonesia (6,721), Uzbekistan (6,598), Chad (6,494), Côte d'Ivoire (6,192), Cameroon (6,164) and Afghanistan (5,771). These fifteen countries account for about two-thirds of the 396,727 platform-sensitive deaths worldwide. The list and the typology are related but not identical: India, Nigeria, Pakistan and most of the Sahelian countries on the list are vaccine-priority or mixed-transitional overall, because their vaccine channels are also large; the 18 platform-priority countries are those where the platform share crosses 50%, headed in share terms by Colombia (62.3%) and Kazakhstan (60.2%). The platform-priority countries themselves had strong vaccine programmes (median EPI index 90.5%, median DTP3 89%), consistent with a channel structure in which vaccine-preventable deaths have already been compressed and the remaining burden has shifted toward the hospital pathway.
Pathogen composition was strikingly stable across the high-burden list. Klebsiella pneumoniae and Pseudomonas aeruginosa occupied the top two platform positions in all 15 countries, and K. pneumoniae ranked first in all fifteen. The third position varied in a limited way: Escherichia coli in six countries, non-tuberculous mycobacteria in five (concentrated in eastern and central Africa) and Staphylococcus aureus in four. No other pathogen approached this trio in any of the fifteen.
Vaccine Residual Space
The largest absolute vaccine residual spaces (Table 4, Figure 1c–d) were Nigeria (26,273 deaths, EPI index 62.5%), India (9,692, 87%), Indonesia (8,959, 57%), DRC (8,842, 59.5%), China (7,234, 0%), Chad (6,458, 33.5%), Somalia (6,027, 34.5%), Angola (4,370, 59%), Ethiopia (4,194, 75%), Guinea (3,756, 30%), Pakistan (2,862, 86%), Afghanistan (2,801, 61.5%), Madagascar (2,799, 64.5%), South Sudan (2,600, 36.5%) and Egypt (2,487, 48%). S. pneumoniae was the leading residual pathogen in 12 of these 15 countries; pertussis led in Somalia and Angola and ranked first or second in most of the remainder, and COVID-19 led only in Indonesia. Nigeria alone accounts for roughly a quarter of the 107,092-death residual space across the 32 vaccine-priority countries; measured against the full 204-country residual space of 132,718 deaths, the five largest residual spaces (Nigeria, India, Indonesia, DRC, China), of which only India sits outside the vaccine-priority group, account for 46% of it. The composition of the list also shows the two meanings of residual space side by side. In India and Pakistan, high coverage (EPI index 87% and 86%) applied to very large surviving vaccine-channel burdens still leaves nearly 10,000 and nearly 3,000 residual deaths respectively, a reminder that even successful programmes leave sizeable unfinished business in populous countries. In China, Chad, Somalia, Guinea, South Sudan and Egypt, by contrast, the residual exists mainly because an antigen is absent from the national schedule.
Pandemic Window, 2019 to 2023
Among countries with at least 500 deaths in 2023 (Table 5, Figure 1e), the largest single-country movements ran against the platform channel: Malaysia lost 25.3 percentage points of platform share (50.6% to 25.2%), the United States 9.9, Indonesia 7.8, China 6.8, the Philippines 5.9, Malawi 5.4, Mozambique 2.6 and Peru 1.5, as COVID-19 entered the vaccine channel and swelled its share. The vaccine-channel gains in these countries (8.7 to 30.9 points) closely mirror the platform losses, confirming that the shift is compositional rather than a change in total mortality patterns. This top-mover subset is not representative of the full set, however. Across all 82 countries in the policy-relevant set, platform-sensitive share rose in 61 countries and fell in 21 (median change +1.8 points), and the combination of a rising platform share with a falling vaccine-channel share appeared in 37 countries, including India (+4.7), Nigeria (+3.6), Pakistan (+4.4), Bangladesh (+5.9) and Kenya (+5.2). South Africa (+8.1 points, from 38.3% to 46.3%) and Lesotho (+8.0, from 38.7% to 46.7%) are therefore not exceptions but the two largest increases in the set, with platform-sensitive pathogens rebounding faster than the vaccine channel recovered. Unrestricted rankings were headed by small-mortality states (Finland, Uruguay, Guam, Mauritius, Norway), where a handful of COVID-19 deaths mechanically swings shares, and are reported only in the supplementary dataset.
Discussion
The Typology Is the Answer
This analysis set out to test whether "vaccines first or platforms first" has a global resolution for child pneumonia. It does not, and the attempt to force one is the mistake the typology corrects. Half of all deaths sit in 32 countries where vaccine-channel pathogens dominate and conjugate-vaccine programmes remain incomplete; fewer than one death in twelve sits in countries where platform-sensitive pathogens clearly dominate; and two-fifths sit in between, in countries that must fund both channels concurrently. Any global statement about sequencing collapses three different national situations into an average that describes none of them. The contribution here is to make that classification explicit, national and reproducible from a published dataset. Coverage-based groupings already used in vaccine advocacy, such as the no-PCV and coverage-tier bands maintained by the Every Breath Counts coalition and the eligibility and transition groups tracked by Gavi, are precedents on the vaccine side; what the typology adds is the burden-channel structure, the platform dimension and a fully recomputable country dataset.[5,11] The 122 low-burden countries, mostly high-income, are not an afterthought in this reading: their presence on the same list is what allows a funder to see, on one page, where pneumonia remains a leading child-killer and where it no longer does.
Actionable Paths in the Vaccine-Priority Group
The stratification of the vaccine-priority group matters because the levers differ. In the 12 completion-stage countries, the task is last-mile delivery of products already in the schedule: reaching missed communities, stabilising supply and recovering pandemic-era coverage losses. These are the settings where incremental coverage gains are cheapest per dose, because the cold chain, workforce and financing lines already exist; Nigeria alone carries more residual space than the other eleven combined, which makes its subnational delivery performance a question of global rather than merely national consequence. The DTP3 cross-tabulation quantifies one such lever directly: 47 countries below 80% DTP3 coverage carry nearly two-thirds of global pertussis deaths, and two of the three largest pertussis burdens (Nigeria and the Democratic Republic of the Congo) sit in this incomplete-coverage zone, so routine-programme strengthening is the measurable intervention, independent of any vaccine-type debate.
In the 20 urgent-stratum countries, the first question is frequently whether the antigen is in the schedule at all. For the ten PCV non-introducers, the residual space of 30,670 deaths is addressable by introduction decisions of the kind mapped in recent last-mile archetype analyses, in which several of these countries (Chad, Guinea, Somalia, South Sudan) were classified as low-barrier and Gavi-eligible, with modelled introductions already shown to be highly cost-effective.[7] China and the other middle-income non-introducers are a distinct situation: delivery infrastructure is strong, the vaccines are licensed and present in the private market, and the outstanding step is inclusion in the publicly funded schedule.[8] We describe this as introduction space rather than a coverage gap, and we offer no assessment of any country's immunization policy; the point is only that the same zero in a coverage series encodes two different policy problems, and conflating them would misdirect both advocacy and financing instruments. Indonesia's presence in the urgent stratum despite recent national PCV introduction adds a third nuance: classification captures a moment in a roll-out, and countries should be expected to graduate between strata as new introductions mature, which argues for refreshing the typology with each WUENIC and GBD cycle rather than treating it as fixed. The non-introducer list is itself already moving: Chad introduced PCV nationally in October 2024, Somalia and South Sudan began national introduction in 2025, and Iran added PCV to its national schedule in 2024,[15,16] so the ten-country list above should be read strictly as a 2023 snapshot.
Pertussis deserves one caveat we cannot resolve empirically. In several high-coverage countries, pertussis persists or resurges despite DTP3 above 90%, and modelling and position-paper evidence implicate the faster-waning immunity of acellular pertussis vaccines relative to whole-cell products.[17,18] Our data contain no vaccine-type variable, so this mechanism enters only as a caution that DTP3 completion, while the dominant measurable lever, may not exhaust the pertussis agenda everywhere.
What Platform-Priority Means Operationally
For the 18 platform-priority countries, and for the platform channel inside mixed-transitional countries such as India and Pakistan, the evidence base for the package is comparatively well anchored. Hypoxaemia is common in childhood pneumonia and strongly associated with death;[19,20] improved oxygen systems reduced pneumonia mortality in a multihospital trial in Papua New Guinea;[21] oxygen-system strengthening is cost-effective in low-resource settings;[22] and WHO technical guidance and the Lancet Global Health Commission on medical oxygen provide implementation templates, with the Commission quantifying an access gap that maps closely onto the platform-priority geographies identified here.[23,24] The package also needs altitude adaptation in highland settings: in countries such as Bolivia and Ethiopia, lower baseline oxygen saturation raises measured hypoxaemia prevalence, and SpO2 thresholds require altitude correction, an adjustment already standard in the hypoxaemia literature and in oxygen-implementation guidance.[19,24] Because the platform channel is dominated by hospital-associated organisms, infection prevention and control and antimicrobial stewardship are the natural complements of oxygen investment, and the antimicrobial resistance burden estimates underline the cost of neglecting them.[25] Referral grading and nutrition complete the package; none of these components is novel, and the typology's contribution is to show in which countries this package addresses the dominant channel rather than a residual one. Delivery logistics also differ within the group: in archipelago countries such as Papua New Guinea, Indonesia and the Philippines, moving oxygen and referral care across islands is a real barrier that mainland delivery templates understate.
The mixed-transitional band deserves separate emphasis, because it contains the largest single-country burdens in the world. India and Pakistan each carry more than 20,000 deaths in both the vaccine and platform channels; for them the typology does not license choosing one channel but quantifies the concurrency, and the practical reading is that vaccine completion and platform construction proceed on parallel tracks with budgets sized to the channel shares reported in the dataset. The same applies, at smaller scale, to most of the Sahelian mixed-transitional countries.
One Platform Package, Many Countries
The striking stability of the platform pathogen mix, the same two organisms leading in every one of the fifteen high-burden countries examined, with only three others (E. coli, non-tuberculous mycobacteria, S. aureus) appearing anywhere in third place, has a practical implication. Empiric treatment protocols, infection-prevention bundles, surveillance case definitions and procurement lists designed around neonatal sepsis and hospital-associated pneumonia pathogens are portable across countries: a package engineered for Bangladesh addresses, to first approximation, the same organisms as one engineered for Nigeria or Uzbekistan. Development and evaluation costs for such packages can therefore be shared internationally rather than duplicated nationally, in much the way that vaccine market-shaping pools demand across countries. The caveat is that portability is an empirical observation about 2023 pathogen rankings, not a biological constant; the African countries where non-tuberculous mycobacteria occupy third place already show that regional variants exist, and local surveillance remains the check on the global template.
Reading the Pandemic Window
The 2019-2023 window moved shares in both directions, and the direction depended on where a country started. The largest single-country movements ran toward the vaccine channel because COVID-19 entered that channel; the fall in platform share in Malaysia, the United States, Indonesia and China is an accounting fact about a new vaccine-reachable pathogen, not evidence that platforms matter less. Across the full policy-relevant set, however, platform share rose in more countries than it fell (61 of 82, median +1.8 points), and in 37 countries a rising platform share coincided with a falling vaccine-channel share, a pattern consistent with disruption of routine services and rebound of hospital-associated and opportunistic pathogens outpacing vaccine-channel recovery. South Africa and Lesotho, where platform share rose by about eight points, are the extreme of this common pattern rather than anomalies. Whether the rebound pattern persists beyond 2023 is a surveillance question, but it is the kind of signal a country-level typology is built to catch: countries whose platform share keeps climbing, the two southern African countries most prominently, can be flagged as reclassification candidates in a future refresh.
Limitations
Five limitations qualify these findings. First, classification uses point estimates; countries near the declared thresholds could shift class under GBD uncertainty intervals, and the thresholds themselves, though declared in advance, are one calibration among reasonable alternatives. We mitigated this by publishing the full country dataset so that any alternative calibration can be recomputed directly. Second, the EPI coverage index proxies conjugate-vaccine programme strength with two antigens; it does not capture DTP, influenza or COVID-19 delivery, and for China it records absence from the national schedule rather than delivery failure. The residual-space metric is additionally static, applying a coverage gap to current deaths without herd effects or serotype dynamics, and should be read as sizing rather than prediction. Third, the channel classification is pathogen-level and global, so within-country heterogeneity in intervenability, for example variation in BCG protection against tuberculosis or in vaccine serotype coverage, is not re-estimated. Fourth, the wP/aP pertussis distinction is discussed but not testable in these data. Fifth, GBD etiology fractions are modelled, and pandemic-window share changes partly reflect redistribution methods for 2020-2021, so the 2019-2023 comparisons should be read as approximate. (quantifying the threshold sensitivity, under single-threshold ±5pp perturbations the vaccine-priority group ranges from 27 to 37 countries (Supplementary Table S10); under joint ±5pp perturbation of all three thresholds, 19 (9.3%)/17 (8.3%) of 204 countries change assignment.)
Conclusions
Whether a country should complete its vaccine programmes or invest first in hospital platforms is not a matter of global doctrine; it is a measurable national attribute. In 2023, 32 vaccine-priority countries carried 51.8% of child pneumonia deaths from 29 pathogens, and within them an urgent stratum of 20 countries, including ten that have not introduced PCV nationally, faces introduction and completion tasks that existing vaccine instruments can address. Eighteen platform-priority countries, with high vaccine coverage and a residual burden dominated by a stable pair of hospital-associated pathogens, face a different agenda centred on oxygen systems, infection prevention and control, and antimicrobial access. Thirty-two mixed-transitional countries, among them the two largest national burdens in the world, must fund both channels at once, and the dataset says in what proportions.
Three uses follow directly. Funders can read the typology as a first-pass allocation map for the next increment of child pneumonia resources; the dataset carries each country's Gavi eligibility and transition status beside its priority type, so vaccine-financing eligibility can be read off the same table. Countries can locate themselves and their near peers, and can see which lever, introduction, completion or platform, their own numbers point to. And the classification can be refreshed mechanically with each new WUENIC and GBD cycle, so that graduations between strata become a measurable form of progress. None of this requires new science; it requires applying what is already known to the places where the burden actually sits, in the order each country's own numbers dictate. The 204-country priority list accompanying this paper turns a recurring strategic argument into a set of concrete, country-specific starting points.
Supplementary Materials
The following supporting information can be downloaded at the website of this paper posted on Preprints.org.
Author Contributions
Chen Shen had full access to all of the data in the study and takes responsibility for the integrity of the data and the accuracy of the data analysis. Concept and design: SC. Acquisition, analysis and interpretation of data: all authors. Drafting of the manuscript: SC. Critical revision for important intellectual content: all authors. All authors approved the final version.
Funding
This work was supported by the Beijing Science and Technology Nova Program Interdisciplinary Project (20230484439) and the Beijing High-Level Public Health Technical Talents Project (2023-02-33). The funder had no role in study design, data analysis, interpretation, or the decision to submit the manuscript for publication
Institutional Review Board Statement
Secondary analysis of publicly available, aggregate, modelled estimates; no ethics review required.
Informed Consent Statement
Patients and the public were not involved in this secondary analysis of published modelled estimates.
Data Availability Statement
All input estimates are publicly available from the GBD 2023 Results Tool (https://vizhub.healthdata.org/gbd-results/) and from WHO/UNICEF Estimates of National Immunization Coverage via the WHO Global Health Observatory (https://data.who.int; indicators PCV3, WHS4_129, WHS4_100, WHS4_543). The 204-country priority list with channel deaths, shares, coverage (PCV3, Hib3, DTP3, BCG), 2019 channel shares, Gavi eligibility status, residual space and typology assignments is provided as a supplementary dataset (03_Dataset.csv).
Presentation
This work has not been presented previously, in whole or in part, at any conference or scientific meeting.
GATHER Statement
This study adheres to the Guidelines for Accurate and Transparent Health Estimates Reporting (GATHER); the completed checklist accompanies the submission as a separate file.
Use of Artificial Intelligence
AI tools were used for language polishing and code drafting.
Conflicts of Interest
All authors declare no financial or non-financial competing interests and have nothing else to disclose.
References
- GBD 2023 Causes of Death Collaborators. Global burden of 292 causes of death in 204 countries and territories and 660 subnational locations, 1990–2023: a systematic analysis for the Global Burden of Disease Study 2023. Lancet. 2025;406(10513):1811–1872. [CrossRef]
- GBD 2021 Lower Respiratory Infections and Antimicrobial Resistance Collaborators. Global, regional, and national incidence and mortality burden of non-COVID-19 lower respiratory infections and aetiologies, 1990–2021. Lancet Infect Dis. 2024;24(9):974–1002. [CrossRef]
- Scott JAG, English M. What are the implications for childhood pneumonia of successfully introducing Hib and pneumococcal vaccines in developing countries? PLoS Med. 2008;5(4):e86. [CrossRef]
- World Health Organization and UNICEF. Ending preventable child deaths from pneumonia and diarrhoea by 2025: the integrated Global Action Plan for Pneumonia and Diarrhoea (GAPPD). Geneva: WHO; 2013.
- Every Breath Counts Coalition. Every Breath Counts [Internet]. Available from: https://stoppneumonia.org (accessed August 2026).
- World Health Organization and UNICEF. WHO/UNICEF Estimates of National Immunization Coverage (WUENIC), 2025 revision. Geneva: WHO; 2026. Available at: https://data.who.int (immunization coverage indicators PCV3, Hib3, DTP3 and BCG).
- Banerjee P, Hagedorn J, Williams SR, et al. Closing the pneumococcal conjugate vaccine (PCV) introduction gap: an archetype analysis of last-mile countries. Glob Health Action. 2023;16(1):2281065. [CrossRef]
- Zhang H, Lai X, Patenaude BN, Jit M, Fang H. Adding new childhood vaccines to China's National Immunization Program: evidence, benefits, and priorities. Lancet Public Health. 2023;8(12):e1016–e1024. [CrossRef]
- World Health Organization. WHO/UNICEF estimates of national immunization coverage: 2025 revision (WUENIC methodological notes, including vaccine introduction status; 2023 values used throughout this paper). Geneva: WHO; 2026. https://cdn.who.int/media/docs/default-source/immunization/immunization-coverage/wuenic_notes.pdf.
- International Vaccine Access Center (IVAC), Johns Hopkins Bloomberg School of Public Health. VIEW-hub: global vaccine introduction and implementation data (introduction status and dates for PCV, Hib and other vaccines) [Internet]. Baltimore: IVAC; 2026. Available from: https://view-hub.org (accessed August 2026).
- Gavi, the Vaccine Alliance. Gavi eligibility by country (eligibility group by country and year, 2008-2026) [Internet]. Geneva: Gavi; 2026. Available from: https://www.gavi.org/sites/default/files/programmes-impact/Gavi-eligibility-by-country.pdf (accessed August 2026; 2023 values used throughout this paper).
- World Health Organization. Immunization Agenda 2030 impact goal indicator 2.1: number of zero-dose children (children who did not receive their first dose of DTP). Indicator Metadata Registry, WHO Global Health Observatory. Geneva: WHO. Available from: https://www.who.int/data/gho/indicator-metadata-registry/imr-details/7792 (accessed August 2026).
- Stevens GA, Alkema L, Black RE, et al.; GATHER Working Group. Guidelines for Accurate and Transparent Health Estimates Reporting: the GATHER statement. Lancet. 2016;388(10062):e19–e23. [CrossRef]
- Athiyaman A, Herliana P, Anartati A, Widyastuti N, Yosephine P, Tandy G, Karolina S. Accelerating pneumococcal conjugate vaccine introductions in Indonesia: key learnings from 2017 to 2022. Infect Dis Poverty. 2023;12:107. [CrossRef]
- Every Breath Counts Coalition. The power of civil society to support new vaccine introductions (Chad introduced PCV and rotavirus vaccine in October 2024; Somalia and South Sudan introduced PCV and rotavirus vaccines beginning April 2025) [Internet]. 2025. Available from: https://stoppneumonia.org/the-power-of-civil-society-to-support-new-vaccine-introductions/ (accessed August 2026).
- UNICEF. UNICEF brings life-saving vaccines to Iran, reaching 1.5 million children (PCV added to Iran's national immunization schedule in 2024) [press release]. 2025. Available from: https://www.unicef.org/iran/en/press-releases/unicef-brings-life-saving-vaccines-iran-reaching-15-million-children (accessed August 2026).
- Domenech de Cellès M, Magpantay FMG, King AA, Rohani P. The impact of past vaccination coverage and immunity on pertussis resurgence. Sci Transl Med. 2018;10(434):eaaj1748. [CrossRef]
- World Health Organization. Pertussis vaccines: WHO position paper, August 2015. Wkly Epidemiol Rec. 2015;90(35):433–460.
- Subhi R, Adamson M, Campbell H, Weber M, Smith K, Duke T. The prevalence of hypoxaemia among ill children in developing countries: a systematic review. Lancet Infect Dis. 2009;9(4):219–227. [CrossRef]
- Rahman AE, Hossain AT, Nair H, et al. Prevalence of hypoxaemia in children with pneumonia in low-income and middle-income countries: a systematic review and meta-analysis. Lancet Glob Health. 2022;10(3):e348–e359. [CrossRef]
- Duke T, Wandi F, Jonathan M, et al. Improved oxygen systems for childhood pneumonia: a multihospital effectiveness study in Papua New Guinea. Lancet. 2008;372(9646):1328–1333. [CrossRef]
- Lam F, Stegmuller A, Chou VB, Graham HR. Oxygen systems strengthening as an intervention to prevent childhood deaths due to pneumonia in low-resource settings: systematic review, meta-analysis and cost-effectiveness. BMJ Glob Health. 2021;6(12):e007468. [CrossRef]
- World Health Organization. Oxygen therapy for children: a manual for health workers. Geneva: WHO; 2016. https://www.who.int/publications/i/item/9789241549554.
- Graham HR, King C, Rahman AE, et al. Reducing global inequities in medical oxygen access: the Lancet Global Health Commission on medical oxygen security. Lancet Glob Health. 2025;13(3):e528–e584. [CrossRef]
- Antimicrobial Resistance Collaborators. Global burden of bacterial antimicrobial resistance in 2019: a systematic analysis. Lancet. 2022;399(10325):629–655. [CrossRef]
Figure 1.
(a) Country-level platform-sensitive share of child pneumonia deaths (29 pathogens, ages 0-19 years), 2023. Choropleth of 204 countries; the median country share is 45.4%. (b) Priority typology map, 2023. Countries coloured by priority type (vaccine-priority, mixed-transitional, platform-priority, low-burden) under the declared thresholds of Table 1. (c–d) High-value cells, 2023. Top 15 countries by platform-sensitive deaths and by vaccine residual space, with EPI coverage index. (e) Pandemic-window dumbbell plot, 2019 to 2023. Channel-share change for the policy-relevant set (>=500 deaths in 2023), ordered by total variation distance.
Figure 1.
(a) Country-level platform-sensitive share of child pneumonia deaths (29 pathogens, ages 0-19 years), 2023. Choropleth of 204 countries; the median country share is 45.4%. (b) Priority typology map, 2023. Countries coloured by priority type (vaccine-priority, mixed-transitional, platform-priority, low-burden) under the declared thresholds of Table 1. (c–d) High-value cells, 2023. Top 15 countries by platform-sensitive deaths and by vaccine residual space, with EPI coverage index. (e) Pandemic-window dumbbell plot, 2019 to 2023. Channel-share change for the policy-relevant set (>=500 deaths in 2023), ordered by total variation distance.
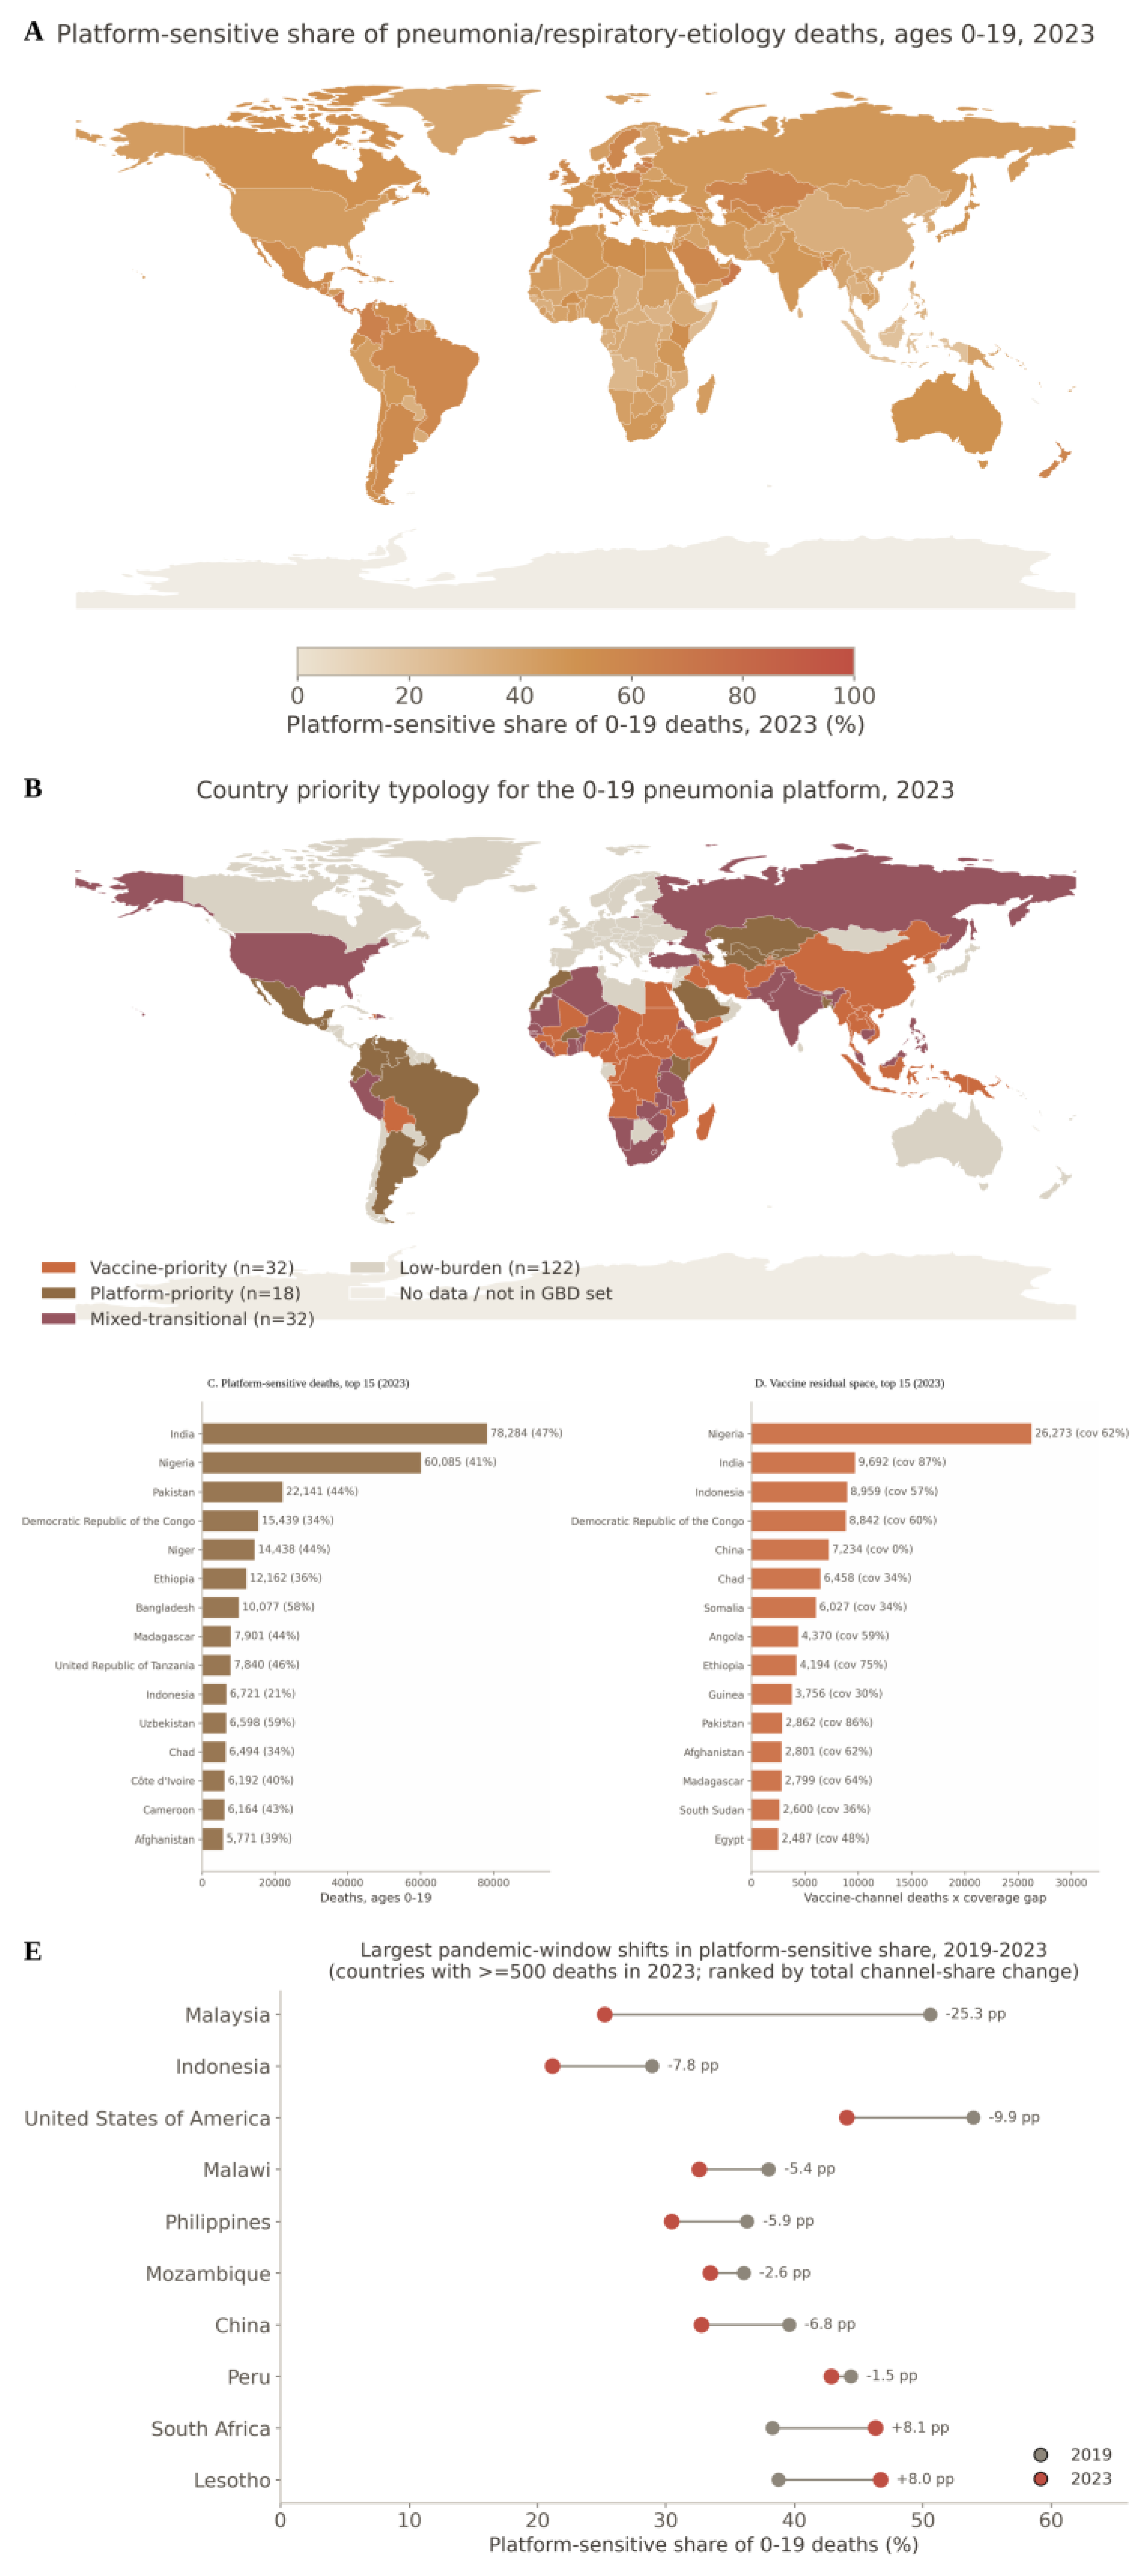

Table 1.
Country priority typology, 204 countries, ages 0–19 years, 2023. Thresholds were declared before classification and applied in the order described in Methods (low-burden, vaccine-priority, platform-priority, mixed-transitional).
Table 1.
Country priority typology, 204 countries, ages 0–19 years, 2023. Thresholds were declared before classification and applied in the order described in Methods (low-burden, vaccine-priority, platform-priority, mixed-transitional).
| Priority type | Defining rule | Countries, n | Deaths 2023 | Share of deaths |
|---|---|---|---|---|
| Vaccine-priority | Vaccine-channel share >=40% and EPI index <80% | 32 | 499,414 | 51.8% |
| Mixed-transitional | Remaining countries | 32 | 379,656 | 39.4% |
| Platform-priority | Platform-channel share >=50% | 18 | 75,126 | 7.8% |
| Low-burden | Total deaths <500 | 122 | 10,419 | 1.1% |
| Total | 204 | 964,615 | 100% |
EPI index: mean of WUENIC PCV3 and Hib3 coverage, latest year <=2023.
Table 2.
Vaccine-priority countries (n=32) stratified by conjugate-vaccine programme status. Coverage values are group medians (%).
Table 2.
Vaccine-priority countries (n=32) stratified by conjugate-vaccine programme status. Coverage values are group medians (%).
| Stratum | Countries, n | Deaths 2023 | Vaccine residual space | Median PCV3 | Median Hib3 | Median DTP3 |
|---|---|---|---|---|---|---|
| Urgent (EPI index <60%) | 20 | 209,807 | 60,990 | 7 | 66 | 68 |
| Completion-stage (EPI index 60-80%) | 12 | 289,607 | 46,102 | 67.5 | 71.5 | 71.5 |
| Subset: PCV not introduced nationally | 10 | 83,802 | 30,670 | 0 | 71 | 82.5 |
Urgent stratum: Angola, Central African Republic, Chad, China, Democratic People's Republic of Korea, Democratic Republic of the Congo, Egypt, Guinea, Haiti, Indonesia, Iran, Iraq, Papua New Guinea, Somalia, South Sudan, Sudan, Tajikistan, Thailand, Viet Nam, Yemen. Completion-stage: Afghanistan, Bolivia, Cameroon, Congo, Côte d'Ivoire, Ethiopia, Lao PDR, Madagascar, Mali, Mozambique, Myanmar, Nigeria. PCV not introduced as of 2023 (WUENIC introduction record, IVAC VIEW-hub): Chad, China, Democratic People's Republic of Korea, Egypt, Guinea, Iran, Somalia, South Sudan, Thailand, Viet Nam; China was also the only country without national Hib introduction.
Table 3.
Top 15 countries by platform-sensitive deaths, 2023.
| Country | Platform deaths | Platform share, % | Top three platform pathogens (deaths) |
|---|---|---|---|
| India | 78,284 | 47.0 | Klebsiella pneumoniae (17,558); Pseudomonas aeruginosa (10,100); Escherichia coli (8,143) |
| Nigeria | 60,085 | 40.9 | K. pneumoniae (13,187); P. aeruginosa (8,083); E. coli (5,347) |
| Pakistan | 22,141 | 43.6 | K. pneumoniae (4,782); P. aeruginosa (3,156); E. coli (2,131) |
| DR Congo | 15,439 | 33.6 | K. pneumoniae (3,443); P. aeruginosa (2,044); non-tuberculous mycobacteria (1,339) |
| Niger | 14,438 | 43.9 | K. pneumoniae (3,343); P. aeruginosa (1,992); E. coli (1,281) |
| Ethiopia | 12,162 | 36.1 | K. pneumoniae (2,523); P. aeruginosa (1,568); non-tuberculous mycobacteria (1,182) |
| Bangladesh | 10,077 | 57.6 | K. pneumoniae (2,042); P. aeruginosa (1,334); E. coli (1,110) |
| Madagascar | 7,901 | 44.0 | K. pneumoniae (1,703); P. aeruginosa (1,004); non-tuberculous mycobacteria (849) |
| Tanzania | 7,840 | 46.4 | K. pneumoniae (1,677); P. aeruginosa (1,064); non-tuberculous mycobacteria (792) |
| Indonesia | 6,721 | 21.2 | K. pneumoniae (1,415); P. aeruginosa (843); Staphylococcus aureus (725) |
| Uzbekistan | 6,598 | 58.6 | K. pneumoniae (1,251); P. aeruginosa (888); S. aureus (784) |
| Chad | 6,494 | 33.6 | K. pneumoniae (1,658); P. aeruginosa (806); non-tuberculous mycobacteria (559) |
| Côte d'Ivoire | 6,192 | 40.5 | K. pneumoniae (1,332); P. aeruginosa (826); S. aureus (585) |
| Cameroon | 6,164 | 42.6 | K. pneumoniae (1,288); P. aeruginosa (848); S. aureus (563) |
| Afghanistan | 5,771 | 39.1 | K. pneumoniae (1,382); P. aeruginosa (785); E. coli (541) |
Table 4.
Top 15 countries by vaccine residual space (vaccine-channel deaths × coverage gap), 2023.
| Country | Vaccine-channel deaths | EPI index, % | Residual space | Leading residual pathogen |
|---|---|---|---|---|
| Nigeria | 70,060 | 62.5 | 26,273 | Streptococcus pneumoniae |
| India | 74,556 | 87.0 | 9,692 | S. pneumoniae |
| Indonesia | 20,834 | 57.0 | 8,959 | COVID-19 |
| DR Congo | 21,831 | 59.5 | 8,842 | S. pneumoniae |
| China | 7,234 | 0.0 | 7,234 | S. pneumoniae |
| Chad | 9,712 | 33.5 | 6,458 | S. pneumoniae |
| Somalia | 9,202 | 34.5 | 6,027 | Pertussis |
| Angola | 10,660 | 59.0 | 4,370 | Pertussis |
| Ethiopia | 16,776 | 75.0 | 4,194 | S. pneumoniae |
| Guinea | 5,365 | 30.0 | 3,756 | S. pneumoniae |
| Pakistan | 20,440 | 86.0 | 2,862 | S. pneumoniae |
| Afghanistan | 7,276 | 61.5 | 2,801 | S. pneumoniae |
| Madagascar | 7,883 | 64.5 | 2,799 | S. pneumoniae |
| South Sudan | 4,095 | 36.5 | 2,600 | S. pneumoniae |
| Egypt | 4,783 | 48.0 | 2,487 | S. pneumoniae |
For China and other countries without national PCV or Hib introduction, residual space represents deaths addressable by vaccine introduction rather than by closing a within-programme coverage gap.
Table 5.
Pandemic-window change in channel shares, 2019 to 2023, countries with ≥500 deaths in 2023, ranked by total variation distance.
Table 5.
Pandemic-window change in channel shares, 2019 to 2023, countries with ≥500 deaths in 2023, ranked by total variation distance.
| Country | Platform share 2019, % | Platform share 2023, % | Change, pp | Vaccine-channel change, pp |
|---|---|---|---|---|
| Malaysia | 50.6 | 25.2 | -25.3 | +30.9 |
| Indonesia | 28.9 | 21.2 | -7.8 | +15.6 |
| United States | 53.9 | 44.1 | -9.9 | +14.3 |
| Malawi | 38.0 | 32.6 | -5.4 | +13.6 |
| Philippines | 36.3 | 30.5 | -5.9 | +12.4 |
| Mozambique | 36.1 | 33.5 | -2.6 | +11.5 |
| China | 39.6 | 32.8 | -6.8 | +10.6 |
| Peru | 44.4 | 42.9 | -1.5 | +8.7 |
| South Africa | 38.3 | 46.3 | +8.1 | -2.6 |
| Lesotho | 38.7 | 46.7 | +8.0 | -3.4 |
pp, percentage points. Change columns are computed from unrounded shares, so they can differ by 0.1 pp from the difference of the rounded endpoint values shown.
Disclaimer/Publisher’s Note: The statements, opinions and data contained in all publications are solely those of the individual author(s) and contributor(s) and not of MDPI and/or the editor(s). MDPI and/or the editor(s) disclaim responsibility for any injury to people or property resulting from any ideas, methods, instructions or products referred to in the content. |
© 2026 by the authors. Licensee MDPI, Basel, Switzerland. This article is an open access article distributed under the terms and conditions of the Creative Commons Attribution (CC BY) license.
Copyright: This open access article is published under a Creative Commons CC BY 4.0 license, which permit the free download, distribution, and reuse, provided that the author and preprint are cited in any reuse.